Review

Stratospheric Polar Vortex as an Important Link between the Lower Atmosphere Circulation and Solar Activity

by
Svetlana Veretenenko
Ioffe Institute, 194021 St. Petersburg, Russia
Atmosphere 2022, 13(7), 1132; https://doi.org/10.3390/atmos13071132
Submission received: 8 June 2022 / Revised: 7 July 2022 / Accepted: 11 July 2022 / Published: 18 July 2022
(This article belongs to the Special Issue Solar Activity Influence on Atmospheric Dynamics)

Abstract

:
The stratospheric polar vortex is a large-scale cyclonic circulation that forms in a cold air mass in the polar region and extends from the middle troposphere to the stratosphere. The polar vortex is implicated in a variety of atmospheric processes, such as the formation of ozone holes, the North Atlantic and the Arctic Oscillations, variations in extratropical cyclone tracks, etc. The results presented in this work show that the vortex plays an important part in the mechanism of solar activity influence on lower atmosphere circulation, with variations in the vortex intensity being responsible for temporal variability in the correlation links observed between atmospheric characteristics and solar activity phenomena. In turn, the location of the vortex is favorable for the influence of ionization changes associated with charged particle fluxes (cosmic rays, auroral and radiation belt electrons) that affect the chemical composition and temperature regime of the polar atmosphere as well as its electric properties and cloudiness state. In this work, recent results concerning solar activity effects on the state of the stratospheric polar vortex as well as its role in solar–atmospheric links are discussed.

1. Introduction

Although a great deal of evidence concerning the reality of solar–climatic links has been obtained in recent decades, the physical mechanisms of solar activity influence on the circulation in the lower atmosphere remain not quite understood, which is due to several reasons. The first problem is that there are a number of factors associated with solar activity that can affect the atmosphere, such as total solar irradiance (TSI), ultraviolet radiation and X-rays, disturbances in solar wind and interplanetary magnetic fields, solar (SCR) and galactic (GCR) cosmic rays, and precipitations of auroral electrons and electrons from the radiation belts. These factors differ in the amount of energy transferred into the Earth’s atmosphere as well as in the mechanism of their impact on atmospheric processes. Often, they affect the atmosphere simultaneously, so it is rather difficult to identify the contribution of each factor in the overall atmospheric response.
Another serious problem with solar–atmospheric links is pronounced spatial and temporal variability. The atmospheric response (changes in pressure, temperature, cloud cover, etc.) to solar activity-related phenomena may differ noticeably depending on the region under study. Moreover, the correlation links observed between atmospheric characteristics and solar activity factors reveal temporal variability, i.e., they may strengthen, weaken, disappear, and even change the sign depending on a time period. As a result, the observed temporal variability in the correlation links often provides the basis for doubts in the reality of solar activity influence on the atmosphere.
The above assumes that understanding the reasons for the temporal variability of solar–atmospheric links is of great importance to clarify the physical mechanism of solar activity influence on lower atmosphere circulation, weather and climate. In this work, a possible role of the stratospheric polar vortex as a link between lower atmosphere circulation and solar activity is discussed.

2. Polar Vortex as a Possible Reason for Temporal Variability of Solar–Atmospheric Links

2.1. Polar Vortex and Its Role in Atmospheric Processes

The stratospheric polar vortex is a large-scale cyclonic circulation that forms in the cold air mass over the Polar region during cold half of the year and that extends from the middle troposphere to the stratosphere. Vortex formation is due to the cooling of the air mass over an icy surface under the conditions of negative net radiation balance. The cooling and subsidence of the air results in a pressure increase near the Earth’s surface (formation of a near-surface anticyclone). Due to high density of cold air, a lowering of isobaric levels takes place, so simultaneously with an increase in surface pressure, a low-pressure area is formed at the 500 hPa level and above (e.g., [1]) A circular eastward motion of air arises, which isolates the polar air from the warmer air of mid-latitudes, contributing to a temperature decrease inside the vortex.
Figure 1a presents the distribution of the mean monthly velocity of zonal winds, with the positive direction being from west to east, at the stratospheric level of 20 hPa (~27 km) in January 2005 (the Northern Hemisphere) according to NCEP-DOE (National Centers for Environmental Prediction—Department of Energy) reanalysis-2 data [2]. The vortex is seen as a belt of strong western winds at latitudes ~50–80° N. In Figure 2b, zonally averaged (averaged over latitude circles) values of zonal wind velocity are presented for different altitudes. The data show the strengthening of stratospheric winds with altitude in the Northern (winter) Hemisphere, with the wind velocity reaching ~50–60 m·s−1 at the upper levels. The distributions of the mean monthly values of the temperature and the magnitude of the horizontal temperature gradients at the level 20 hPa are presented in Figure 2 for January 2005 and use NCEP/NCAR (National Centers for Environmental Prediction/National Center for Atmospheric Research) reanalysis data [3]. One can see temperature lowering inside the polar vortex, with temperature gradients being enhanced at its edges.
The polar vortex is known to be an important element in the large-scale circulation of the atmosphere, which plays an important part in a number of atmospheric processes. In particular, air cooling inside the vortex to very low temperatures (−80 °C and below) creates conditions for the formation of Polar Stratospheric Clouds. Heterogeneous chemical reactions on the surfaces of cloud particles result in the production of chlorine, which participates in a catalytic cycle of ozone destruction contributing to the formation of ozone holes in Antarctica [4]. The location and state of the vortex affect the development of large-scale dynamic processes in the troposphere, for example, the North Atlantic Oscillation (NAO) and Arctic Oscillation (AO). Baldwin and Dunkerton [5] showed that under strong vortex regimes, the NAO and AO indices tend to be positive and that the tracks of extratropical cyclones shift to the north. Gudkovich and colleagues [6] linked the alternations of cold and warm epochs in the Arctic with changes in the vortex state, warm and cold epochs being associated with strong and weak vortex regimes, respectively. Labitzke [7] was the first to reveal that the effects of solar activity on the characteristics of the stratosphere and troposphere depend on the phase of the quasi-biennial oscillations (QBO) in the atmosphere, which is determined by the wind direction in the equatorial stratosphere. As the polar vortex tends to be stronger during the west phase of the QBO [8], the findings by Labitzke suggest that the polar vortex strength may also influence the atmosphere response to solar variability.

2.2. Temporal Variability of Solar Activity Effects on the Lower Atmosphere Characteristics: Previous Data

Temporal variability in the correlation links between the lower atmosphere characteristics and solar activity phenomena is a fairly common phenomenon. This variability was first detected by W. Köppen [9] when studying links between air temperatures in the Northern Hemisphere and solar activity. He found 11-year variations in the studied temperatures that correlated with Wolf numbers; however, the correlation sign was not constant, being positive from 1777 to 1790 and negative from 1815 to 1854. A review of the correlation changes in the atmospheric parameters (pressure, temperature, rainfall, extratropical storm tracks, etc.) with 11-year and 22-year solar activity cycles was carried out in the monograph by Herman and Goldberg (see [10] and references therein). In particular, they noted that temperatures in the tropics were negatively correlated with Wolf numbers before ~1920 and positively correlated with them in ~1920–1950. The level of Lake Victoria, which depends on rainfall intensity, revealed a high positive correlation with sunspot numbers from 1880 to 1920; however, the correlation was violated near 1930, and after 1950, it became negative. The 22-year oscillations observed in the longitude of the Icelandic Low (more frequent displacement to the east in even 11-year cycles compared to odd ones) temporarily disappeared in 1923–1943. Herman and Goldberg suggested that a possible reason for the instability of solar–atmospheric links may be secular changes in some conditions on the Sun that do not influence sunspot numbers. Moreover, the correlation changes may be caused by other meteorological parameters, whose role in the studied processes varies depending on a time interval.
An analysis of the data from 300 meteorological stations around the world by Sánchez Santillán and colleagues [11] showed that the signs of correlations between meteorological variables (barometric pressure, air temperature, and precipitation) and sunspot numbers were reversed in the 1920s at nearly half of the stations. The authors linked the detected correlation reversals with secular variations in solar brightness. Changes in the correlation links between surface air temperatures and sunspot numbers in the 11-year cycles were studied by Georgieva and colleagues [12]. According to their data, at most of the meteorological stations, the correlations were positive in the 18th and 20th centuries and negative in the 19th century. The authors related the correlation reversals to changes in the North–South asymmetry of solar activity A = (SN − SS)/(SN + SS), where SN and SS represent the total sunspot area in the Northern and Southern solar hemispheres, respectively. When the Northern Hemisphere dominated (A > 0), temperature was found to be higher at solar maxima and lower at sunspot minima. On the contrary, when the Southern Hemisphere was more active (A < 0), temperature was higher at solar minima than at solar maxima.
The reversal of correlation links between the North Atlantic Oscillation and the solar/geomagnetic indices were detected in a number of studies [12,13,14,15]. Thejll and colleagues [13] noted that the correlation between the NAO and geomagnetic aa-index was high and significant only for the winter season. From the end of the 19th century to ~1950, the correlation was negative; its sign was then reversed near 1950, and in the 1970s, the positive correlation became statistically significant. The authors suggest that in the 1970s, changes took place in the atmosphere state, and it became more sensitive to solar influence. The data by Lukianova and Alexeev [14] confirmed the correlation reversal between the NAO and aa-index around 1950.
Long-term variations in the correlation links between the NAO and sunspot numbers were studied by Georgieva and colleagues [12]. It was shown that the NAO index was negatively correlated with solar characteristics in the 20th and 18th centuries and positively correlated with them in the 19th and 17th centuries. The authors related the secular variations in the correlation links to long-term variations in the North–South asymmetry of solar activity. In the work by Georgieva and colleagues [15], it was suggested that the periods of negative and positive correlation between the NAO and solar/geomagnetic activity may be caused by changes in the relative contribution of the solar agents associated with the toroidal and poloidal fields of the Sun (coronal mass ejections and high-speed solar wind streams from coronal holes, respectively) in geomagnetic activity. It was shown that until the 19th solar cycle, the main contribution was made by toroidal field-related agents, while from the 20th cycle onward, the main drivers of geomagnetic activity became poloidal field-related ones.
An illustrative example of the temporal instability of solar–atmospheric links is a recent violation of the correlation links detected between low clouds and galactic cosmic rays by Marsh and Svensmark [16]. A high positive correlation between the variations in these characteristics in 1983–1995 was considered as strong evidence for the physical mechanism of solar–climatic links involving cosmic ray influence on cloud formation. However, the correlation was violated in the early 2000s; this gave rise to the doubt of both a possible influence of cosmic rays on microphysical processes in clouds and their contribution to the physical mechanism of solar–climatic links.
Thus, the reasons for the temporal variability observed in the solar–atmospheric links remain unclear and need to be understood.

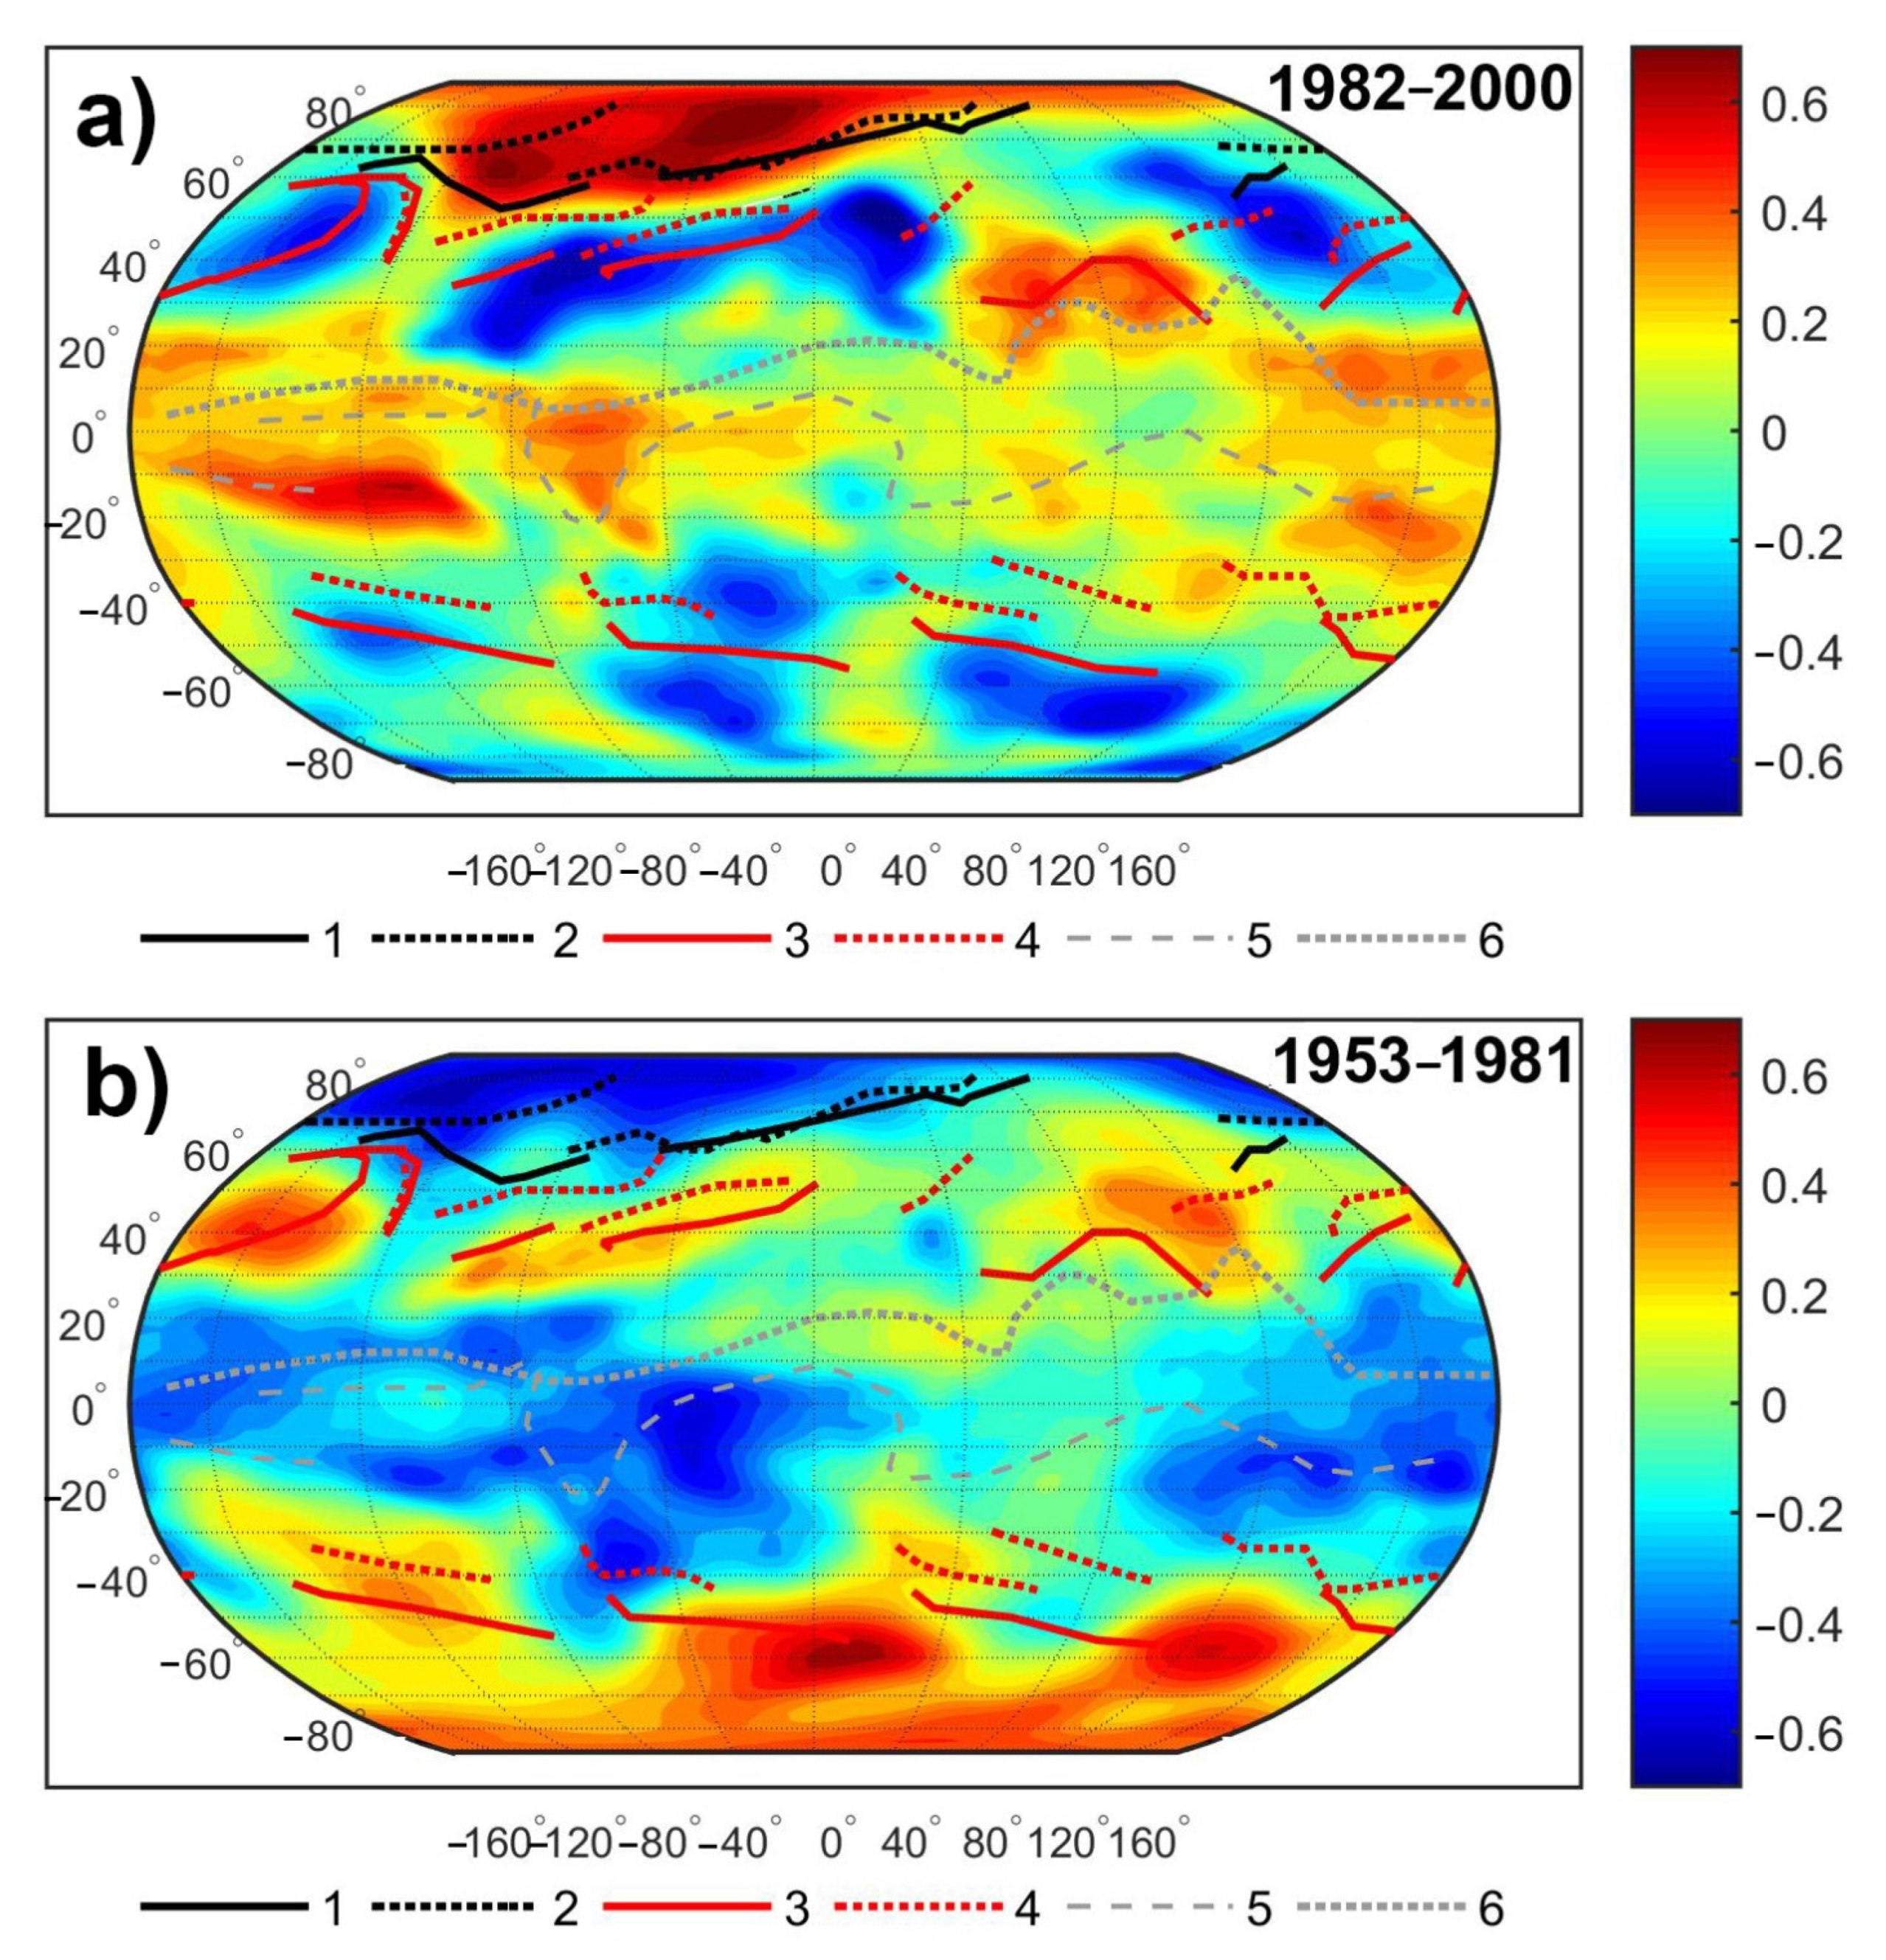
2.3. Spatial and Temporal Variability in Galactic Cosmic Ray Effects on Troposphere Pressure

As mentioned above, solar activity can influence the atmosphere through a number of different physical agents, such as the total and ultraviolet radiation, X-rays, solar wind and interplanetary magnetic field disturbances, and energetic particles. An important part in solar–atmospheric links seems to be played by cosmic rays, both of galactic and solar origin (GCRs and SCRs, respectively) (e.g., [16,17,18,19,20]). These particles can penetrate into the middle and lower atmosphere and are the major ionization sources at these heights [21]. In addition to their high penetrating capability, fluxes of these particles are strongly influenced by solar activity. Unlike SCR bursts, which are associated with solar flare activity and occur sporadically, GCRs arrive at the Earth constantly, and their fluxes are modulated by solar activity on different time scales. In particular, they decrease by a factor of ~2 at the maxima of the 11-year solar cycle, with the correlation coefficients between the mean yearly values of GCR fluxes and sunspot numbers amounting to about −0.8. A noticeable influence of short-term variations in solar and galactic cosmic ray fluxes on the development of dynamic processes at extratropical latitudes was revealed in the studies by Veretenenko and colleagues [22,23,24].
Let us consider the temporal variability in the correlation links between pressure in the lower troposphere and GCR intensity in the 11-year cycle. The results of the studies by Veretenenko and Ogurtsov [25,26] showed a strong latitudinal and regional dependence of the GCR effects on pressure variations, which seems to be determined by peculiarities of the baric systems forming in different regions. Figure 3 presents the spatial distribution of the correlation coefficients between pressure and GCR variations, with the linear trends being removed, for two different time periods: 1953–1981 and 1982–2000. Troposphere pressure was characterized by the mean yearly values of geopotential heights at the 700 hPa level (GPH700) obtained from the NCEP/NCAR reanalysis archive [3]. To characterize GCR intensity, the mean yearly values of the neutron monitor (NM) counting rate in Climax (geographic coordinates φ = 39° N, λ = 106° W, geomagnetic cut-off rigidity 2.99 GV) were used (the Climax data are available for 1953–2005 at ftp://ftp.ngdc.noaa.gov/STP/, accessed on 17 January 2007). To account for the autocorrelation in the studied data, the statistical significance of the correlation coefficients was estimated using the random-phase test that included Monte Carlo simulations (number of trials N = 1000) of the correlation coefficients between surrogate time series obtained from the initial ones by randomizing the phases of their Fourier transform [27].
The mean long-term (climatic) positions of Arctic and Polar fronts, which are the main atmospheric fronts at extratropical latitudes, are also shown in Figure 3 according to the data by Khromov and Petrociants [28]. Arctic fronts separate cold air masses forming in the Arctic region from the warmer air of middle latitudes, whereas Polar fronts separate mid-latitudinal and tropical air masses. They play an important part in cyclonic activity at middle latitudes, as the formation and evolution of extratropical cyclones are closely associated with these fronts. Thus, climatic Polar fronts may be considered to be the regions of maximum occurrence of cyclone centers and indicate the main directions of their movement.
The data in Figure 3 show that the correlations between troposphere pressure and GCR fluxes are observed over the entire globe for both of the studied time intervals, i.e., disturbances associated with GCR variations cover the troposphere of the whole Earth. However, one can see a strong regional dependence of the GCR-correlated pressure variations, with several large areas of positive and negative correlation being observed. It should also be noted that the distribution of the correlations is closely related to the climatic atmospheric fronts.
As the data in Figure 3 show, the highest absolute values of GPH700-GCR correlations were observed at extratropical latitudes for the period 1982–2000. A strong positive correlation was detected in the Polar region of the Northern Hemisphere bounded by Arctic fronts, which is where high-pressure systems (anticyclones) are usually formed. Thus, a positive correlation suggests that GCR increases at the minima of the 11-year solar cycle were accompanied by pressure increases in this area (intensification of anticyclones) during the studied period. The correlation coefficients reach about 0.6–0.7, with the confidence level p being 0.95–0.97 according to the random-phase test [27]. Similar GPH700-GCR correlation coefficient values but of the opposite sign (−0.6…−0.7, p = 0.95–0.97) were observed at Polar fronts of middle latitudes of the Northern Hemisphere. This indicates that GCR increases in the studied period were accompanied by pressure decreases, i.e., more intensive formation and deepening of extratropical cyclones associated with these fronts. Similar effects (cyclone intensification correlated with GCR increases) were observed to take place at Polar fronts of the Southern Hemisphere. One can also note a weak positive GPH700-GCR correlation over the equatorial trough at low latitudes, which includes the intertropical convergence zone (a zone of convergence of ‘trade winds’).
In the previous period, 1953–1981 (Figure 3b), the distribution of the correlation coefficients between pressure and GCR fluxes was quite similar to that in 1982–2000, i.e., we can see the same large areas whose positions are closely related to the climatic atmospheric fronts. However, the signs of correlations in all these areas were quite opposite to those in 1982–2000. The correlation coefficients in the polar area of the Northern Hemisphere were negative (−0.6…−0.7, p = 0.95–0.98). The correlations in the areas of Polar fronts at middle latitudes also had the opposite sign; however, in the Northern Hemisphere, they did not reach high values, amounting to ~0.3–0.4 (p ≤ 0.9). The obtained results show that depending on the time period, extratropical cyclonic activity at Polar fronts of both hemispheres, as well as anticyclonic processes in the Polar region of the Northern Hemisphere, may intensify or, on the contrary, weaken with GCR increases in the 11-year cycle.
The analysis of sliding correlation coefficients between pressure (GPH700) in different latitudinal belts and GCR intensity was carried out in our work [25] and showed that the correlation reversal took place nearly simultaneously over the entire globe in the early 1980s. This indicates a close interconnection of dynamic processes developing in different regions of the globe as a response to GCR variations. The dependence of the spatial distribution of the correlation coefficients on the climatic front positions suggests that GCR variations influence the development of baric systems associated with these fronts. The reversal of pressure–GCR correlations near 1980 is in good agreement with the reversal detected in the correlations between air temperatures at most of the meteorological stations and sunspot numbers at the same time [12]. The correlation reversal also suggests long-term variability in the correlation links between dynamic processes in the atmosphere and solar activity, which may be caused by changes in the atmosphere state on the multidecadal time scale.

2.4. Temporal Variability of Solar Activity Effects on Troposphere Pressure in the Northern Hemisphere and the Epochs of Large-Scale Circulation

Let us consider temporal variations of solar activity effects on troposphere pressure for a longer time interval. As instrumental data on the intensity of GCRs, which represent a direct input to the atmosphere, are available only from the 1950s onward, sunspot numbers SSN (according to a new version [29]) were used for this study. Unlike GCRs, sunspot numbers do not represent a physical agent influencing the atmosphere directly; however, they can be used as markers of the 11-year cycles that strongly modulate GCR fluxes, and the length of their time series is rather long. To characterize dynamic processes in the atmosphere, sea level pressure data were taken from the MSLP (Mean Sea Level Pressure) archives of the Climatic Research Unit, University of East Anglia (https://crudata.uea.ac.uk/cru/data/pressure, accessed on 10 August 2004) for the period of 1873–2000 and the Earth System Research Laboratory, NOAA (https://www.esrl.noaa.gov/psd/repository, accessed on 7 November 2017) from 1979 onward.
As shown above, the most pronounced GCR effects on the troposphere dynamics were detected at extratropical latitudes, with the correlation coefficients between pressure and GCR intensity at middle and polar latitudes in the Northern Hemisphere being in opposite phases. Thus, the correlation coefficients between sea level pressure and sunspot numbers were studied for the Polar region (60–85° N) and for the North Atlantic Polar frontal zone (zone of most intensive cyclone formation) along the eastern coasts of North America (20–30° N, 280–300° E and 30–40° N, 290–310° E) in the work by Veretenenko and Ogurtsov [30]. Figure 4a presents the correlation coefficients between the mean yearly values of SLP averaged with area-weighting over the indicated regions and sunspot numbers SSN for sliding 15-year intervals. The statistical significance of the coefficients was estimated using Monte Carlo simulations (N = 2000) of sliding correlation coefficients for surrogate time series obtained by randomization of the initial SLP and SSN time series. The dotted lines in Figure 4a show the percentages of trials that obtained lower correlation coefficients (or higher in the case of negative correlations) than those for the initial time series, which allowed to estimate the probability of the detected correlations being non-random.
One can see that the correlation coefficients R (SLP, SSN) in the indicated regions vary in opposite phases and reveal several correlation reversals during the studied time interval. The presented data allow the suggestion of a close interconnection between dynamic processes developing the North Atlantic cyclogenetic zone and in the Polar region as a response to phenomena related to solar activity. The correlation reversals took place in the end of the 19th century, in the 1920s, near 1950, and in the early 1980s, which indicates a roughly 60-year variation in solar activity effects on troposphere circulation. Indeed, the results of spectral analysis (Figure 4b) confirmed the ~60-year periodicity in the studied correlation coefficients. The years of the detected correlation reversals are in good agreement with those detected between different atmospheric parameters and solar activity (see Section 2.2).
The above data allow the assumption that the temporal variations (sign reversals) in the studied correlation links, which reveal a roughly 60-year oscillation period, may be due to some changes in the state of the atmosphere. Indeed, there are a number of data indicating ~60-year variability in different climatic characteristics (see [30] and references therein). To clarify possible reasons for the detected sign reversals, let us compare them with the evolution of large-scale circulation according to the Vangengeim–Girs classification.
This classification was worked out by G.Ya. Vangengeim [31] and was later supplemented by A.A. Girs [32]. The Vangengeim–Girs classification includes three main forms of atmospheric circulation: W (zonal or westerly), C (meridional), and E (easterly) for the Atlantic–Eurasian sector of the Northern Hemisphere as well as three similar forms: Z, M1, and M2 for the Pacific–American sector. Under zonal forms W and Z, an intense westerly transport of air masses takes place at middle latitudes, with low-amplitude waves in the pressure field moving rapidly from west to east. The development of meridional processes, with slowly moving or stationary high-amplitude waves being observed in the pressure field, is characterized by meridional forms C and M1 and easterly forms E and M2. The forms C and E as well as the forms M1 and M2 differ by the opposite location of their troughs and crests in the pressure field.
Figure 5 (left panel) presents temporal variations in sliding correlation coefficients between pressure in the Polar region and sunspot numbers, which are compared to annual occurrences (a number of days during a year) of the main forms of large-scale circulation in the Atlantic–Eurasian and Pacific–American sectors of the Northern Hemisphere. The annual occurrences were calculated using the data in [1,33] and those provided by the Arctic and Antarctic Research Institute (St. Petersburg). The data are shown after the linear trend removal and smoothing using 15-year running averages. In Figure 5a, the correlation coefficients R (SLP, FCR) between sea level pressure SLP in the Polar region and charged particle fluxes FCR in the mid-latitudinal stratosphere [34] are also presented.
Comparing the data presented in Figure 5 (left panel), we can note that the reversals of SLP-SSN correlation coefficients are closely related to the changes in the large-scale circulation epochs. The correlation reversals, as a rule, were preceded by or coincided with turning points in the evolution of the indicated circulation forms. In particular, changes in the correlation sign in the early 1980s occurred when there was an almost simultaneous change in annual occurrences of the circulation forms both in the Atlantic–Eurasian and Pacific–American regions. Changes in the evolution of the circulation forms in the Atlantic–Eurasian sector probably also took place in the early 2000s.
One can note that, first of all, the signs of the SLP-SSN correlations seem to be related to the development of the meridional circulation forms C and M1. Negative correlation coefficients of SLP-SSN in the Polar region were observed when these forms were intensifying, i.e., their annual occurrences were increasing (~1920–1950 and ~1980–2000). A negative SLP-SSN correlation implies a positive correlation between SLP and GCR intensity (Figure 5a). In these periods, at middle latitudes, and especially in the North Atlantic cyclogenetic region, the SLP-SSN correlation was positive (i.e., negative correlation with GCR intensity) (Figure 4a). Thus, under increasing occurrences of the meridional forms, GCR growth at the minima of the 11-year solar cycle contributed to more intensive formation and deepening of cyclones (pressure decrease) at the middle latitudes, and at the same time it was accompanied by the intensification of anticyclonic processes (pressure increase) at polar latitudes (see Figure 3a). The effects of 11-year GCR variations on extratropical cyclone development in the periods ~1920–1950 and ~1980–2000 are similar to the effects of short-term cosmic ray variations on troposphere dynamics. The intensification of North Atlantic cyclones was found on the days following solar cosmic ray bursts (Solar Proton Events) [22,23] and, on the contrary, the intensification of anticyclonic processes was found during Forbush decreases in the GCRs [24].
When occurrences of the meridional forms were decreasing (~1880–1920 and ~1950–1980), the sign of correlation links between troposphere pressure and sunspot numbers/GCR intensity was opposite to that detected in the periods of enhancing meridional forms. This means that GCR increases in the 11-year cycle were not accompanied by cyclone intensification at the middle latitudes and anticyclones in the Polar region. Thus, the character of solar activity and GCR effects on cyclonic processes (pressure variations) at extratropical latitudes seems to be closely related to large-scale circulation epochs and especially to the evolution of meridional circulation forms. Indeed, the results of the spectral analysis (Figure 5, right panel) showed that annual occurrences of the meridional circulation forms C and M1 are characterized by dominant harmonics of ~60 years (the confidence level 0.99, estimated relative to the “red noise” spectrum using χ2 statistics [35]), which are close to those observed in the correlation coefficients R (SLP, SSN) (Figure 4b). Thus, the obtained results allow us to suggest that the reversal of the correlation links between pressure variations (development of extratropical baric systems) and solar activity phenomena may be associated with changes in the large-scale circulation epochs.

2.5. Evolution of the Polar Vortex as a Possible Reason for Temporal Variability in Solar Activity Effects on the Lower Atmosphere Circulation

Let us consider which atmospheric factors may influence the formation of solar activity (GCR) effects on the development of baric systems (pressure variations) under different circulation epochs. As previously mentioned (Section 2.1), an important part in a large number of atmospheric processes is played by the stratospheric polar vortex, which affects the development of large-scale dynamic processes in the troposphere. A possible role of the polar vortex in the formation of the atmospheric response to solar activity phenomena was studied by Veretenenko and Ogurtsov [26,30].
Figure 6 shows temporal variations in the vortex characteristics in the last several decades calculated on the basis of the NCEP/NCAR reanalysis data [3], which have been available since 1948. To characterize the vortex strength, the mean values of zonal (western) wind velocity in the latitudinal belt of 60–80° N and stratospheric temperature in the area of 60–90° N at the 50 hPa level (~20 km) were used. The data were averaged over the winter months (December–February), which is when the vortex reaches its maximum development. One can see that in the period when GCRs produced the most significant effects on the evolution of mid-latitudinal cyclones (~1980–2000), the vortex was rather strong. In this period, zonal winds were noticeably enhanced, and the temperature in the vortex area was lowered due to a decrease in the heat exchange between high and middle latitudes, with the correlation coefficients between the variations in wind velocity and temperature amounting to –0.82. In the previous period from the 1950s to the end of the 1970s, the vortex was weak, with wind velocity decreasing and stratospheric temperatures increasing. Let us note the changes in the vortex strength near 1980 and near 2000.
To estimate vortex evolution in earlier periods when no stratospheric data were available, sea level pressure and temperature oscillations in the Polar region were used. According to Baldwin and Dunkerton [5], a strong vortex regime is characterized by a positive phase of the Arctic Oscillation, i.e., negative SLP anomalies are observed at polar latitudes and positive ones are observed at middle latitudes. Cyclone tracks are shifted to the north, so more cyclones arrive in the Polar region, which results in a warm epoch in the Arctic [6]. Under a weak vortex regime, a negative phase of the Arctic Oscillation is observed, i.e., SLP anomalies are positive at high latitudes and negative at middle ones. Cyclone tracks are displaced farther south, and fewer cyclones arrive in the Arctic, contributing to a cold epoch in this region.
Let us compare the stratospheric data in Figure 6 with the Arctic Oscillation data. Figure 7 presents temporal variations in the mean yearly values of sea level pressure and temperature anomalies in the Arctic region (≥70° N), with the polynomial trends being removed. The data were taken from the MSLP archives indicated in Section 2.4 and GISS Surface Temperature Analysis (http://data.giss.nasa.gov/gistemp/source, accessed on 13 April 2018). One can see that the period with a strong vortex (~1980–2000), when stratospheric winds were enhanced (Figure 7), was really accompanied by a decrease in pressure and warming in the Arctic. The previous period with a weak vortex (~1950–1980), on the contrary, was accompanied by an increase in pressure and a cold epoch in the studied region. Thus, the data in Figure 7 suggest that the period ~1920–1950, which was characterized by an SLP decrease and temperature increase, was a period with a strong vortex similar to ~1980–2000, whereas the period ~1900–1920, when an SLP increase and temperature decrease were observed, was a period with a weak vortex. The presented data show a roughly 60-year periodicity in the pressure and temperature variations in the Arctic, which suggests a similar periodicity in the polar vortex strength. The transitions between the different states of the polar vortex seem to take place at the end of the 19th century, in the early 1920s, and near 1950 and 1980, which is in good agreement with the changes in large-scale circulation epochs (Figure 5).
The obtained results allow the assumption that the oscillations of the polar vortex intensity may be a possible reason for the temporal variability in the effects of solar activity on the atmosphere state. As mentioned above (Section 2.2), correlation reversals between atmospheric characteristics and solar activity-related phenomena were noted in the 1920s [10,11,12], near 1950 [13,14], and near 1980 [12]. The data presented in this study (Figure 4 and Figure 5) revealed that the correlation reversals of troposphere pressure in different regions and sunspot numbers took place near 1890, the 1920s, the 1950s, and in the early 1980s, which is consistent with the transitions between the different states of the vortex (Figure 6 and Figure 7). Under a strong vortex regime, growth of GCR intensity in the 11-year cycles contributes to the intensification of cyclonic processes at mid-latitudinal Polar fronts (Figure 3a), whereas under a weak vortex, no such effects are observed (Figure 3b). As the polar vortex state affects the dynamic interaction between the troposphere and stratosphere via planetary waves (e.g., [36,37]), one can suggest that changes in this interaction may influence the formation of solar activity effects on lower atmosphere circulation. Under strong vortex conditions, when the zonal wind velocity in the stratosphere exceeds a critical value, planetary waves propagating upward are reflected back to the troposphere, so the stratosphere can influence the troposphere. Under a weak vortex, planetary waves propagate to the upper levels of the atmosphere, and only the troposphere can influence the stratosphere. Hence, when the vortex is strong, the conditions for the transfer of solar signals from the stratosphere into the troposphere seem to be more favorable. A small increase in wind velocity may intensify the reflection of planetary waves back to the troposphere, resulting in pressure and temperature changes [37]. Thus, under strong vortex conditions, the stratospheric processes caused by GCR variations and/or other solar activity agents can influence tropospheric processes to a greater extent compared to weak vortex conditions.

2.6. Destruction of Cloud-GCR Correlation: Possible Role of the Vortex Weakening

The correlation between cloud cover and galactic cosmic ray intensity was revealed on a daily time scale by Pudovkin and Veretenenko [38] and on a decadal time scale by Svensmark and Friis-Christensen [39]. Later Marsh and Svensmark [16] showed that the cloud–GCR link is only observed for low-level clouds. The correlation coefficients between the globally averaged values of low-cloud anomalies (LCA) according to the satellite data ISCCP-D2 and GCR intensity were found to reach 0.63 (0.92 for 12-month running averages) in the period of 1983–1994. However, in the late 1990s, the LCA-GCR correlation started decreasing, and in the early 2000s, it was finally destroyed. The correlation destruction can be seen in Figure 8, where the low-cloud anomalies (LCA) taken from (http://isccp.giss.nasa.gov/pub/data/D2CLOUDTYPES, accessed on 4 August 2015) and GCR fluxes FCR in the stratosphere at the mid-latitudinal station Dolgoprudny (geomagnetic cutoff rigidity 2.4 GV) according to balloon measurements [34] are presented. The destruction of the cloud–GCR link near 2000 provided a reason to doubt a possible influence of galactic cosmic rays on cloud formation as well as their important role in the mechanism of solar-atmospheric links (e.g., [40]).
As shown in the studies by Veretenenko and colleagues [41,42], a possible reason for the indicated violation of a positive cloud–GCR link may be temporal variability in GCR effects on the extratropical cyclogenesis, the temporal variability being caused by the evolution of the stratospheric polar vortex. Indeed, the data presented in Figure 6 provide evidence for an enhanced polar vortex in the Northern Hemisphere from the early 1980s to the late 1990s, when a high positive correlation between low-cloud amount and GCRs was observed. A similar enhancement of the stratospheric polar vortex also seems to take place in the Southern Hemisphere in the indicated period [41]. According to the above data (Figure 3a), under strong vortex conditions, an increase in GCR fluxes in the 11-year solar cycle contributes to the intensification of cyclonic processes at mid-latitudinal Polar fronts. In Figure 9a, the mean yearly values of troposphere pressure (geopotential heights of the 700 hPa level) at the middle latitudes (30–60° N) are compared to GCR fluxes in the mid-latitudinal stratosphere at altitudes of ~15–20 km [34]. One can see a rather strong negative correlation between these values, which confirms an intensification of cyclogenesis with a GCR increase under a strong vortex conditions in the ~1980–1990s. However, after ~2000 the negative correlation was violated.
Cyclonic activity, in turn, significantly influences cloud fields in the troposphere. The main cause of cloud formation is the vertical transport of water vapor that results in its cooling and condensation. The most large-scale upward air movements at extratropical latitudes are associated with low-pressure systems, i.e., cyclones and troughs. These movements arise due to a convergence of air flows near the Earth’s surface to the cyclone center or the trough axis (e.g., [43]). Upward air movements are also associated with atmospheric fronts (narrow transition zones separating cold and warm air masses). They contribute to the formation of strong extended systems of frontal stratiform clouds such as Ns-As-Cs (nimbostratus Ns, altostratus As, and cirrostratus Cs) at warm and slowly moving cold fronts as well as to the development of convective clouds (cumulonimbus Cb) at fast-moving cold fronts (e.g., [44]). As extratropical cyclones are usually frontal ones, i.e., their formation and evolution occur at atmospheric fronts, frontal cloudiness exists at all stages of cyclone evolution. This results in a rather strong connection between cloud fields and dynamic processes in the troposphere. A well-developed cyclone represents a powerful cloud vortex with a spiral structure, which can be seen from a satellite (see Figure 1 in [42]).
In Figure 9b, temporal variations in the correlation coefficients between the mean yearly values of troposphere pressure (GPH700) anomalies in the latitudinal belt of 30–60° N and GCR fluxes [34] for sliding 11-year intervals are presented. The sliding correlation coefficients are compared to similar correlation coefficients between LCA in the same latitudinal belt and GCR fluxes. The data in Figure 9b show that a strong negative correlation, with R (GPH, FCR) amounting ~−0.8 (the confidence level p = 0.98 according to Monte Carlo simulations of sliding correlation coefficients for surrogate time series obtained by randomization of the initial ones), really did take place from the middle of the 1980s to the middle of the 1990s, which indicates strong GCR effects on cyclone intensification. Then, this correlation started weakening and changed the sign in the early 2000s. One can see that the correlation coefficients for pressure–GCRs and cloud–GCRs vary in opposite phases. The highest positive correlation R (LCA, FCR) took place in the period, when the effects of GCRs on cyclone development were the most pronounced. In the late 1990s, this correlation started decreasing and changed the sign simultaneously with the reversal of the pressure–GCR correlation. Thus, the presented data provide evidence that a high positive correlation between cloud amount and galactic cosmic rays revealed on the decadal time scale [16,39] was due mostly to the effects of GCR on the development of dynamic processes in the atmosphere under a strong polar vortex. The transition of the polar vortex from a strong state to a weaker one near 2000 (Figure 6) probably resulted in the reversal of the pressure–GCR correlation which, in turn, resulted in the reversal of the cloud–GCR correlation. Let us note that the obtained results do not deny a possible influence of GCR variations on microphysical processes in clouds on a daily time scale via ion-mediated nucleation (e.g., [45]) and electric mechanisms [20]. However, when considering GCR effects on cloud amount on longer time scales, we should take the circulation changes into account.

3. Solar Activity Influences of the Polar Vortex State

3.1. Vortex Intensification Associated with Solar Proton Events

As shown above, the state of the stratospheric polar vortex is of great importance for solar activity influences on lower atmosphere circulation. At the same time, the state of the vortex itself may be influenced by different phenomena associated with solar variability due to its favorable location, both latitudinal and altitudinal. First of all, the polar vortex is formed in the area with low geomagnetic cutoff rigidities (≤2–3 GV), which allows cosmic ray particles with a broad energy range to penetrate into the area, producing atmosphere ionization [21]. Hence, the vortex area is accessible to the low-energy component of galactic cosmic rays strongly modulated by solar activity as well as to solar cosmic rays (mostly protons) accelerated during solar flares in the corona and in interplanetary space. This area may also be affected by precipitations of auroral and radiation belt electrons associated with geomagnetic activity. Variations in the charged particle fluxes cause increases in atmospheric ionization, which, in turn, influence the chemical composition and temperature regime of the polar atmosphere (e.g., [46]) as well as conductivity and vertical atmospheric currents, intensifying microphysical process in clouds [20]. In the area of the vortex formation, pronounced changes in the ionospheric potential caused by variations in interplanetary magnetic fields take place; this creates favorable conditions for electrical mechanisms of solar–atmospheric links [20].
Let us consider possible effects of phenomena related to solar activity on the state of the polar vortex. Increases in ionization in the polar atmosphere may be caused by Solar Proton Events (SPEs), which are sharp enhancements in solar proton fluxes at the Earth’s orbit associated with explosive energy release on the Sun (solar flares). In spite of lower energies (usually no more than 1 GeV), fluxes of solar protons may exceed those of galactic cosmic rays by several orders of magnitude, resulting in considerable growth of ionization in the middle atmosphere. Because of a steep energy spectrum (i.e., solar proton fluxes decrease rapidly with energy increase) and geomagnetic cutoff, the intrusion of solar protons into the Earth’s atmosphere and the corresponding ionization increase are usually limited by polar latitudes. Integral fluxes of protons with energies >5, >50, and >100 MeV during a series of strong SPEs in January 2005 according to the GOES-11 satellite data (http://spidr.ngdc.noaa.gov, accessed on 15 February 2008) as well as corresponding ionization changes in the high-latitudinal atmosphere according to SOLARIS-HEPPA data (https://solarisheppa.geomar.de/, accessed on 24 January 2017) are shown in Figure 10. One can see that the SPE series under study resulted in considerable ionization increases in the atmosphere above 20 km, with the greatest values reaching ~1000 cm−3·s−1 in the mesosphere and the upper stratosphere on 17 and 20 January.
Our studies [47,48] showed that the January 2005 SPEs were accompanied by a pronounced intensification of the stratospheric polar vortex. Figure 11a presents temporal variations in the maximal values of zonal (western) wind velocity Umax in the area of vortex formation during the winter months of 2004/2005 according to the NCEP-DOE reanalysis-2 data [2]. A noticeable enhancement in western winds at all the stratospheric levels under study can be observed in the period of 15–23 January, with deviations from the trend values amounting to ~20–30 m·s−1 at the upper levels (30–10 hPa) and ~15 m·s−1 at the lower ones (100–50 hPa). It was also found that the studied SPEs were accompanied by an increase in the areas covered by strong western winds at all the stratospheric levels. Figure 11b presents variations in the areas where the western wind velocity exceeded 45, 55, and 65 m·s−1 at the upper levels 30, 20, and 10 hPa, respectively. Increases in these areas on SPE days were found to amount up to ~40–43% relative to the mean level on 1–14 January. The data in Figure 11c show that in the course of the SPE series, the areas with high-velocity winds, which were not observed before the series onset, arose and that after the end of the series, they disappeared. An enlargement of the area covered by strong western winds at the 50 hPa level can be seen in Figure 12, where the daily charts of zonal wind velocity (U-component) on 13 January (2 days before the series onset) and 19 January (4 days after the onset) are compared. The area of western winds with velocities U > 40 m·s−1 is highlighted in dark brown. It can be seen that, before the SPE series onset, this area was mainly localized over the northern part of North America. However, in the course of the studied SPEs, it extended substantially to the east, covering the North Atlantic, as well as to the west, covering the high-latitudinal part of the North Pacific and the Arctic coasts of Eurasia. The maximal values of wind velocity increased from 55 to 67 m·s−1, and their location also shifted to the east.
Thus, the presented data show a pronounced strengthening of the stratospheric polar vortex that seems to be associated with strong Solar Proton Events of January 2005. A similar intensification of zonal (western) winds in the stratosphere was found for the SPEs on 5–6 and 13–14 December 2006 in our work [49]. An analysis of the SPEs with energies E > 100 MeV detected during the 23rd solar cycle allows the suggestion that the vortex intensification in the course of these events mainly took place under the west phase of the quasi-biennial oscillations of the atmosphere [49]. Thus, the obtained results provide evidence for a possible influence of ionization changes in the middle atmosphere associated with Solar Proton Events and other solar activity phenomena on intensity of the stratospheric polar vortex on a daily time scale. At the same time, they also allow the suggestion that the vortex intensity can be affected by long-term ionization changes in the stratosphere that are associated with variations in GCR fluxes on decadal to secular time scales and longer. Thus, further studies of possible effects of GCR variations on polar vortex intensity are needed.

3.2. Possible Factors of the Vortex Intensification on the Multidecadal Time Scale

Let us consider other possible factors affecting polar vortex intensification on the multidecadal time scale. As shown above, the intensity of the vortex seems to be characterized by ~60-year variations. The nature of these variations is not quite clear; however, we can suggest that the vortex state may be affected by phenomena related to solar activity due to a rather favorable vortex location.
Along with low geomagnetic cutoff rigidities, the area of vortex formation is characterized by a high occurrence of auroras associated with magnetospheric disturbances. The auroral zone (the area with the highest probability of auroras) represents the belt at geomagnetic latitudes of ~60–75° centered at the geomagnetic pole in each hemisphere. In the Northern Hemisphere, it extends over the Arctic coasts of North America, the southern part of Greenland and Iceland, and the Arctic coasts of Eurasia. As the data in Figure 12 show, enhanced western winds in the vortex are observed in the latitudinal belt at ~60–80° N, which coincides rather well with the location of the auroral zone. Thus, we can suggest that the vortex, or some parts of the vortex, may enter the area of auroral electron precipitation, which creates favorable conditions for possible effects of auroral phenomena related to geomagnetic activity.
According to the data by Veretenenko and colleagues [50], ~60-year variations are observed in annual occurrences of magnetic storms with gradual commencements (GC). This type of magnetic storms is characterized by gradual development, with no sharp increase in the Earth’s magnetic field being observed before the main phase of a storm. As a rule, GC magnetic storms are associated with high-speed streams of solar wind from coronal holes, which are large-scale regions of the magnetic field with an open configuration [51]. Figure 13a presents variations in annual occurrences of magnetic storms with gradual commencements (total number of GC storms with intensities from moderate to very large during a year) after the linear trend removal. The data were taken from the mid-latitudinal observatory IZMIRAN (55°45′ N, 37°37′ E; geomagnetic latitude Φ ~51°) (http://www.izmiran.ru/magnetism/magobs/MagneticStormCatalog.html, accessed on 19 January 2019). As seen from Figure 13a, annual occurrences of GC storms reveal a clear ~60-year variation that seems to be similar to the variation observed in the polar vortex strength (Figure 6). Comparing the data in Figure 6 and Figure 13a, we can note that the strengthening of the vortex from ~1980 to ~2000 took place when there was an increase in occurrence of magnetic GC storms, whereas the weakening of the vortex in ~1950–1980 was observed under a decrease in GC storm occurrences.
Thus, we can suggest that the ~60-year variations in intensity of the stratospheric polar vortex may be associated with similar variations in high-speed solar wind streams, which contribute to the development of magnetic storms with gradual commencements, as well as in characteristics of the solar sources of these streams (coronal holes). Indeed, ~60-year variations were found in the reconstructed areas of coronal holes on the Sun [52].
A roughly 60-year variation in the polar vortex strength may also be related to long-term changes in total solar irradiance (TSI). Wavelet analysis of TSI, which was reconstructed by Hoyt and Schatten [53] and later updated by Scafetta and Willson [54] on the basis of the ACRIM satellite data, was carried out in the work by Veretenenko and Ogurtsov [30]. The study revealed pronounced periodicities of ~80 and ~60 years. The ~80-year periodicity was found to be stronger until the end of the 19th century, whereas in the 20th century, the ~60-year periodicity became dominant. Figure 13b shows temporal variations in the TSI for the period of 1870–2014 according to [54] after the removal of the linear trend. The data in Figure 13b demonstrate a clear ~60-year variation in the reconstructed TSI during the last ~150 years. TSI seems to be increased in ~1920–1950 and in ~1980–2000, which were the periods with a strong vortex according to Figure 6 and Figure 7. Thus, variations in solar radiative energy, which is the main source of the Earth’s atmosphere circulation, may also be considered as a possible factor contributing to polar vortex intensification on the multidecadal time scale.

3.3. Possible Mechanisms of Solar Activity Effects on the Polar Vortex Intensity

As shown above, the polar vortex state is apparently influenced by different agents associated with solar activity, which may result in multidecadal oscillations in its intensity. The location of the vortex is favorable for effects of energetic particles entering the atmosphere and producing ionization changes. A possible mechanism of vortex intensification due to atmospheric ionization increases may involve changes in the thermo-radiative balance of the high-latitudinal atmosphere associated with changes in its chemical composition. Ionization increases are known to enhance the production of odd hydrogen (HOx = H + OH + HO2) and odd nitrogen (NOx = N+ NO + NO2) families (e.g., [55,56]). These minor constituents participate in catalytic cycles of ozone destruction (e.g., [57]), so their enhanced production leads to ozone depletion in the middle atmosphere. As ozone is a radiatively active gas that influences the fluxes of both shortwave and longwave radiation, its depletion may contribute to temperature changes in the polar atmosphere. In winter, under polar night conditions, ozone acts as a greenhouse gas that absorbs the longwave radiation of the Earth and atmosphere due to a series of vibrational–rotational bands in the infrared range, the band with a maximum at 9.6 μm being the strongest one [57]. Thus, a decrease in ozone content may result in the cooling of the polar atmosphere, which, in turn, may contribute to an increase in the temperature contrasts between polar and middle latitudes and then to the strengthening of the vortex.
Indeed, noticeable changes in ozone content were detected in connection with a number of major SPEs starting from the event on 2 November 1969. According to rocket measurements [58], 2 days after the onset of this event, the ozone concentration decreased by a factor of 2–4 at mesospheric heights of ~50–70 km. A powerful solar proton event on 4 August 1972 resulted in a noticeable decrease (~20%) in the ozone content above the 4 hPa level at high latitudes of 75–80° N [59]. Pronounced ozone changes were also observed in association with SPEs on 19–29 October [60], 14 July 2000 [61], 28 October–4 November 2003 [62], etc. A number of studies based on satellite data revealed significant changes in chemical composition of the polar middle atmosphere in the course of a series of strong SPEs of January 2005, which was found to be accompanied by the intensification of the polar vortex (Section 3.1). In particular, Jackman and colleagues [63] found a decrease in ozone content at high latitudes of 62–82.5° N on 16–24 January 2005 that amounted 20–60% in the mesosphere (~60–70 km) and ~10% in the upper stratosphere (~40 km) using data from the MLS/Aura instrument.
Thus, changes in the chemical composition of the polar middle atmosphere really do take place due to ionization increases associated with strong SPEs and may influence the temperature regime at high latitudes and, thus, the atmosphere dynamics. Indeed, model studies carried out by Krivolutsky and colleagues [64] revealed that ozone depletion after a major SPE on 14 July 2000 resulted in pronounced changes in temperature and wind velocity in the mesosphere at high latitudes in the Northern (summer) hemisphere; however, SPE effects on the dynamics of the winter atmosphere have not been studied enough. Thus, taking into account the effects of ionization on the chemical composition of the polar middle atmosphere observed on a daily time scale, we suggest that similar effects may also take place on longer time scales due to variations in galactic cosmic rays, which are the main ionization source at heights of ~3–60 km [21], and that these effects may influence the polar vortex intensity. Indeed, vortex formation occurs in an area with low geomagnetic cutoff rigidities (≤2–3 GV), which is accessible for charged particles in a wide energy range, including the low energy component of GCRs strongly modulated by solar activity.
Another source of ionization in the high-latitudinal atmosphere may be electron precipitation associated with geomagnetic activity caused by solar wind interaction with the Earth’s magnetic field. Auroral electrons (1–30 keV) lose their energy in the lower thermosphere at ~90–120 km [65]; however, they generate bremsstrahlung X-rays that can penetrate into the lower levels of the atmosphere. The estimates by Jackman [66] showed that X-rays with energies of 30 keV and 103 keV are capable of reaching altitudes of ~40 and ~30 km, respectively, producing ionization changes. On the other hand, these electron precipitation events are known to contribute to the production of long-lived nitrogen oxides NOx that can be transported downward to stratospheric levels and participate in the catalytic cycle of ozone destruction. Model studies by Baumgaertner and colleagues [67] showed ozone depletion by ~20% in the upper stratosphere due to the NOx enhancement associated with geomagnetic activity and related electron precipitation events. This was found to contribute to a lowering of stratospheric temperatures at high latitudes in winter months and an increase in Northern Annular Mode (NAM) index, indicating the intensification of the polar vortex. The combined effect of different kinds of energetic charged particles, including galactic and solar cosmic rays and low energy electrons, on the atmospheric state was simulated by Rozanov and colleagues [68]. Annual ozone depletion associated with these particles was found to reach ≥10% in the polar mesosphere and ~3–4% in the polar upper stratosphere. It was shown that even a rather small (0.5K) decrease in temperature in the stratosphere due to ozone depletion in winter may result in a lowering of isobaric levels and an intensification of the stratospheric polar vortex. Thus, the model studies in [67,68] confirm a possible influence of energetic particles on the middle atmosphere dynamics via chemical composition and temperature changes, which allows the suggestion that the variations in the polar vortex strength on a multidecadal time scale (Section 2.5) may result from a combined impact of the indicated kinds of charged particles.
Ionization changes in the polar atmosphere due to solar activity-related phenomena can influence not only the chemical composition of the polar atmosphere, but also its conductivity, which, in turn, influences the currents in the global electric circuit (e.g., [20]). The ionization of the stratosphere by GCR fluxes, which have a pronounced latitudinal dependence, contributes to a maximum of stratospheric conductivity at high latitudes and a minimum at lower ones (e.g., [69]). The modulation of GCRs due to solar wind variations associated with solar activity results in variations in the density of vertical electric currents, which, according to Markson and Muir [70], may amount to 30% in the solar cycle. Solar proton intrusions can also noticeably enhance atmospheric conductivity at polar latitudes. For example, Holzworth and colleagues [71] detected an increase in conductivity and the electric current density by a factor of 2 at high latitudes of the Southern Hemisphere during a major SPE on 16 February 1984. The density of electric currents in the area of vortex formation may also be influenced by changes in the ionospheric potential associated with variations in the interplanetary magnetic fields [20].
An enhancement of the electric currents caused by GCR and SCR variations and changes of ionospheric potential, in turn, may influence microphysical processes in clouds. The flow of electric currents through a cloud layer contributes to the generation of space charge on cloud edges. Charging cloud particles may produce different effects on cloud microphysics, as described in [20,72]. One of the most important effects is the enhancement of the collection of aerosols by water droplets (electroscavenging), which, in the case of super-cooled water droplets, could increase the contact nucleation rate and ice production in high-level clouds. In turn, clouds are known to significantly affect both the incoming solar shortwave radiation and outgoing longwave radiation of the Earth and the atmosphere, with the net effect depending on the season, latitude, and type of clouds. In winter at polar latitudes, clouds affect mainly longwave radiation, producing a warming effect in the underlying atmosphere and a cooling one above the cloud layer. Changes in longwave radiation fluxes at polar latitudes due to the enhancement of electric currents and high-level clouds were recently reported in [73,74]. Thus, variations in cloud cover associated with ionization and electric current changes could be an additional factor influencing the thermal-radiative balance of the polar atmosphere on different time scales.
Thus, there appears to be a number of solar activity agents that can influence the strength of the stratospheric polar vortex on different time scales, including multidecadal one. In this study, the main emphasis was on those factors acting at high latitudes in the area of the vortex formation. However, one should also note that, along with the ionization changes at high latitudes, the vortex intensity may be influenced by processes in the low-latitudinal atmosphere that are associated with the absorption of solar UV radiation as well as by processes in the ocean–atmosphere system associated with long-term TSI variations. The influences of solar activity on the vortex state on the multidecadal time scale and the corresponding mechanisms need further investigation, including both analyses of observational data and numerical simulations.

4. Conclusions

The results presented above show the following:
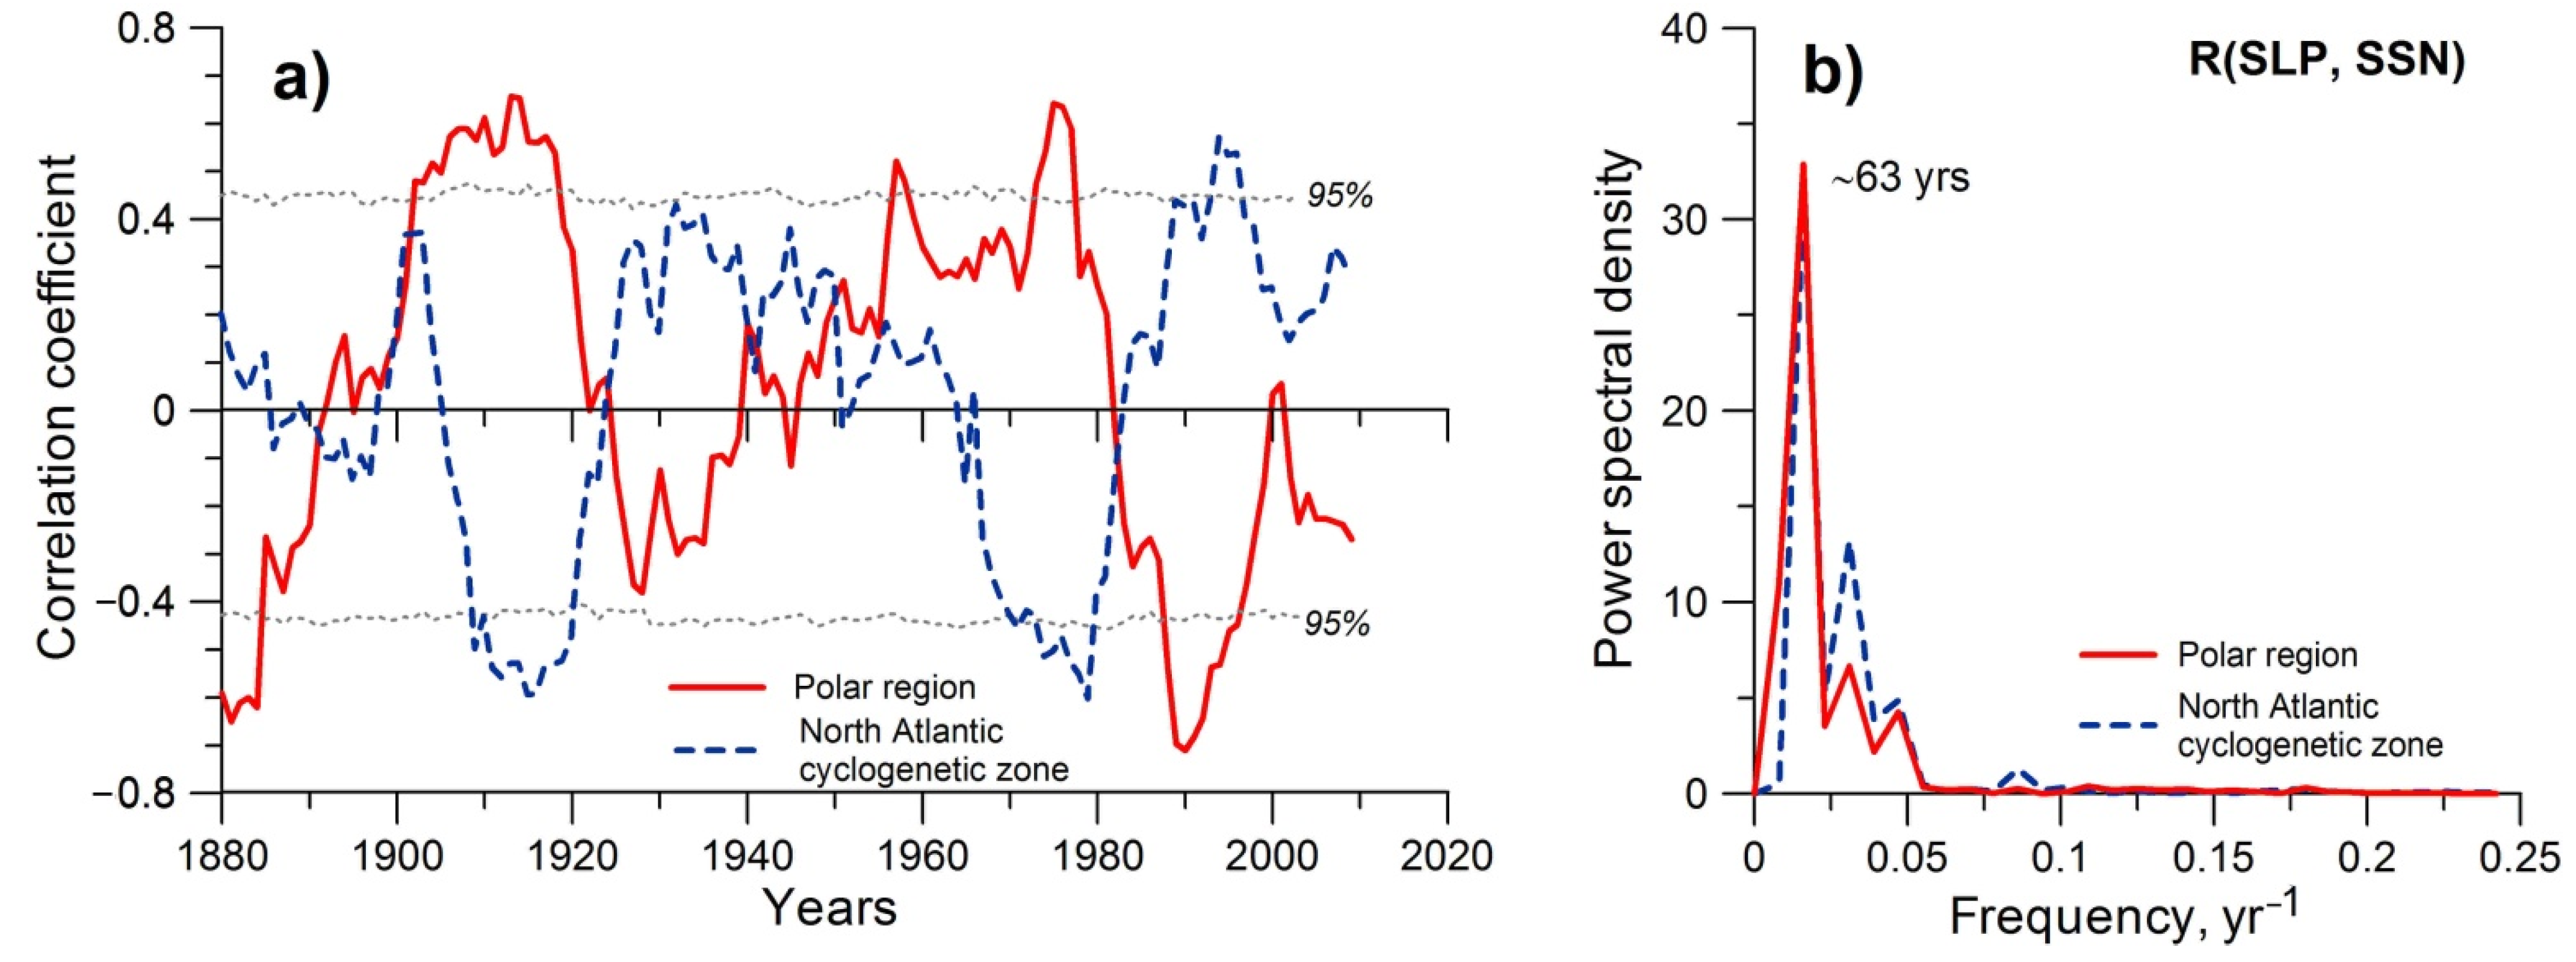
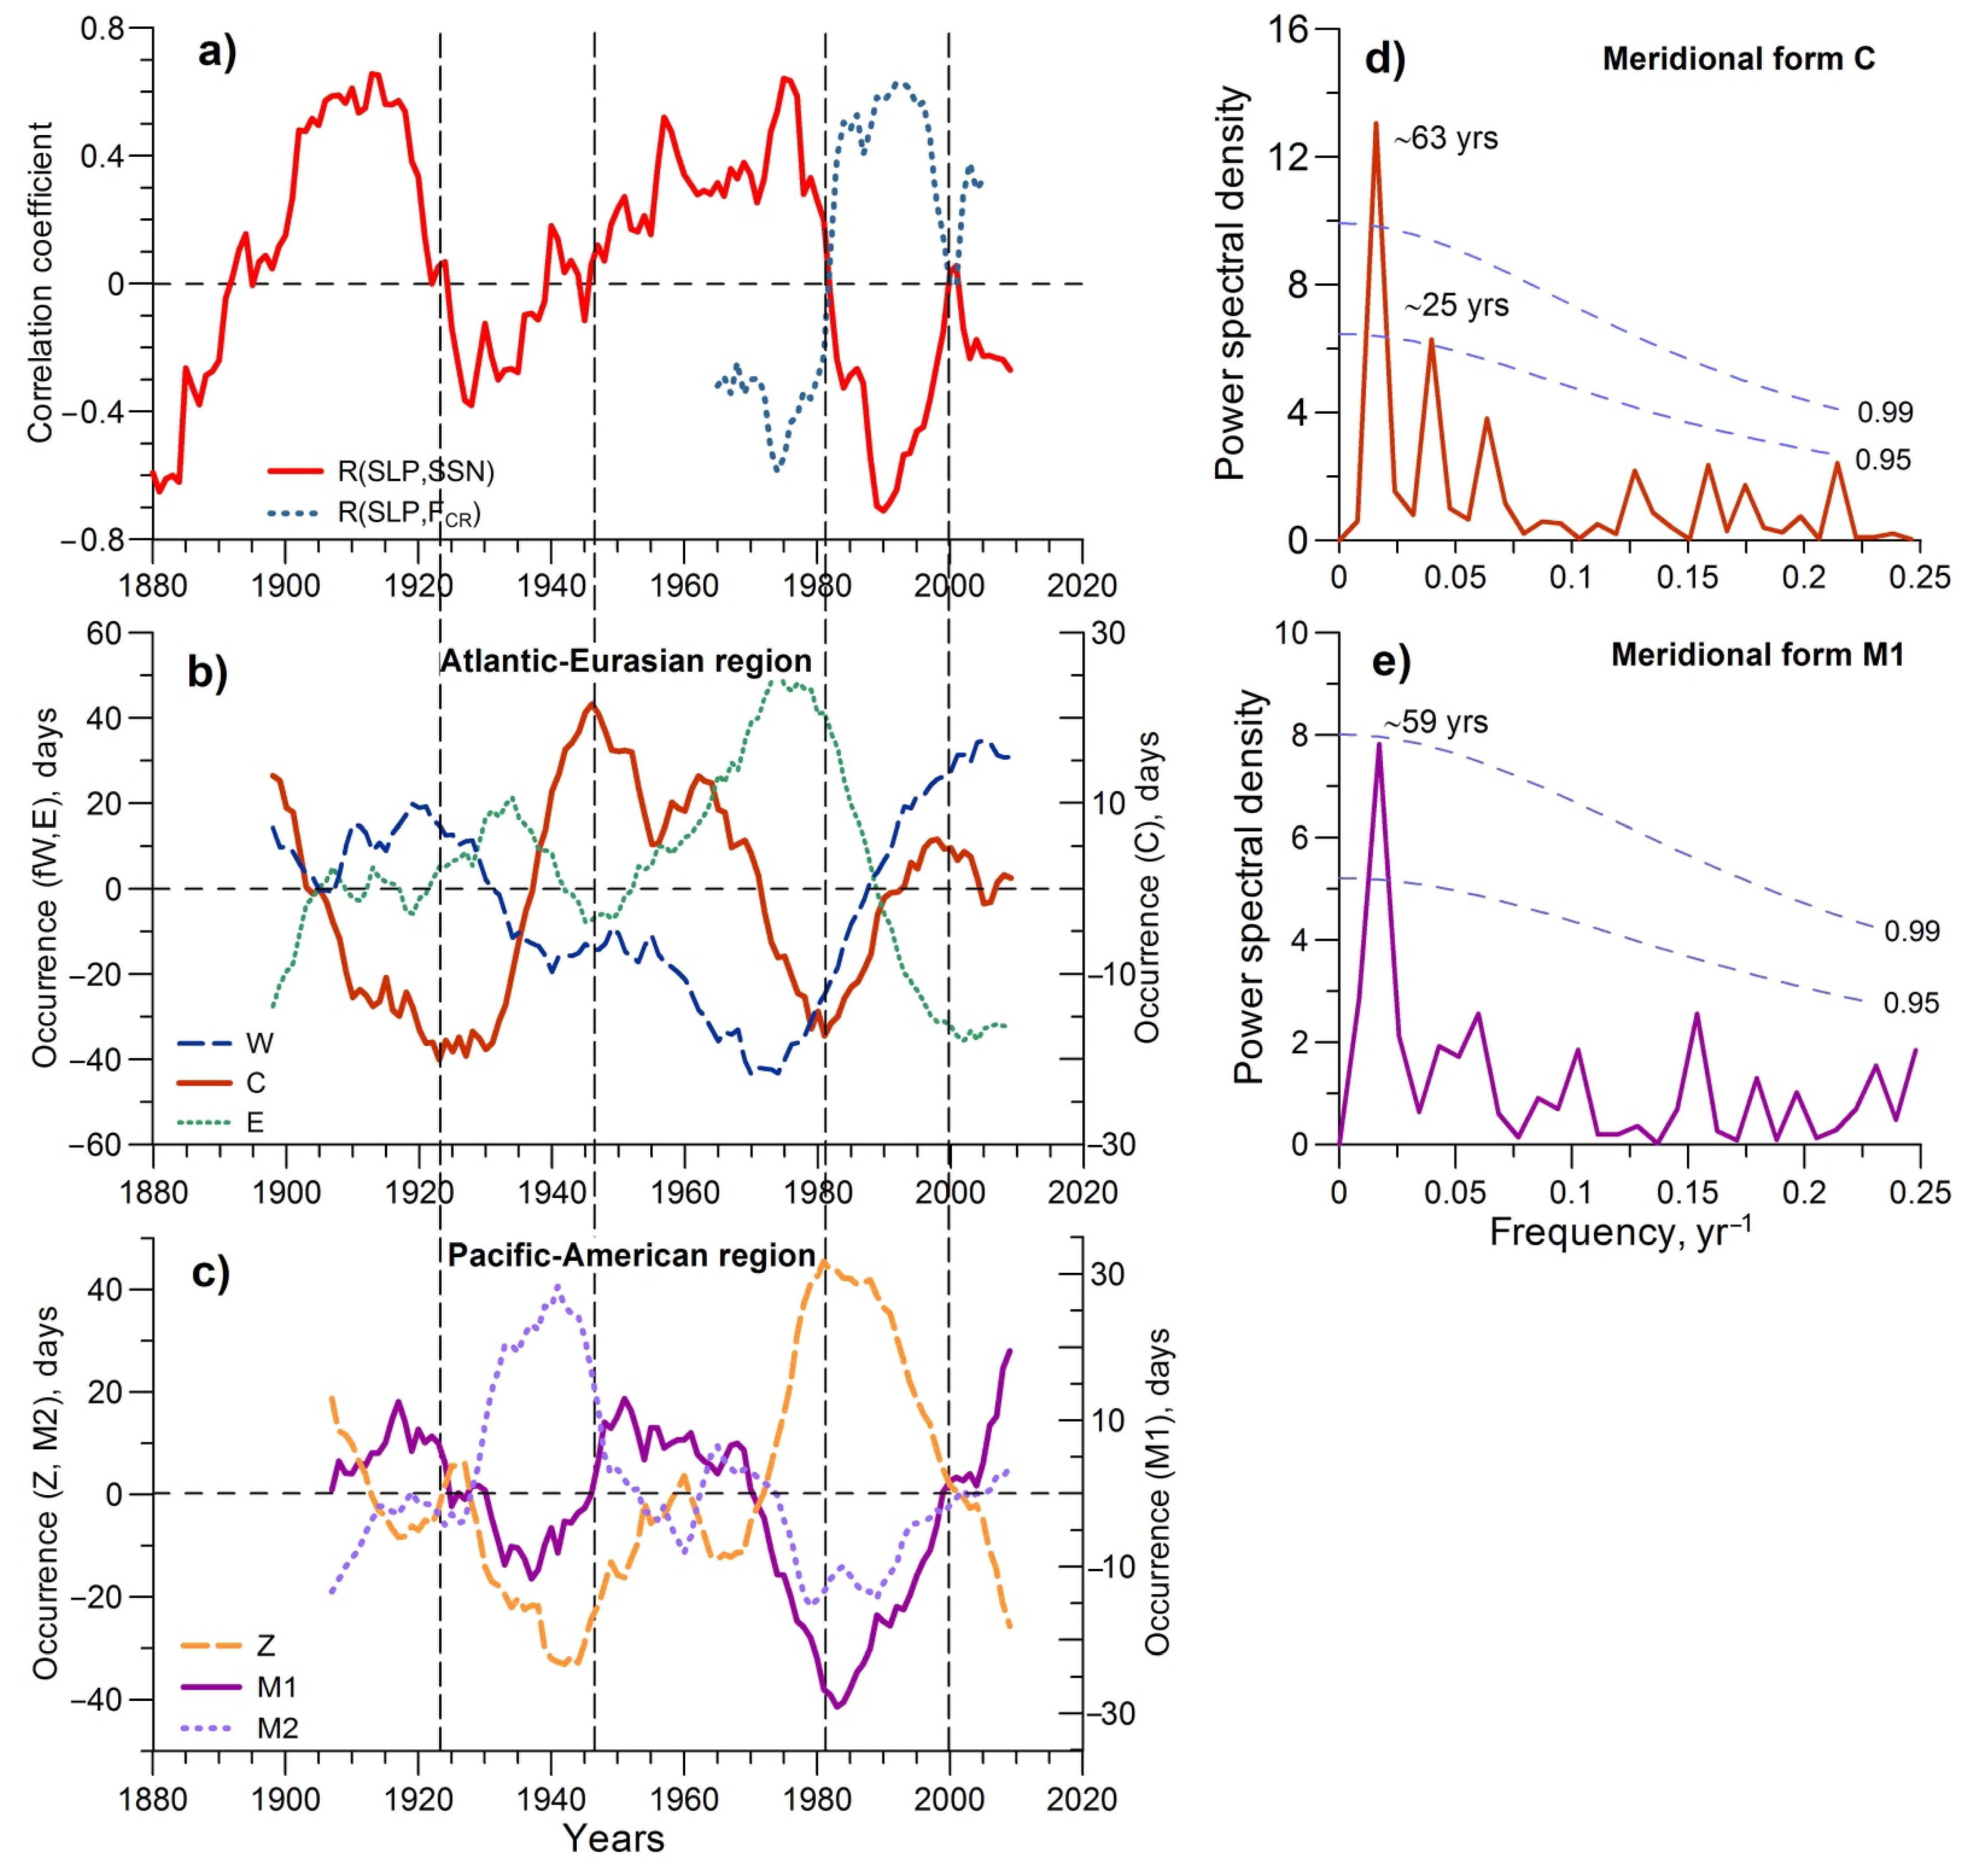
  • Temporal variability of solar activity phenomena on the circulation of the lower atmosphere reveals a roughly 60-year periodicity that seems to be associated with changes in the epochs of large-scale circulation. The reversals of correlation links between troposphere pressure variations at extratropical latitudes (development of extratropical baric systems) and solar activity phenomena were found to coincide with the turning points in the evolution of the main forms of atmospheric circulation according to the Vangengeim–Girs classification.
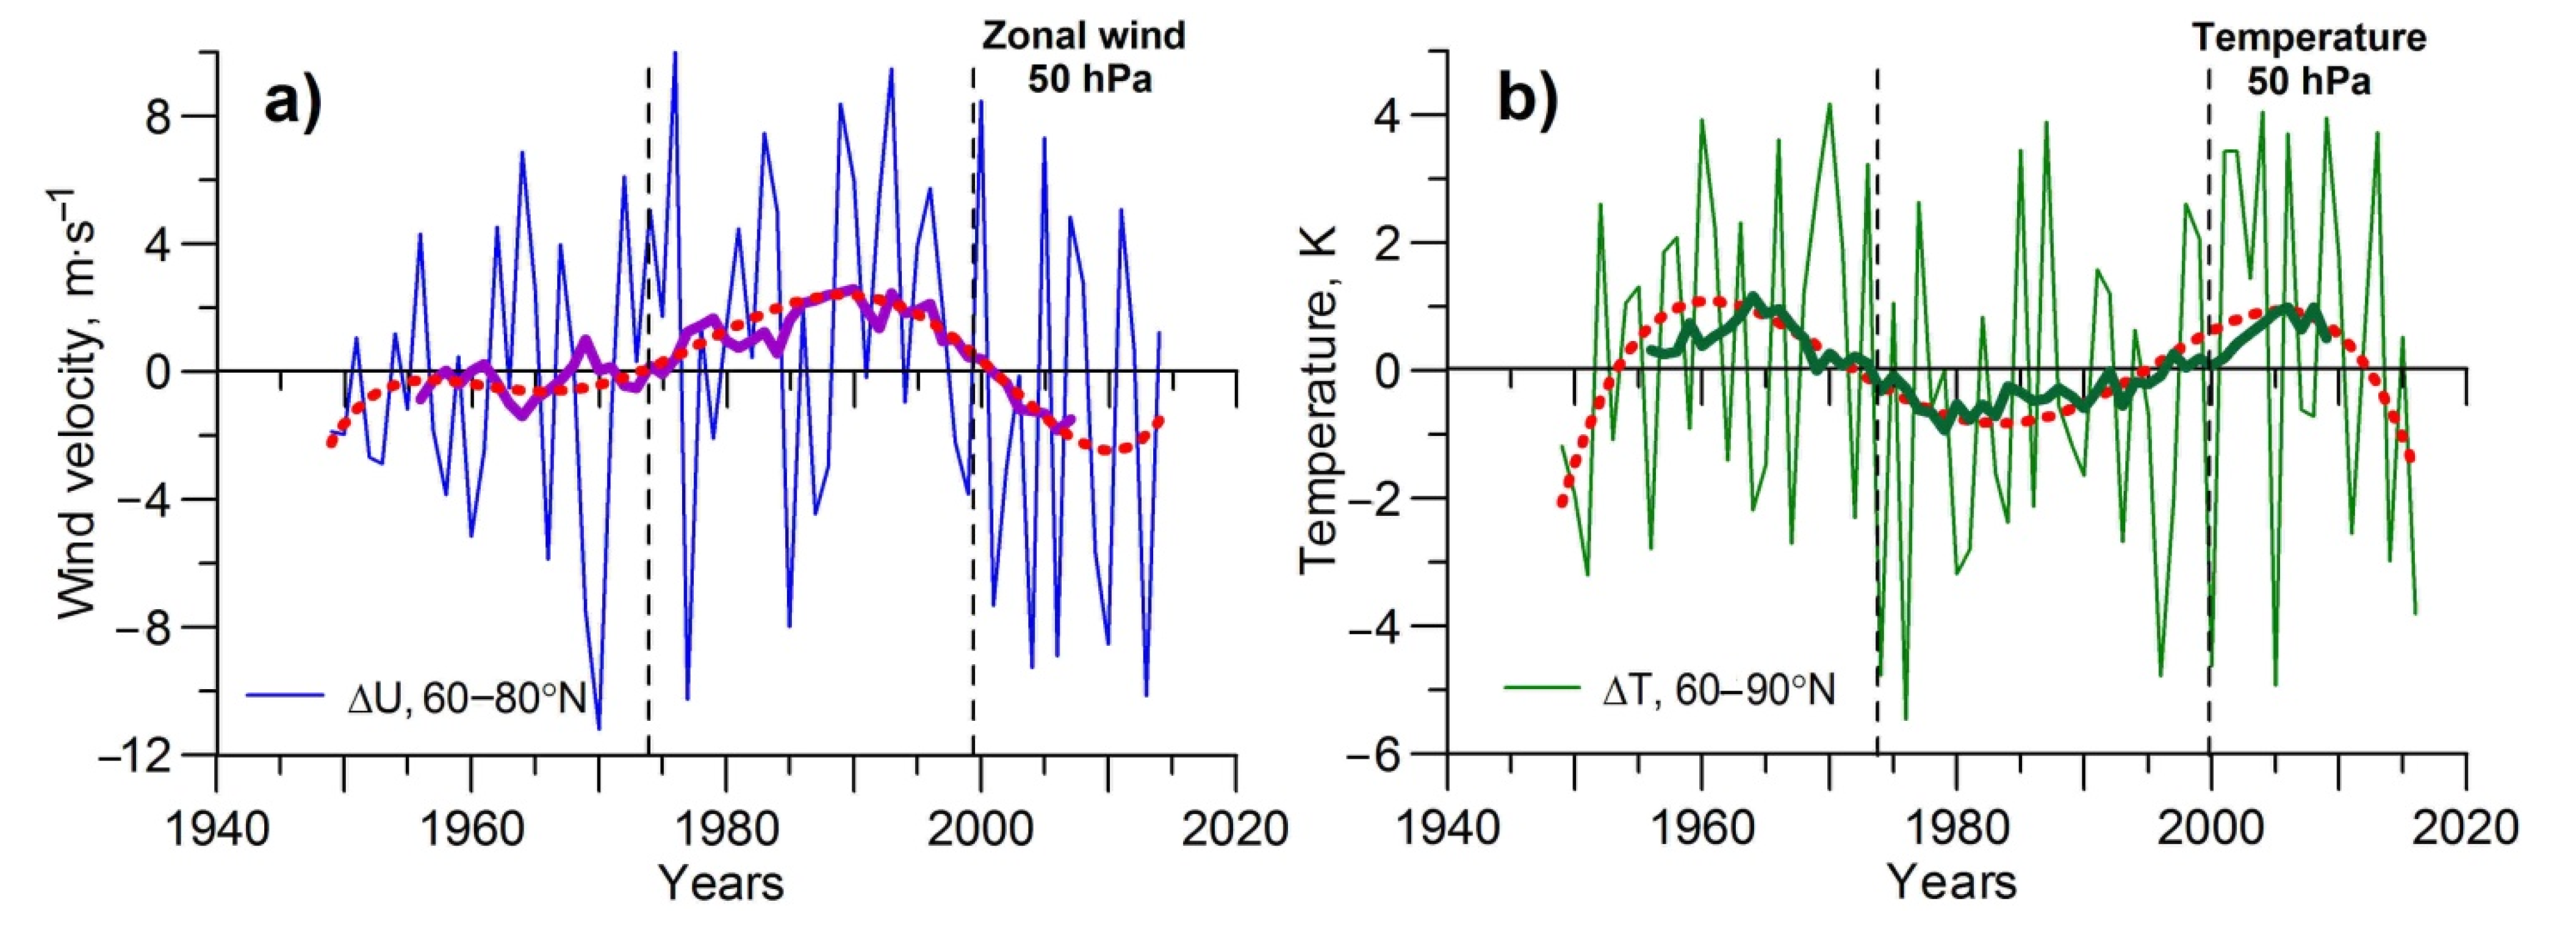
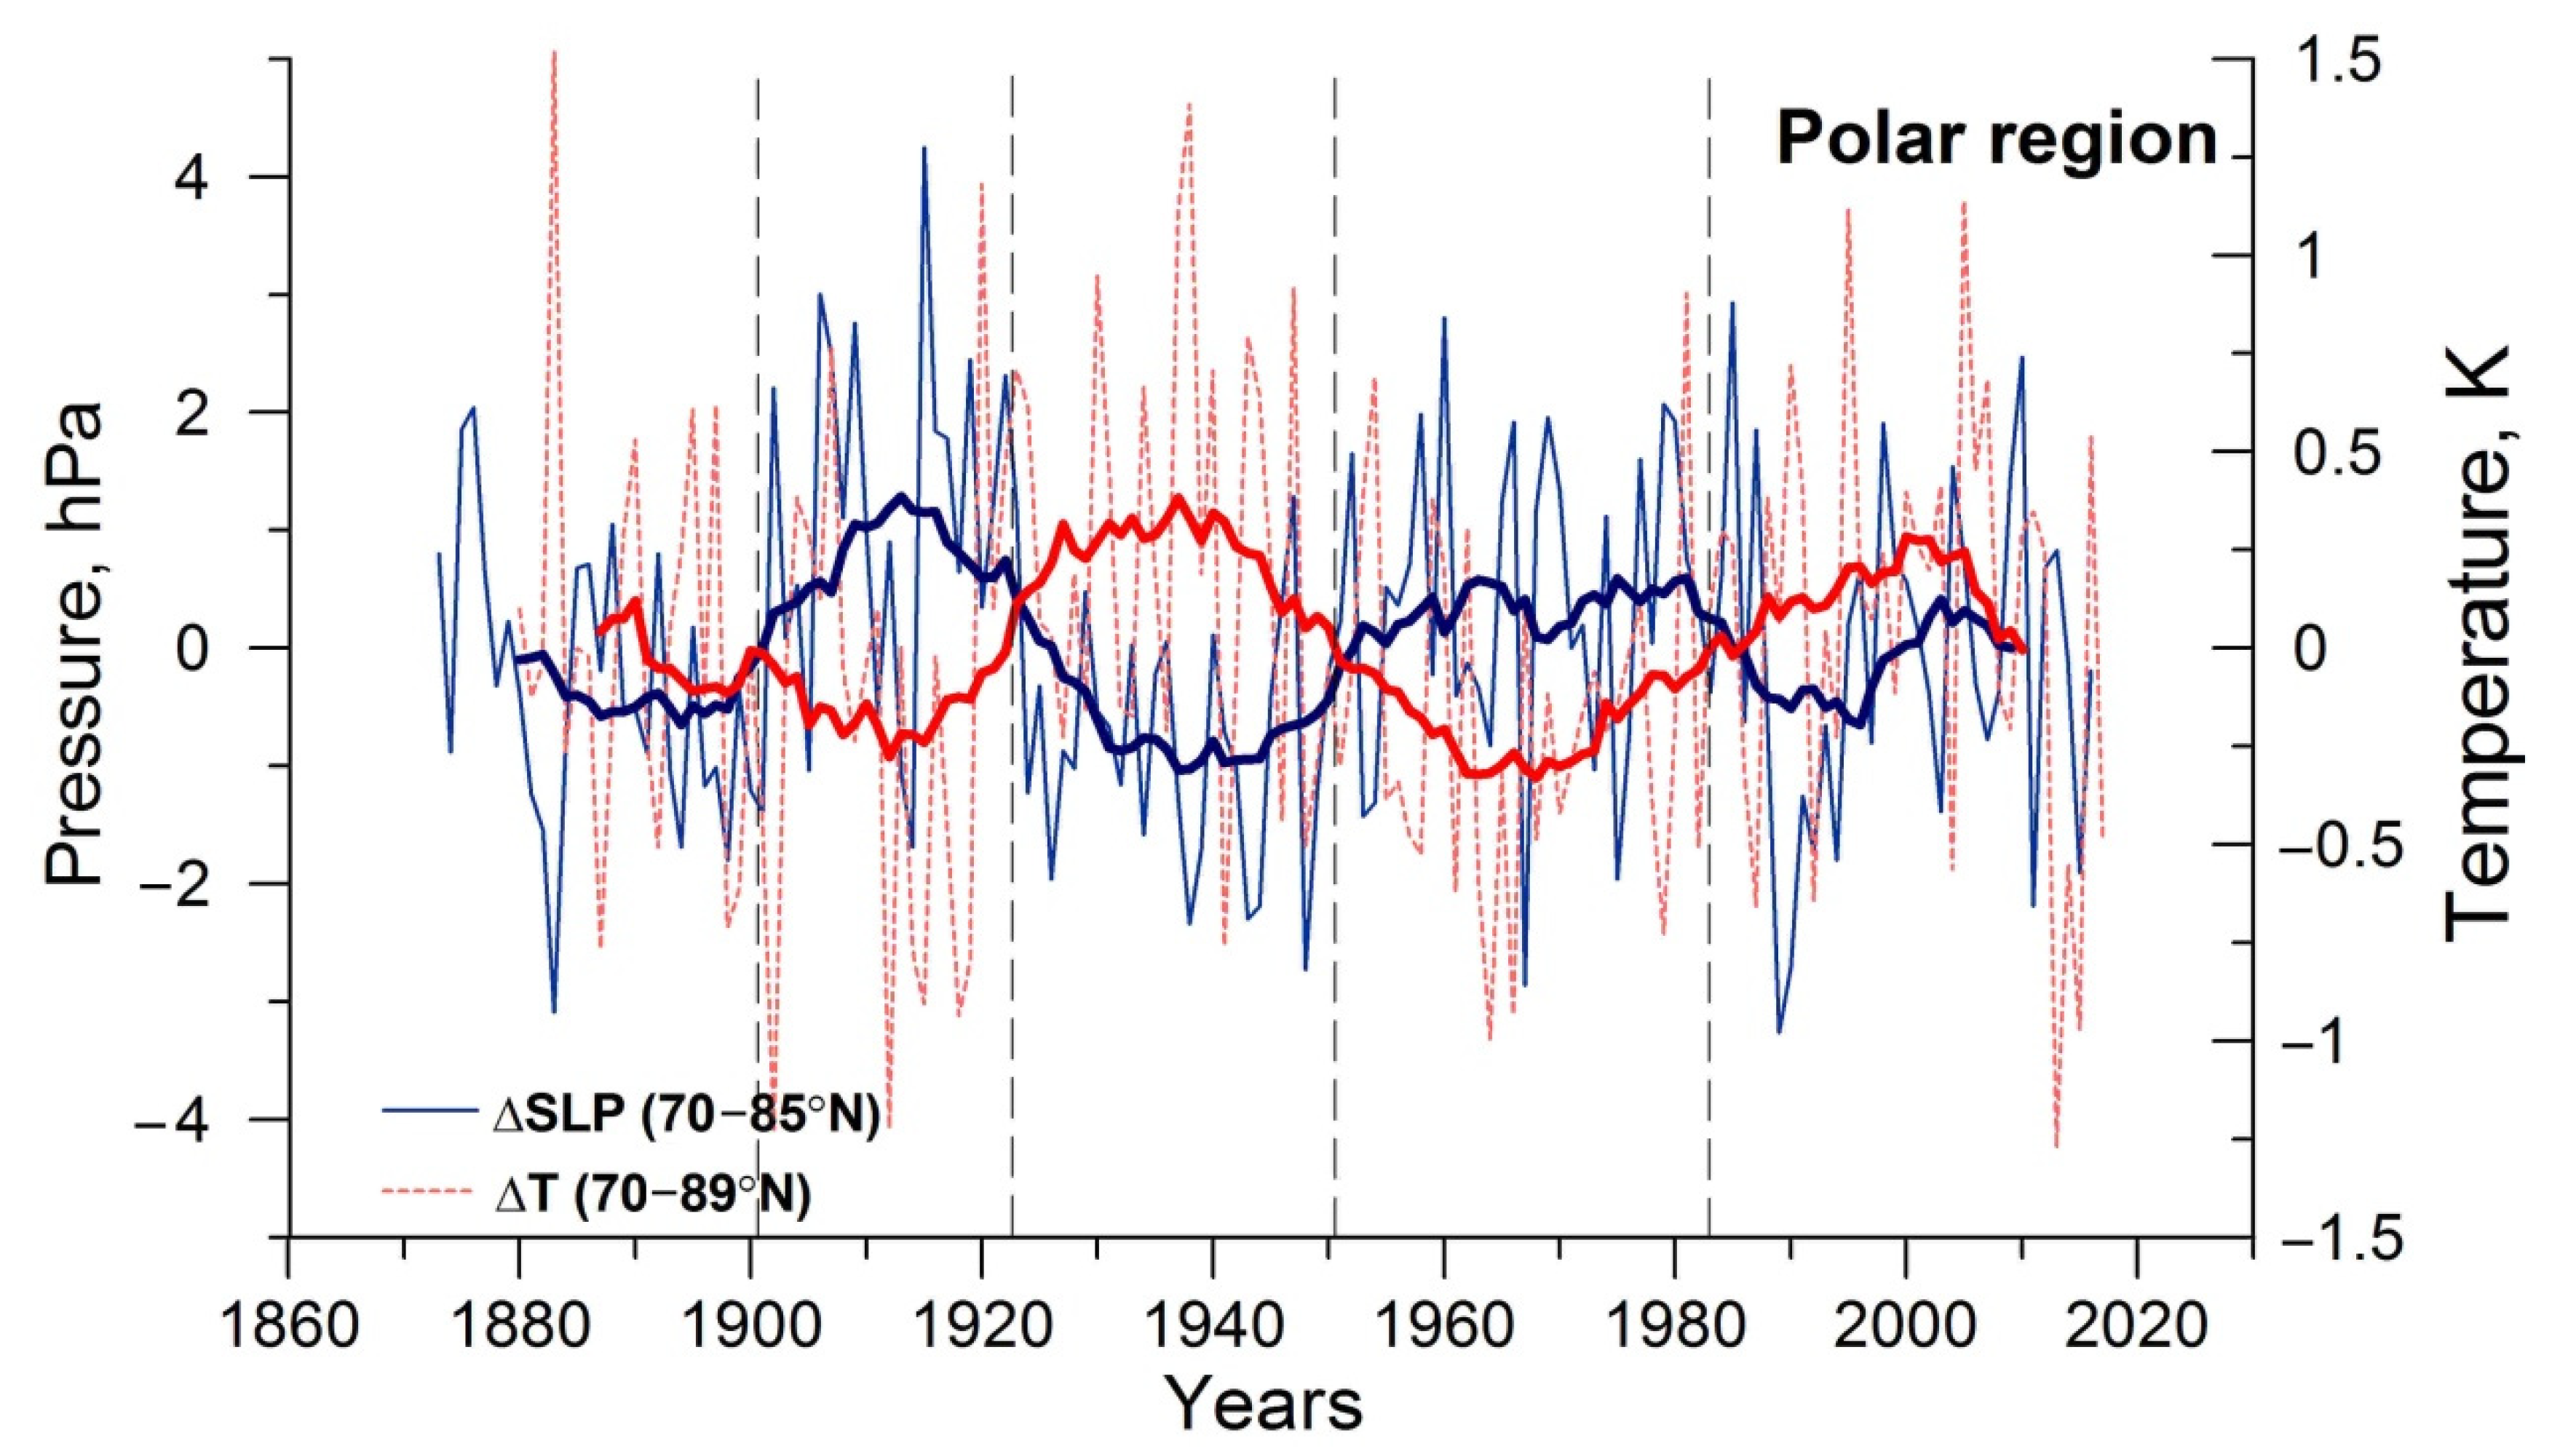
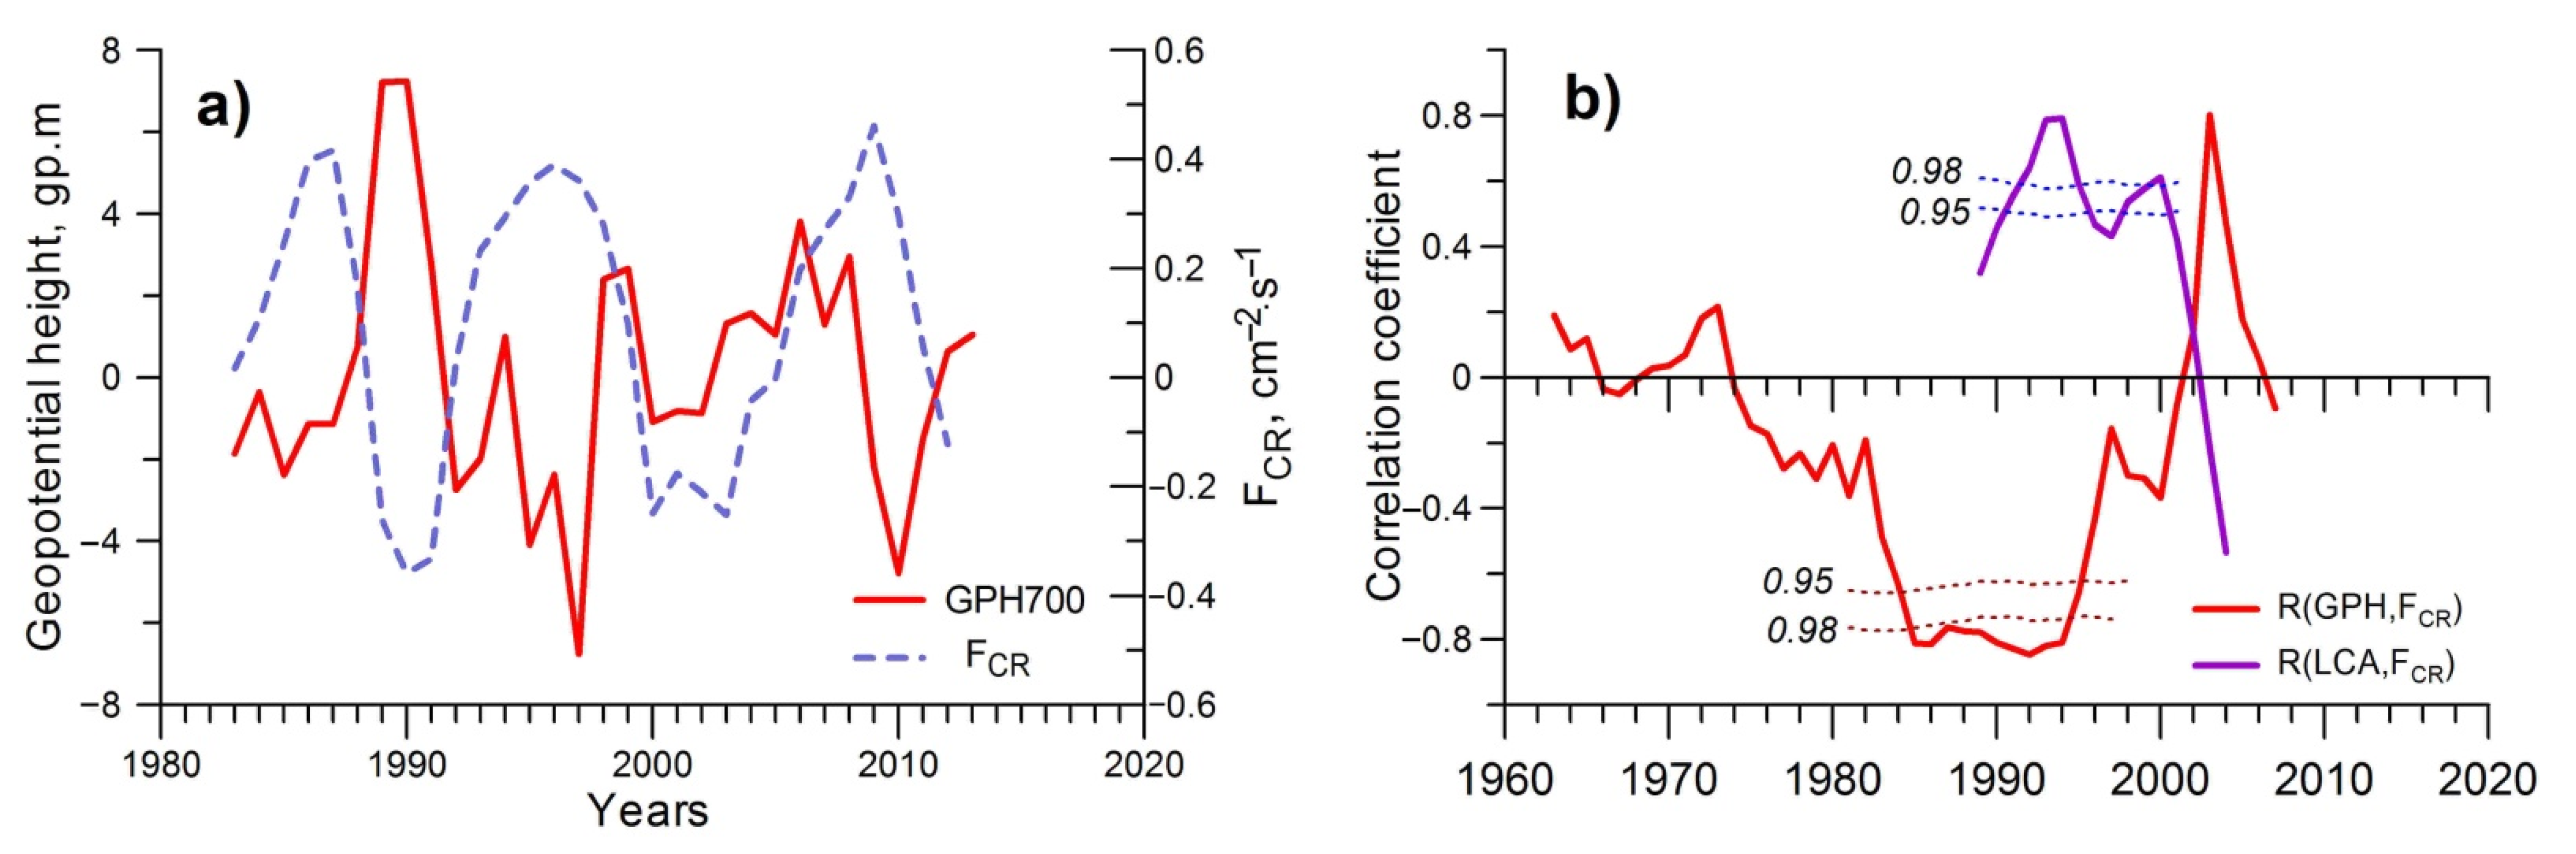
  • In turn, changes in the circulation epochs seem to be related to the transitions between the different states of the stratospheric polar vortex. As follows from the analysis of the stratospheric data and sea level pressure/temperature oscillations at polar latitudes, the intensity of the vortex undergoes oscillations with a period close to 60 years. Under a strong vortex, increases in GCR fluxes contribute to the intensification of extratropical cyclones, whereas under a weak vortex, the effects change the sign. The intensification of extratropical cyclogenesis associated with GCR increases under a strong vortex regime resulted in a high positive correlation between cloudiness and GCR intensity in ~1980–2000. A sharp weakening of the vortex near 2000 seems to be a possible reason for the destruction of this correlation. The obtained results show that the stratospheric polar vortex plays an important part in the mechanism of solar–atmospheric links, which seems to be due to its capability to affect troposphere–stratosphere interaction via planetary waves.
  • The state of the polar vortex may be affected by different solar activity phenomena contributing to a roughly 60-year oscillation of its intensity. A high-latitudinal location of the vortex is favorable for the effects of ionization increases associated with charged particle fluxes (solar and galactic cosmic rays as well as auroral and radiation belt electrons). The ionization increases result in changes in the chemical composition (ozone depletion), influencing the temperature regime of the polar atmosphere, as well as conductivity increases, influencing the vertical electric currents and microphysical processes in clouds.

Funding

This research received no external funding.

Institutional Review Board Statement

Not applicable.

Informed Consent Statement

Not applicable.

Data Availability Statement

NCEP Reanalysis data were provided by the NOAA/OAR/ESRL PSL, Boulder, Colorado, USA, from their Web site at https://psl.noaa.gov/, accessed on 29 May 2020. MSLP data were provided by the Climatic Research Unit, University of East Anglia https://crudata.uea.ac.uk/cru/data/pressure, accessed on 10 August 2004, and the Earth System Research Laboratory, NOAA https://www.esrl.noaa.gov/psd/repository, accessed on 7 November 2017. Temperature data were taken from GISS Surface Temperature Analysis http://data.giss.nasa.gov/gistemp/source, accessed on 13 April 2018. Sunspot numbers were taken from World Data Center WDC-SILSO, Royal Observatory of Belgium http://www.sidc.be/silso/datafiles, accessed on 27 November 2017. Climax neutron monitor data were obtained from the NOAA National Geophysical Data Center at ftp://ftp.ngdc.noaa.gov/STP/, accessed on 17 January 2007. Ionization rates were obtained from SOLARIS-HEPPA at https://solarisheppa.geomar.de/, accessed on 24 January 2017. Cloud data were taken from ISCCP D2 http://isccp.giss.nasa.gov/pub/data/D2CLOUDTYPES, accessed on 4 August 2015. GOES-11 satellite data were obtained at http://spidr.ngdc.noaa.gov, accessed on 15 February 2008. Magnetic storm data are available at http://www.izmiran.ru/magnetism/magobs/MagneticStormCatalog.html, accessed on 19 January 2019. Cosmic ray fluxes in the stratosphere were provided by Lebedev Physical Institute, Solar and Cosmic Ray Physics Laboratory, at https://sites.lebedev.ru/ru/sites/DNS_FIAN.html, accessed on 13 July 2020.

Acknowledgments

The author is grateful to V. Ivanov (Arctic and Antarctic Research Institute, St. Petersburg) for providing data on Vangemgeim–Girs circulation forms and helpful discussion, as well as to anonymous referees for their constructive comments.

Conflicts of Interest

The authors declare no conflict of interest.

References

  1. Girs, A.A. Macro-Circulation Method of Long-Term Meteorological Forecasts; Gidrometeoizdat: Leningrad, Russia, 1974. [Google Scholar]
  2. Kanamitsu, M.; Ebisuzaki, W.; Woollen, J.; Yang, S.-K.; Hnilo, J.; Fiorino, M.; Potter, G.L. NCEP-DOE AMIP-II Reanalysis (R-2). Bull. Am. Meteorol. Soc. 2002, 83, 1631–1643. [Google Scholar] [CrossRef]
  3. Kalnay, E.; Kanamitsu, M.; Kistler, R.; Collins, W.; Deaven, D.; Gandin, L.; Iredell, M.; Saha, S.; White, G.; Woolen, G.; et al. The NCEP/NCAR 40-year reanalysis project. Bull. Am. Meteorol. Soc. 1996, 77, 437–472. [Google Scholar] [CrossRef] [Green Version]
  4. Solomon, S. Progress towards a quantitative understanding of Antarctic ozone depletion. Nature 1990, 347, 347–353. [Google Scholar] [CrossRef]
  5. Baldwin, M.P.; Dunkerton, T.J. Stratospheric harbingers of anomalous weather regimes. Science 2001, 294, 581–584. [Google Scholar] [CrossRef]
  6. Gudkovich, Z.M.; Karklin, V.P.; Smolyanitsky, V.M.; Frolov, I.E. On the character and causes of the Earth’s climate change. Probl. Arctic Antarct. 2009, 81, 15–23. [Google Scholar]
  7. Labitzke, K. Sunspots, the QBO, and the stratospheric temperature in the north-pole region. Geophys. Res. Lett. 1987, 4, 535–537. [Google Scholar] [CrossRef]
  8. Holton, J.R.; Tan, H.C. The influence of the equatorial quasi-biennial oscillation on the global circulation at 50 mb. J. Atmos. Sci. 1980, 37, 2200–2208. [Google Scholar] [CrossRef] [Green Version]
  9. Köppen, W. On temperature cycles. Nature 1873, 9, 184–185. [Google Scholar]
  10. Herman, J.R.; Goldberg, R.A. Sun, Weather and Climate; NASA Scientific and Technical Information Branch: Washington, DC, USA, 1978. [Google Scholar]
  11. Sánchez Santillán, N.; Esquivel Herrera, A.; Sánchez-Trejo, R. Evidences for a shift in barometric pressure, air temperature and rainfall pattern circa 1920 and its possible relation to solar activity. Hidrobiologica 2002, 12, 29–36. [Google Scholar]
  12. Georgieva, K.; Kirov, B.; Tonev, P.; Guineva, V.; Atanasov, D. Long-term variations in the correlation between NAO and solar activity: The importance of north-south solar activity asymmetry for atmospheric circulation. Adv. Space Res. 2007, 40, 1152–1166. [Google Scholar] [CrossRef] [Green Version]
  13. Thejll, P.; Christiansen, B.; Gleisner, H. On correlations between the North Atlantic Oscillation, geopotential heights, and geomagnetic activity. Geophys. Res. Lett. 2003, 30, 1347. [Google Scholar] [CrossRef]
  14. Lukianova, R.; Alekseev, G. Long-term correlation between the NAO and solar activity. Sol. Phys. 2004, 224, 445–454. [Google Scholar] [CrossRef]
  15. Georgieva, K.; Kirov, B.; Koucká-Knížová, P.; Mošna, Z.; Kouba, D.; Asenovska, Y. Solar influences on atmospheric circulation. J. Atmos. Sol. Terr. Phys. 2012, 90–91, 15–25. [Google Scholar] [CrossRef]
  16. Marsh, N.; Svensmark, H. Low cloud properties influenced by cosmic rays. Phys. Rev. Lett. 2000, 85, 5004–5007. [Google Scholar] [CrossRef] [PubMed] [Green Version]
  17. Ney, E.P. Cosmic radiation and weather. Nature 1959, 183, 451–452. [Google Scholar] [CrossRef]
  18. Pudovkin, M.I.; Raspopov, O.M. The mechanism of action of solar activity on the state of lower atmosphere and meteorological parameters. Geomagn. Aeron. 1992, 32, 593–608. [Google Scholar]
  19. Miroshnichenko, L.I. Solar cosmic rays in the system of solar–terrestrial relations. J. Atm. Sol. Terr. Phys. 2008, 70, 450–466. [Google Scholar] [CrossRef]
  20. Tinsley, B.A. The global atmospheric electric circuit and its effects on cloud microphysics. Rep. Progr. Phys. 2008, 71, 66801–66900. [Google Scholar] [CrossRef]
  21. Bazilevskaya, G.A.; Usoskin, I.G.; Flückiger, E.O.; Harrison, R.G.; Desorgher, L.; ·Bütikofer, R.; Krainev, M.B.; Makhmutov, V.S.; ·Stozhkov, Y.I.; Svirzhevskaya, A.K.; et al. Cosmic Ray Induced Ion Production in the Atmosphere. Space Sci. Rev. 2008, 137, 149–173. [Google Scholar] [CrossRef]
  22. Veretenenko, S.; Thejll, P. Effects of energetic Solar Proton Events on the cyclone development in the North Atlantic. J. Atmos. Sol. Terr. Phys. 2004, 66, 393–405. [Google Scholar] [CrossRef]
  23. Veretenenko, S.; Thejll, P. Cyclone regeneration in the North Atlantic intensified by energetic solar proton events. Adv. Space Res. 2005, 35, 470–475. [Google Scholar] [CrossRef]
  24. Artamonova, I.; Veretenenko, S. Galactic cosmic ray variation influence on baric system dynamics at middle latitudes. J. Atmos. Sol. Terr. Phys. 2011, 73, 366–370. [Google Scholar] [CrossRef]
  25. Veretenenko, S.; Ogurtsov, M. Regional and temporal variability of solar activity and galactic cosmic ray effects on the lower atmosphere circulation. Adv. Space Res. 2012, 49, 770–783. [Google Scholar] [CrossRef]
  26. Veretenenko, S.; Ogurtsov, M. Stratospheric polar vortex as a possible reason for temporal variations of solar activity and galactic cosmic ray effects on the lower atmosphere circulation. Adv. Space Res. 2014, 54, 2467–2477. [Google Scholar] [CrossRef]
  27. Ebisuzaki, W. A method to estimate the statistical significance of a correlation when the data are serially correlated. J. Clim. 1997, 10, 2147–2153. [Google Scholar] [CrossRef]
  28. Khromov, S.P.; Petrociants, M.A. Meteorology and Climatology; Moscow University Press: Moscow, Russia, 1994. [Google Scholar]
  29. Clette, F.; Lefèvre, L. The new sunspot number: Assembling all corrections. Sol. Phys. 2016, 291, 2629–2651. [Google Scholar] [CrossRef] [Green Version]
  30. Veretenenko, S.; Ogurtsov, M. Manifestation and possible reasons of ~60-year oscillations in solar-atmospheric links. Adv. Space Res. 2019, 64, 104–116. [Google Scholar] [CrossRef]
  31. Vangengeim, G.Y. Principles of the macro-circulation methods of long-term meteorological forecasts for the Arctic. Tr. AANII 1952, 34, 11–66. [Google Scholar]
  32. Girs, A.A. About the creation of a unified classification of the macrosynoptic processes in the Northern hemisphere. Meteorol. I Gidrol. 1964, 4, 43–47. [Google Scholar]
  33. Bolotinskaya, M.S.; Ryzhakov, L.Y. Catalogue of Macrosynoptic Processes According to Vangengeim Classification 1891–1962; Arctic and Antarctic Research Institute: Leningrad, Russia, 1964. [Google Scholar]
  34. Stozhkov, Y.I.; Svirzhevsky, N.S.; Bazilevskaya, G.A.; Kvashnin, A.N.; Makhmutov, V.S.; Svirzhevskaya, A.K. Long-term (50 years) measurements of cosmic ray fluxes in the atmosphere. Adv. Space Res. 2009, 44, 1124–1137. [Google Scholar] [CrossRef]
  35. Torrence, C.; Compo, G.P. A practical guide to wavelet analyses. Bull. Am. Meteorol. Soc. 1998, 79, 61–78. [Google Scholar] [CrossRef] [Green Version]
  36. Perlwitz, J.; Graf, H.-F. Troposphere-stratosphere dynamic coupling under strong and weak polar vortex conditions. Geophys. Res. Lett. 2001, 28, 271–274. [Google Scholar] [CrossRef] [Green Version]
  37. Avdyushin, S.I.; Danilov, A.D. The Sun, weather, and climate: A present-day view of the problem (review). Geomagn. Aeron. 2000, 40, 545–555. [Google Scholar]
  38. Pudovkin, M.I.; Veretenenko, S.V. Cloudiness decreases associated with Forbush-decreases of galactic cosmic rays. J. Atmos. Terr. Phys. 1995, 57, 1349–1355. [Google Scholar] [CrossRef]
  39. Svensmark, H.; Friis-Christensen, E. Variations of cosmic ray flux and global cloud coverage – a missing link in solar–climate relationships. J. Atmos. Sol. Terr. Phys. 1997, 59, 1225–1232. [Google Scholar] [CrossRef]
  40. Erlykin, A.D.; Wolfendale, A.W. Cosmic ray effects on cloud cover and their relevance to climate change. J. Atmos. Sol. Terr. Phys. 2011, 73, 1681–1686. [Google Scholar] [CrossRef]
  41. Veretenenko, S.; Ogurtsov, M. Cloud cover anomalies at middle latitudes: Links to troposphere dynamics and solar variability. J. Atmos. Sol. Terr. Phys. 2016, 149, 207–218. [Google Scholar] [CrossRef]
  42. Veretenenko, S.; Ogurtsov, M.; Lindholm, M.; Jalkanen, R. Galactic cosmic rays and low clouds: Possible reasons for correlation reversal. In Cosmic Rays; Szadkowski, Z., Ed.; IntechOpen: Rijeka, Croatia, 2018; pp. 79–98. [Google Scholar]
  43. Matveev, L.T. Physics of Atmosphere; Gidrometeoizdat: St. Petersburg, Russia, 2000. [Google Scholar]
  44. Vorobjev, V.I. Synoptic Meteorology; Gidrometeoizdat: Leningrad, Russia, 1991. [Google Scholar]
  45. Carslaw, K.S.; Harrison, R.G.; Kirkby, J. Cosmic rays, clouds and climate. Science 2002, 298, 1732–1737. [Google Scholar] [CrossRef] [Green Version]
  46. Krivolutsky, A.A.; Repnev, A.I. Cosmic Influences on the Ozonosphere of the Earth; GEOS: Moscow, Russia, 2009. [Google Scholar]
  47. Veretenenko, S.V.; Ogurtsov, M.G. Influence of solar-geophysical factors on the state of the stratospheric polar vortex. Geomagn. Aeron. 2020, 60, 974–981. [Google Scholar] [CrossRef]
  48. Veretenenko, S. Effects of Solar Proton Events of January 2005 on the middle atmosphere dynamics in the Northern hemisphere. Adv. Space Res. 2021, 68, 1814–1824. [Google Scholar] [CrossRef]
  49. Veretenenko, S.V. Effects of energetic Solar Proton Events of solar cycle 23 on intensity of the stratospheric polar vortex. Geomagn. Aeron. 2021, 61, 985–992. [Google Scholar] [CrossRef]
  50. Veretenenko, S.; Ogurtsov, M.; Obridko, V. Long-term variability in occurrence frequencies of magnetic storms with sudden and gradual commencements. J. Atm. Sol. Terr. Phys. 2020, 205, 105295. [Google Scholar] [CrossRef]
  51. Tsurutani, B.T.; Gonzalez, W.D.; Gonzalez, A.L.C.; Guarnieri, F.L.; Gopalswamy, N.; Grande, M.; Kamide, Y.; Kasahara, Y.; Lu, G.; Mann, I.; et al. Corotating solar wind streams and recurrent geomagnetic activity: A review. J. Geophys. Res. 2006, 111, A07S01. [Google Scholar] [CrossRef] [Green Version]
  52. Veretenenko, S.V.; Ogurtsov, M.G.; Obridko, V.N.; Tlatov, A.G. Long-Term Variations in Coronal Hole Areas and Occurrence of Magnetic Storms with Gradual Commencements. Geomagn. Aeron. 2021, 61, 964–971. [Google Scholar] [CrossRef]
  53. Hoyt, D.V.; Shatten, K.H. A discussion of plausible solar irradiance variations, 1700–1992. J. Geophys. Res. 1993, 98, 18895–18906. [Google Scholar] [CrossRef] [Green Version]
  54. Scafetta, N.; Willson, R.C. ACRIM total solar irradiance satellite composite validation versus TSI proxy models. Astrophys. Space Sci. 2014, 350, 421–442. [Google Scholar] [CrossRef] [Green Version]
  55. Rusch, D.W.; Gerard, J.-C.; Solomon, S.; Crutzen, P.J.; Reid, G.C. The effect of particle precipitation events on the neutral and ion chemistry of the middle atmosphere I. Odd nitrogen. Planet Space Sci. 1981, 29, 767–774. [Google Scholar] [CrossRef]
  56. Solomon, S.; Rusch, D.W.; Gerard, J.-C.; Reid, G.C.; Crutzen, P.J. The effect of particle precipitation events on the neutral and ion chemistry of the middle atmosphere: II. Odd hydrogen. Planet Space Sci. 1981, 29, 885–893. [Google Scholar] [CrossRef]
  57. Brasseur, G.P.; Solomon, S. Aeronomy of the Middle Atmosphere; Springer: Dordrecht, The Netherlands, 2005. [Google Scholar]
  58. Weeks, L.H.; Cuikay, R.S.; Corbin, J.R. Ozone measurements in the mesosphere during the solar proton event of 2 November 1969. J. Atmos. Sci. 1972, 29, 1138–1142. [Google Scholar] [CrossRef] [Green Version]
  59. Heath, D.F.; Kruger, A.J.; Crutzen, P.J. Solar proton event: Influence on stratospheric ozone. Science 1977, 197, 886–889. [Google Scholar] [CrossRef]
  60. Zadorozhny, A.M.; Kiktenko, V.N.; Kokin, G.A.; Tuchkov, G.A.; Tyutin, A.A.; Chizhov, A.F.; Shtrikov, O.V. Middle atmosphere response to the solar proton events of October 1989 using the results of rocket measurements. J. Geophys. Res. 1994, 99, 21059–21069. [Google Scholar] [CrossRef]
  61. Jackman, C.H.; McPeters, R.D.; Labow, G.J.; Fleming, E.L. Northern Hemisphere atmospheric effects due to the July 2000 solar proton event. Geophys. Res. Lett. 2001, 28, 2883–2886. [Google Scholar] [CrossRef] [Green Version]
  62. Seppälä, A.; Verronen, P.T.; Kyrölä, E.; Hassinen, S.; Backman, L.; Hauchecorne, A.; Bertaux, J.L.; Fussen, D.E. Solar proton events of October-November 2003: Ozone depletion in the Northern hemisphere polar winter as seen by GOMOS/ENVISAT. Geophys. Res. Lett. 2004, 31, L19107. [Google Scholar] [CrossRef] [Green Version]
  63. Jackman, C.H.; Marsh, D.R.; Vitt, F.M.; Roble, R.G.; Randall, C.E.; Bernath, P.F.; Funke, B.; López-Puertas, M.; Versick, S.; Stiller, G.P.; et al. Northern Hemisphere atmospheric influence of the solar proton events and ground level enhancement in January 2005. Atmos. Chem. Phys. 2011, 11, 6153–6166. [Google Scholar] [CrossRef] [Green Version]
  64. Krivolutsky, A.A.; Klyuchnikova, A.V.; Zakharov, G.R.; Vyushkova, T.Y.; Kuminov, A.A. Dynamical response of the middle atmosphere to solar proton event of July 2000: Three-dimensional model simulations. Adv. Space Res. 2006, 37, 1602–1613. [Google Scholar] [CrossRef]
  65. Baker, D.N.; Mason, G.M.; Mazur, J.E. A small spacecraft mission with large accomplishments. Eos 2012, 93, 325–326. [Google Scholar] [CrossRef]
  66. Jackman, C.H. Effects of energetic particles on minor constituents of the middle atmosphere. J. Geomagn. Geoelectr. 1991, 43 (Suppl. S2), 637–646. [Google Scholar] [CrossRef] [Green Version]
  67. Baumgaertner, A.J.G.; Seppälä, A.; Jöckel, P.; Clilverd, M.A. Geomagnetic activity related NOx enhancements and polar surface air temperature variability in a chemistry climate model: Modulation of the NAM index. Atmos. Chem. Phys. 2011, 11, 4521–4531. [Google Scholar] [CrossRef] [Green Version]
  68. Rozanov, E.; Calisto, M.; Egorova, T.; Peter, T.; Schmutz, W. Influence of the precipitating energetic particles on atmospheric chemistry and climate. Surv. Geophys. 2012, 33, 483–501. [Google Scholar] [CrossRef] [Green Version]
  69. Hu, H.; Holzworth, R.H. Observations and parameterization of the stratospheric electrical conductivity. J. Geophys. Res. 1996, 101, 29539–29552. [Google Scholar] [CrossRef]
  70. Markson, R.; Muir, M. Solar wind control of the Earth’s electric field. Science 1980, 208, 979–990. [Google Scholar] [CrossRef] [PubMed]
  71. Holzworth, R.H.; Norville, K.W.; Williamson, P.R. Solar flare perturbations in stratospheric current systems. Geophys. Res. Lett. 1987, 14, 852–855. [Google Scholar] [CrossRef]
  72. Tinsley, B.A. Uncertainties in evaluating global electric circuit interactions with atmospheric clouds and aerosols, and consequences for radiation and dynamics. J. Geophys. Res. 2022, 127, e2021JD035954. [Google Scholar] [CrossRef]
  73. Frederick, J.E.; Tinsley, B.A. The response of longwave radiation at the South Pole to electrical and magnetic variations: Links to meteorological generators and the solar wind. J. Atmos. Sol. Terr. Phys. 2018, 179, 214–224. [Google Scholar] [CrossRef]
  74. Frederick, J.E.; Tinsley, B.A.; Zhou, L. Relationships between the solar wind magnetic field and ground-level longwave irradiance at high northern latitudes. J. Atmos. Sol. Terr. Phys. 2019, 193, 105063. [Google Scholar] [CrossRef]
Figure 1. (a) Distribution of mean monthly velocity of zonal wind (in m·s−1) at the 20 hPa level in the Northern Hemisphere in January 2005; (b) mean monthly values of zonally averaged velocities of zonal wind (in m·s−1) at different altitudes, January 2005.
Atmosphere 13 01132 g001
Figure 2. (a) Distribution of mean monthly temperature (in °C) at the 20 hPa level in the Northern Hemisphere in January 2005. The white asterisk indicates the minimal temperature inside the vortex; (b) distribution of mean monthly magnitude of the horizontal gradient of temperature (in °C/100 km) at the 20 hPa level in January 2005.
Atmosphere 13 01132 g002
Figure 3. Spatial distribution of the correlation coefficients between mean yearly values of GPH700 and NM counting rate in Climax for the periods 1982–2000 (a) and 1953–1981 (b). Curves 1 and 2 show the climatic positions of Arctic fronts in January and July, respectively. Similarly, curves 3 and 4 are the same for Polar fronts; curves 5 and 6 are the same for the equatorial trough axis.
Atmosphere 13 01132 g003
Figure 4. (a) Correlation coefficients between yearly values of sea level pressure and sunspot numbers R (SLP, SSN) for the Polar region (solid line) and the North Atlantic cyclogenetic zone (dashed line) for sliding 15-year intervals. Dotted lines show the 95% significance level. (b) Fourier spectra of sliding correlation coefficients R (SLP, SSN) for the Polar region (solid line) and the North Atlantic cyclogenetic zone (dashed line).
Atmosphere 13 01132 g004
Figure 5. Left: Solar activity effects on troposphere pressure in the Polar region (60–85° N) and the evolution of large-scale atmospheric circulation: (a) correlation coefficients SSN R (SLP, SSN) between mean yearly values of SLP and sunspot numbers (solid line) and R (SLP, FCR) between SLP and GCR fluxes (dotted line) for 15-year sliding intervals; (b) annual occurrences (number of days during a year) of the main circulation forms according to the Vangengeim–Girs classification in the Atlantic–Eurasian region (15-year running averages); (c) the same in the Pacific–American region. Vertical dashed lines separate the periods of positive and negative correlations between SLP and SSN. Right: Fourier spectra of annual occurrences of the meridional circulation forms C in the Atlantic-Eurasian region (d) and M1 in the Pacific-American region (e). Dashed lines show the confidence levels calculated relative to the “red noise” with AR(1) coefficients α = 0.36 (d) and 0.27 (e).
Atmosphere 13 01132 g005
Figure 6. Mean winter (December–February) values of zonal wind velocity in the latitudinal belt of 60–80° N (a) and stratospheric temperature in the region of 60–90° N (b) at the 50 hPa level (after the linear trend removal). Thick solid and dotted lines show 15-year running averages and polynomial fits, respectively. Vertical dashed lines separate the periods with a strong and weak polar vortex.
Atmosphere 13 01132 g006
Figure 7. Temporal variations in mean yearly values of sea level pressure and temperature in the Polar region (after the polynomial trend removal). Thick lines show 15-year running averages. Vertical dashed lines separate the periods with a strong and weak polar vortex.
Atmosphere 13 01132 g007
Figure 8. Monthly values of LCA at middle latitudes 30–60° N in the Northern (a) and Southern (b) hemispheres compared to GCR fluxes FCR at the mid-latitudinal station Dolgoprudny (after the linear trend removal). Thick lines show 12-month running averages of LCA.
Atmosphere 13 01132 g008
Figure 9. (a) Mean yearly values of GPH700 anomalies at the latitudes of 30–60° N (solid line) and GCR fluxes FCR at the mid-latitudinal station Dolgoprudny (dashed line) after the linear trend removal; (b) correlation coefficients for sliding 11-year intervals between mean yearly values of GPH700 anomalies and FCR (red line) and between LCA and FCR (purple line). Dotted lines show the confidence levels of the correlation coefficients.
Atmosphere 13 01132 g009
Figure 10. (a) Integral fluxes of protons with energies >5, >50, and >100 MeV according to the satellite GOES-11 data; (b) daily mean ionization rates at geomagnetic latitudes 60–90° on the days of SPEs in January 2005.
Atmosphere 13 01132 g010
Figure 11. (a) Maximal values of western wind velocity Umax at different stratospheric levels in the vortex formation area (winter 2004/2005); (b) temporal variations in the areas covered by strong western winds in the upper stratosphere in January 2005 (detrended values); (c) the areas of western winds with U > 105 m·s−1 and U > 60 m·s−1 at the levels 10 and 50 hPa, respectively. The disturbed period of 15–23 January is highlighted with a gray background.
Atmosphere 13 01132 g011
Figure 12. Distribution of daily mean values of zonal wind velocity (in m·s−1) at the 50 hPa level: (a) before the onset of the SPE series (13 January 2005); (b) after the onset of the SPE series (19 January 2005). The areas covered by western winds with U > 40 m·s−1 are highlighted in dark brown. White asterisks indicate maximal values of zonal wind velocity (Umax).
Atmosphere 13 01132 g012
Figure 13. (a) Annual occurrences of magnetic storms with gradual commencements (GC) with intensities from moderate to very large (detrended values); (b) variations in the reconstructed TSI (detrended values). The thick lines show the polynomial fits, and the dotted lines show running averages over 15-year (a) and 21-year (b) intervals.
Atmosphere 13 01132 g013
Publisher’s Note: MDPI stays neutral with regard to jurisdictional claims in published maps and institutional affiliations.

