
Impact of Climate and Land-Use Change on Groundwater Resources, Study of Faisalabad District, Pakistan

 , , , and
Abstract
:1. Introduction
2. Materials and Methods
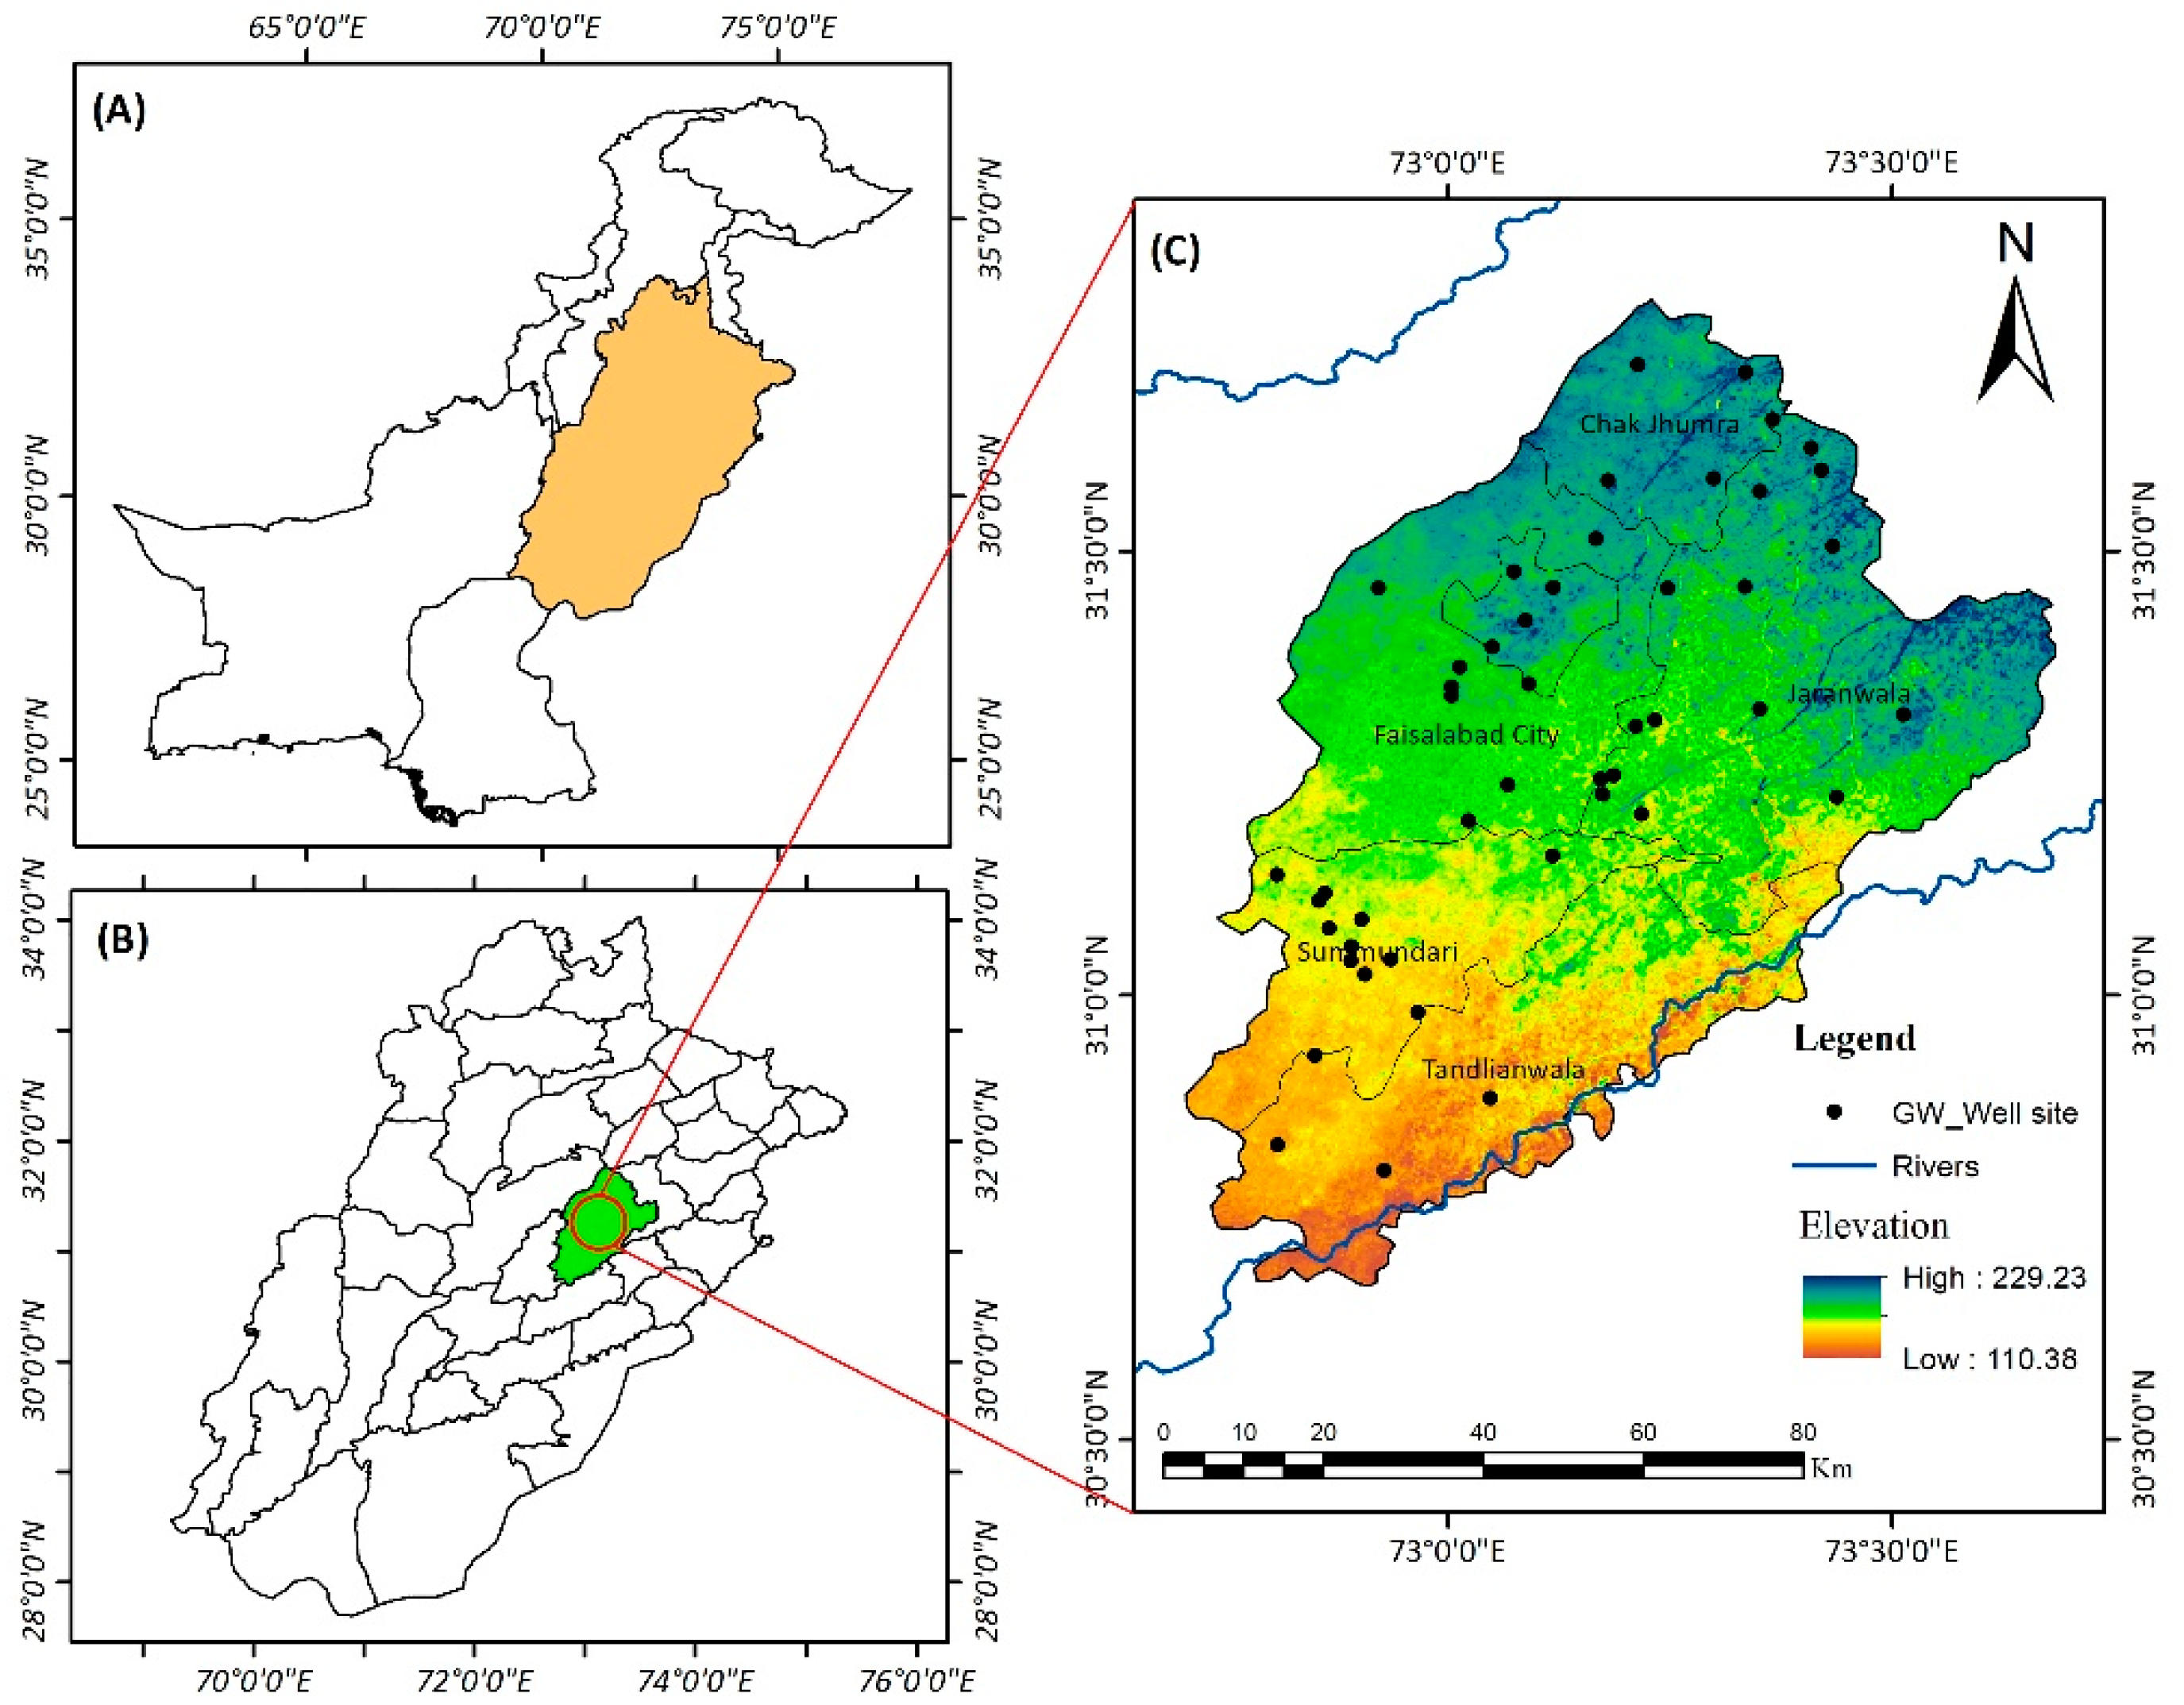
2.1. Study Area
2.2. Data Acquisition and Image Processing
2.3. Calculation of Vegetation Indices and Built-Up Indices
2.3.1. Normalized Difference Built-Up Index
2.3.2. Normalized Difference Vegetation Index
2.4. Statistical Analysis
2.5. Spatial Interpolation of Groundwater Level Data
2.6. Mann–Kendall Test
2.7. Sen’s Slope Estimator
3. Results
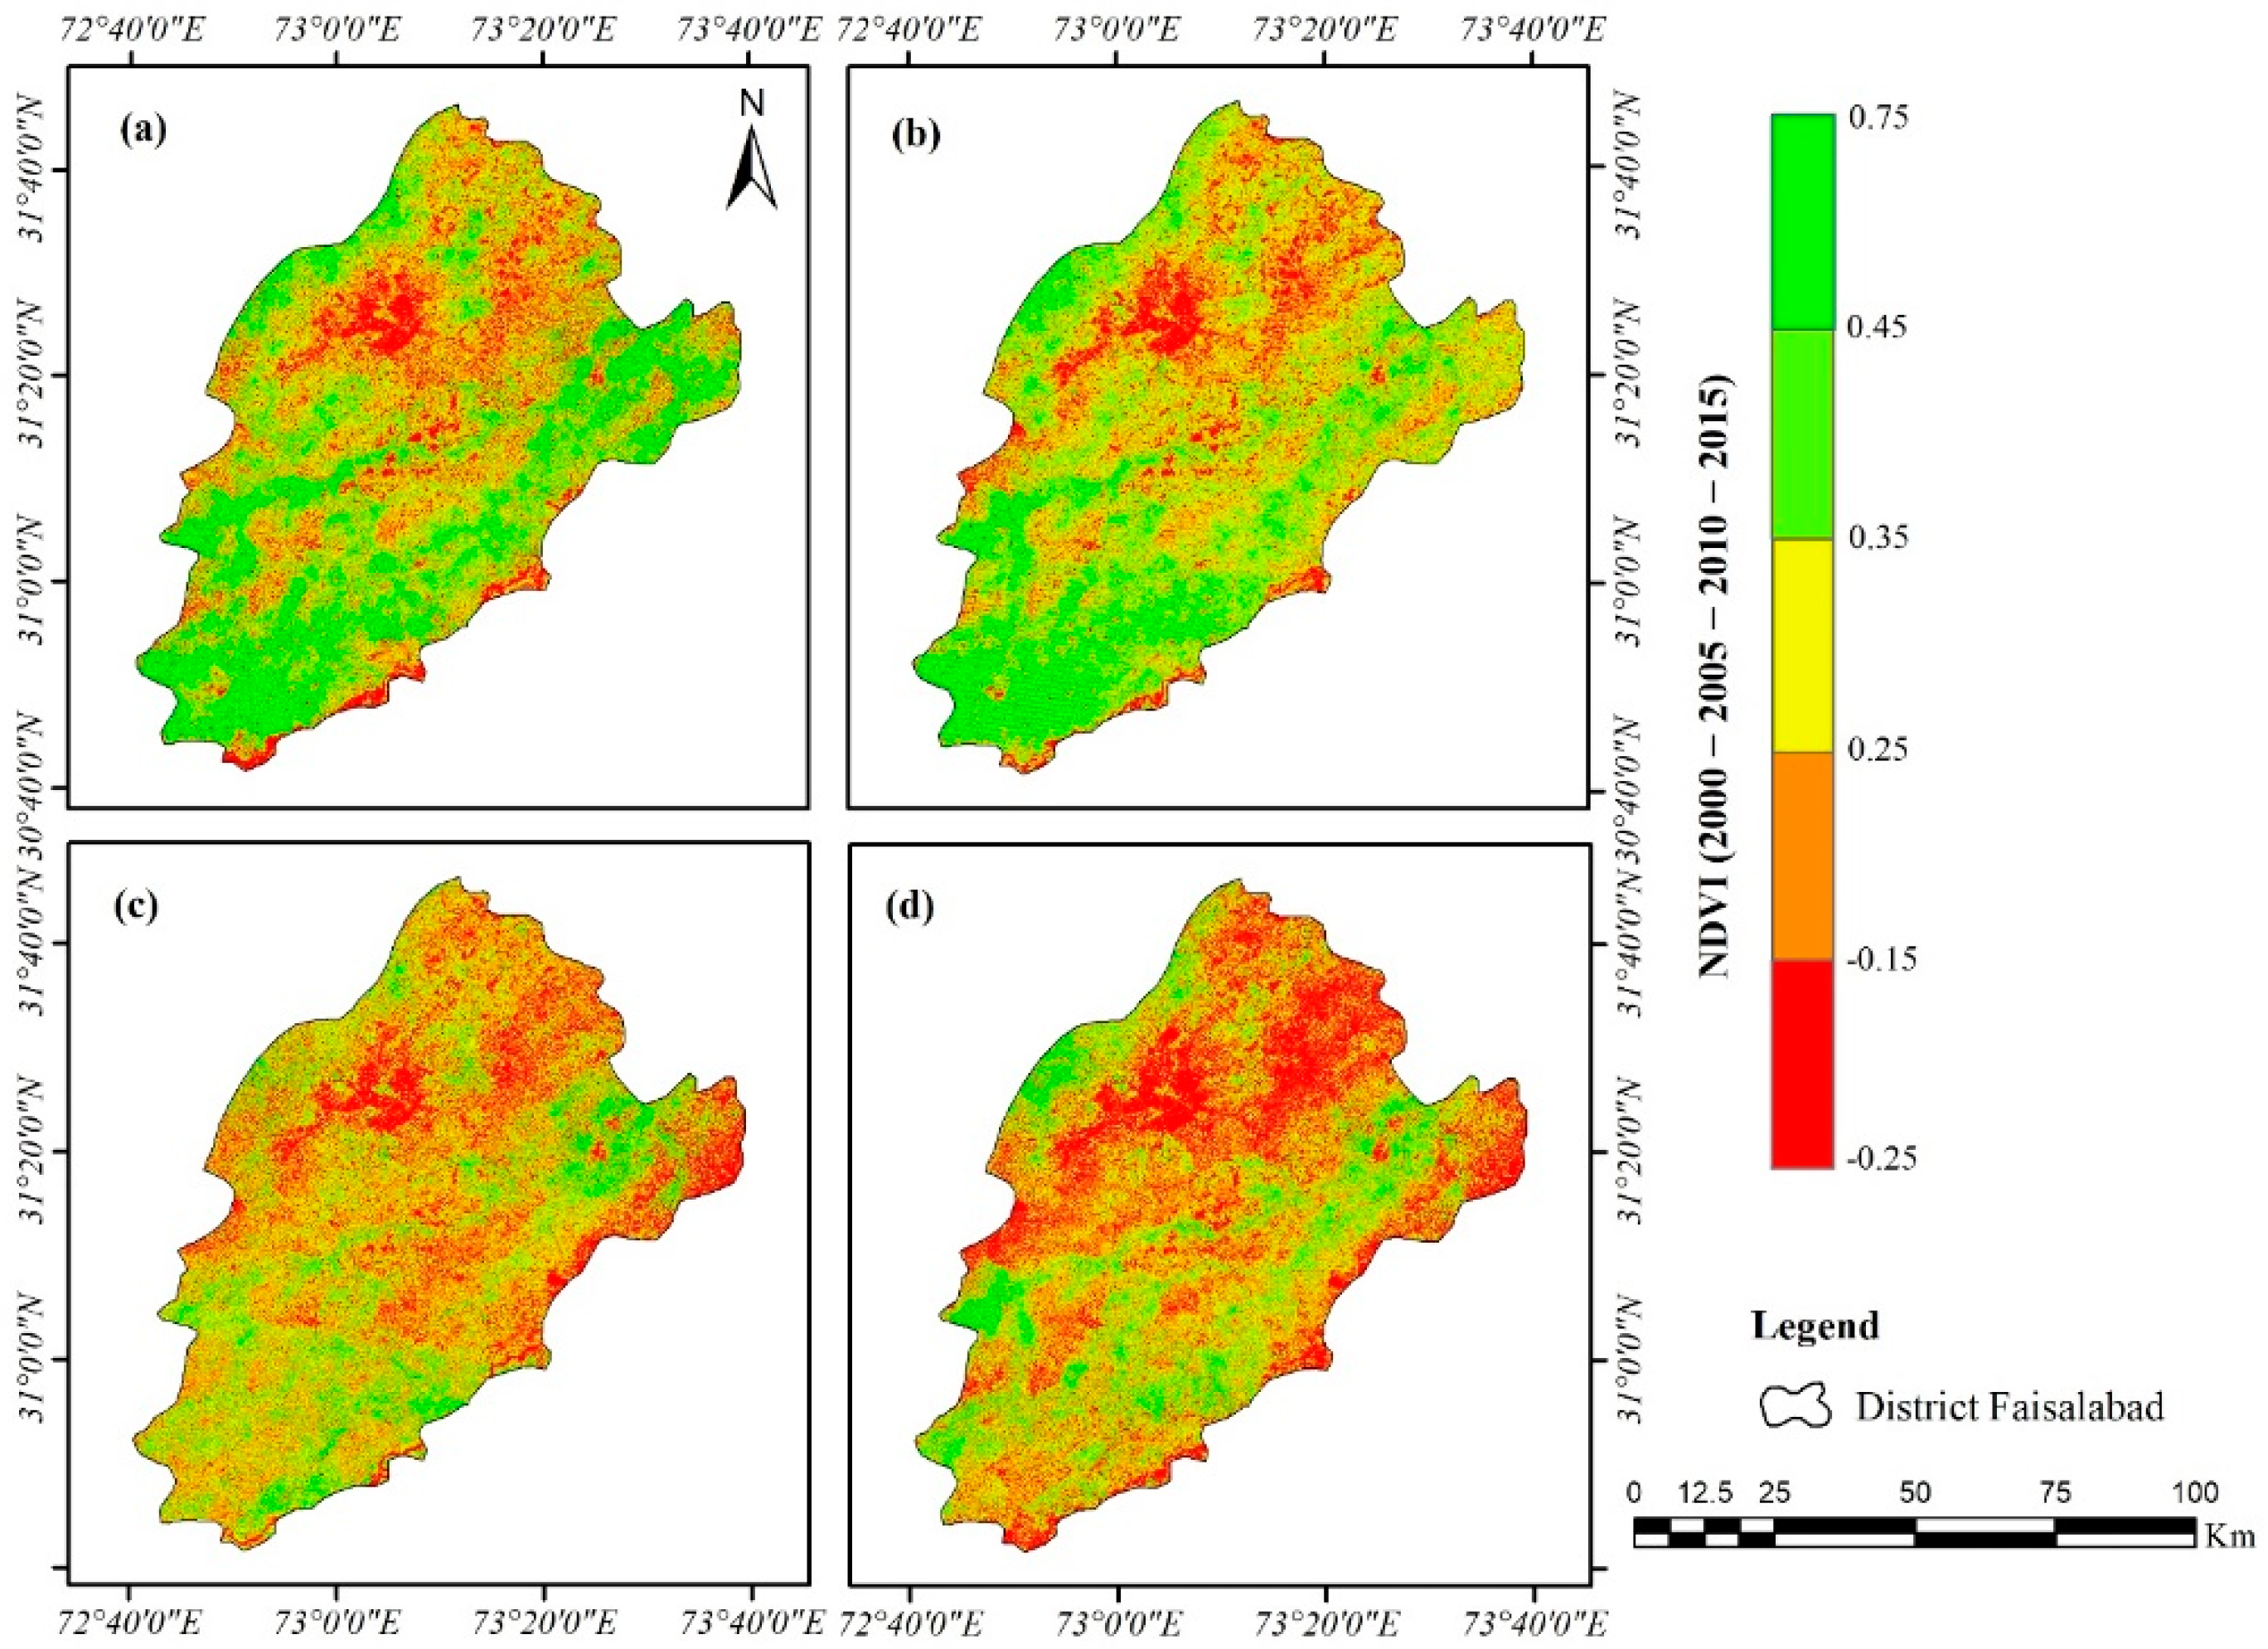
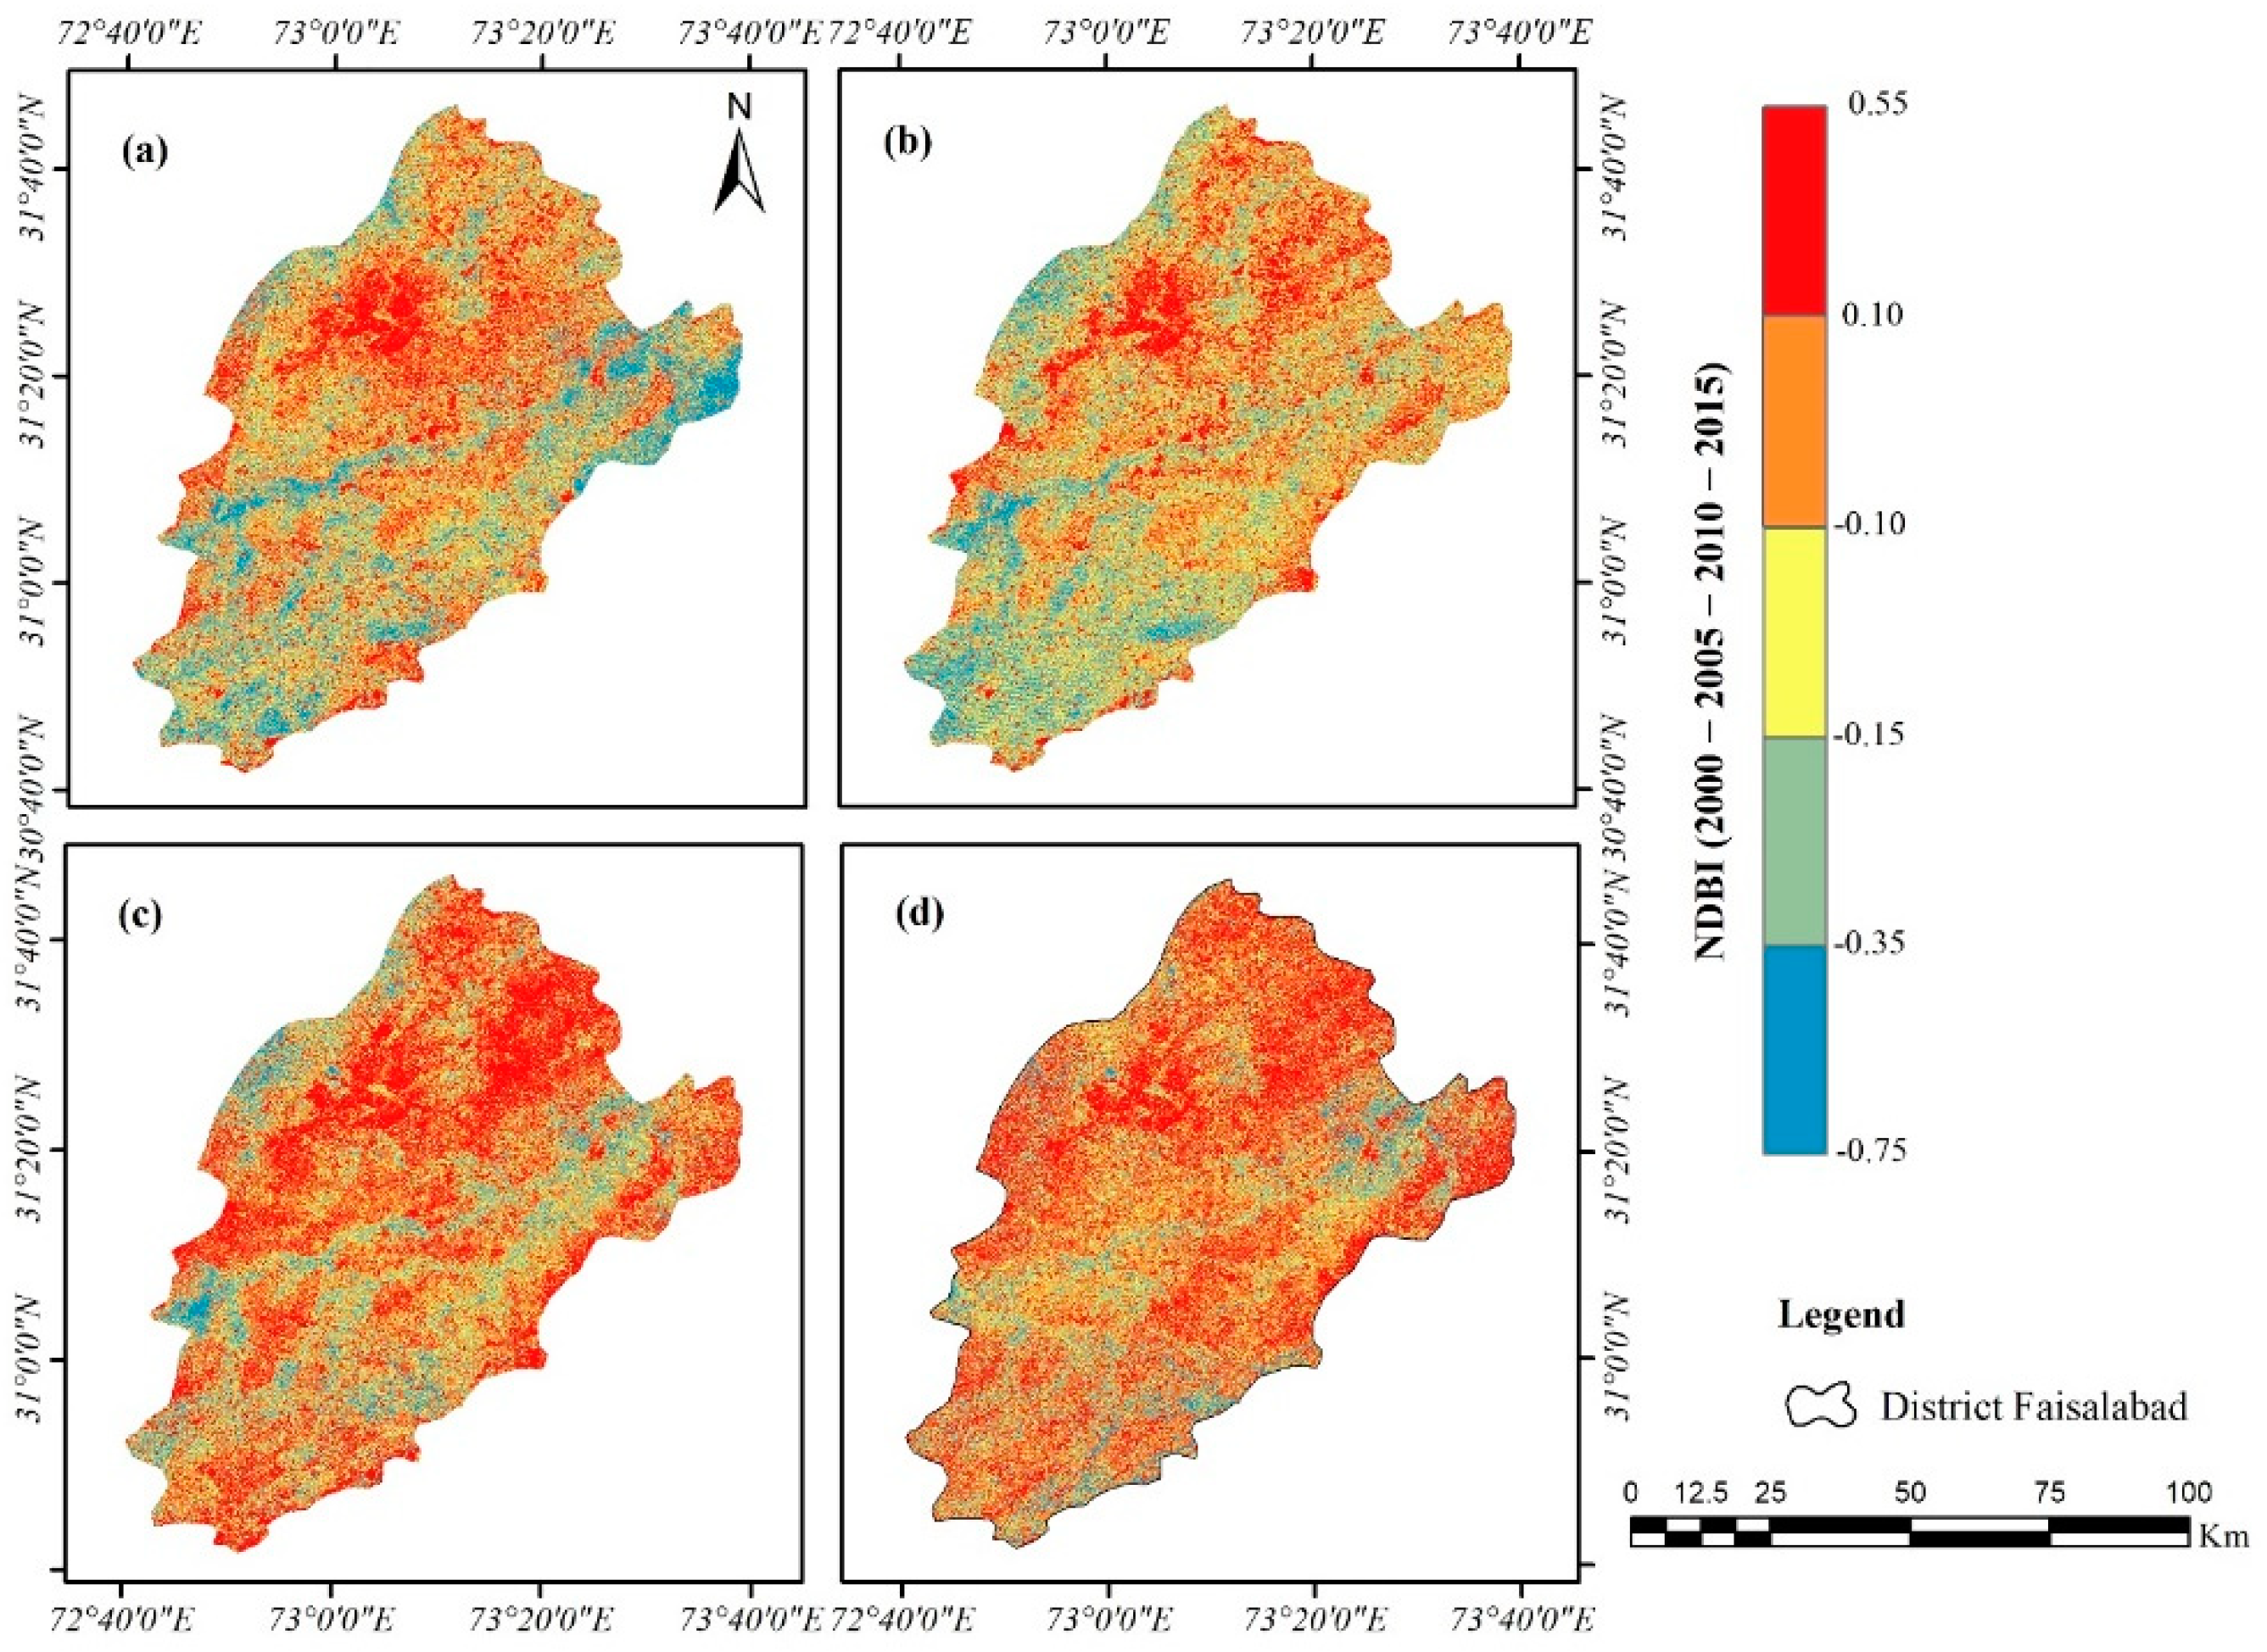
3.1. Spatial Patterns of Vegetation and Built-Up Indices
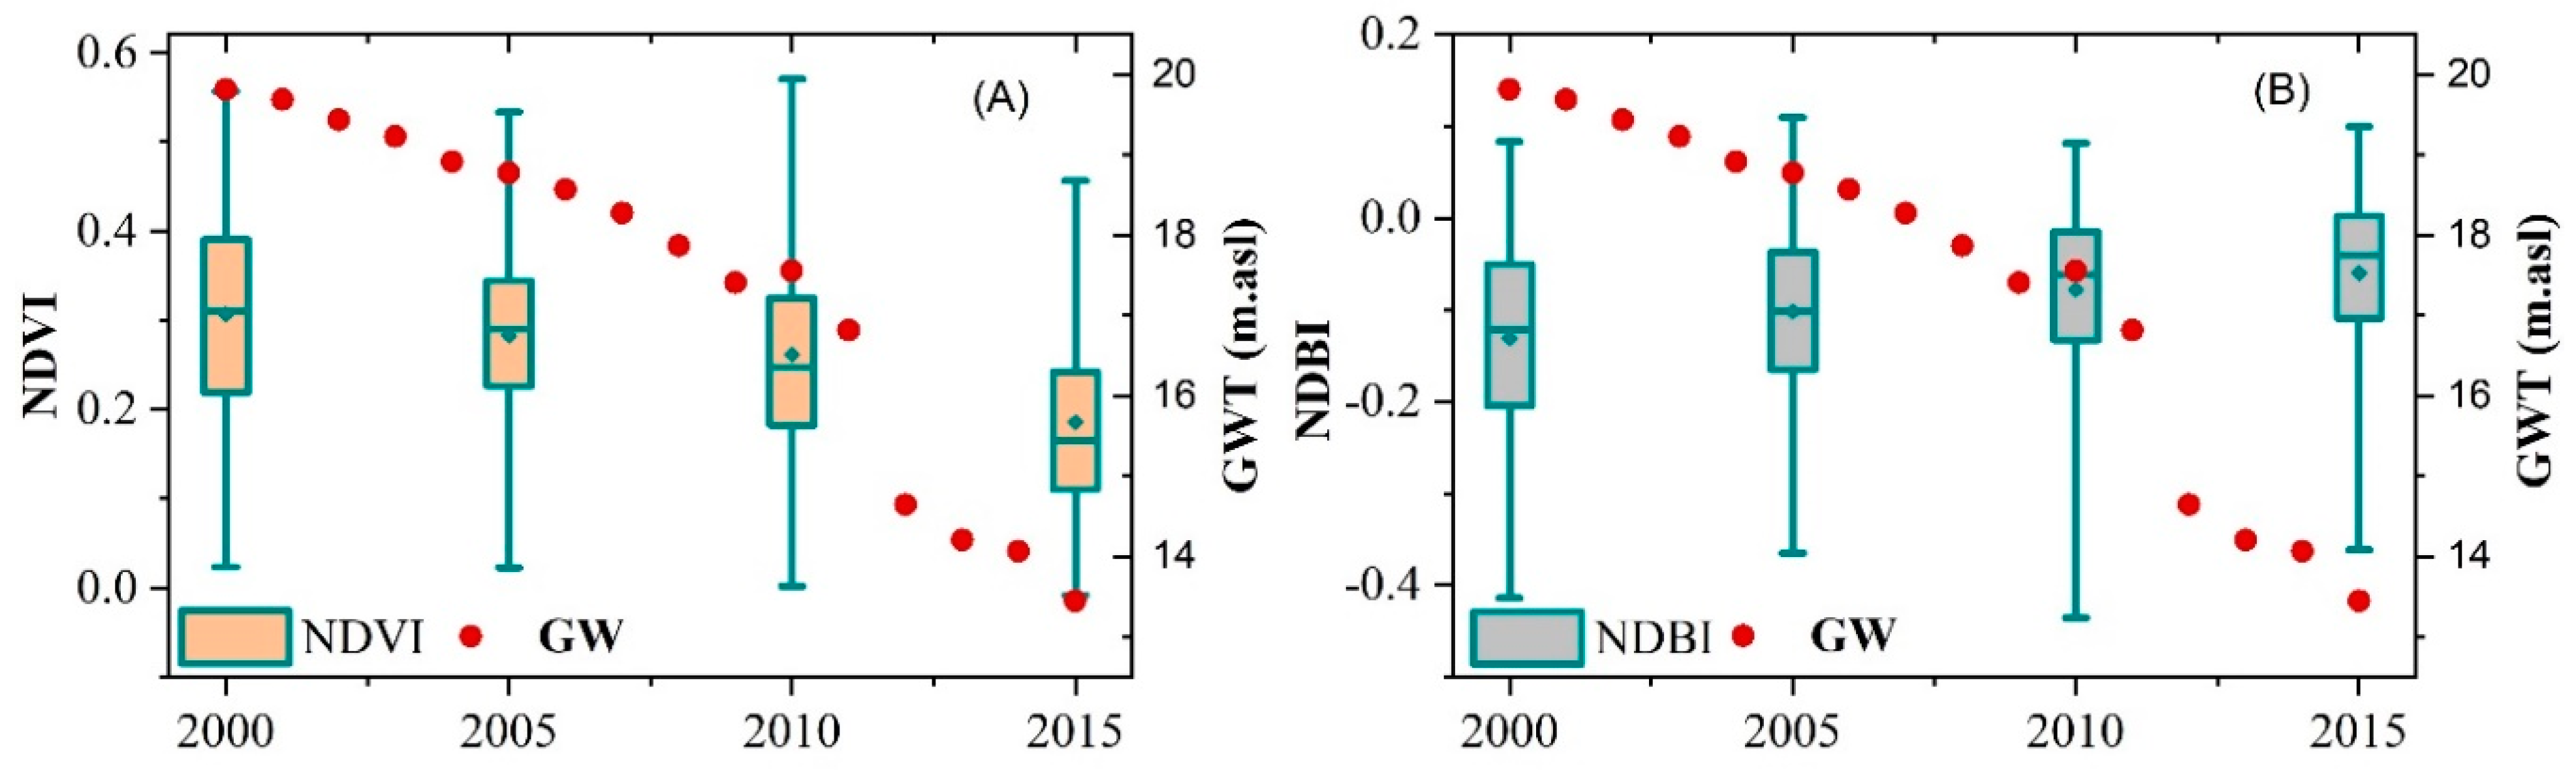
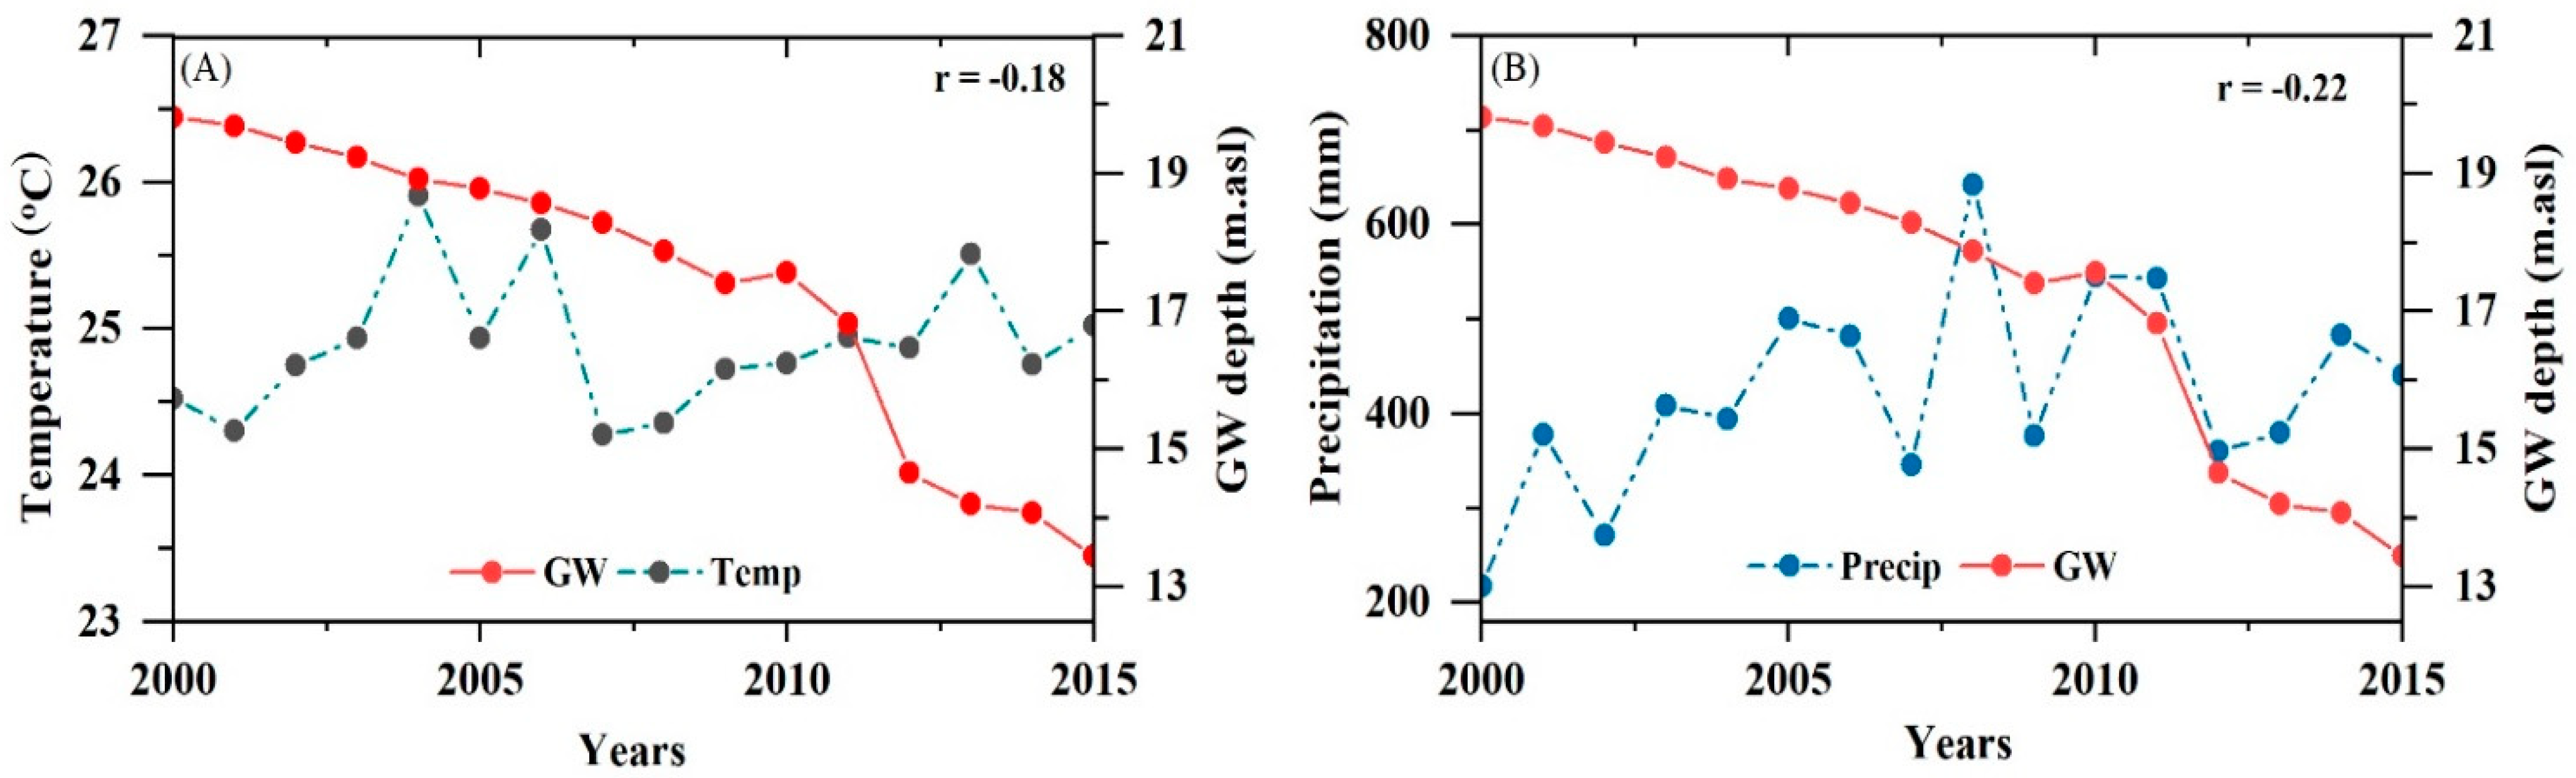
3.2. Relationship of GWL with NDVI, NDBI, and Climate Patterns
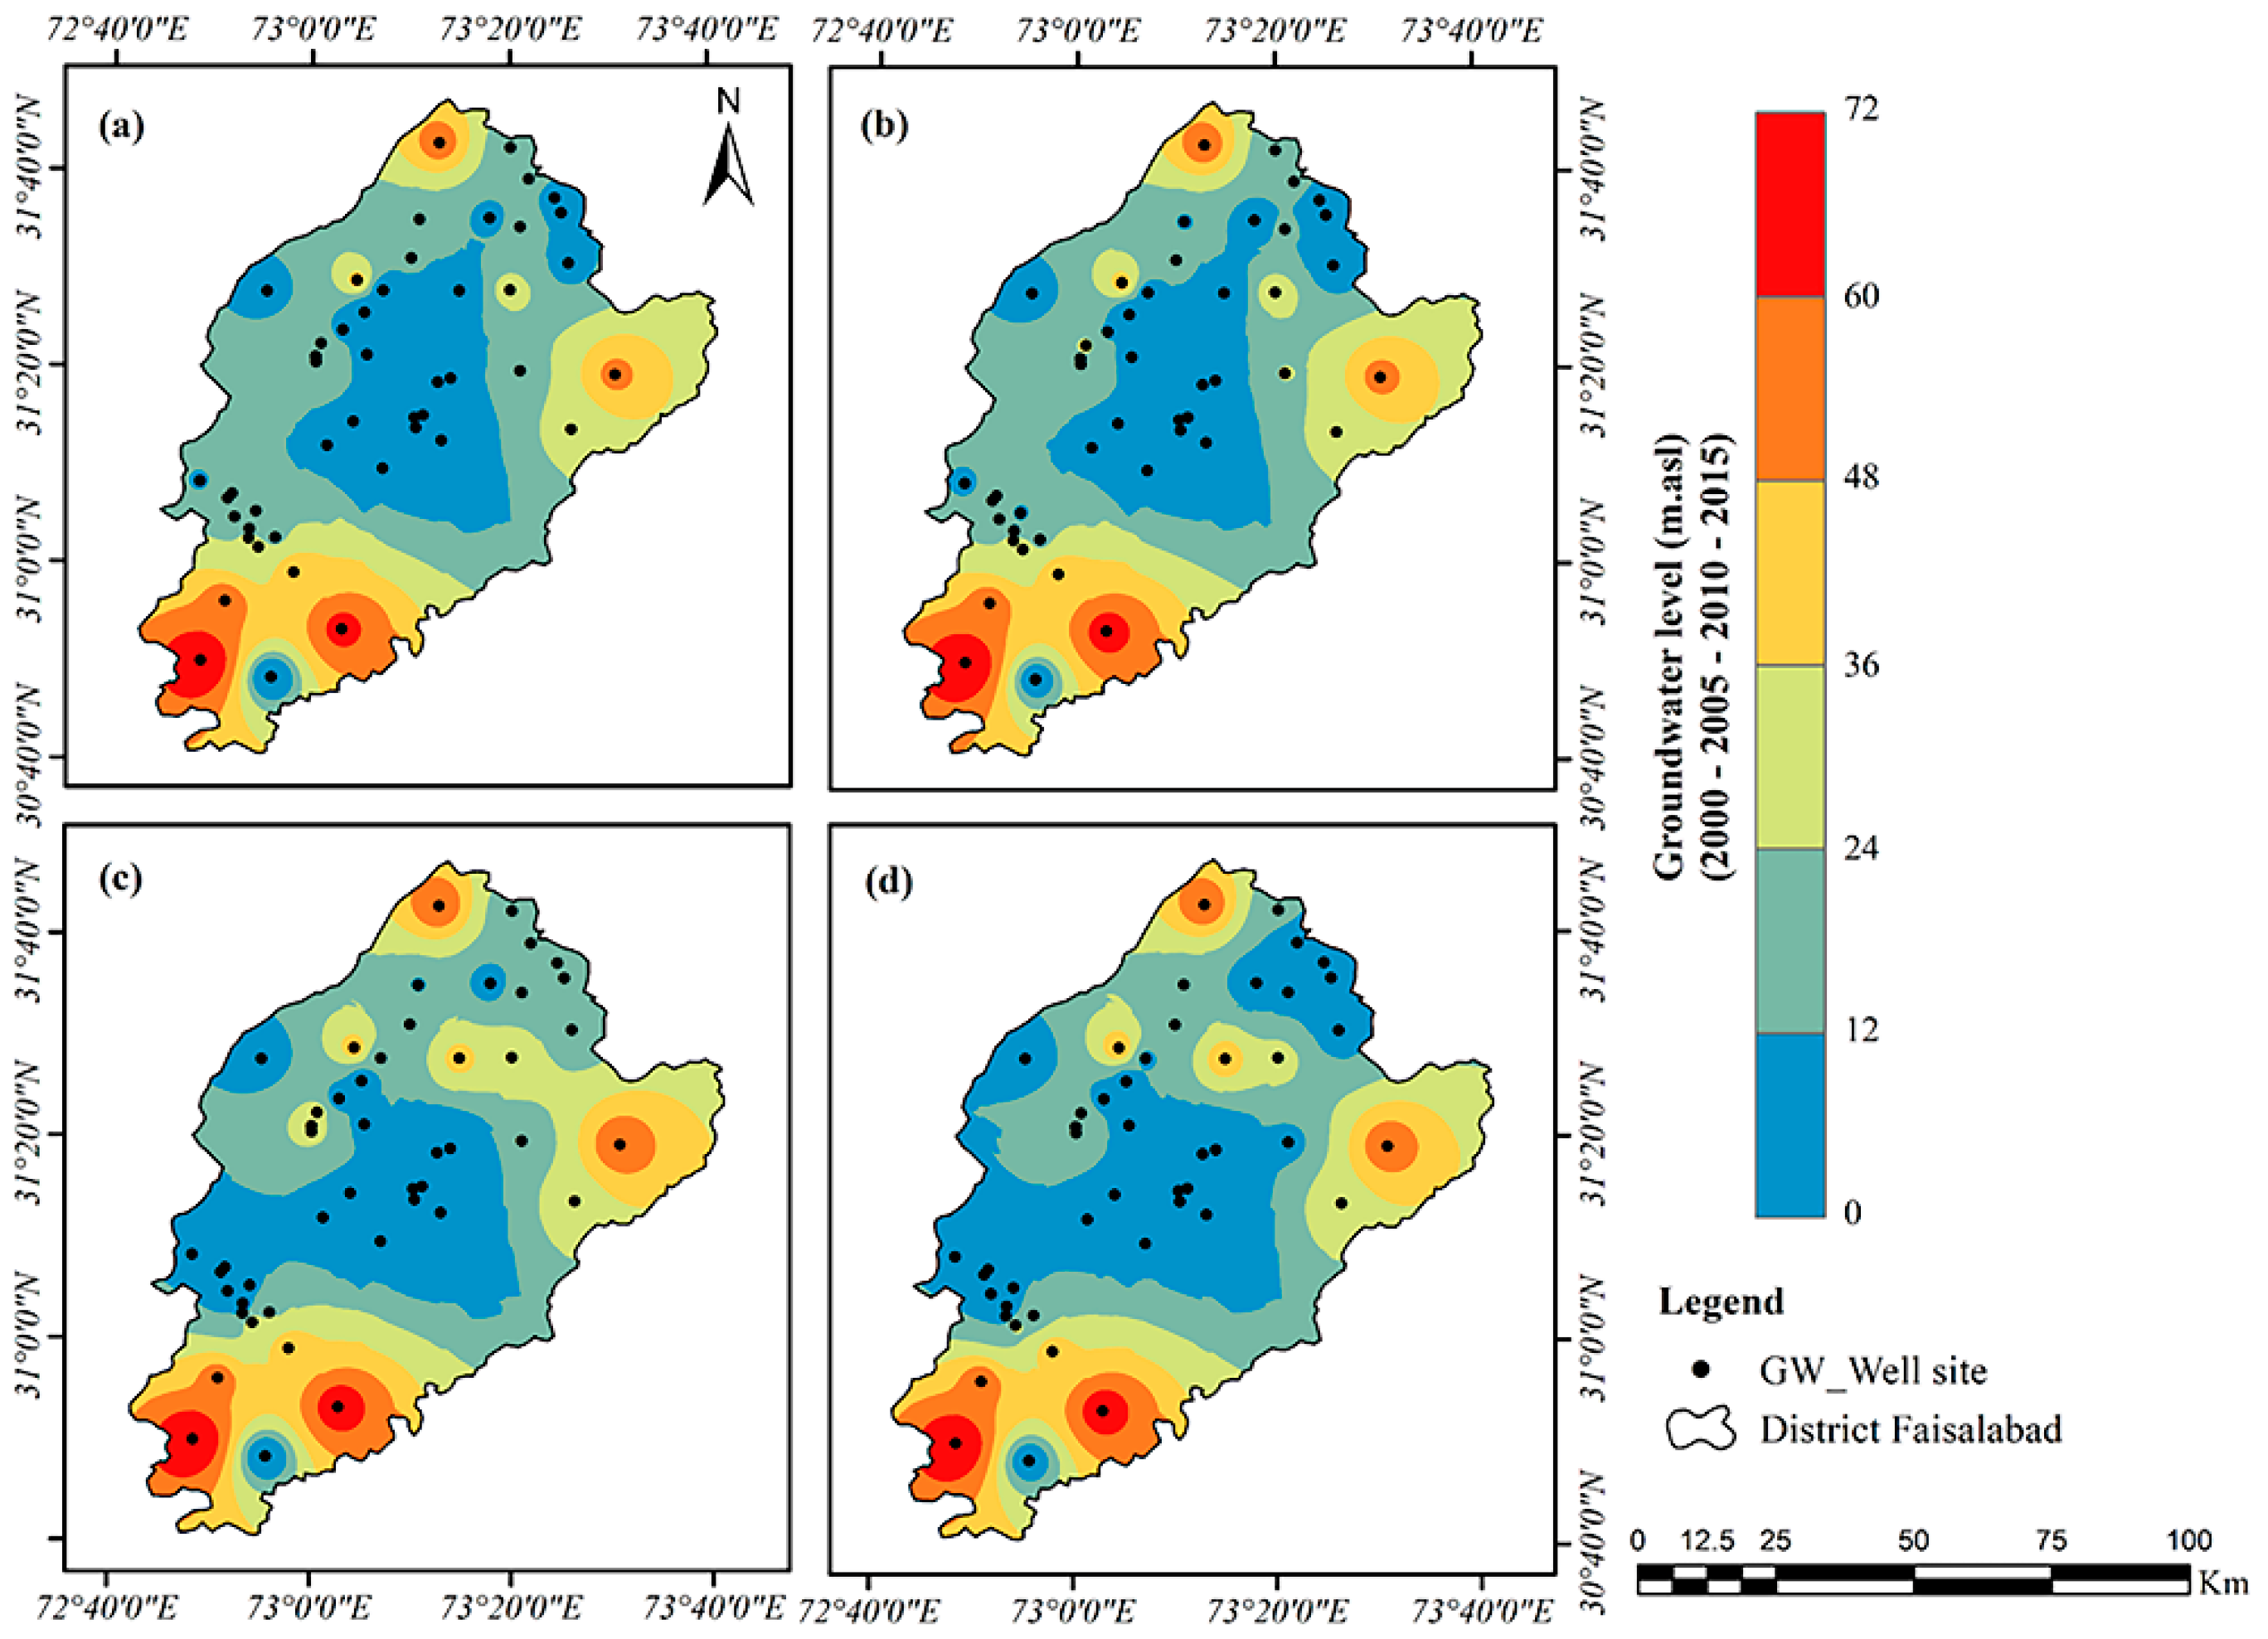
3.3. Spatial Characteristics of Groundwater Level
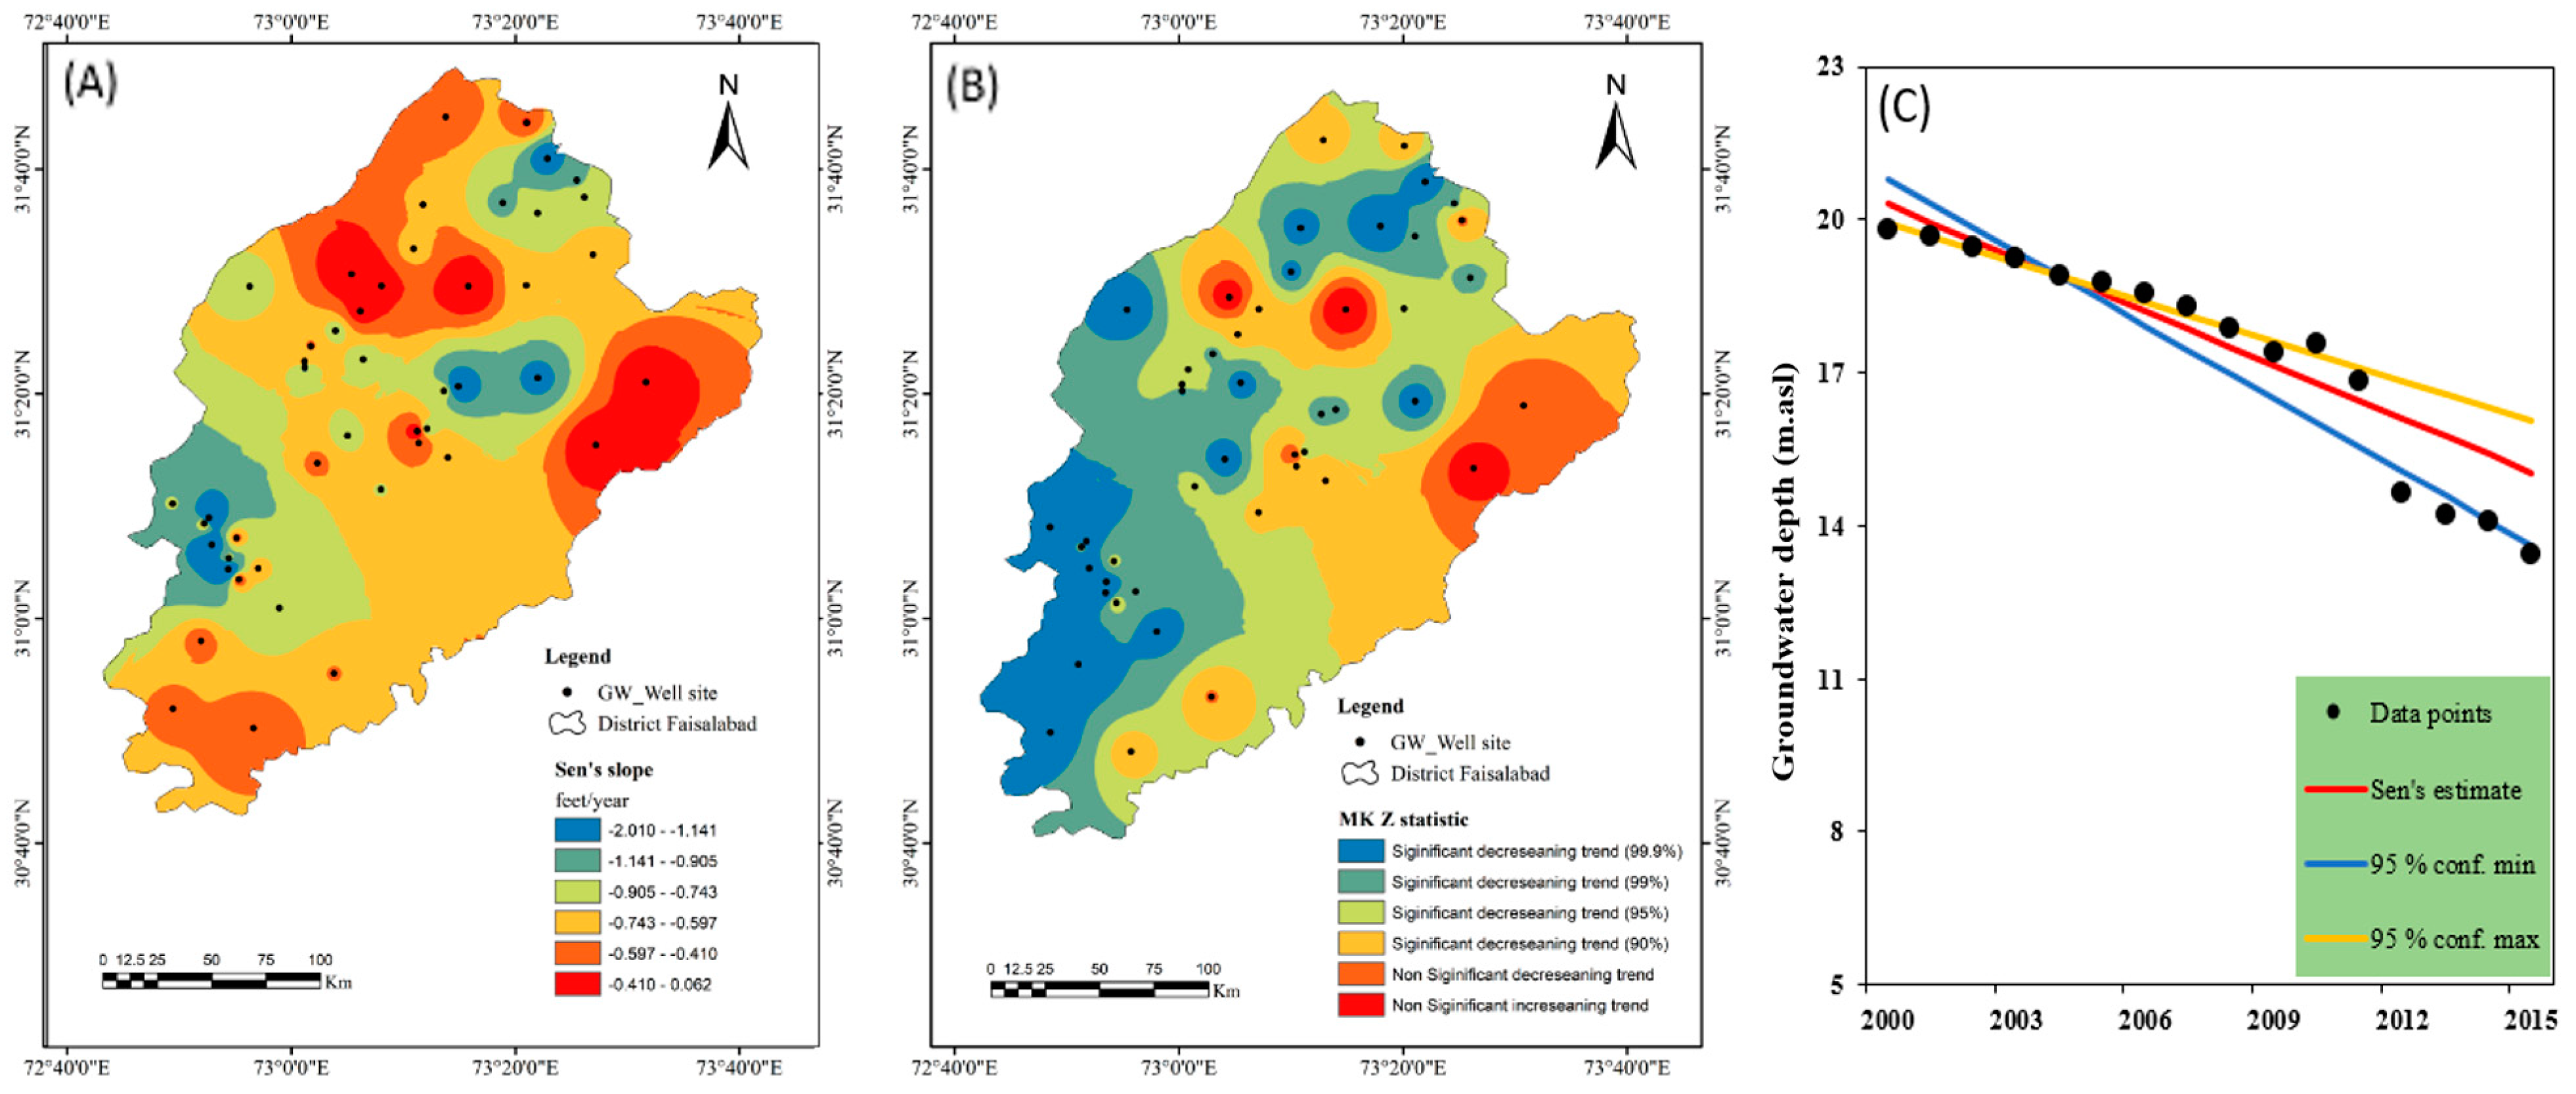
3.4. Trends in Groundwater Level
4. Discussion
4.1. Relationship of Land-Use and Climate Changes with Groundwater
4.2. Future Perspective and Mitigation
5. Conclusions
Author Contributions
Funding
Institutional Review Board Statement
Informed Consent Statement
Data Availability Statement
Conflicts of Interest
References
- Boretti, A.; Rosa, L. Reassessing the projections of the World Water Development Report. NPJ Clean Water 2019, 2, 15. [Google Scholar] [CrossRef]
- Döll, P.; Hoffmann-Dobrev, H.; Portmann, F.; Siebert, S.; Eicker, A.; Rodell, M.; Strassberg, G.; Scanlon, B. Impact of water withdrawals from groundwater and surface water on continental water storage variations. J. Geodyn. 2012, 59–60, 143–156. [Google Scholar] [CrossRef]
- Lytton, L.; Ali, A.; Garthwaite, B.; Punthakey, J.F.; Basharat, S. Groundwater in Pakistan’s Indus Basin: Present and Future Prospects; World Bank: Washington, DC, USA, 2021; p. 164. [Google Scholar]
- Carrard, N.; Foster, T.; Willetts, J. Groundwater as a Source of Drinking Water in Southeast Asia and the Pacific: A Multi-Country Review of Current Reliance and Resource Concerns. Water 2019, 11, 1605. [Google Scholar] [CrossRef] [Green Version]
- Steinschneider, S.; McCrary, R.; Mearns, L.O.; Brown, C. The effects of climate model similarity on probabilistic climate projections and the implications for local, risk-based adaptation planning. Geophys. Res. Lett. 2015, 42, 5014–5044. [Google Scholar] [CrossRef]
- Odhiambo, G.O. Water scarcity in the Arabian Peninsula and socio-economic implications. Appl. Water Sci. 2016, 7, 2479–2492. [Google Scholar] [CrossRef] [Green Version]
- Minnig, M.; Moeck, C.; Radny, D.; Schirmer, M. Impact of urbanization on groundwater recharge rates in Dübendorf, Switzerland. J. Hydrol. 2018, 563, 1135–1146. [Google Scholar] [CrossRef] [Green Version]
- Dilawar, A.; Chen, B.; Trisurat, Y.; Tuankrua, V.; Arshad, A.; Hussain, Y.; Measho, S.; Guo, L.; Kayiranga, A.; Zhang, H.; et al. Spatiotemporal shifts in thermal climate in responses to urban cover changes: A-case analysis of major cities in Punjab, Pakistan. Geomat. Nat. Hazards Risk 2021, 12, 763–793. [Google Scholar] [CrossRef]
- Mishra, N.; Sharma, A.K. Groundwater Storage Analysis in Changing Land Use/Land Cover for Haridwar Districts of Upper Ganga Canal Command (1972–2011). In Lecture Notes in Civil Engineering; Springer: Berlin/Heidelberg, Germany, 2021; Volume 87, pp. 233–241. [Google Scholar]
- Sam, A.S.; Abbas, A.; Padmaja, S.S.; Kaechele, H.; Kumar, R.; Müller, K. Linking Food Security with Household’s Adaptive Capacity and Drought Risk: Implications for Sustainable Rural Development. Soc. Indic. Res. 2018, 142, 363–385. [Google Scholar] [CrossRef]
- Shah, T. Groundwater and human development: Challenges and opportunities in livelihoods and environment. Water Sci. Technol. 2005, 51, 27–37. [Google Scholar] [CrossRef]
- Thomas, V. Confronting Climate-Related Disasters in Asia and the Pacific. Rev. Econ. 2014, 65, 121–136. [Google Scholar] [CrossRef]
- Mondal, S.K.; Huang, J.; Wang, Y.; Su, B.; Zhai, J.; Tao, H.; Wang, G.; Fischer, T.; Wen, S.; Jiang, T. Doubling of the population exposed to drought over South Asia: CMIP6 multi-model-based analysis. Sci. Total Environ. 2021, 771, 145186. [Google Scholar] [CrossRef] [PubMed]
- Mekonnen, M.M.; Hoekstra, A.Y. Sustainability: Four billion people facing severe water scarcity. Sci. Adv. Sci. Adv. 2016, 2, e1500323. [Google Scholar] [CrossRef] [Green Version]
- Seo, J.Y.; Lee, S.-I. Integration of GRACE, ground observation, and land-surface models for groundwater storage variations in South Korea. Int. J. Remote Sens. 2016, 37, 5786–5801. [Google Scholar] [CrossRef]
- Nahib, I.; Ambarwulan, W.; Rahadiati, A.; Munajati, S.; Prihanto, Y.; Suryanta, J.; Turmudi, T.; Nuswantoro, A. Assessment of the impacts of climate and LULC changes on the water yield in the Citarum River Basin, West Java Province, Indonesia. Sustainability 2021, 13, 3919. [Google Scholar] [CrossRef]
- Scanlon, B.R.; Reedy, R.C.; Stonestrom, D.A.; Prudic, D.E.; Dennehy, K.F. Impact of land use and land cover change on groundwater recharge and quality in the southwestern US. Glob. Chang. Biol. 2005, 11, 1577–1593. [Google Scholar] [CrossRef]
- Bucton, B.G.B.; Shrestha, S.; Kc, S.; Mohanasundaram, S.; Virdis, S.G.; Chaowiwat, W. Impacts of climate and land use change on groundwater recharge under shared socioeconomic pathways: A case of Siem Reap, Cambodia. Environ. Res. 2022, 211, 113070. [Google Scholar] [CrossRef]
- Awan, U.K.; Ismaeel, A. A new technique to map groundwater recharge in irrigated areas using a SWAT model under changing climate. J. Hydrol. 2014, 519, 1368–1382. [Google Scholar] [CrossRef]
- Liu, W.; Bailey, R.T.; Andersen, H.E.; Jeppesen, E.; Nielsen, A.; Peng, K.; Molina-Navarro, E.; Park, S.; Thodsen, H.; Trolle, D. Quantifying the effects of climate change on hydrological regime and stream biota in a groundwater-dominated catchment: A modelling approach combining SWAT-MODFLOW with flow-biota empirical models. Sci. Total Environ. 2020, 745, 140933. [Google Scholar] [CrossRef]
- Chunn, D.; Faramarzi, M.; Smerdon, B.; Alessi, D.S. Application of an Integrated SWAT–MODFLOW Model to Evaluate Potential Impacts of Climate Change and Water Withdrawals on Groundwater–Surface Water Interactions in West-Central Alberta. Water 2019, 11, 110. [Google Scholar] [CrossRef] [Green Version]
- Lee, K.S.; Chung, E.-S. Hydrological effects of climate change, groundwater withdrawal, and land use in a small Korean watershed. Hydrol. Process. 2007, 21, 3046–3056. [Google Scholar] [CrossRef]
- Joshi, S.K.; Gupta, S.; Sinha, R.; Densmore, A.L.; Rai, S.P.; Shekhar, S.; Mason, P.J.; van Dijk, W. Strongly heterogeneous patterns of groundwater depletion in Northwestern India. J. Hydrol. 2021, 598, 126492. [Google Scholar] [CrossRef]
- Bal, M.; Dandpat, A.K.; Naik, B. Hydrological modeling with respect to impact of land-use and land-cover change on the runoff dynamics in Budhabalanga river basing using ArcGIS and SWAT model. Remote Sens. Appl. Soc. Environ. 2021, 23, 100527. [Google Scholar] [CrossRef]
- Abdelaziz, K.K.; Nicaise, Y.; Séguis, L.; Ouattara, I.; Moussa, O.; Auguste, K.; Kamagaté, B.; Diakaria, K. Influence of Land Use Land Cover Change on Groundwater Recharge in the Continental Terminal Area of Abidjan, Ivory Coast. J. Water Resour. Prot. 2020, 12, 431–453. [Google Scholar] [CrossRef]
- Adeleke, O.O.; Makinde, V.; Eruola, A.O.; Dada, O.F.; Ojo, A.O.; Aluko, T.J. Estimation of Groundwater Recharges in Odeda Local Government Area, Ogun State, Nigeria using Empirical Formulae. Challenges 2015, 6, 271–281. [Google Scholar] [CrossRef] [Green Version]
- Scanlon, B.R.; Keese, K.E.; Flint, A.L.; Flint, L.E.; Gaye, C.B.; Edmunds, W.M.; Simmers, I. Global synthesis of groundwater recharge in semiarid and arid regions. Hydrol. Process. 2006, 20, 3335–3370. [Google Scholar] [CrossRef]
- Jyrkama, M.I.; Sykes, J.F. The impact of climate change on spatially varying groundwater recharge in the grand river watershed (Ontario). J. Hydrol. 2007, 338, 237–250. [Google Scholar] [CrossRef]
- Graniel, C.E.; Morris, L.B.; Carrillo-Rivera, J.J. Effects of urbanization on groundwater resources of Merida, Yucatan, Mexico. Environ. Geol. 1999, 37, 303–312. [Google Scholar] [CrossRef]
- Xia, J.; Wu, X.; Zhan, C.; Qiao, Y.; Hong, S.; Yang, P.; Zou, L. Evaluating the dynamics of groundwater depletion for an arid land in the Tarim Basin, China. Water 2019, 11, 186. [Google Scholar] [CrossRef] [Green Version]
- Yenehun, A.; Dessie, M.; Nigate, F.; Belay, A.S.; Azeze, M.; Van Camp, M.; Fenetie Taye, D.; Kidane, D.; Adgo, E.; Nyssen, J.; et al. Spatial and temporal simulation of groundwater recharge and cross-1 validation with point measurements in volcanic aquifers with variable 2 topography 3. Hydrol. Earth Syst. Sci. Discuss. 2021, 1–37. [Google Scholar] [CrossRef]
- Adhikari, R.K.; Mohanasundaram, S.; Shrestha, S. Impacts of land-use changes on the groundwater recharge in the Ho Chi Minh city, Vietnam. Environ. Res. 2020, 185, 109440. [Google Scholar] [CrossRef]
- Ashraf, B.; AghaKouchak, A.; Alizadeh, A.; Baygi, M.M.; Moftakhari, H.R.; Mirchi, A.; Anjileli, H.; Madani, K. Quantifying Anthropogenic Stress on Groundwater Resources. Sci. Rep. 2017, 7, 12910. [Google Scholar] [CrossRef] [PubMed] [Green Version]
- Bhalli, M.N.; Ghaffar, A.; Shirazi, S.A. Remote Sensing and Gis Applications for Monitoring and Assessment of the Urban Sprawl in Faisalabad-Pakistan. Pak. J. Sci. 2012, 64, 203–208. [Google Scholar]
- Government of Pakistan, Pakistan Bureau of Statistics. 2017. Available online: https://www.pbs.gov.pk/content/final-results-census-2017 (accessed on 28 December 2021).
- Mahmood, K. Transition Urbaine et Structures Familiales au Pakistan, le cas de Faisalabad. Ph.D. Thesis, Université d’Orléans, Orleans, France, 2014. [Google Scholar]
- Arshad, A.; Zhang, W.; Zaman, M.A.; Dilawar, A.; Sajid, Z. Monitoring the impacts of spatio-temporal land-use changes on the regional climate of city Faisalabad, Pakistan. Ann. GIS 2019, 25, 57–70. [Google Scholar] [CrossRef] [Green Version]
- Tariq, A.; Shu, H. CA-Markov chain analysis of seasonal land surface temperature and land use landcover change using optical multi-temporal satellite data of Faisalabad, Pakistan. Remote Sens. 2020, 12, 3402. [Google Scholar] [CrossRef]
- Wald, L.; Ranchin, T.; Mangolini, M. Fusion of Satellite Images of Different Spatial Resolutions: Assessing the Quality of Resulting Images. Photogramm. Eng. Remote Sens. 1997, 63, 691–699. Available online: https://hal.archives-ouvertes.fr/hal-00365304 (accessed on 26 April 2020).
- Manap, M.A.; Sulaiman, W.N.A.; Ramli, M.F.; Pradhan, B.; Surip, N. A knowledge-driven GIS modeling technique for groundwater potential mapping at the Upper Langat Basin, Malaysia. Arab. J. Geosci. 2013, 6, 1621–1637. [Google Scholar] [CrossRef]
- Zha, Y.; Gao, J.; Ni, S. Use of normalized difference built-up index in automatically mapping urban areas from TM imagery. Int. J. Remote Sens. 2003, 24, 583–594. [Google Scholar] [CrossRef]
- Chen, D.; Brutsaert, W. Satellite-Sensed Distribution and Spatial Patterns of Vegetation Parameters over a Tallgrass Prairie. J. Atmos. Sci. 1998, 55, 1225–1238. [Google Scholar] [CrossRef]
- Purevdorj, T.S.; Tateishi, R.; Ishiyama, T.; Honda, Y. Relationships between percent vegetation cover and vegetation indices. Int. J. Remote Sens. 1998, 19, 3519–3535. [Google Scholar] [CrossRef]
- Kidwell, K.B. NOAA Polar Orbiter Data (TIROS-N, NOAA-6, NOAA-7, and NOAA-8) User Guide; National Oceanic and Atmospheric Administration: Washington, DC, USA, 1984. [Google Scholar]
- Sun, C.; Bian, Y.; Zhou, T.; Pan, J. Using of Multi-Source and Multi-Temporal Remote Sensing Data Improves Crop-Type Mapping in the Subtropical Agriculture Region. Sensors 2019, 19, 2401. [Google Scholar] [CrossRef] [Green Version]
- Sarif, M.O.; Rimal, B.; Stork, N.E. Assessment of changes in land use/land cover and land surface temperatures and their impact on surface Urban heat Island phenomena in the Kathmandu Valley (1988–2018). ISPRS Int. J. Geo-Inf. 2020, 9, 726. [Google Scholar] [CrossRef]
- Ehsan, S.; Kazem, D. Analysis of land use-land covers changes using normalized difference vegetation index (NDVI) differencing and classification methods. Afr. J. Agric. Res. 2013, 8, 4614–4622. [Google Scholar] [CrossRef] [Green Version]
- Varouchakis, E.A.; Hristopulos, D.T. Comparison of stochastic and deterministic methods for mapping groundwater level spatial variability in sparsely monitored basins. Environ. Monit. Assess. 2012, 185, 1–19. [Google Scholar] [CrossRef] [PubMed]
- Nistor, M.M.; Rahardjo, H.; Satyanaga, A.; Hao, K.Z.; Xiaosheng, Q.; Sham, A.W.L. Investigation of groundwater table distribution using borehole piezometer data interpolation: Case study of Singapore. Eng. Geol. 2020, 271, 105590. [Google Scholar] [CrossRef]
- Gunarathna, M.H.J.P.; Kumari, N.; Kumari, M.K.N.; Nirmanee, K.G.S. Evaluation of Interpolation Methods for Mapping pH of Groundwater Assessment and Modeling of Water Resources in Tank Cascade Landscape View Project Evaluation of Interpolation Methods for Mapping pH of Groundwater. Int. J. Latest Technol. Eng. Manag. Appl. Sci. 2016, 3, 1–5. Available online: www.ijltemas.in (accessed on 25 December 2021).
- Keblouti, M.; Ouerdachi, L.; Boutaghane, H. Spatial Interpolation of Annual Precipitation in Annaba-Algeria—Comparison and Evaluation of Methods. Energy Procedia 2012, 18, 468–475. [Google Scholar] [CrossRef] [Green Version]
- Gocic, M.; Trajkovic, S. Analysis of changes in meteorological variables using Mann-Kendall and Sen’s slope estimator statistical tests in Serbia. Glob. Planet. Chang. 2013, 100, 172–182. [Google Scholar] [CrossRef]
- Kendall, M. Rank Correlation Methods, Book Series, Charles Griffin; Oxford University Press: Oxford, UK, 1975; Available online: https://scholar.google.com/scholar?hl=en&as_sdt=0%2C5&q=Kendall%2C+M.G.%2C+1975.+Rank+Correlation+Methods.+Griffin%2C+London%2C+UK.&btnG=#d=gs_cit&u=%2Fscholar%3Fq%3Dinfo%3AhR1fFHYqYHQJ%3Ascholar.google.com%2F%26output%3Dcite%26scirp%3D1%26hl%3Den (accessed on 27 December 2021).
- Mann, H.B. Nonparametric Tests Against Trend. Econometrica 1945, 13, 245–259. [Google Scholar] [CrossRef]
- Gilbert, R.O. Statistical Methods for Environmental Pollution Monitoring. Biometrics 1988, 44, 319. [Google Scholar] [CrossRef] [Green Version]
- Sen, P.K. Estimates of the Regression Coefficient Based on Kendall’s Tau. J. Am. Stat. Assoc. 1968, 63, 1379–1389. [Google Scholar] [CrossRef]
- Joodaki, G.; Wahr, J.; Swenson, S. Estimating the human contribution to groundwater depletion in the Middle East, from GRACE data, land surface models, and well observations. Water Resour. Res. 2014, 50, 2679–2692. [Google Scholar] [CrossRef]
- Veldkamp, T.I.E.; Wada, Y.; Aerts, J.; Döll, P.; Gosling, S.N.; Liu, J.; Masaki, Y.; Oki, T.; Ostberg, S.; Pokhrel, Y.; et al. Water scarcity hotspots travel downstream due to human interventions in the 20th and 21st century. Nat. Commun. 2017, 8, 15697. [Google Scholar] [CrossRef] [PubMed]
- Zia, S.; Nasar-u-Minallah, M.; Tahir, M.; Hanif, A. Impact Assessment of Urban Built-Up Area on Groundwater Level of District Faisalabad, Pakistan. Environ. Geol. 2022, 12, 32–37. [Google Scholar] [CrossRef]
- Partal, T.; Kahya, E. Trend analysis in Turkish precipitation data. Hydrol. Process. 2006, 20, 2011–2026. [Google Scholar] [CrossRef]
- Ojeda Olivares, E.A.; Sandoval Torres, S.; Belmonte Jimenez, S.I.; Campos Enriquez, J.O.; Zignol, F.; Reygadas, Y.; Tiefenbacher, J.P. Climate Change, Land Use/Land Cover Change, and Population Growth as Drivers of Groundwater Depletion in the Central Valleys, Oaxaca, Mexico. Remote Sens. 2019, 11, 1290. [Google Scholar] [CrossRef] [Green Version]
- Wakode, H.B.; Baier, K.; Jha, R.; Azzam, R. Impact of urbanization on groundwater recharge and urban water balance for the city of Hyderabad, India. Int. Soil Water Conserv. Res. 2018, 6, 51–62. [Google Scholar] [CrossRef]
- Heerspink, B.P.; Kendall, A.D.; Coe, M.T.; Hyndman, D.W. Trends in streamflow, evapotranspiration, and groundwater storage across the Amazon Basin linked to changing precipitation and land cover. J. Hydrol. Reg. Stud. 2020, 32, 100755. [Google Scholar] [CrossRef]
- Hameed, R.; Javed, M.; Nawaz, M.S. An assessment of adoption of rainwater harvesting system in residential buildings in Lahore, Pakistan. Urban Water J. 2020, 18, 163–172. [Google Scholar] [CrossRef]


| Satellite | No. of Images | Sensor | Date |
|---|---|---|---|
| Landsat 5 | 9 | TM | March–May 2000 |
| Landsat 5 | 9 | TM | March–May 2005 |
| Landsat 5 | 9 | TM | March–May 2010 |
| Landsat 8 | 9 | OLI | March–May 2015 |
| Index Name | Name | Formulation (Landsat 5) | Formulation (Landsat 8) | References |
|---|---|---|---|---|
| NDVI | Normalized Difference Vegetation Index | [45,46] | ||
| NDBI | Normalized Difference built-up Index | [47] |
| Statistics of NDVI and NDBI | Correlation with DWT | |||||
|---|---|---|---|---|---|---|
| Minimum | Maximum | Mean | Standard Deviation | Pearson Correlation Coefficient | Significance (p) | |
| NDVI | 0.06 | 0.46 | 0.26 | 0.08 | 0.99 | p < 0.05 |
| NDBI | −0.22 | 0.05 | −0.08 | 0.06 | −0.79 | p < 0.05 |
| Minimum | Maximum | Mean | Standard Deviation | Correlation Coefficient | Significance (p) | |
|---|---|---|---|---|---|---|
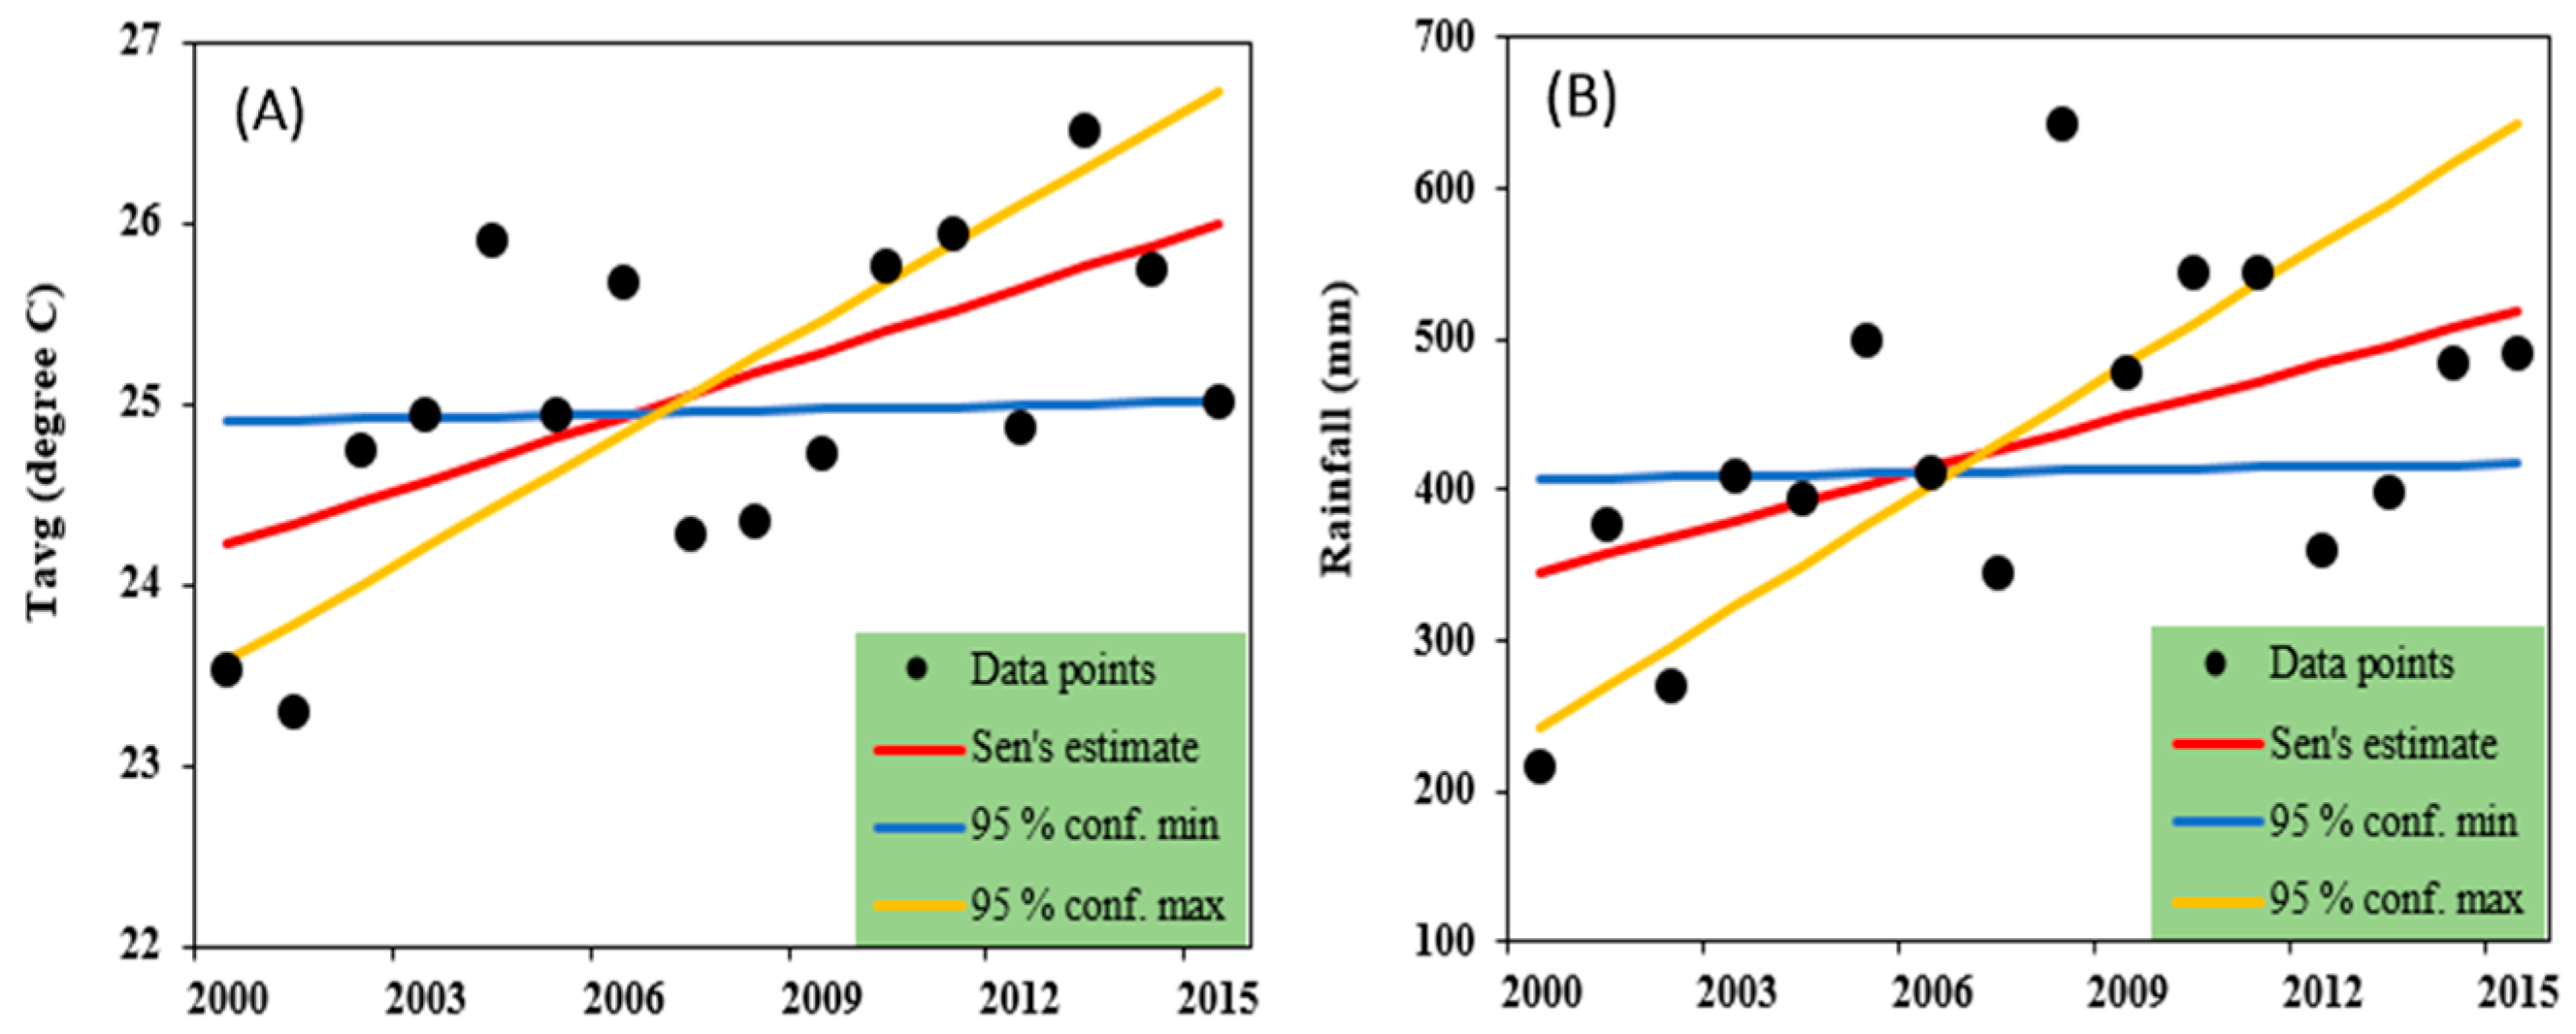
| Temperature (°C) | 24.27 | 25.90 | 24.89 | 0.47 | −0.18 | p > 0.05 |
| Precipitation (mm) | 217.11 | 642.42 | 418.62 | 106.41 | −0.22 | p > 0.05 |
Publisher’s Note: MDPI stays neutral with regard to jurisdictional claims in published maps and institutional affiliations. |
© 2022 by the authors. Licensee MDPI, Basel, Switzerland. This article is an open access article distributed under the terms and conditions of the Creative Commons Attribution (CC BY) license (https://creativecommons.org/licenses/by/4.0/).
Share and Cite
Sajjad, M.M.; Wang, J.; Abbas, H.; Ullah, I.; Khan, R.; Ali, F. Impact of Climate and Land-Use Change on Groundwater Resources, Study of Faisalabad District, Pakistan. Atmosphere 2022, 13, 1097. https://doi.org/10.3390/atmos13071097
Sajjad MM, Wang J, Abbas H, Ullah I, Khan R, Ali F. Impact of Climate and Land-Use Change on Groundwater Resources, Study of Faisalabad District, Pakistan. Atmosphere. 2022; 13(7):1097. https://doi.org/10.3390/atmos13071097
Chicago/Turabian StyleSajjad, Meer Muhammad, Juanle Wang, Haider Abbas, Irfan Ullah, Rehan Khan, and Furman Ali. 2022. "Impact of Climate and Land-Use Change on Groundwater Resources, Study of Faisalabad District, Pakistan" Atmosphere 13, no. 7: 1097. https://doi.org/10.3390/atmos13071097