Article

Global/Regional Impacts on Present and Near-Future Climate Regimes in the Metropolitan Region of Belém, Eastern Amazon

by
Carlos B. B. Gutierrez
1,2,
Everaldo B. de Souza
2,* and
Dione M. G. Gutierrez
1
1
Centro de Ciências Naturais e Tecnologia, Universidade do Estado do Pará (UEPA), Belém 66095-105, Brazil
2
Instituto de Geociências, PPG-Ciências Ambientais, Universidade Federal do Pará (UFPA), Belém 66075-110, Brazil
*
Author to whom correspondence should be addressed.
Atmosphere 2022, 13(7), 1077; https://doi.org/10.3390/atmos13071077
Submission received: 17 May 2022 / Revised: 24 June 2022 / Accepted: 5 July 2022 / Published: 7 July 2022
(This article belongs to the Special Issue Climate Change Impacts, Adaptation, and Mitigation in Urban Areas)

Abstract

:
Impact studies have contributed to a better integrated scientific understanding of the climate and environment of the Amazon, in the present, past, and future. This work aims to describe the regional impacts of human-induced landcover changes on the RAINY (January to April) and DRY (July to November) regime of the Metropolitan Region of Belém (MRB), the first frontier of Amazonian occupation. Furthermore, a dynamic downscaling (RegCM4 driven by HadGEM2-ES under the RCP8.5 scenario) was performed to investigate future global climate change impacts. A present climate (1985/2020) quantitative analysis showed that the disorderly urban enlargement in Belém and the forest suppression that led to the uncontrolled expansion of pasture/agriculture area over MRB has conditioned a local warmer climate with a significant increasing air temperature trend in both seasonal regimes. Another clear piece of evidence was the systematic intensification of the precipitation during the RAINY period. RegCM4 simulations indicate that the region will be impacted by the global climate change, such that warmer conditions in the DRY and intensified rainfall in the RAINY regime are expected to persist in the coming decades (2021/2045). Our findings for the MRB (area 3565 km2 for a population about 2.5 million inhabitants) are relevant and should be considered in the tasks of long-term planning and elaboration of advanced strategies to mitigate future climate-related risks and urban disaster management.

1. Introduction

Multiple anthropic activities have been systematically altered the natural landscape along the Brazilian Amazon and the consequent climate impacts arise at a variety of spatial and temporal scales [1,2,3]. Due the density of the in situ stations network along the Amazonian territory being the lowest in Brazil with the availability of few historical series [4], a complicating factor to characterize the regional climate [5], the numerical modeling tool has contributed greatly to the integrated scientific understanding of climate and environment of the region. Since the pioneering work by [6] that simulated a large-scale deforestation of the Amazon, several authors have conducted global and regional modeling experiments to evaluate the impacts of landuse and landcover (LULC) changes on the Amazon climate during the last decades. Consensual results indicate that the conversion of the forest into pasture/agriculture areas directly affects the regional energy balance with lower latent and higher sensible heat flux that explains the basin-wide increase in surface air temperature [7,8,9]. However, the effects on the water balance are spatially heterogeneous, with signs of increase and decrease in precipitation along the region [10,11]. The Regional Climate Model (RegCM4) simulations carried out by [12] under a scenario of Amazon deforestation (replacing broadleaf evergreen trees with grass) indicated robust results of higher air temperature (up to 2 °C) and a zonally dipole pattern response in the rainfall with a reduction over the west (7.9%) and an increase over the east (8.3%). Such opposite changes during Amazonian wet season are consistent with the findings of [13] and the rainfall intensification in eastern South America, including the Amazon region, was also simulated by [8].
Moreover, of particular importance is the global climate change as a critical factor in determining rainfall and air temperature in tropical South America, especially in the Amazonian region in the near- and long-term future [2,3]. An assessment and synthesis of ensemble projections of multiple global and regional models evaluated in the Fifth (CMIP5, [14]) and Sixth (CMIP6, [15]) Phase of the Coupled Model Intercomparison Project, under different future global emissions scenarios, was described by [16]. Overall, models project a very likely persistent air temperature increase over South America ranging from 1 to 6 °C by the end of the 21st century, so that the largest warmings are expected over the Amazon basin and central Andes. On the other hand, the climate projections show a general increase pattern in annual rainfall over southern South America and decrease in northern South America (including the Amazon), considering all global emissions scenarios over the coming decades [17,18].
Another noteworthy factor is the urbanization process which, acting synergistically with LULC changes and global climate change [1,3], can exacerbate socio-environmental impacts [19]. The disorderly urbanization is the most radical form of transformation of the natural landscape, generating an eminently anthropized environment [20]. Becker [21] demonstrated that in the Amazon, the urban development reached relevant proportions from the early 1990s onwards, when a major structural modification took place in the regional peopling that started to happen predominantly along the highways (and no longer along the rivers, as in the past). In the official 2000 Census data, 70% of the population of the Brazilian Amazonian states was in urban nucleus; thus, the author of [21] launched the denomination of “urbanized forest”.
Amid the considerable scientific advances mentioned above, regarding regional/global impacts particularly on the Amazon environment, attention to the issue of urbanization impacts on climate has been somewhat limited. In this context, the present work has two main objectives: (1) to describe the regional impacts of human-induced landcover changes on the seasonal climate regimes of the Metropolitan Region of Belém (MRB), the first frontier of Amazonian occupation; (2) to investigate the future global climate change impacts on MRB seasonality based on dynamic downscaling performed with the RegCM4 driven by a global model under the RCP8.5 scenario.

2. Material and Methods

Figure 1 illustrates the study area, the MRB located in northeast of the state of Pará in eastern Amazon (see reference map). The MRB encompasses seven municipalities that include Belém (the state capital), Ananindeua, Benevides, Castanhal, Marituba, Santa Bárbara, and Santa Isabel, whose total metropolitan area is 3566.3 km2. The 2020 landcover map shows the urban sprawl (red areas) encompassing most of Belém and adjacent municipalities of Ananindeua, Marituba, and Benevides, characterizing the conurbation process. Other urbanized centers are concentrated along the highway easterward, over municipal seats of Santa Isabel and Castanhal, as well as to the north in Santa Barbara and in the far north coastal strip of Belém. Concerning other landcover classes, it is possible to distinguish the spatial predominance of extensive areas of pasture/agriculture (yellow areas) over most of the central and eastern MRB. Some forest remnants (green areas) are observed over northern and southernmost areas.
We used the monthly precipitation (PREC) and surface air temperature (TEMP) data from in situ measurements of the conventional meteorological station in Belém, provided by the Instituto Nacional de Meteorologia (INMET). The station location (latitude −1.436, longitude −48.437, and altitude 7.13 m) is given by the triangle in Figure 1 (magenta symbol) and the data were available from January/1985 to December/2020. In addition, three observational gridded databases retrieved from satellites estimates merged with stations data were also used: the Climatic Research Unit (CRU) version 4 compiled by [22], the Climate Hazards group Infra-Red Precipitation with Stations (CHIRPS) described in [23], and the Climate Prediction Center Morphing technique (CMORPH) compiled by [24]. CRU has the variables PREC and TEMP, while CHIRPS and CMORPH contain only PREC, with time availability from 1985 to 2020, except CMORPH that is 1998 onwards. The high horizontal resolutions (CRU with 0.04° or 4.4 km; CHIRPS with 0.05° or 5.5 km; and CMORPH with 0.07° or 7.7 km) are suitable for regional climate studies, allowing to analyze the spatial PREC and TEMP patterns over the study area.
The environmental data were extracted from the MapBiomas platform (https://plataforma.brasil.mapbiomas.org, accessed on 2 December 2021), with data available at the municipal scale covering the historical series from 1985 to 2020 (Collection 6 published in August 2021). The Mapbiomas methodology is detailed in [25]. In summary, this multi-institutional initiative of groups of scientists generated annual landcover/landuse maps in matrix format (spatial resolution of 30 m) over Brazilian territory, from a pixel-by-pixel classification of a historical set of satellites images from Landsat 5, 7, and 8. The entire process was completed with extensive machine learning algorithms through the Google Earth Engine platform that offers high digital processing capacity in the cloud. For the present work, the thematic landcover maps were extracted for the MRB domain, considering five classifications that represent forest (FOR), non-forest (NFO), pasture/agriculture (PAG), urbanization (URB), and water bodies (WB). Thus, the annual digital data of FOR, NFO, PAG, URB, and WB in units of area in hectares (ha) on a municipal scale were obtained for the seven municipalities of the MRB during years 1985–2020.
Total population data for the years 1985–2020 for the seven MRB municipalities were obtained from Instituto Brasileiro de Geografia e Estatística (IBGE), which is the official organization in Brazil responsible for counting and estimating the population.
Several statistical and quantitative analyses were employed. Initially, descriptive statistics were calculated for the 1985–2020 historical series of Belém station PREC data, including the analysis of the annual cycle through the boxplots that graphically illustrate the main statistical parameters (mean, median, and quartiles). The monthly climatological percentages (relative to the annual total) of PREC from January to December were used to define the seasonal regimes. The consecutive months that present percentages above 10% were defined as the rainy regime (RAINY), while the successive months with percentages below 5% comprise the dry regime (DRY).
Climatological means (1985–2020) for RAINY and DRY regimes were obtained for observational databases to investigate the spatial PREC (CRU, CHIRPS, and CMORPH) and TEMP (only CRU) patterns along the MRB. The time series of PREC in both regimes for the three bases were extracted over Belém gridpoint, and also for the entire MRB (we used a computational routine that averages all grid points within the shapefile of the MRB) in order to verify what one best represents in situ and observational data. For this, we used the calculation of bias, correlation coefficient (r), and normalized standard deviation (σn) between the station and each observational base, then the Taylor diagram [26] was plotted to synthesize and interpret all statistical results for data comparison and validation. The gridded database with the best validation result will be used in the PREC and TEMP analyses for the entire MRB.
With the information derived from the MapBiomas, the annual sums of seven municipalities for each class of FOR, NFO, PAG, URB, and CA areas were computed to obtain the index for the whole MRB, aiming to evaluate the dynamics of human-induced landcover changes during the last three and a half decades. Visual inspection of the color-imaged maps that represent the surface cover classes was important in the spatiotemporal understanding of how the conversions and transformations from FOR to PAG or URB occurred throughout the region. To investigate the effects and impacts of the expansion of PAG and URB areas on MRB climatic seasonality, Pearson’s correlations were calculated between the series of PREC and TAR in the RAINY and DRY and the series of the landcover classes, with sample size n = 36 (1985 to 2020) and emphasizing the results with statistical significance given by p-value < 0.05. The scatter plots with the variations in the landcover classes and the PREC and TAR variables helped in these analyses, whose approach was conducted individually for the municipality of Belém and for the entire MRB. Furthermore, as a form of quantitative evidence the long-term trends in seasonal regimes during the present climate, the nonparametric Mann–Kendall test [27] was used, considering the null hypothesis Ho of non-existence of trend (series are randomly ordered in time), against the alternative hypothesis H1 that there is a monotonic tendency of increase or decrease in the variable. The test provides Kendall’s τ whose positive or negative sign indicates increasing or decreasing trend, and the p-value is calculated at the 5% level to accept or reject the alternative hypothesis.
To achieve the second objective of this work, a dynamic downscaling over the MRB domain was performed using version 4.7.1 of RegCM4 (source code available at https://github.com/ictp-esp/RegCM, accessed on 10 March 2020), which is the fourth generation of the regional modeling system developed at the International Center for Theoretical Physics (ICTP). This latest updated version includes multiple choices of different physical processes and new convective parameterization schemes, as detailed in [28]. As the approach of this work is in a metropolitan area, requiring simulations in high horizontal resolution, RegCM was compiled with the non-hydrostatic core using the Biosphere–Atmosphere Transfer Scheme (BATS, [29]) to describe land surface processes. Global databases describing land cover features with 30s spatial resolution are from GLCC [30] and digital terrain topography and elevation (GTOPO) were provided by USGS. The initial and lateral boundary conditions every 6 h (variables: SST, relative humidity, geopotential height, air temperature, zonal and meridional wind) required to run the RegCM4 downscaling were taken from Hadley Centre Global Environmental Model version 2 (HadGEM2-ES), an earth system model considered state-of-the-art in global climate simulations with representation of terrestrial ecosystems, dynamic vegetation, oceanic circulation, and tropospheric chemistry including the processes of greenhouse gases and aerosols and the carbon cycle [31]. HadGEM2-ES produced global outputs with lon-lat resolution of 1.875° × 1.25° (see Figure 2a, left map) corresponding to CMIP5 under the IPCC/AR5 emissions scenario named as RCP8.5, which is considered the most extreme in terms of future impacts of global climate change [32].
The RegCM4 domain was defined over the MRB (56 × 44 points in longitude and latitude, with a central point at 1.3° S and 48.3° W) considering a grid spacing of 0.045° (5 km horizontal resolution) and 23 vertical sigma-p levels. Then, we ran the RegCM4 routine to generate the grid domain with the soil and surface data (topography and landcover classes). We found that the default landcover in the study area showed some discrepancies (especially the absence of urban areas) compared to the current data generated by Mapbiomas. Thus, we used the version of the BATS code within RegCM4 that was updated by [33] in which the new landcover class that represents urban coverage was introduced, so that albedo values, roughness and soil characteristics simulate changes in energy balance specific to urbanized centers. Figure 2b shows the regional domain and updated landcover map configured in RegCM4 with the MRB situated in the northeast of the state of Pará in eastern Brazilian Amazon. This map shows the URB areas covering Belém and municipalities eastward (dark red grid points), as well as the extensive PAG (in yellow) areas and remaining FOR (in green) cover, in accordance with the 2020 landcover map generated by MapBiomas (see Figure 1).
Three experiments using RegCM4 with different convective parameterizations were conducted, the Emanuel scheme (EMA) [34], the Kain–Fritsch scheme (KFR) [35], and the Tiedtke scheme (TIE) [36]. All simulations were performed for a continuous integration starting on 1 January 2005 and ending on 31 December 2045 (41 years long run), with the first year being discarded, considered a spin-up period. The RegCM4 simulations were conducted using high-performance computing technology and parallel processing in a cluster containing a total of 112 processors. The PREC and TAR patterns in the RAINY and DRY regimes simulated by RegCM4 were compared with the observational databases (CRU, CHIRPS, and CMORPH). The verification of the best configuration of the model (EMA, TIE, and KFR) in relation to the in situ Belém data was carried out, based on the statistics, and plotting of the Taylor diagram (method already mentioned above). For the purpose of model validation (in terms of the spatial patterns over the study area), the bias between the TAR and PREC simulated by RegCM4 and the CRU and CHIRPS observational data was calculated considering the 15-year statistics, 2006–2020, that is the coincident period between observations and simulations. Finally, the bias correction method was applied to the results of future simulations generated by RegCM4, aiming to demonstrate the differences between the near-future (next 25 years, 2021–2045) and the present climate (last 35 years, 1986–2020). In these comparative analyses, the two-tailed Student’s t-test with a level of 5% (p-value < 0.05) will be considered to confirm whether the difference between the future and present means is statistically significant.

3. Results

3.1. Annual Cycle and Seasonal Regimes

Figure 3a shows a very well-defined annual cycle in Belém, with the first four months of the year presenting PREC above 10 mm/day and TEMP below 26.6 °C (rainier and less hot period), while in the second semester, mainly between July and November, the PREC decreases for values below 5 mm/day and TEMP rises above 27 °C (less rainy and warmer period). The quantitative values of the other parameters obtained in the descriptive statistics can be found in Table A1 (see Appendix A). Monthly percentages in Figure 3b reveal that the RAINY regime occurs in the consecutive months from January to April (percentages > 10%), while the DRY regime (DRY) occurs successively between the months of July and November (percentages < 5%). Thus, all the results of this work refer to the seasonal means of the four months in the RAINY and the five months in the DRY regime.

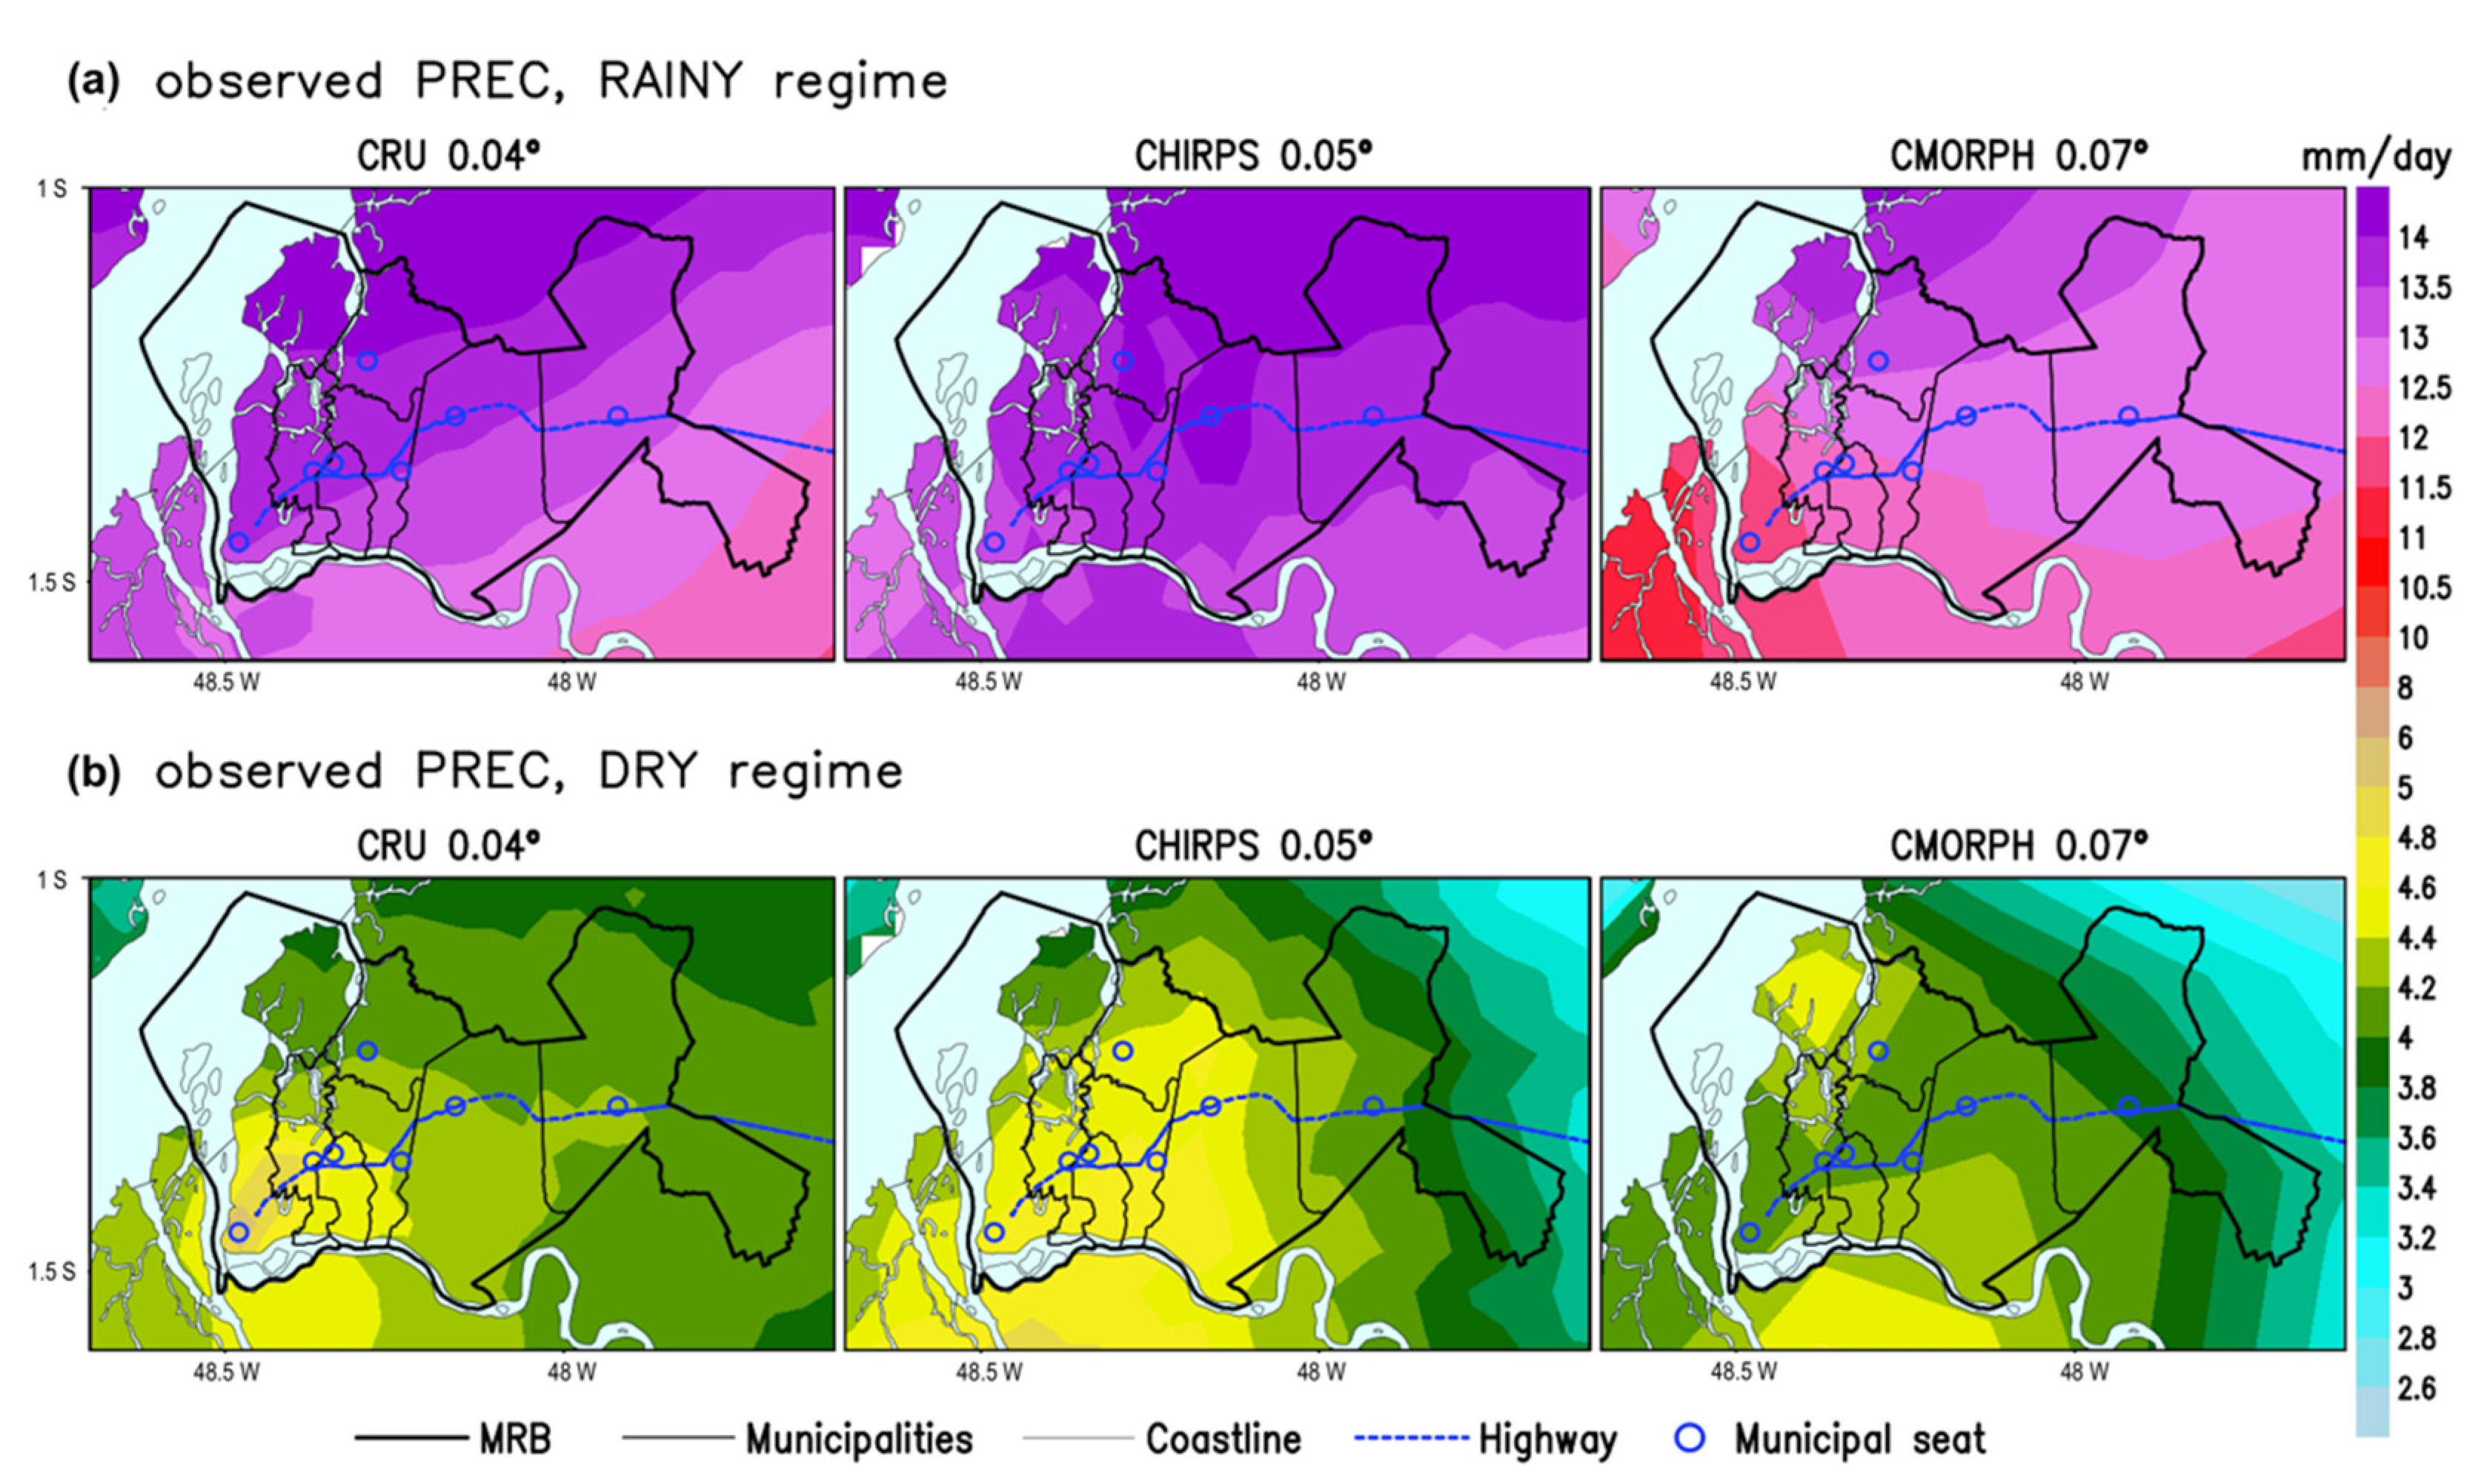
3.2. Observed and Simulated PREC and TEMP in the Present Climate

Figure 4 and Figure 5 show the respective climatological patterns of the observed (CRU, CHIRPS, and CMORPH) and simulated (EMA, TIE, and KFR schemes) PREC over MRB in the RAINY and DRY regimes, considering the present climate. For the RAINY, the three observed databases exhibit similar spatial patterns with rainfall increasing towards the north of the region, reaching above 13.5 mm/day. The central and south sectors encompassing Belém, Ananindeua, Marituba, Santa Isabel, and Castanhal present PREC between 12 and 13 mm/day (Figure 4a). The three RegCM4 convective schemes did not reproduce well the maximum rainfall to the north of the region in the RAINY, but the TIE shows a PREC pattern along the central and southern MRB with values around 12–13.5 mm/day like the intensity verified in the observed data. The EMA restricts PREC in Belém, while the KFR simulates generalized PREC over the entire domain that are much higher than the observed pattern (Figure 5a). On the other hand, the DRY (Figure 4b) is characterized by the presence of an approximately rounded area with maximum PREC (values 4–5 mm/day) centered in Belém and a gradual decrease towards the edge of the area, along the municipalities to the eastern MRB. This configuration appears most clearly in the CRU and CHIRPS data. CMOPRH has a slightly different pattern. Examining the patterns simulated by RegCM4 in the DRY regime (Figure 5b), it was found that the EMA and KFR schemes differ from the observed pattern, while the TIE can better capture the rounded area of PREC, similarly to the CRU and CHIRPS results.
The CRU TEMP is consistent with the in situ Belém data (see Figure 3a), with milder (less hot) conditions during the RAINY and much warmer in the DRY regime, whose patterns are reproduced by RegCM4 simulations. An interesting pattern in both seasonal regimes is the presence of a zonal thermal gradient over the metropolitan area, with higher values to the western (Belém) and a gradual decrease to the municipalities located east of the MRB. In the RAINY (Figure 6a), the CRU shows higher TEMP in the municipality of Belém (western portion) reaching 27.4 °C and in the areas further east the values decrease to 27.2 and 27.0 °C. An overestimation is noted in the KFR simulation, but EMA and TIE capture well the CRU observed pattern, although the model shows a zonal band of heating along the highway. In the DRY regime (Figure 6b), CRU exhibits TEMP above 28.6 °C in the western and lower values between 27.8 and 28.2 °C in the eastern portion. RegCM4 again simulated overestimated TEMP in the KFR scheme, but the EMA and TIE are closer to the observed patterns.
Concerning the variable precipitation, the verification of what is the best observational database and the best RegCM4 configuration, in relation to the in situ Belém data, is based on statistical results listed in Table A2 (Appendix A) and the Taylor diagrams shown in Figure 7. The best statistical scores for the RAINY regime were found for CRU with r = 0.91 and R2 = 0.82, while the TIE simulation obtained r = 0.36 and R2 = 0.14. For the DRY regime, the highest values were obtained for CHIRPS (r = 0.86 and R2 = 0.74) and TIE (r = 0.5 and R2 = 0.30). In the Taylor diagram, the positioning of the results over the region containing the smallest errors (lines in green) and largest correlations (lines in blue) demonstrates that the best observational basis is CRU for the RAINY and is CHIRPS for the DRY regime, and the TIE is the best RegCM4 simulation for both seasonal regimes (Figure 7).

3.3. Landcover Changes and Impacts on Seasonal Regimes during the Present Climate

The integrated historical analysis (1985–2020) of landcover (MapBiomas) and climate data, both on a municipal scale, allowed us to establish the multitemporal dynamics of environmental transformations on the landscape and their effects or impacts on climate seasonality considering the entire MRB (regional scale), as well as only the municipality of Belém (local scale).
First, we present the results for the regional perspective, through the temporal sequence of the thematic landcover maps (Figure 8a), the percentages by classes (Figure 8b) specifically in the years 1985, 1995, 2005, 2015, and 2020, as well as the complete annual series of FOR, PAG, and URB areas (Figure 8c–e). In the percentage graphs and annual series, it is verified that the FOR (results in green) fluctuated from 205,241 ha in 1985 (57.6% of the total area) to 141,414 ha in 2020 (decrease to 39.7% of the total area). Conversely, the PAG (results in yellow) ranged from 62,879 ha in 1985 to 114,950 ha in 2020, a proportion increasing from 17.6% to 32.2% of the total area. It is visually perceived in the landcover maps that the FOR was significantly suppressed especially over the central and eastern portions, whose areas were exactly where the PAG enlargement took place. The other class with significant changes was the URB (results in red), ranging from 21,806 ha (6.1% of the total area) in 1985 to 35,832 ha (10% of the total area) in 2020, corresponding to a 3.9% growth in the urban areas built over the region. Such a systematic increase in URB is seen in the maps preferably in the northernmost portions together with some areas along the highway that zonally crosses the region. The two remaining classes of WB and NFL showed significantly smaller changes, so they will not be emphasized in the analyses.
We analyzed the landcover changes for Belém on a municipal scale (Figure A1, Appendix A). We evidenced that the greatest transformations of the landscape in Belém were processed in the classes of FLO and URB. FLO cover ranged from 33,828 ha (31.9%) in 1985 to 28,911 ha (27.3%) in 2020, signaling a vegetation suppression of 4.6%. URB areas expanded from 11,418 ha (10.8%) in 1985 to 16,063 ha (15.2%) in 2020, representing an increase of 4.4%. The PAG areas had a positive variation from 2704 ha (2.6%) in 1985 to 4226 ha (4.0%) in 2020, corresponding to an intensification of 1.4%. The coverage of WB, which occupies over half of the total area (53.3%) reduced by only 0.1% in recent decades. NFO areas decreased by 1.0% in the period, with 1386 ha (1.3%) in 1985 and 283 ha (0.3%) in 2020.
Figure 9a summarizes the most relevant anthropic transformations in the landscape of MRB (brown bars) and Belém (green bars) between 1985 and 2020 (the last three and a half decades). The vegetation cover area of the MRB was systematically reduced along the municipalities of the central-eastern portion (−17.9% FLO), whose conversion occurred primarily to areas destined for agriculture and pasture activities associated with cattle raising (+14.6% PAG) and to a minor extent for expansion of urbanized areas (+3.9% URB). On the other hand, the continental Belém experienced a vegetation suppression of forests (−4.6% FLO), whose conversion was mainly due to the enlargement of urban areas (+4.4% URB) to the northernmost portion and, to a lesser extent, for pasture/agriculture areas (+1.4% PAG). Such environmental changes are directly linked to the intensified human occupation in the last three decades, as according to IBGE estimates illustrated in Figure 9b. The MRB showed a significant growth in the total population from 1,360,160 in 1985 to 2,529,178 inhabitants in 2020, totaling a positive variation of 85.9%, while Belém varied from 1,120,777 in 1985 to 1,499,641 inhabitants in 2020, totaling a population growth of around 33.8% in the period.
As intense anthropism has induced deep long-term changes in the landscape, the triggering of impacts on climate seasonality is consequently assumed, whose understanding was approached through the calculations of Pearson’s correlations between the annual series (1985 to 2020) of FLO, PAG, and URB and the TEMP and PREC series for the RAINY and DRY regimes. In the case of the TEMP variable, the effects resulting from landcover changes are direct (alteration of the energy balance and partition of latent/sensible heat fluxes by regulating the surface air temperature), while the PREC variable, although it has some direct signal, the most dominant effect is indirect (remote climate mechanisms and external precipitating meteorological systems). Table 1 shows the results emphasizing significant correlations with p-value < 0.05 for TEMP (direct effect) and p-value < 0.10 for PREC (non-direct effect). Results for TEMP in Belém in both RAINY and DRY showed significant negative correlations with FLO and positive correlations with URB. For TEMP in MRB in both seasonal regimes, significant correlations were observed with a negative sign for FLO and positive for PAG and URB.
The scatterplots in Figure 10 help to interpret the results of the significant correlations particularly for the variable TEMP. For Belém (Figure 10a), the expansion of the URB area explained the systematic increase in TEMP with a more intense impact in the DRY (R2 0.78) than the RAINY regime (R2 0.51). Considering the entire MRB (Figure 10b), the joint spatial enlargement of the PAG and URB areas is strongly related to the continuous increase in TEMP with greater effect in the DRY (R2 0.56 for PAG and 0.73 for URB) and lower impacts in the RAINY regime (R2 0.41 for PAG and 0.46 for URB).
An additional quantitative analysis was conducted to demonstrate long-term trends in seasonal TEMP and PREC patterns. The results of the Mann–Kendall test applied on the original time series of TEMP and PREC in Belém and MRB in both seasonal regimes are shown in Table 2. The TEMP in Belém showed a slope of Sen and positive τ with values of 0.52 and 0.66 in the RAINY and DRY, respectively. For the TEMP in MRB, the trend test indicated an increasing Sen slope and a positive τ 0.70 (the most intense of all results) for the DRY and τ 0.48 for RAINY regime. For PREC, significant positive trends were evidenced only for the RAINY regime in Belém and MRB, with a positive slope and τ of 0.37 and 0.31, respectively.

3.4. Projections of Future Scenarios Associated with Global Climate Change

The future projections generated by dynamic downscaling (RegCM4 nested to HadGEM2-ES) are presented only for the results using the TIE scheme (best configuration of the regional model for the study area). The geographic domain of the MRB within RegCM4 contemplates the current 2020 landcover (URB, PAG, and FOR remnants) which was kept constant throughout the simulation. Therefore, the primary forcing of future climate is related to climate change induced by the most extreme global warming scenario (RCP8.5).
The bias correction method (2006 to 2020 statistics between simulated and observed data) was applied on the results of RegCM4 simulations. With this, it was possible to quantitatively compute the changes in seasonal patterns of PREC and TEMP for the future climate (next 25 years, 2021–2045) relative to the present climate observed data (last 35 years, 1986–2020). Such results are plotted in Figure 11 with the changes patterns of TEMP in °C and PREC in percentages (%). The future climate conditions simulated by RegCM4 indicate the continuation of the widespread warming trend of the near-surface atmosphere over MRB, with the increase in TEMP in the RAINY regime varying from 0.98 °C in the western to 1.1 °C in the eastern portion of the region, while in the DRY more intense impacts are expected, with an increase in TEMP of 1.6 °C in the western and 1.72 °C in the eastern MRB (Figure 11, left panel). On the other hand, future changes in the spatial PREC patterns (Figure 11, right panel) point to a progression of intensification of the RAINY regime, i.e., an increase of about 20% in the western portion to 30% in the easternmost municipalities of MRB. In the DRY regime, a heterogeneous pattern is predicted with signs of a weak increase in PREC up to 5% in the southern Belém and Santa Isabel and northern Castanhal, while in the rest of the municipalities, notably in the central (Ananindeua, Marituba, and Benevides) and north portion (northern Belém and Santa Bárbara) there are indications of decreased PREC up to −5%.
To complement the understanding of climate change, observed and simulated TEMP and PREC data were extracted for the entire MRB (regional scale) and for the municipality of Belém (local scale) and plotted in the form of boxplots to better summarize the visualization and comparison of present and future climate. The TEMP boxplots clearly illustrate the change in behavior of the statistical parameters (mean, median, 1st and 3rd quartiles) of future climate compared to present climate (Figure 12a). Figure 12c emphasizes the increase in TEMP that in the DRY regime reaches 1.5 °C in the MRB and 1.3 °C in Belém, while in the RAINY regime it reaches 1 °C in the MRB and 0.9 °C in Belém. On the other hand, it is not possible to notice major differences in the behavior of the PREC boxplots of the DRY regime in the periods considered (present and future). However, as already mentioned, the RAINY regime reveals significant changes in the statistical parameters of PREC for the future climate compared to the present climate. Figure 12d summarizes the percentage changes in PREC that in the RAINY increase by around 25% in MRB and around 14% in Belém. In the DRY regime, the predicted changes are a decrease in PREC of around 5% in MRB and 3% in Belém. The statistical verification whether the differences between the means of future and present climate are significantly consistent is based on the calculation of Student’s t-test at the 5% level (p-value < 0.05), whose results are shown in Table A3 (Appendix A). As expected, the differences for TEMP in MRB and Belém in both seasonal regimes are statistically significant, as well as the PREC in MRB and Belém only for the RAINY regime.

4. Discussion and Conclusions

Based on comprehensive quantitative analyses integrating high-resolution observational climate measurements (in situ and satellite) with environmental data (LCLU mapping using advanced remote sensing techniques) during the last three decades (1985/2020), considered as the present climate, we evidenced the following key results:
  • Considering the local/municipal scale of Belém, the disorderly enhanced urban sprawl conditioned a warmer local climate with statistically significant positive trends in surface air temperature in both seasonal regimes, being much more intense in the DRY season;
  • Taking into account the regional scale of the entire MRB, the forest vegetation suppression primarily led to the uncontrolled expansion of pasture/agriculture areas, whose environmental changes explained the monotonic increase trend in air temperature in the two seasonal regimes, with greater intensity in the DRY regime;
  • In Belém and the entire MRB, there were no changes in the rainfall of the DRY period; however, a systematic intensification of the precipitation during the RAINY regime was clearly evidenced.
Our results contributed to improving regional climatological knowledge particularly for the eastern Amazon and are consistent with previous studies that considered broader aspects related to the observed and simulated LULC impacts on the Amazon climate [12]. Concerning the mean air temperature over the Amazon region, observational studies have detected an increase of the order of 0.7 °C in the last 40 years, with several data sources indicating that the last two decades (2000s and 2010s) were the warmest [3,37]. Therefore, the basin-wide warming trends over the Amazon are unequivocal as a result of the synergistically integrated impacts related to LULC changes and ongoing global climate change [2,12,38,39]. Here, we demonstrate that the effect of urbanization in an eastern Amazon metropolis also explains the significant trend of atmospheric warming on a local/municipal scale. On the other hand, there are numerous works focusing on precipitation trends. Although most studies have reported that there is no systematic unidirectional trend for the twentieth century [40,41], some statistical calculations applied in different updated databases have indicated significantly drier conditions in the southern and wetter in the northern Amazon [42]. In particular, the persistent signal of increased precipitation observed in the present study for the MRB (near the mouth of the Amazon basin), during the peak of the rainy regime, is in agreement with [41,43,44] who documented positive trends individually for pluviometric series of the Belém station.
Finally, we conducted a climate modeling study (RegCM4 driven by HadGEM2-ES under the scenario RCP8.5 considered more extreme in the emissions of greenhouse gases that exacerbate future global warming) for the MRB in a 5 km domain with the inclusion of the urban cover class in the processes of the surface model, which allowed the generation of the following main results:
  • Warmer climate conditions are expected to persist in the coming decades, with projections of an increase in mean air temperature reaching 1.5 °C in MRB and 1.3 °C in Belém during the DRY and 1 °C in the MRB and 0.9 °C in Belém during the RAINY regime;
  • Regarding precipitation, the intensification of the RAINY season persists in the next two decades, with an increase of about 25% in the MRB and 14% in Belém. Future projections for the DRY regime do not point out significant changes.
The climate modeling approach of representing urban processes in densely populated regions of the Amazon was pioneered in the present work, giving robustness to the climate projections on a regional scale for the entire MRB and on a local scale for Belém. The projections obtained for our study area are generally in accordance with some previous global and regional simulations for the Amazon [17,18].
The 1.5 °C increase predicted to occur in the MRB in the next two decades, before the mid-21st century, has worrying implications, as it is precisely this threshold established by the Glasgow Climate Pact [45] that the global temperature should not exceed. Likewise, the projection of an intensification of around 25% in the MRB rainy period is closely related to the increased frequency of extreme precipitation events [46], with high potential of aggravation of urban flooding, that in turn provokes serious socioeconomic damage to the local population. In a long-term field study aimed at the application of climate perception questionnaires to the residents of Belém’s neighborhoods, it was indicated that the population is perceiving a warmer climate with the heavy rainfall events more frequent over the years, in such a way that these conditions already reflect the local climate change due to urbanization [47].
Therefore, considering the aforementioned scientific knowledge and supported by our observational/modeling findings, we conclude that, taken together, suppression of forest areas with intense alteration/degradation of landcover for use mainly in cattle rising, the intensification of urbanization, as well as global climate change, we have a set of regional/global factors that can result in even faster significant climate and environmental changes in some parts of the Amazon, such as the metropolitan region studied here.
Moreover, our findings for the MRB (area 3565 km2 for a population about 2.5 million inhabitants) are relevant and considering them is essential in government actions for urban policy, as they can help in the tasks of long-term planning and elaboration of advanced strategies to mitigate future climate risks. Additionally, these results should be used to improve urban disaster management.

Author Contributions

C.B.B.G. and E.B.d.S.: conceptualization and methodology; C.B.B.G. and D.M.G.G.: validation and statistical calculations; E.B.d.S. and C.B.B.G.: writing original draft; C.B.B.G., E.B.d.S. and D.M.G.G.; writing—review and editing; E.B.d.S.: supervision and project administration. All authors have read and agreed to the published version of the manuscript.

Funding

The APC was funded by the Pró-Reitoria de Pesquisa e Pós-Graduação/Universidade Federal do Pará (PROPESP/UFPA)—PAPQ (Programa de Apoio à Publicação Qualificada).

Acknowledgments

The authors thank the reviewers for their constructive comments and suggestions, and ICTP for providing the RegCM4. C.B.B.G. thanks UEPA for the doctoral scholarship. E.B.d.S thanks CNPQ (PQ2 process 313148/2020-1 and project process 442261/2020-9).

Conflicts of Interest

The authors declare no conflict of interest.

Appendix A

Table A1. Descriptive statistic calculated for the 1985–2020 historical series of Belém station PREC.
StatisticsJanFebMarAprMayJunJulAugSepOctNovDec
1st Quartile11.412.813.613.58.54.63.83.03.23.33.26.7
Median12.715.015.415.39.67.15.14.34.34.44.38.5
3rd Quartile14.316.518.217.213.28.66.35.85.15.36.311.3
Mean12.715.616.015.410.26.85.24.44.44.35.19.0
Variance8.714.612.58.110.85.84.83.94.03.59.310.3
Stand. deviation2.93.83.52.83.32.42.22.02.01.93.03.2
Coeff. variation0.230.240.220.180.320.350.420.440.450.430.600.36
Table A2. Bias, correlation coefficient r, coefficient of determination R2, and normalized standard deviation σn in RAINY and DRY regimes calculated between PREC station data and the observational bases (CRU, CHIRPS, and CMORPH) and RegCM4 simulations (EMA, TIE, and KFR).
BiasrR2σn
RAINYDRYRAINYDRYRAINYDRYRAINYDRY
CRU1.010.100.910.840.820.700.910.60
CHIRPS1.850.360.770.860.590.740.720.92
CMORPH2.490.980.380.830.150.690.831.01
RegCM4 EMA6.511.610.160.350.050.120.370.26
RegCM4 TIE3.430.750.360.550.140.300.680.33
RegCM4 KFR3.570.390.310.480.100.230.930.75
Figure A1. Results for Belém, (a) percentages by landcover classes; (b) URB urbanization; (c) PAG pasture/agriculture; and (d) URB urbanization. Results for a are shown in the years 1985, 1995, 2005, 2015, and 2020. The annual series for (bd) are in area (ha) from 1985 to 2020.
Atmosphere 13 01077 g0a1
Table A3. Differences between the means of future (2021/20245) and present (1985/2020) for TEMP and PREC in the RAINY and DRY for Belém and MRB, and the p-value obtained in Student’s t-test.
Differences between the Means of Future and Present p-Value
RAINYDRYRAINYDRY
TEMP Belém (°C)0.90 11.32 1<0.0001<0.0001
TEMP MRB(°C)1.00 11.53 1<0.0001<0.0001
PREC Belém (mm)2.071 10.15<0.00010.498
PREC MRB (mm)3.403 1−0.19<0.00010.322
1 statistically significant value.

References

  1. Davidson, E.A.; de Araujo, A.C.; Artaxo, P.; Balch, J.K.; Brown, I.F.; Wofsy, S.C. The Amazon basin in transition. Nature 2012, 481, 321–328. [Google Scholar] [CrossRef] [PubMed]
  2. Nobre, C.A.; Sampaio, G.; Borma, L.S.; Castilla-Rubio, J.C.; Silva, J.S.; Cardoso, M. The Fate of the Amazon Forests: Land-use and climate change risks and the need of a novel sustainable development paradigm. Proc. Natl. Acad. Sci. USA 2016, 113, 10759–10768. [Google Scholar] [CrossRef] [PubMed] [Green Version]
  3. Marengo, J.A.; Souza, C.; Thonicke, K.; Burton, C.; Halladay, K.; Betts, R.A.; Alves, L.M.; Soares, W.R. Changes in Climate and Land Use Over the Amazon Region: Current and Future Variability and Trends. Front. Earth Sci. 2018, 6, 228. [Google Scholar] [CrossRef]
  4. Sombroek, W. Spatial and Temporal Patterns of Amazon Rainfall. AMBIO J. Hum. Environ. 2001, 30, 388–396. [Google Scholar] [CrossRef]
  5. Paca, V.H.d.M.; Espinoza-Dávalos, G.E.; Moreira, D.M.; Comair, G. Variability of Trends in Precipitation across the Amazon River Basin Determined from the CHIRPS Precipitation Product and from Station Records. Water 2020, 12, 1244. [Google Scholar] [CrossRef]
  6. Nobre, C.A.; Sellers, P.J.; Shukla, J. Amazonian deforestation and regional climate change. J. Clim. 1991, 4, 957–988. [Google Scholar] [CrossRef] [Green Version]
  7. Nobre, P.; Malagutti, M.; Urbano, D.F.; de Almeida, R.A.F.; Giarolla, E. Amazon Deforestation and Climate Change in a Coupled Model Simulation. J. Clim. 2009, 22, 5686–5697. [Google Scholar] [CrossRef]
  8. Silva, M.E.S.; Pereira, G.; da Rocha, R.P. Local and remote climatic impacts due to land use degradation in the Amazon “Arc of Deforestation”. Theor. Appl. Climatol. 2016, 125, 609–623. [Google Scholar] [CrossRef]
  9. Alves, L.M.; Marengo, J.A.; Fu, R.; Bombardi, R.J. Sensitivity of Amazon Regional Climate to Deforestation. Am. J. Clim. Change 2017, 6, 75–98. [Google Scholar] [CrossRef] [Green Version]
  10. Gandu, A.; Cohen, J.; de Souza, J. Simulation of deforestation in eastern Amazonia using a high-resolution model. Theor. Appl. Climatol. 2004, 78, 123–135. [Google Scholar] [CrossRef]
  11. Mu, Y.; Jones, C. An observational analysis of precipitation and deforestation age in the Brazilian Legal Amazon. Atmos. Res. 2022, 271, 106122. [Google Scholar] [CrossRef]
  12. Llopart, M.; Reboita, M.S.; Coppola, E.; Giorgi, F.; Da Rocha, R.P.; De Souza, D.O. Land Use Change over the Amazon Forest and Its Impact on the Local Climate. Water 2018, 10, 149. [Google Scholar] [CrossRef] [Green Version]
  13. Ramos da Silva, R.; Werth, D.; Avissar, R. Regional impacts of future land-cover changes on the Amazon basin wet-season climate. J. Clim. 2008, 21, 1153–1170. [Google Scholar] [CrossRef]
  14. Taylor, K.E.; Stouffer, R.J.; Meehl, G.A. An Overview of CMIP5 and the Experiment Design. Bull. Am. Met. Soc. 2012, 93, 485–498. [Google Scholar] [CrossRef] [Green Version]
  15. Eyring, V.; Bony, S.; Meehl, G.A.; Senior, C.A.; Stevens, B.; Stouffer, R.J.; Taylor, K.E. Overview of the Coupled Model Intercomparison Project Phase 6 (CMIP6) experimental design and organization. Geosci. Model Dev. 2016, 9, 1937–1958. [Google Scholar] [CrossRef] [Green Version]
  16. Gutiérrez, J.M.; Jones, R.G.; Narisma, G.T.; Alves, L.M.; Amjad, M.; Gorodetskaya, I.V.; Grose, M.; Klutse, N.A.B.; Krakovska, S.; Li, J.; et al. Climate Change 2021: The Physical Science Basis. Contribution of Working Group I to the Sixth Assessment Report of the Intergovernmental Panel on Climate Change, 1st ed.; Masson-Delmotte, V., Zhai, P., Pirani, A., Connors, S.L., Péan, C., Berger, S., Caud, N., Chen, Y., Goldfarb, L., Gomis, M.I., et al., Eds.; Cambridge University Press: Cambridge, UK; New York, NY, USA, 2021; pp. 1927–2058. [Google Scholar] [CrossRef]
  17. Llopart, M.; Coppola, E.; Giorgi, F.; Da Rocha, R.P.; Cuadra, S.V. Climate change impact on precipitation for the Amazon and La Plata basins. Clim. Chang. 2014, 125, 111–125. [Google Scholar] [CrossRef] [Green Version]
  18. Ambrizzi, T.; Reboita, M.S.; da Rocha, R.P.; Llopart, M. The state of the art and fundamental aspects of regional climate modeling in South America. Ann. N. Y. Acad. Sci. 2019, 1436, 98–120. [Google Scholar] [CrossRef]
  19. Borma, L.S.; Nobre, C.A.; Cardoso, M.F. 2.15—Response of the Amazon Tropical Forests to Deforestation, Climate, and Ex-tremes, and the Occurrence of Drought and Fire. In Climate Vulnerability; Roger, A.P., Ed.; Academic Press: Cambridge, MA, USA, 2013; pp. 153–163. [Google Scholar] [CrossRef]
  20. Lima, G.N.; Lombardo, M. Urban climatology in Brazil: An analysis based on the methodology of the urban climate system. Environ. Conserv. J. 2019, 20, 1–8. [Google Scholar] [CrossRef] [Green Version]
  21. Becker, B.K. Geopolítica da amazônia. Est. Avançados 2005, 19, 71–86. [Google Scholar] [CrossRef]
  22. Harris, I.; Osborn, T.J.; Jones, P.; Lister, D. Version 4 of the CRU TS monthly high-resolution gridded multivariate climate dataset. Sci. Data 2020, 7, 109. [Google Scholar] [CrossRef] [Green Version]
  23. Funk, C.; Peterson, P.; Landsfeld, M.; Pedreros, D.; Verdin, J.; Shukla, S.; Husak, G.; Rowland, J.; Harrison, L.; Hoell, A.; et al. The climate hazards infrared precipitation with stations—A new environmental record for monitoring extremes. Sci. Data 2015, 2, 150066. [Google Scholar] [CrossRef] [PubMed] [Green Version]
  24. Xie, P.; Joyce, R.; Wu, S.; Yoo, S.; Yarosh, Y.; Sun, F.; Lin, R. Reprocessed, Bias-Corrected CMORPH Global High-Resolution Precipitation Estimates from 1998. J. Hydromet. 2017, 18, 1617–1641. [Google Scholar] [CrossRef]
  25. Souza, C.M.Z.; Shimbo, J.; Rosa, M.R.; Parente, L.L.; Alencar, A.A.; Rudorff, B.F.T.; Hasenack, H.; Matsumoto, M.; Ferreira, L.G.; Souza-Filho, P.W.M.; et al. Reconstructing Three Decades of Land Use and Land Cover Changes in Brazilian Biomes with Landsat Archive and Earth Engine. Remote Sens. 2020, 12, 2735. [Google Scholar] [CrossRef]
  26. Taylor, K.E. Summarizing multiple aspects of model performance in a single diagram. J. Geoph. Res. 2001, 106, 7183–7192. [Google Scholar] [CrossRef]
  27. Hirsch, R.M.; Slack, J.R.; Smith, R.A. Techniques of trend analysis for monthly water quality data. Water Resour. Res. 1982, 18, 107–121. [Google Scholar] [CrossRef] [Green Version]
  28. Giorgi, F.; Coppola, E.; Solmon, F.; Mariotti, L.; Sylla, M.B.; Bi, X.; Elguindi, N.; Diro, G.T.; Nair, V.; Giuliani, G.; et al. RegCM4: Model description and preliminary tests over multiple CORDEX domains. Clim. Res. 2012, 52, 7–29. [Google Scholar] [CrossRef] [Green Version]
  29. Dickinson, R.E.; Henderson-Sellers, A.; Kennedy, P.J. Biosphere–Atmosphere Transfer Scheme (BATS) Version 1e as Coupled to the NCAR Community Model; NCAR Technical Note NCAR/TN-3871STR; National Center for Atmospheric Research: Boulder, CO, USA, 1993; p. 72. [Google Scholar]
  30. Loveland, T.R.; Reed, B.C.; Brown, J.F.; Ohlen, D.O.; Zhu, Z.; Yang, L.; Merchant, J.W. Development of a global land cover characteristics database and IGBP DISCover from 1 km AVHRR data. Int. J. Remot. Sens. 2000, 21, 1303–1330. [Google Scholar] [CrossRef]
  31. Collins, W.J.; Bellouin, N.; Doutriaux-Boucher, M.; Gedney, N.; Halloran, P.; Hinton, T.; Hughes, J.; Jones, C.D.; Joshi, M.; Liddicoat, S.; et al. Development and evaluation of an Earth-System model—HadGEM2. Geosci. Model Dev. 2011, 4, 1051–1075. [Google Scholar] [CrossRef] [Green Version]
  32. Van Vuuren, D.P.; Edmonds, J.; Kainuma, M.; Keywan, R.; Thomson, A.; Hibbard, K.; Hurtt, G.C.; Kram, T.; Krey, V.; Lamarque, J.F.; et al. The representative concentration pathways: An overview. Clim. Change 2011, 109, 5. [Google Scholar] [CrossRef]
  33. Huszar, P.; Halenka, T.; Belda, M.; Zak, M.; Sindelarova, K.; Miksovsky, J. Regional climate model assessment of the urban land-surface forcing over central Europe. Atmos. Chem. Phys. 2014, 14, 12393–12413. [Google Scholar] [CrossRef] [Green Version]
  34. Emanuel, K.A.; Zivkovic-Rothman, M. Development and evaluation of a convection scheme for use in climate models. J. Atmos. Sci. 1999, 56, 1766–1782. [Google Scholar] [CrossRef] [Green Version]
  35. Anderson, C.J.; Arritt, R.W.; Kain, J.S. An Alternative Mass Flux Profile in the Kain–Fritsch Convective Parameterization and Its Effects in Seasonal Precipitation. J. Hydrometeorol. 2007, 8, 1128–1140. [Google Scholar] [CrossRef]
  36. Tiedtke, M. A Comprehensive Mass Flux Scheme for Cumulus Parameterization in Large-Scale Models. Mon. Weather. Rev. 1989, 117, 1779–1800. [Google Scholar] [CrossRef] [Green Version]
  37. Almeida, C.T.; Oliveira-Júnior, J.F.; Delgado, R.C.; Cubo, P.; Ramos, M.C. Spatiotemporal rainfall and temperature trends throughout the Brazilian Legal Amazon, 1973–2013. Int. J. Climatol. 2017, 37, 2013–2026. [Google Scholar] [CrossRef]
  38. Silva, P.E.; Silva, C.M.S.; Spyrides, M.H.C.; Andrade, L.M.B. Precipitation and air temperature extremes in the Amazon and northeast Brazil. Int. J. Climatol. 2019, 39, 579–595. [Google Scholar] [CrossRef]
  39. Souza, D.O.; Nascimento, M.G.; Alvala, R.C.S. Influência do crescimento urbano sobre o microclima de Manaus e Belém: Um estudo observacional. Rev. Brasil. Geogr. Fis. 2015, 8, 1109–1124. [Google Scholar] [CrossRef] [Green Version]
  40. Marengo, J.A. Inter-decadal variability and trends in rainfall in the Amazon basin. Theor. Appl. Climatol. 2004, 78, 79–96. [Google Scholar] [CrossRef]
  41. Satyamurty, P.; Castro, A.A.; Tota, J.; Gularte, J.J.S.; Manzi, A.O. Rainfall trends in the Brazilian Amazon in the past eight decades. Theor. Appl. Climatol. 2010, 99, 139–148. [Google Scholar] [CrossRef]
  42. Espinoza, J.C.; Ronchail, J.; Marengo, J.A.; Segura, H. Contrasting North–South changes in Amazon wet-day and dry-day frequency and related atmospheric features (1981–2017). Clim. Dyn. 2019, 52, 5413–5430. [Google Scholar] [CrossRef]
  43. Lira, B.R.P.; Lopes, L.N.A.; Chaves, J.R.; Santana, L.R.; Fernandes, L.L. Identificação de Homogeneidade, Tendência e Magnitude da Precipitação em Belém (Pará) entre 1968 e 2018. Anuário Inst. Geociências 2020, 43, 426–439. [Google Scholar] [CrossRef]
  44. De Souza, E.B.; Ferreira, D.B.S.; Guimarães, J.T.F.; Franco, V.S.; Azevedo, F.T.M.; Moraes, B.C.; Souza, P.J.O.P. Padrões climatológicos e tendências da precipitação nos regimes chuvoso e seco da Amazônia oriental. Rev. Brasil. Clim. 2017, 21, 81–93. [Google Scholar] [CrossRef]
  45. UNFCCC—United Nations Framework Convention on Climate Change. Glasgow Climate Pact. Available online: https://unfccc.int/documents/310475 (accessed on 21 January 2022).
  46. Campos, T.T.L.O.B.; Mota, M.A.S.; Santos, S.R.Q. Eventos extremos de precipitação em Belém-PA: Uma revisão de notícias históricas de jornais. Rev. Amb. Água 2015, 10, 182–194. [Google Scholar] [CrossRef] [Green Version]
  47. Oliveira, J.V.; Cohen, J.C.P.; Pimentel, M.; Tourinho, H.L.Z.; Lôbo, M.A.; Sodré, G.; Abdala, A. Urban climate and environmental perception about climate change in Belém, Pará, Brazil. Urban Clim. 2020, 31, 100579. [Google Scholar] [CrossRef]
Figure 1. Study area in the MRB with the 2020 landcover map, locations of the seven municipalities and meteorological station, and the main highway crossing the region.
Atmosphere 13 01077 g001
Figure 2. (a) HadGEM2-ES global model (topography); (b) RegCM4 domain over MRB with the landcover updated to represent the metropolitan region of the study area.
Atmosphere 13 01077 g002
Figure 3. (a) Boxplot of PREC (mm/day) and TEMP (°C, only the climatological mean) for Belém station (period 1985–2020); (b) monthly percentages (relative to the annual total) of PREC, emphasizing the seasonal regimes.
Atmosphere 13 01077 g003
Figure 4. CRU, CHIRPS, and CMORPH observed PREC (mm/day) for (a) RAINY; (b) DRY regime.
Atmosphere 13 01077 g004
Figure 5. RegCM4 simulated PREC (mm/day) using EMA, TIE, and KFR schemes for (a) RAINY; (b) DRY regime.
Atmosphere 13 01077 g005
Figure 6. CRU observed and RegCM4 simulated TEMP (°C) using EMA, TIE, and KFR schemes for (a) RAINY; (b) DRY regime.
Atmosphere 13 01077 g006
Figure 7. Taylor diagram of observed (CRU, CHIRPS, and CMORPH, circles in red) and simulated (EMA, TIE, and KFR, circles in magenta) PREC for the (a) RAINY and (b) DRY regimes.
Atmosphere 13 01077 g007
Figure 8. (a) Landcover maps over MRB; (b) percentages by classes; (c) forest; (d) pasture/agriculture; and (e) urbanization. Results for (a,b) are shown in the years 1985, 1995, 2005, 2015, and 2020. The annual series for (ce) are in area (ha) from 1985 to 2020.
Atmosphere 13 01077 g008
Figure 9. The 1985 to 2020 percentage changes for Belém (green) and MRB (brown) in the (a) landcover classes; (b) population growth.
Atmosphere 13 01077 g009
Figure 10. Scatterplots of (a) PAG and URB with TEMP for MRB; (b) URB with TEMP for Belém. Time series in the period 1985–2020.
Atmosphere 13 01077 g010
Figure 11. Change patterns of future (2021/2045) relative to present (1985/2020) for TEMP (left panel) and PREC (right panel) in the RAINY and DRY regimes. The color bar indicates TEMP in °C and PREC in %.
Atmosphere 13 01077 g011
Figure 12. Boxplots of present (1985/2020) and future (2021/2045) climate considering the RAINY and DRY regime for (a) PREC; (b) TEMP. Changes in the future relative to the present for (c) PREC (%); (d) TEMP (°C).
Atmosphere 13 01077 g012
Table 1. Pearson’s correlations between the landcover class areas and the TEMP and PREC in the RAINY and DRY regimes. Time series in the period 1985–2020.
FORPAGURB
RAINYDRYRAINYDRYRAINYDRY
TEMP Belém−0.68 1−0.86 10.420.550.72 10.88 1
TEMP MRB−0.67 1−0.79 10.64 10.75 10.68 10.86 1
PREC Belém−0.46 2−0.220.42 20.340.370.11
PREC MRB−0.33−0.010.310.020.42 2−0.03
1 p-value < 0.05 for TEMP. 2 p-value < 0.10 for PREC.
Table 2. Mann–Kendall test with the values of τ, p-value, and Sen’s slope for the series (1985–2020) of TEMP and PREC in Belém and MRB in the RAINY and DRY regimes.
Kendall τp-ValueSen’s Slope
RAINYDRYRAINYDRYRAINYDRY
TEMP Belém0.527 10.663 1<0.0001<0.00010.0310.045
TEMP MRB0.480 10.701 1<0.0001<0.00010.0460.073
PREC Belém0.371 10.1140.0020.3340.1100.018
PREC MRB0.316 1−0.0190.0090.8810.098−0.003
1 statistically significant value.
Publisher’s Note: MDPI stays neutral with regard to jurisdictional claims in published maps and institutional affiliations.

