Article

Multitask Learning Based on Improved Uncertainty Weighted Loss for Multi-Parameter Meteorological Data Prediction

1
School of Electronics and Information Engineering, Harbin Institute of Technology, Harbin 150001, China
2
School of Astronautics, Harbin Institute of Technology, Harbin 150001, China
*
Author to whom correspondence should be addressed.
Atmosphere 2022, 13(6), 989; https://doi.org/10.3390/atmos13060989
Submission received: 1 May 2022 / Revised: 2 June 2022 / Accepted: 16 June 2022 / Published: 20 June 2022

Abstract

:
With the exponential growth in the amount of available data, traditional meteorological data processing algorithms have become overwhelmed. The application of artificial intelligence in simultaneous prediction of multi-parameter meteorological data has attracted much attention. However, existing single-task network models are generally limited by the data correlation dependence problem. In this paper, we use a priori knowledge for network design and propose a multitask model based on an asymmetric sharing mechanism, which effectively solves the correlation dependence problem in multi-parameter meteorological data prediction and achieves simultaneous prediction of multiple meteorological parameters with complex correlations for the first time. The performance of the multitask model depends largely on the relative weights among the task losses, and manually adjusting these weights is a difficult and expensive process, which makes it difficult for multitask learning to achieve the expected results in practice. In this paper, we propose an improved multitask loss processing method based on the assumptions of homoscedasticity uncertainty and the Laplace loss distribution and validate it using the German Jena dataset. The results show that the method can automatically balance the losses of each subtask and has better performance and robustness.

1. Introduction

Changes in meteorological factors (such as wind speed, temperature, humidity, precipitation, etc.) have a profound impact on human life. Accurate prediction of future meteorological elements can be widely used in people’s daily life, transportation, agriculture, forestry and animal husbandry, disaster-causing weather avoidance, and other fields. At the same time, accurate prediction of meteorological elements can provide forward-looking guidance for extreme weather warnings, military analysis, and future investment, thus helping various departments to make advance coordination arrangements according to weather changes [1].
In the early stage, scholars used statistical algorithms and model prediction methods to predict meteorological elements [2,3], i.e., using weather science, dynamics, and other meteorological theories to investigate the changing patterns of the corresponding elements under the initial and boundary conditions. Since the construction of such models generally requires the application of a large number of assumptions, there are many limitations and discrepancies with the actual situation. Therefore, some scholars have introduced statistical-based algorithms [4,5]. Such algorithms infer the probability of occurrence of a phenomenon in a future period by counting the frequency of a phenomenon in a specific situation in a past period. However, such algorithms are subject to some errors brought about by statistics itself, making the accuracy of the prediction suffer to some extent. In the last decade, with the continuous upgrading of relevant meteorological observation facilities, the amount of data and the types of meteorological parameters obtained from observations have increased geometrically [6]. The huge amount of data and the wide variety of data types have led to the fact that traditional algorithms such as statistical algorithms and model prediction methods can no longer meet the demand for real-time prediction of multi-parameter meteorological data. In contrast, with the great breakthroughs in information technology and intelligent algorithm techniques, artificial intelligence (AI) technologies have produced quite mature results in the fields of machine learning, image recognition, and big data analysis. Therefore, researchers are also actively exploring new ideas for applying AI techniques to the field of multi-parameter meteorological data prediction [7,8,9,10,11].
Single-task learning methods have been widely used in previous research on multi-parameter meteorological data prediction [12,13]. The idea of using single-task learning for meteorological data prediction is to decompose a complex meteorological problem into simple and mutually independent subproblems solved individually and then combining the results to obtain the results of the initial complex problem. This may seem reasonable, but it is inappropriate. On the one hand, the subproblems of the meteorological prediction problem are often interrelated and linked by some common factors or common representations [14]. If the multi-parameter meteorological data prediction problem is treated as multiple independent single tasks, the rich information such as associations, conflicts, and constraints between parameters will be ignored. On the other hand, in previous studies using single-task learning methods for prediction multi-parameter meteorological data, artificially selected meteorological parameters with strong correlations are usually used for forecasting to guarantee the prediction results. This operation discards the correlation information between the selected parameters and other parameters, which weakens the generalization performance of the model. When the prediction task contains multiple weakly correlated meteorological parameters, the single-task learning approach is no longer applicable. We refer to this phenomenon as the correlation dependence problem of the prediction parameters.
Multitask learning is an important class of machine learning paradigms that aims to improve the generalization of the main task with other related tasks. In simple terms, multitask learning is an integrated learning approach that allows multiple tasks to influence each other by training several tasks simultaneously. Usually, this influence is achieved by sharing parameters, i.e., multiple tasks share a feature-sharing layer, and the parameters in this feature-sharing layer are influenced by all tasks at optimization time [15]. By designing different feature-sharing layers for subtasks, the parameter-sharing process between different features can be artificially intervened, which is called the asymmetric sharing mechanism of multitask learning. Compared to single-task learning, multitask learning has the advantages of reduced computational resource usage, faster inference, and improved overall performance and generalization capabilities. At the same time, the asymmetric sharing mechanism endows multitask learning with higher flexibility. Therefore, we believe that the neural network design based on prior knowledge and the asymmetric sharing mechanism is expected to solve the correlation dependence problem of prediction parameters in single-task learning and provide a new solution for the prediction of complex correlation meteorological data.
Currently, only a few studies in the field of meteorological data prediction have used multitask learning methods. Lucas Borges Ferreira et al. [16] evaluated different approaches based on temperature and relative humidity and temperature estimation of ETo using multitask models and single-task models. Yang Han et al. [17] proposed a multitask machine learning model to re-estimate official air quality data during the recent BSD using PM data reported by the U.S. Embassy in Beijing and proxy data covering aerosol optical depth (AOD) and meteorology. Qiang Zhang et al. [18] combined deep learning with multitask learning to propose a hybrid model for air quality prediction and proved experimentally that the model has good temporal stability and generalization ability. The introduction of multitask learning methods in the field of meteorological data prediction is novel and efficient, but due to the nature of meteorological data and multitask learning, there are still problems such as over-sensitivity to outliers, failure of simultaneous convergence of the tasks, and degradation of multitask learning to single-task learning. This is due to the following reasons: Simultaneous prediction tasks for multi-parameter meteorological data involve the joint learning of multiple regression tasks with different numerical scales, which creates an interesting multitask learning problem. Previously, multitask learning methods used simple loss-weighted summation, where the loss weights for each task were uniform or manually adjusted. Recently, it has been found that the performance of multitask models is highly dependent on the selection of appropriate weights for the losses of each task. The optimal weight for each task depends on the numerical scale and, ultimately, on the magnitude of the task noise [19]. In this case, manually adjusting these weights is a difficult and expensive process, which makes it difficult for multitask learning to achieve the desired results in practice.
To address this problem, Sener et al. [20] transformed a multitask model into a multi-objective optimization problem to find a Pareto optimal solution. Kendall et al. [19] achieved better results on a multitask model for joint semantic segmentation, instance segmentation, and depth regression of monocular input images in the field of computer vision based on the uncertainty of Bayesian deep learning [21]. Compared with the field of computer vision, meteorological data have special characteristics. Specifically, there are many outliers in meteorological data, which are related to the prediction of extreme meteorological phenomena and cannot be eliminated artificially. Such data characteristics dictate the need to design a multitask learning loss function that can facilitate simultaneous convergence of the subtasks without being too sensitive to outliers in the data. It is well known that MAE losses exhibit better robustness than MSE losses due to different loss distribution assumptions based on them. Therefore, replacing the Gaussian loss distribution assumption with the more robust Laplace loss distribution assumption, interpreting the homoscedastic uncertainty as the basis for task-related weight assignment, and using it as noise for weight optimization in multitask learning are expected to improve the multitask loss treatment method based on uncertainty measures. We have reason to believe that the novel multitask loss function derived based on this approach can both learn how to best balance various regression losses and have better robustness.
In this study, we aim to propose a multitask model for simultaneous prediction of multiple meteorological parameters with complex correlations. The objectives of this study include: (1) proposing an improved regression loss function that can learn multi-scale data simultaneously based on the assumptions of the Laplace loss distribution and homoscedasticity uncertainty; (2) designing a network structure based on multitask learning and an asymmetric sharing mechanism for simultaneous prediction of multi-parameter meteorological data and verifying whether the multitask model based on the asymmetric sharing mechanism can effectively solve the problem of the correlation dependence of meteorological parameters in single-task learning; (3) taking the simultaneous prediction task of multi-parameter meteorological data as an example to explore the method of applying the asymmetric sharing mechanism of multitask learning in meteorological data prediction and verifying the importance of loss weighting in multitask deep learning through experiments.

2. Data and Model

2.1. Data Description and Data Preprocessing

In this paper, the German Jena dataset was used for relevant research, which is commonly used in the field of meteorology and is recorded by the weather station of the Max Planck Institute for Biogeochemistry in Jena, Germany. Since 2003, this weather station has collected meteorological data every 10 min and records a summary containing 14 different characteristics such as relative humidity, atmospheric pressure, daily precipitation, water vapor concentration, air density, wind speed, wind direction, global radiation, photosynthetically active radiation, Earth’s net radiation, carbon dioxide concentration, surface temperature, and soil temperature. This paper used data collected from this weather station between 2009 and 2016, and the dataset was obtained from the following URL on 15 October 2021: https://s3.amazonaws.com/keras-datasets/jena_climate_20-09_2016.csv.zip.

2.1.1. Data Standardization

In deep learning, data normalization facilitates initialization, avoids numerical problems for gradient update, facilitates adjustment of learning rate, optimizes the search trajectory, and improves optimal solution search speed. Standardization methods include min–max standardization, z-score standardization, atan inverse tangent function standardization, and log function standardization, among which min–max standardization and z-score standardization are the two most common methods in structured data processing. The standardized expression of min–max and the z-score is shown in Equations (1) and (2).
x * = x min max min
x * = x μ σ
Usually, if the sample is less noisy and not heavily contaminated, it is preferable to use min–max normalization, with strictly the same dimensional proportions and comparable impact of distance calculation. If the mean information is meaningful, z-score normalization is recommended, which has different, but very similar dimensions and can retain more information from the original data. The distribution of meteorological data is highly regular, and some features have strong physical correlations. The mean value of each feature is important for prediction work. Therefore, it is reasonable to use the z-score normalization method for the dataset.

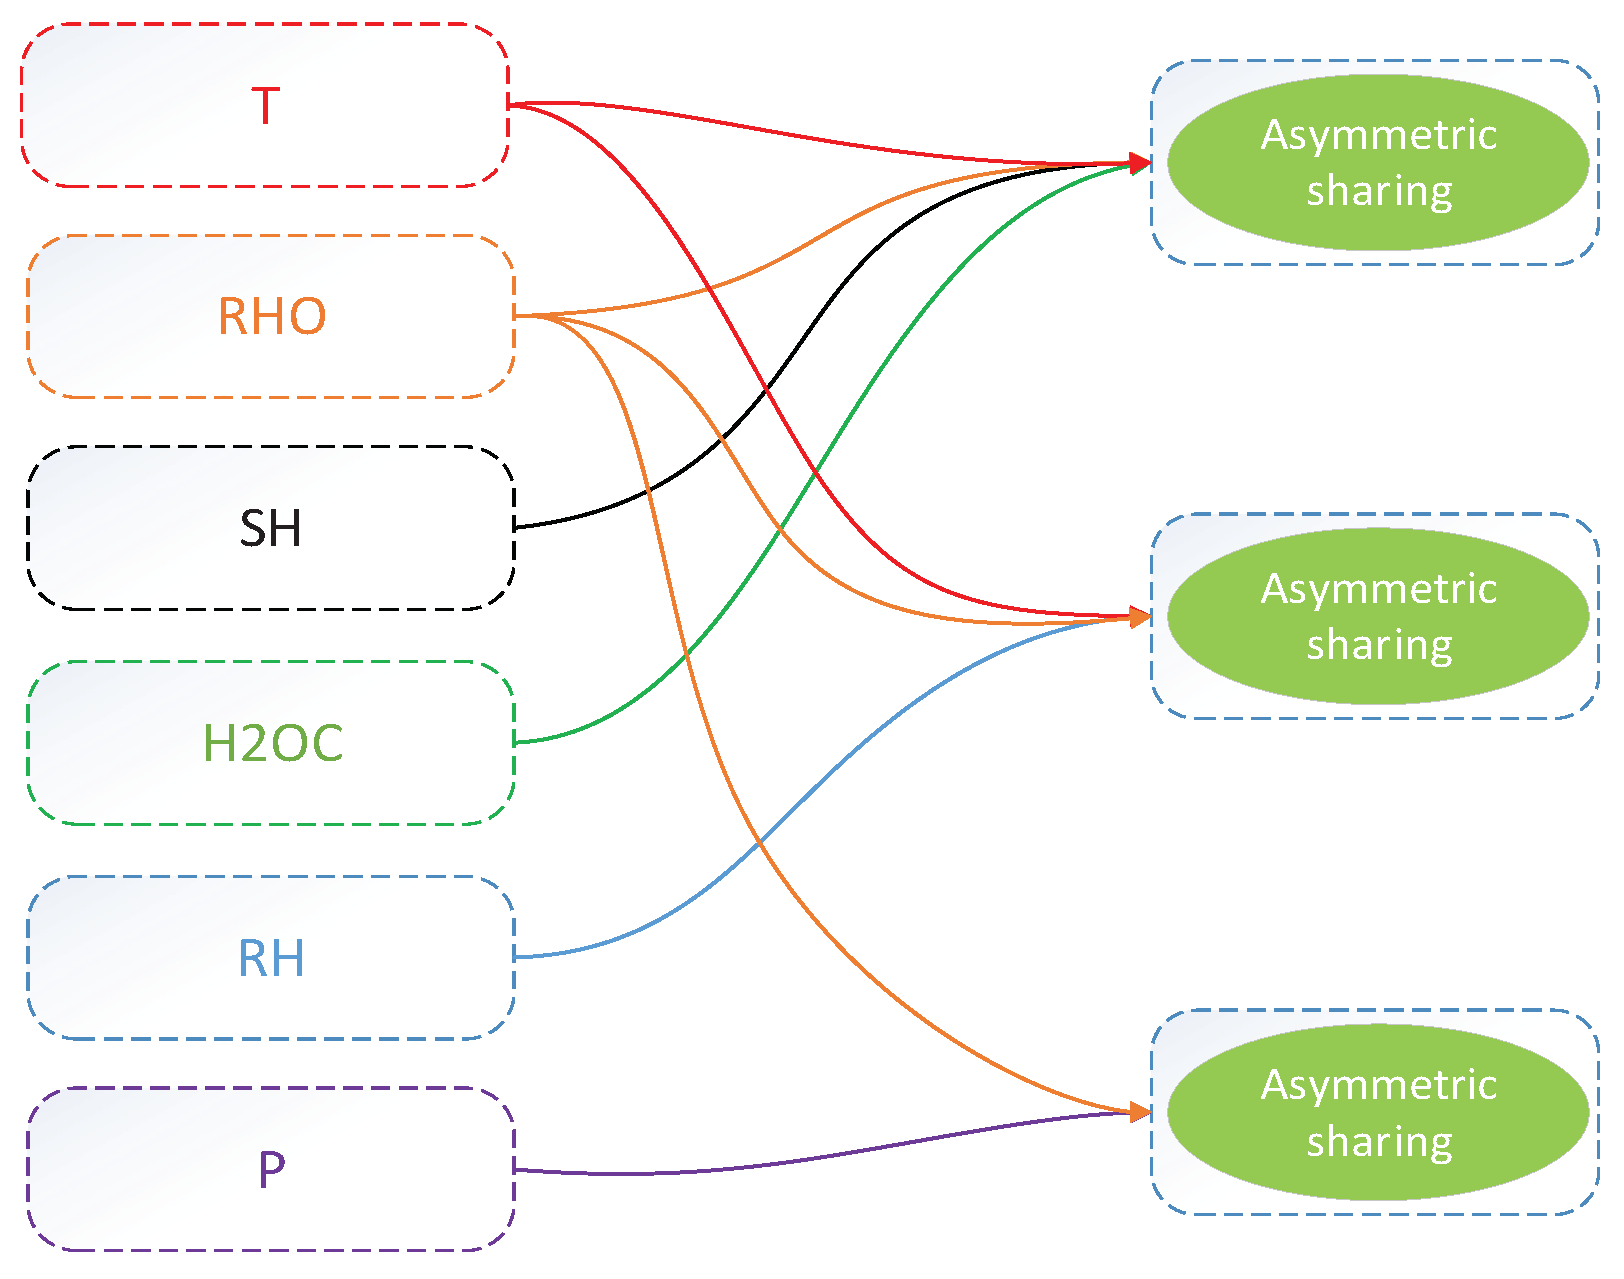
2.1.2. Correlation Analysis

Correlation analysis is the process of quantifying the correlation between variables [22], which describes quantitatively the strength of the correlation between two or more variables by calculating the correlation coefficients between the variables. In this paper, we used Pearson product-moment correlation coefficients to characterize the strength of correlation between meteorological parameters. An absolute value of the correlation coefficient close to 1 means that two or more variables have a strong relationship with each other, while an absolute value of the correlation coefficient close to 0 means that the variables have almost no correlation.
By calculating the covariance and standard deviation of the samples, the Pearson product-moment correlation coefficient r of the two variables samples X and Y can be obtained as shown in Equation (3).
r = i = 1 n X i X ¯ Y i Y ¯ i = 1 n X i X ¯ 2 i = 1 n Y i Y ¯ 2
Taking the Jena dataset as an example, the correlation coefficients between the meteorological parameters contained in the Jena dataset were calculated and the results are shown in Table 1.
From the data in Table 1, it can be seen that wind speed and barometric pressure show obvious weak correlations with most of the parameters, and other parameters have more obvious strong correlations with each other. In the next experiments, water vapor content, specific humidity, wind speed, and air pressure were selected as a set of experimental parameters to demonstrate the advantages of multitask learning models in predicting multiple complex correlated meteorological parameters. Among them, water vapor content and specific humidity share a feature-sharing layer due to the obvious strong correlation. To prevent the learning from falling into local optima, two new feature-sharing layers were designed based on the strength of correlation for wind speed and air pressure to specify water vapor content and specific humidity as intermediate variables, respectively, when dealing with the prediction problem of wind speed and air pressure. To demonstrate the importance of loss weighting in multitask learning and to prove that the Laplace loss function has better performance and robustness, temperature (T), atmospheric density (RHO), specific humidity (SH), water vapor content (H2OC), relative humidity (RH), and atmospheric pressure (P) were selected as another set of experimental parameters in this paper. When using this set of experimental parameters, three feature-sharing layers need to be constructed for each model based on the results of the correlation analysis, and the feature-sharing layer structures are shown in Figure 1.

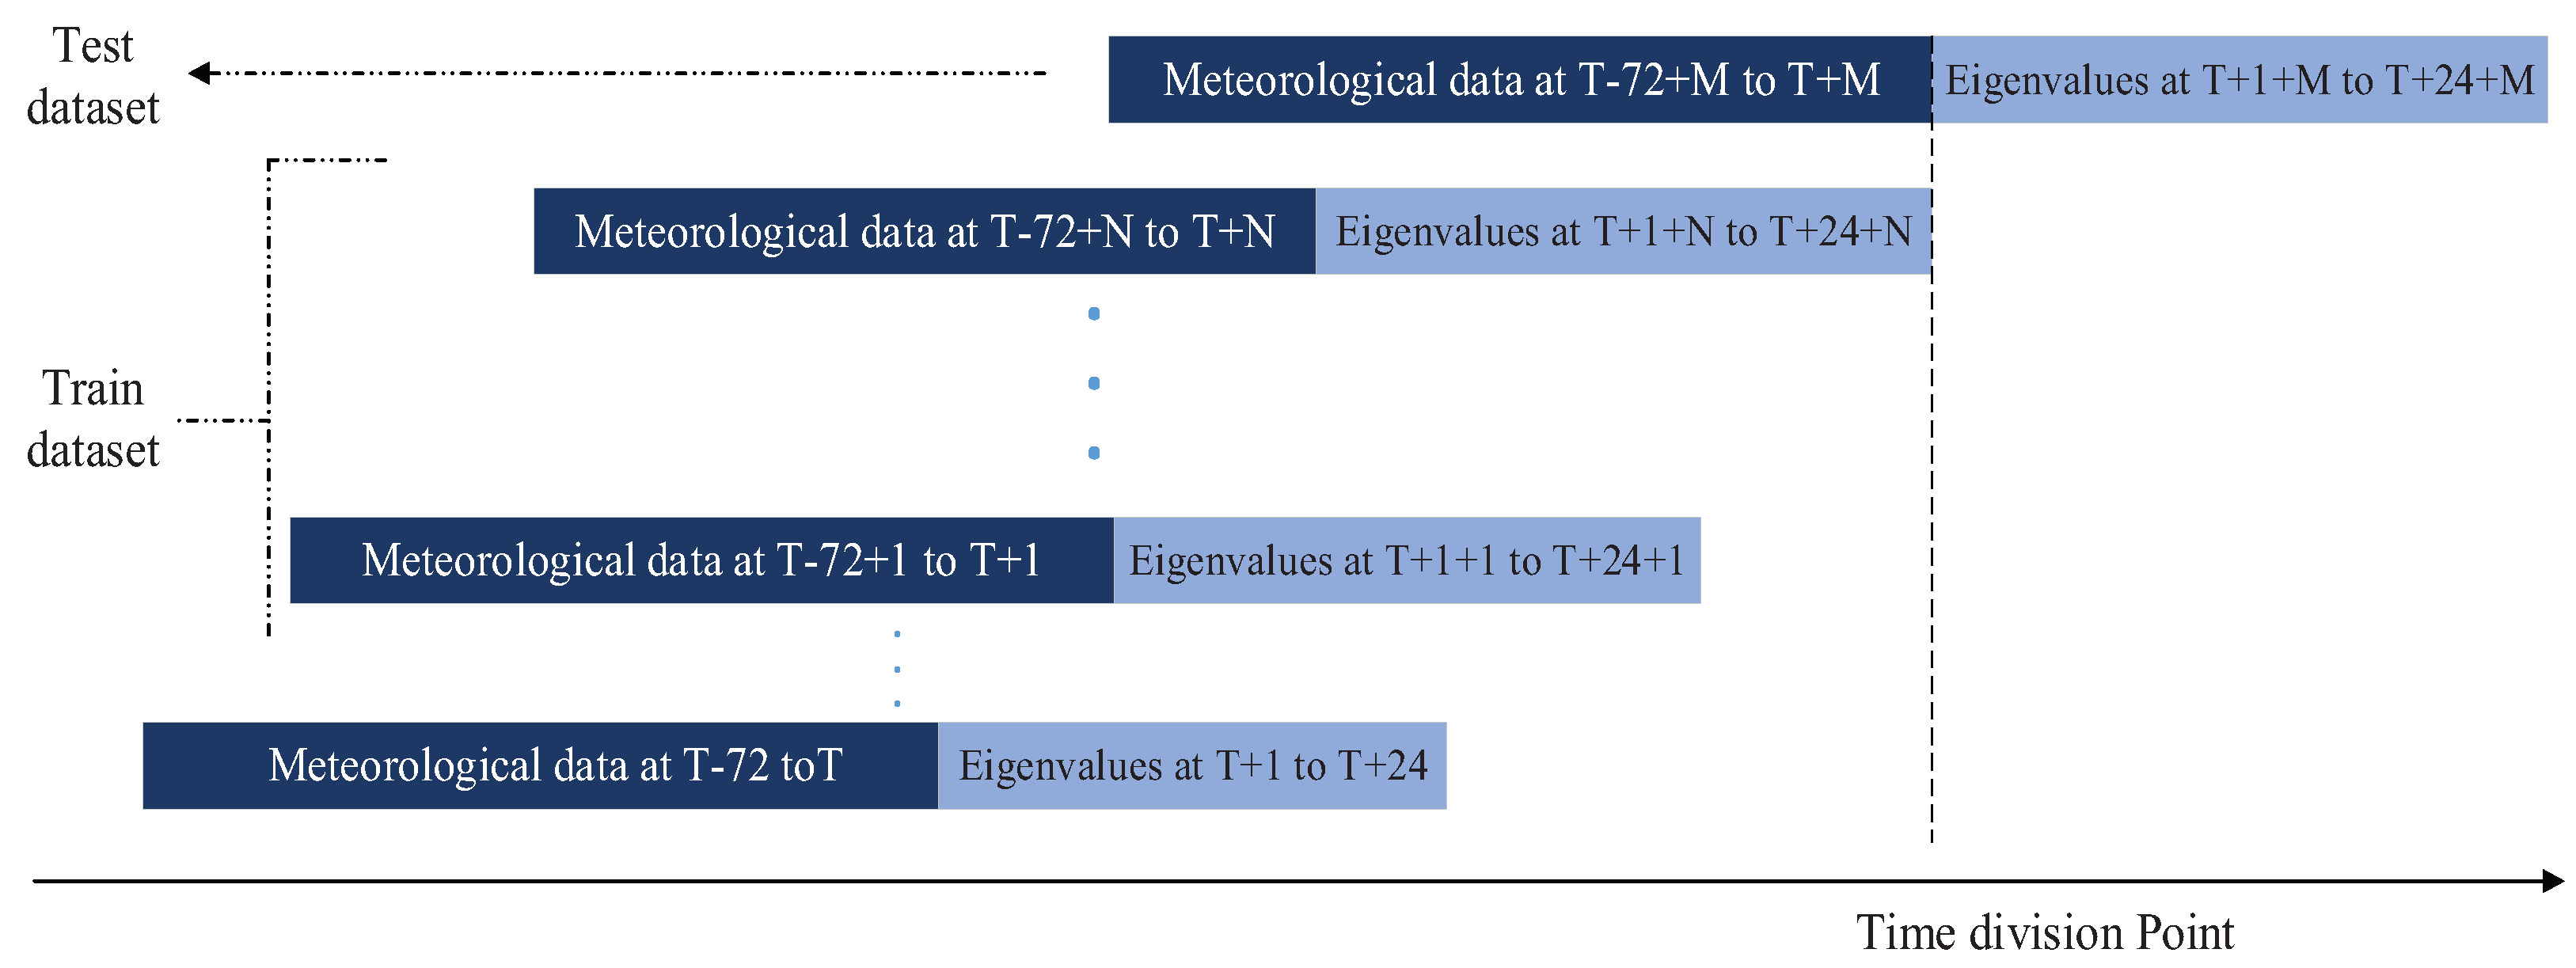
2.1.3. Time Sliding Window Processing

Time sliding window processing is the main means of transforming time series data into a supervised learning problem, and the mechanism of action is to process the data for each period in chronological order to obtain the features contained in the target for each period, then to obtain the trend of the data from successive time segments by analyzing the same features in different time dimensions [23]. To convert the time series problem into a supervised learning problem, a time sliding window is required for the original Jena dataset. First, the designed time window is used to intercept the historical meteorological data, and the processing process is shown in Figure 2. In this paper, time windows of sizes 72 and 24 were taken to process the dataset, respectively, and finally, multiple sets of multidimensional feature data with 72 samples as a group and multidimensional target data with 24 samples as a group were generated. Then, the transformed data were manually divided into training and testing sets using a ratio of 8:2, and 25% of the total data in the training set were used as the validation set.

2.2. Multitask Loss Processing Method Based on Homoscedasticity Uncertainty Weighting

Multitasking can improve model representation and task performance compared to single-tasking. However, multitask learning often faces an important challenge: How do we define a uniform loss function for multitask learning? In general, the gradient size during the convergence of different subtasks is different, and the sensitivity to different learning rates is also different. Most articles, reviews, or journals on multitask learning focus on iterations and innovations in network structure, hoping to capture the correlation between different tasks. However, this paper argues that optimization and design for multitask learning loss are also very important. Most of the previous applications of multitask learning use a simple linear weighted summation approach to integrate the losses of different tasks, as in Equation (4).
L total = i ω i L i
This approach has some shortcomings, such as some subtasks performing better when the model converges, while others do not perform as well. The reason behind this is that although this approach allows us to manually adjust the importance of each task, the fixed weights stay with the training cycle, and since different tasks are learned at different levels of difficulty and different tasks may be at different learning stages at the same time, such fixed weights may limit the learning of a task at a certain stage. Therefore, a better weighting approach should be dynamic. In this paper, we want to find a more convenient method to automatically learn the optimal weights.
Uncertainty includes perceptual uncertainty, which is caused by incomplete training and can be addressed by using more training data to compensate for the lack of existing model knowledge, and chance uncertainty, which describes the randomness originating from the data generation process itself [24,25] and is essentially noise that cannot be eliminated simply by collecting more data. Homoscedasticity uncertainty is a type of chance uncertainty that does not depend on either the input data or the output results of the model. It is an identical constant for all input data, and it is a different variable for different tasks. In multitask learning, the corresponding uncertainty between tasks reflects the inherent uncertainty between regression or classification tasks, influenced by aspects such as the magnitude between tasks and the form of the representation. Therefore, homoscedasticity uncertainty can be used as the basis for a polynomial loss function based on a weighted formula.
To balance the losses of each meteorological data prediction task, this paper introduces homoscedasticity uncertainty in the field of multi-parameter meteorological data prediction and transforms the loss function of simple weighted summation into an uncertainty loss function. In this section, we assume that the losses of meteorological data prediction tasks conform to the Laplace distribution and derive a multitask loss function based on homoscedastic uncertainty and Laplace likelihood maximization, which treats homoscedastic uncertainty as noise to optimize the weights in multitask learning. Let the output of a neural network be with input x and weight value W. For the regression task, the probability model can be defined as a Laplace distribution function whose mean value is given by the model output:
p y | f w x = L a f w x , λ
Under the observed noise scalar, to match the classification task, the model output is processed using the softmax function and sampled from the generated probability vector:
p y | f w x = S o f t max f w x
In the presence of multiple outputs y 1 , , y k and assuming independent identical distribution among tasks, define f w x as a sufficient statistic. The multitask likelihood is estimated as:
p y 1 , , y k | f w x = p y 1 | f w x p y k | f w x
Maximize the log-likelihood of the model in maximum likelihood inference for the regression task with the following log-likelihood estimates:
log p y | f w x 1 λ | | y f w x | | log λ
For a Laplace likelihood function, this paper defines the noise observation parameter of the model, which is used to capture the amount of noise in the model output.
Based on the above theoretical derivation, for the two regression tasks, the loss function can be defined:
log p y 1 , y 2 | f w x 1 λ 1 | | y 1 f 1 w x | | + 1 λ 2 | | y 2 f 2 w x | | + log λ 1 λ 2
In the above equation, λ 1 and λ 2 can be regarded as the weight relationship factors of the loss functions of the two regression tasks, respectively, and log λ 1 λ 2 can be regarded as the regular term of the weight relationship factors λ 1 and λ 2 . Let L 1 w = | | y 1 f 1 w x | | , L 2 w = | | y 2 f 2 w x | | ; the process of minimizing the relationship between losses and λ 1 and λ 2 can be interpreted as adaptively learning the relative weights of the losses L 1 w and L 2 w based on the data. When λ 1 (the noise parameter of variable y 1 ) increases, the weight of L 1 w decreases. Conversely, the weight of the corresponding target increases when the noise decreases. The last term as a regularized noise term can effectively ignore the data and, thus, suppress excessive noise increase.

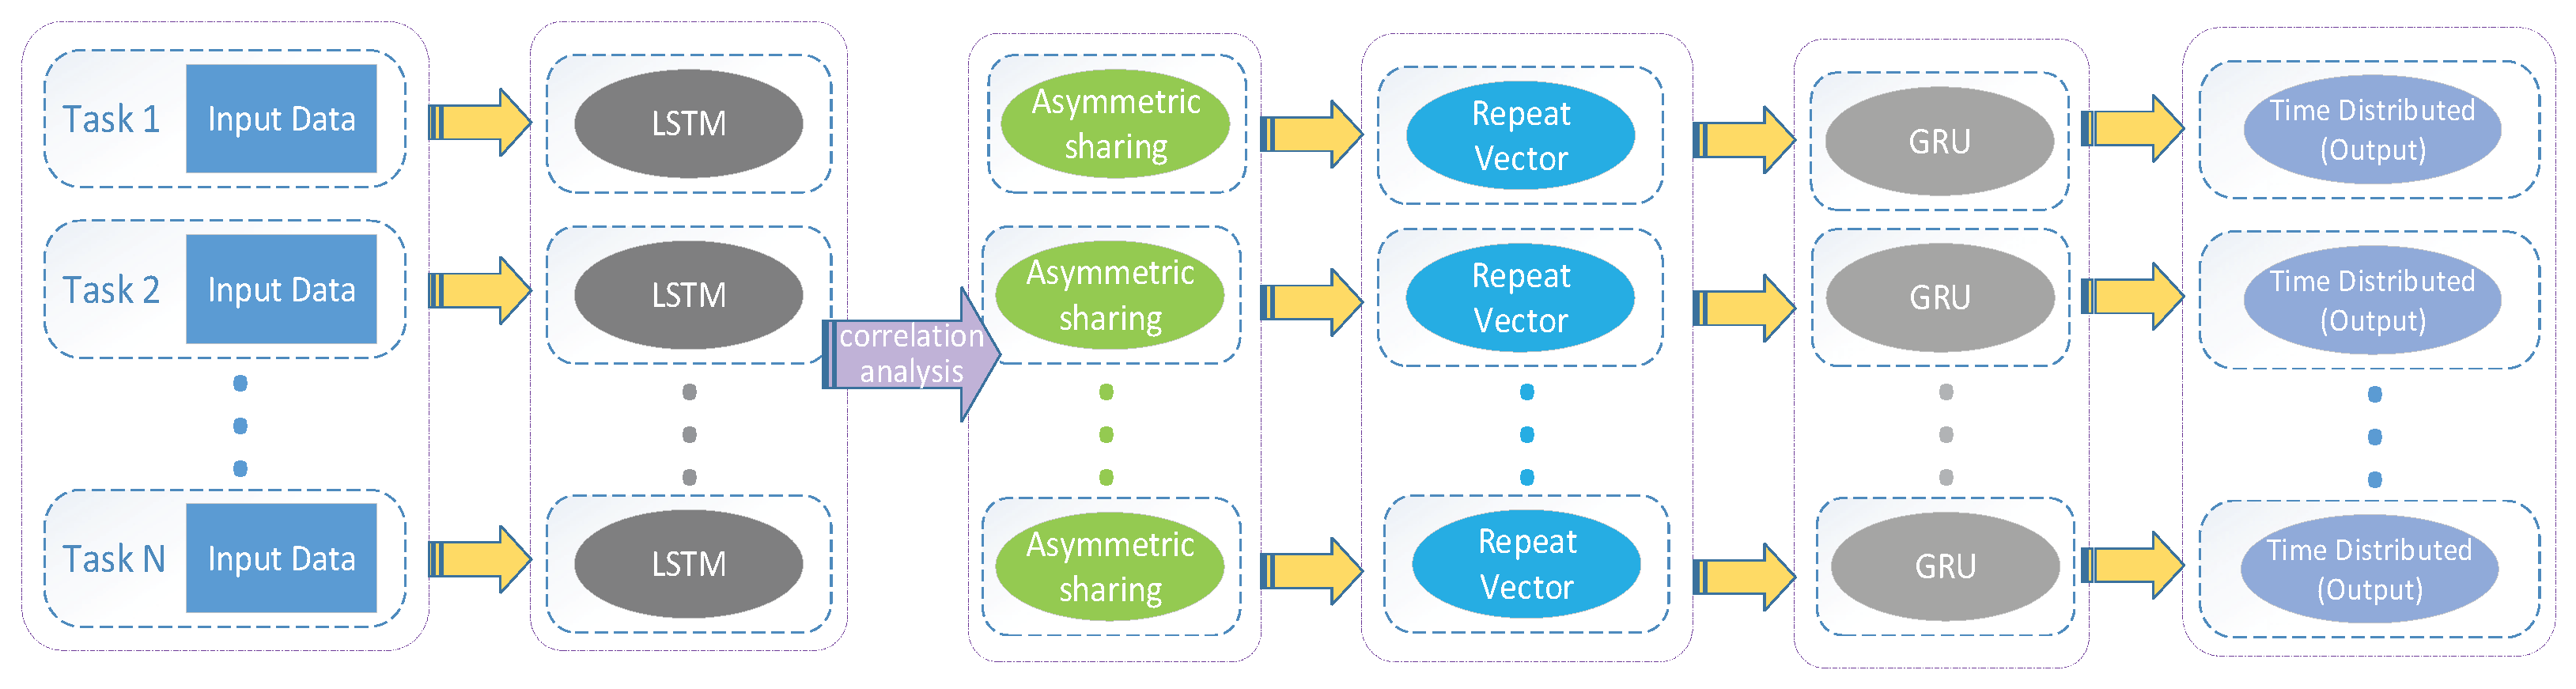
2.3. Multi-Parameter Meteorological Data Synchronization Prediction Model

In this paper, a multitask architecture that allows simultaneous learning of multiple meteorological parameters is proposed, which allows designers to design the network structure based on the correlation between variables using the asymmetric sharing mechanism of multitask learning and solves the problem of single-task model design, which relies heavily on the correlation of variables. From the pre-experiments, it is shown that the LSTM-GRU stacked network as the underlying structure has better performance and smaller computational overhead in dealing with the weather data prediction problem. Therefore, in this paper, multiple LSTM-GRU stacking structures were used as the underlying structure, which generates multiple asymmetric shared representations at the merge layer based on parameter correlation and then connects the corresponding number of several subtasks at the time-distributed and fully connected layers. A summary of the model structure is given in Figure 3.

2.3.1. RNN Layer

Recurrent neural networks are mnemonic and parameter sharing and have Turing completeness and, therefore, have an advantage in learning nonlinear features of sequences. LSTM and GRU are two variants of the common RNN that can effectively solve the gradient disappearance problem. LSTM adds three gates: input gate, forget gate, and output gate. The input gate handles the input of the current sequence position and consists of two parts, the results of which are multiplied to update the cell state; the forget gate controls whether to forget the hidden cell state of the previous layer with a certain probability; the output gate is updated by the calculation results of the previous forget gate and the input gate; the GRU structure is similar to the LSTM, but simpler than the LSTM, containing only two gates: the reset gate and the update gate. The reset gate controls the information of the previous moment with a certain probability, which is helpful to obtain the short-term dependency in the temporal data; the reset gate decides whether to discard the past implicit states that are not related to the latter, i.e., the reset gate controls the forgetting proportion of the historical information; the update gate substitutes the state information of the previous moment into the current state to update all the candidate implicit states, which is helpful to obtain the long-term dependency in the temporal data. Compared with GRU, the LSTM model is more parameterized, more powerful, and more expressive, but it is slower to train because of its complex structure.

2.3.2. Laplace Multiple Loss Processing Layer

In the multitask learning process, the gradient size of different subtasks converges differently and the sensitivity of different subtasks to different learning rates varies, which leads to the failure of the multitask model to achieve the desired results. In this paper, we used homoscedasticity uncertainty as the theoretical basis for deriving the weighted polynomial loss function, assumed that the loss of each subtask obeys the Laplace distribution, and derived a class of regression loss functions that can learn multi-scale data simultaneously, which is named the Laplace loss function. In this loss function, define the observed noise value and let the process of minimizing the relationship between losses be interpreted as adaptively learning the relative weights of losses based on the data. Based on the above work, a Laplace loss processing layer is constructed in this paper. This processing layer updates the weight parameter of each subtask synchronously with training during the multitask model learning process, adjusts the relative weight of each task in the loss, and thus, promotes the simultaneous convergence of each subtask, optimizes the multitask learning process, and obtains the multitask learning goal. The parameter update during gradient descent is shown in Equation (10).
λ j = λ j α λ j J θ , λ θ j = θ j α θ j J θ , λ
In the above equation, θ represents the weight parameter associated with each subtask, λ represents the weight coefficient of the loss of each subtask, and the total loss J θ , λ is jointly influenced by θ and λ and is adjusted simultaneously by gradient backpropagation.

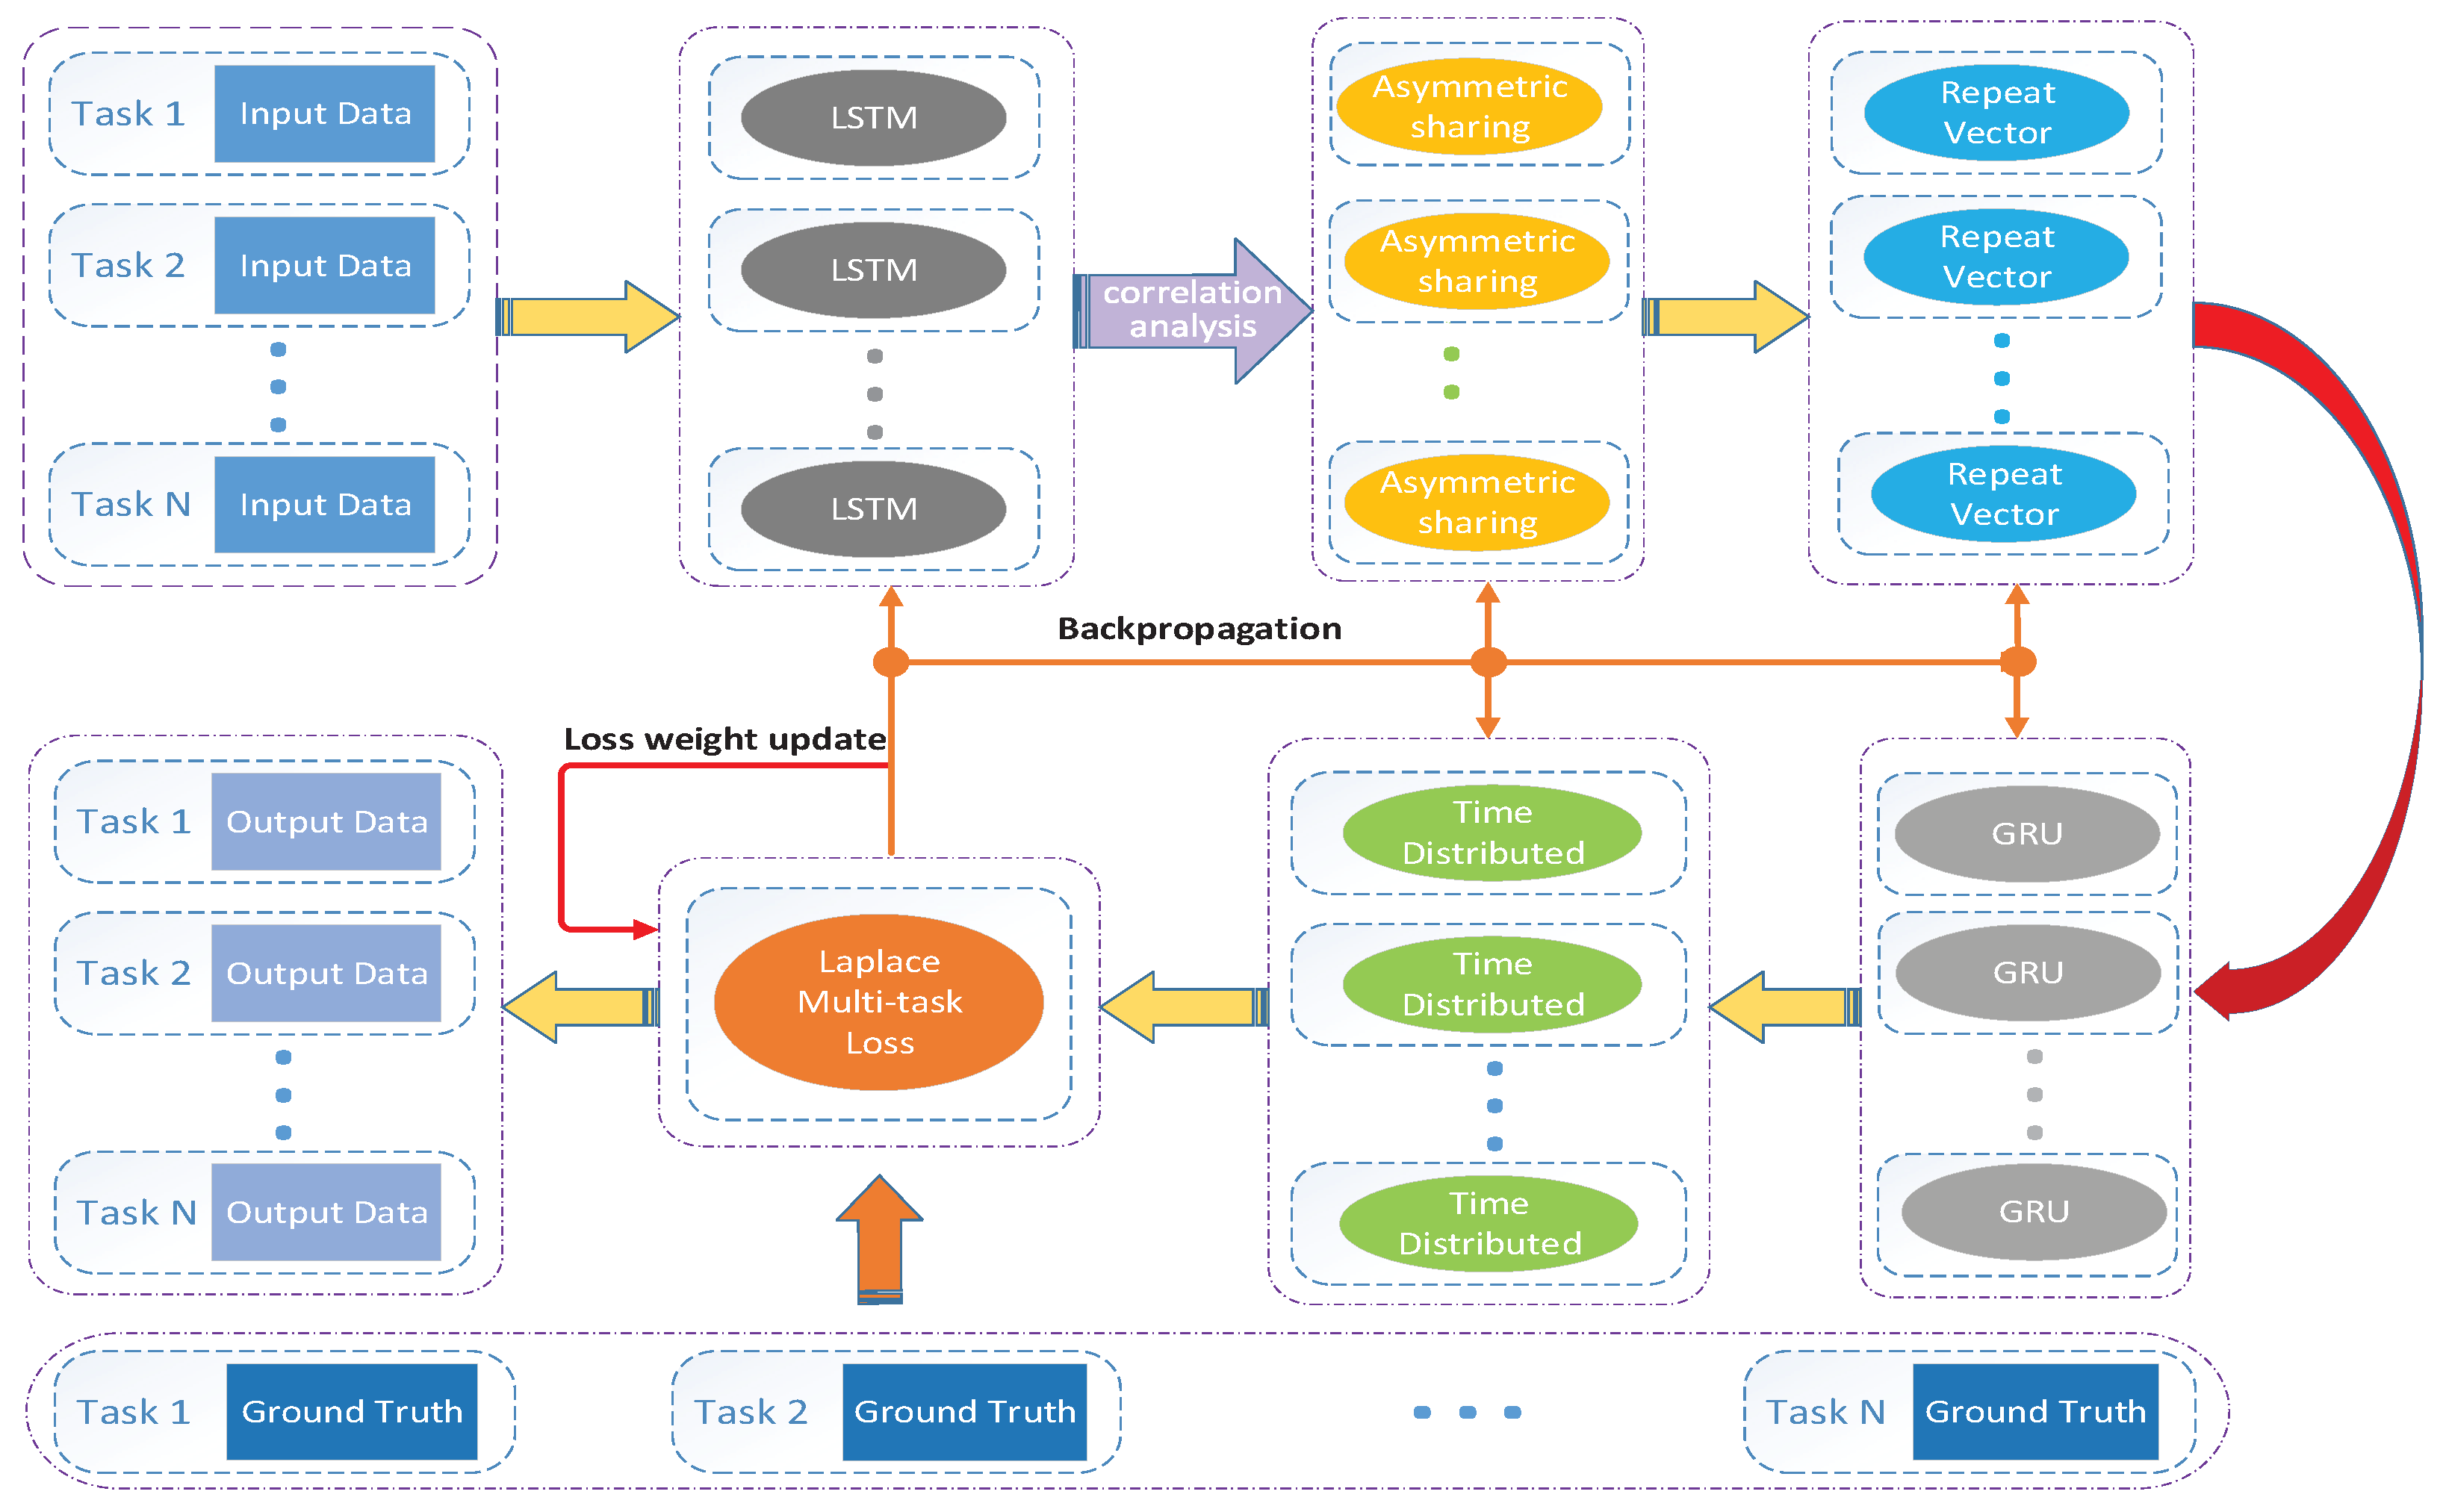
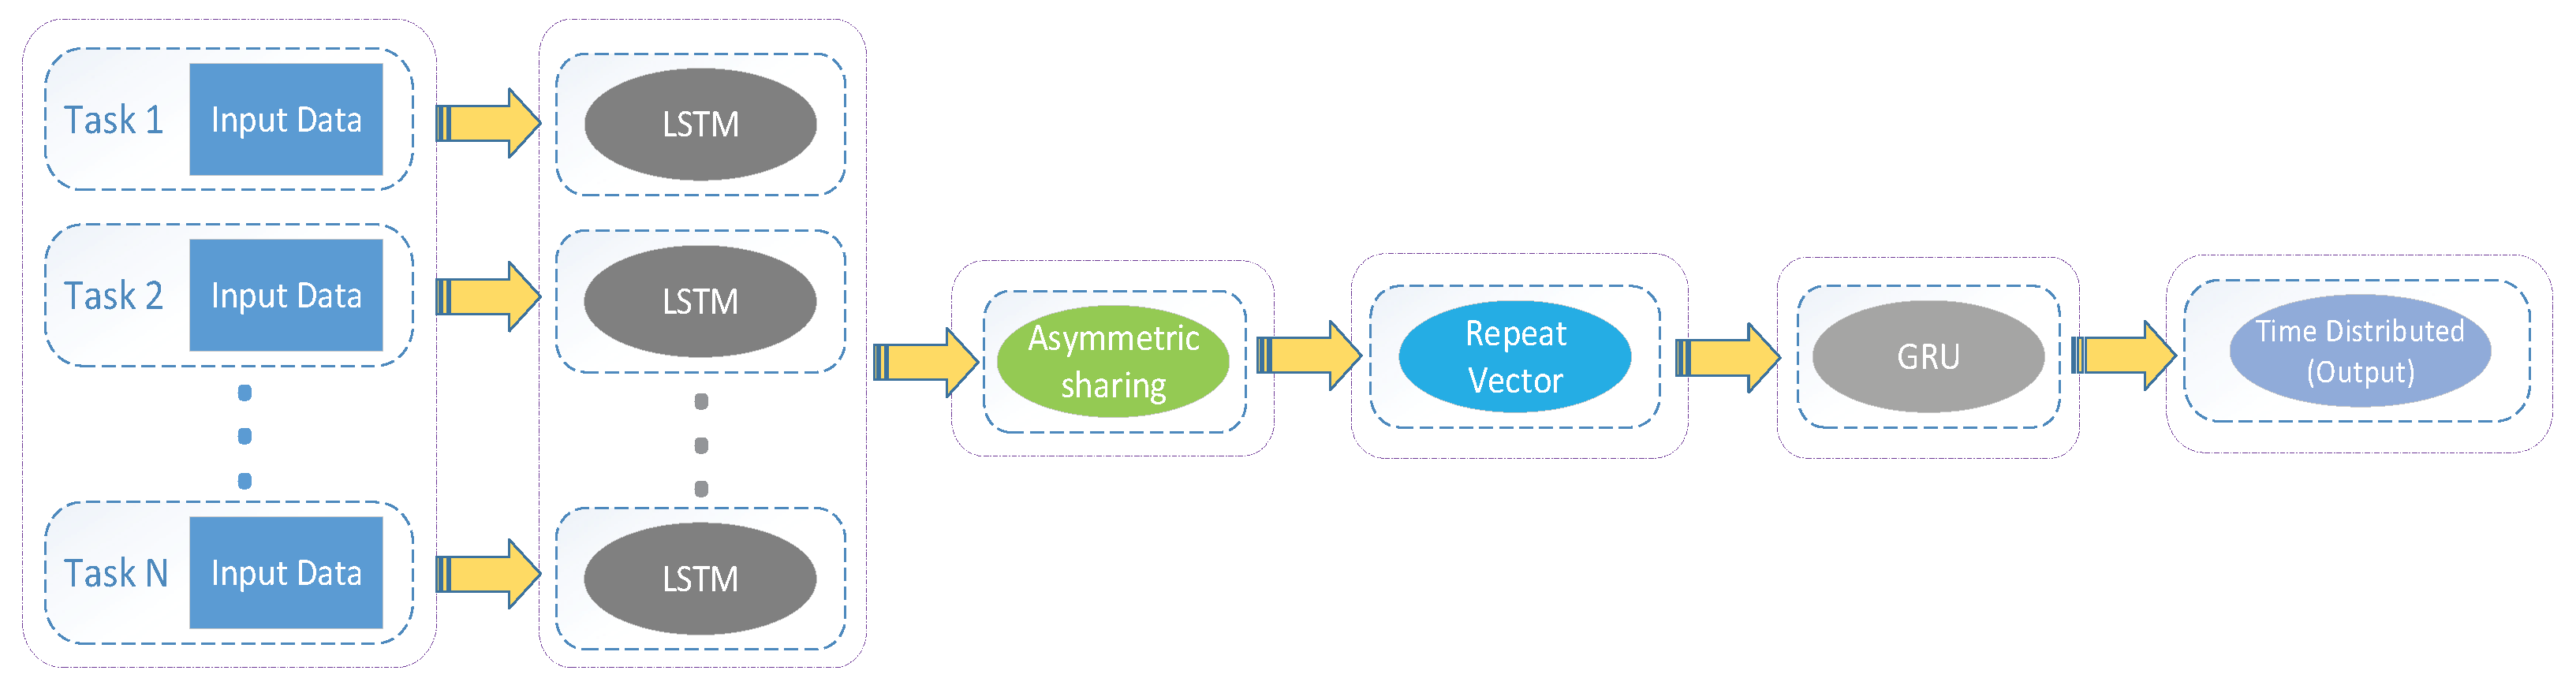
2.3.3. Model Based on the Laplace Multitask Loss

LSTM and GRU share the same goal of efficiently tracking long-term dependencies while alleviating the gradient explosion problem. GRU performs similarly to LSTM on certain tasks in music modeling, speech signal modeling, and natural language processing [26,27] and shows better performance on certain smaller and less-frequent datasets [28]. Therefore, based on existing research and the pre-experiment in this paper, the LSTM-GRU stacking structure was selected as the base structure for the multitask model.
To match the merge layer of the model with the GRU layer, a RepeatVector layer was added to the design of the network structure to give the model the ability to change the time step. Furthermore, a TimeDistributed layer was added before the model output layer to give the model the ability to change the dimensionality. If only the normal dense layer is used, only one result will be obtained at the end, which severely limits the form of the model output. Therefore, it is necessary to use the TimeDistributed layer and dense layer together. The TimeDistributed layer operates denselyat each time step, which increases the dimensionality of the model and gives the model a one-to-many and many-to-many capability, through which the transition from 2D to 3D can be realized.
Specifically, the model proposed in this paper contains six subtasks corresponding to six meteorological parameters with complex correlations and different numerical scales among the parameters. First, the complex correlations among the meteorological parameters determine that a simple single-task model is not capable of such prediction tasks. Second, due to the large differences in numerical scales among meteorological parameters, the subtasks often do not converge simultaneously when using traditional multitask models. Based on these two points, there are few studies in the field of meteorology that use deep learning for simultaneous prediction of multiple meteorological parameters with complex correlations. In this field, the system proposed in this paper is the first system to achieve simultaneous prediction of multiple complexly correlated meteorological parameters.

2.4. Baseline Model

In order to demonstrate the advantages of multitask learning in solving the dependence of parameter correlation and to verify the impact of loss weighting and loss distribution assumptions on multitask learning, three types of models are designed in this paper. All models use the LSTM-GRU stacking structure as the backbone structure. Class I models are single-task learning models for multi-parameter meteorological data prediction, its design ideas are mainly derived from Afan Galih Salman [29] and Fuyong Zhang [30], and represent the leading single-task machine learning algorithms in this field. Such models usually require a strong correlation between the input variables and are structured as shown in Figure 4. Class II models are multitask learning models using classical loss processing, and their structure is shown in Figure 5. The third type of model is a multitask learning model with the addition of a multitask loss processing layer, whose structure is shown in Figure 3. The information of all the models involved in this paper is shown in Table 2.

3. Results and Discussion

3.1. Evaluation Indicators

At present, the metrics for evaluating model performance mainly contain MSE, RMSE, MAPE, and prediction accuracy (ACC). Among the evaluation metrics, MAPE and ACC are more dependent on the initial values, and the initial parameter values greatly influence the accuracy of the generated results. The MSE metric calculates the mean value of the sum of squares of the errors of the calculated results and the real data corresponding to the sample points, and a smaller value indicates a better fit. MSE is considered to reconstruct the error distribution more reliably when there are more samples available [31]. In terms of statistical testing methods, when the multiple regression model is evaluated on the same dataset, since it has exactly the same number of samples and target values, the MSE can be used as an accurate representation of the goodness of fit.
Therefore, in this paper, the mean-squared error (MSE) was used as an evaluation metric for the performance of network models to measure the performance of different network models, and the expression is shown in Equation (11). It is important to note that the MSE in multitask learning is derived by simply summing the MSEs of multiple subtasks. When comparing the performance of the multitask model with that of the single-task model, the MSE values of the multitask model need to be discounted by the number of subtasks.
MSE = 1 n i = 1 n y i y i ^ 2
With the end of Moore’s Law, the computational cost of AI is growing greatly, and the computational efficiency of models is a common concern. Computational volume cannot be used to evaluate the efficiency of a model alone, but must also be combined with hardware characteristics (arithmetic power and bandwidth) and the amount of visits to the inventory for a comprehensive evaluation. The nature of the model may change on different platforms, and it is difficult to give a general conclusion. Therefore, in this paper, we used the predicted execution time of the model on the same computing platform to easily characterize the efficiency of the model.
This paper uses a deep learning development platform based on TensorFlow and Keras, one of the most powerful and easy-to-use python libraries running on open-source machine libraries such as TensorFlow, Theano, or Cognitive Toolkit (CNTK). In this paper, we used TensorFlow as the computational context and the platform versions used are shown in Table 3. The computational efficiency of all models is fairly compared under this computing platform.

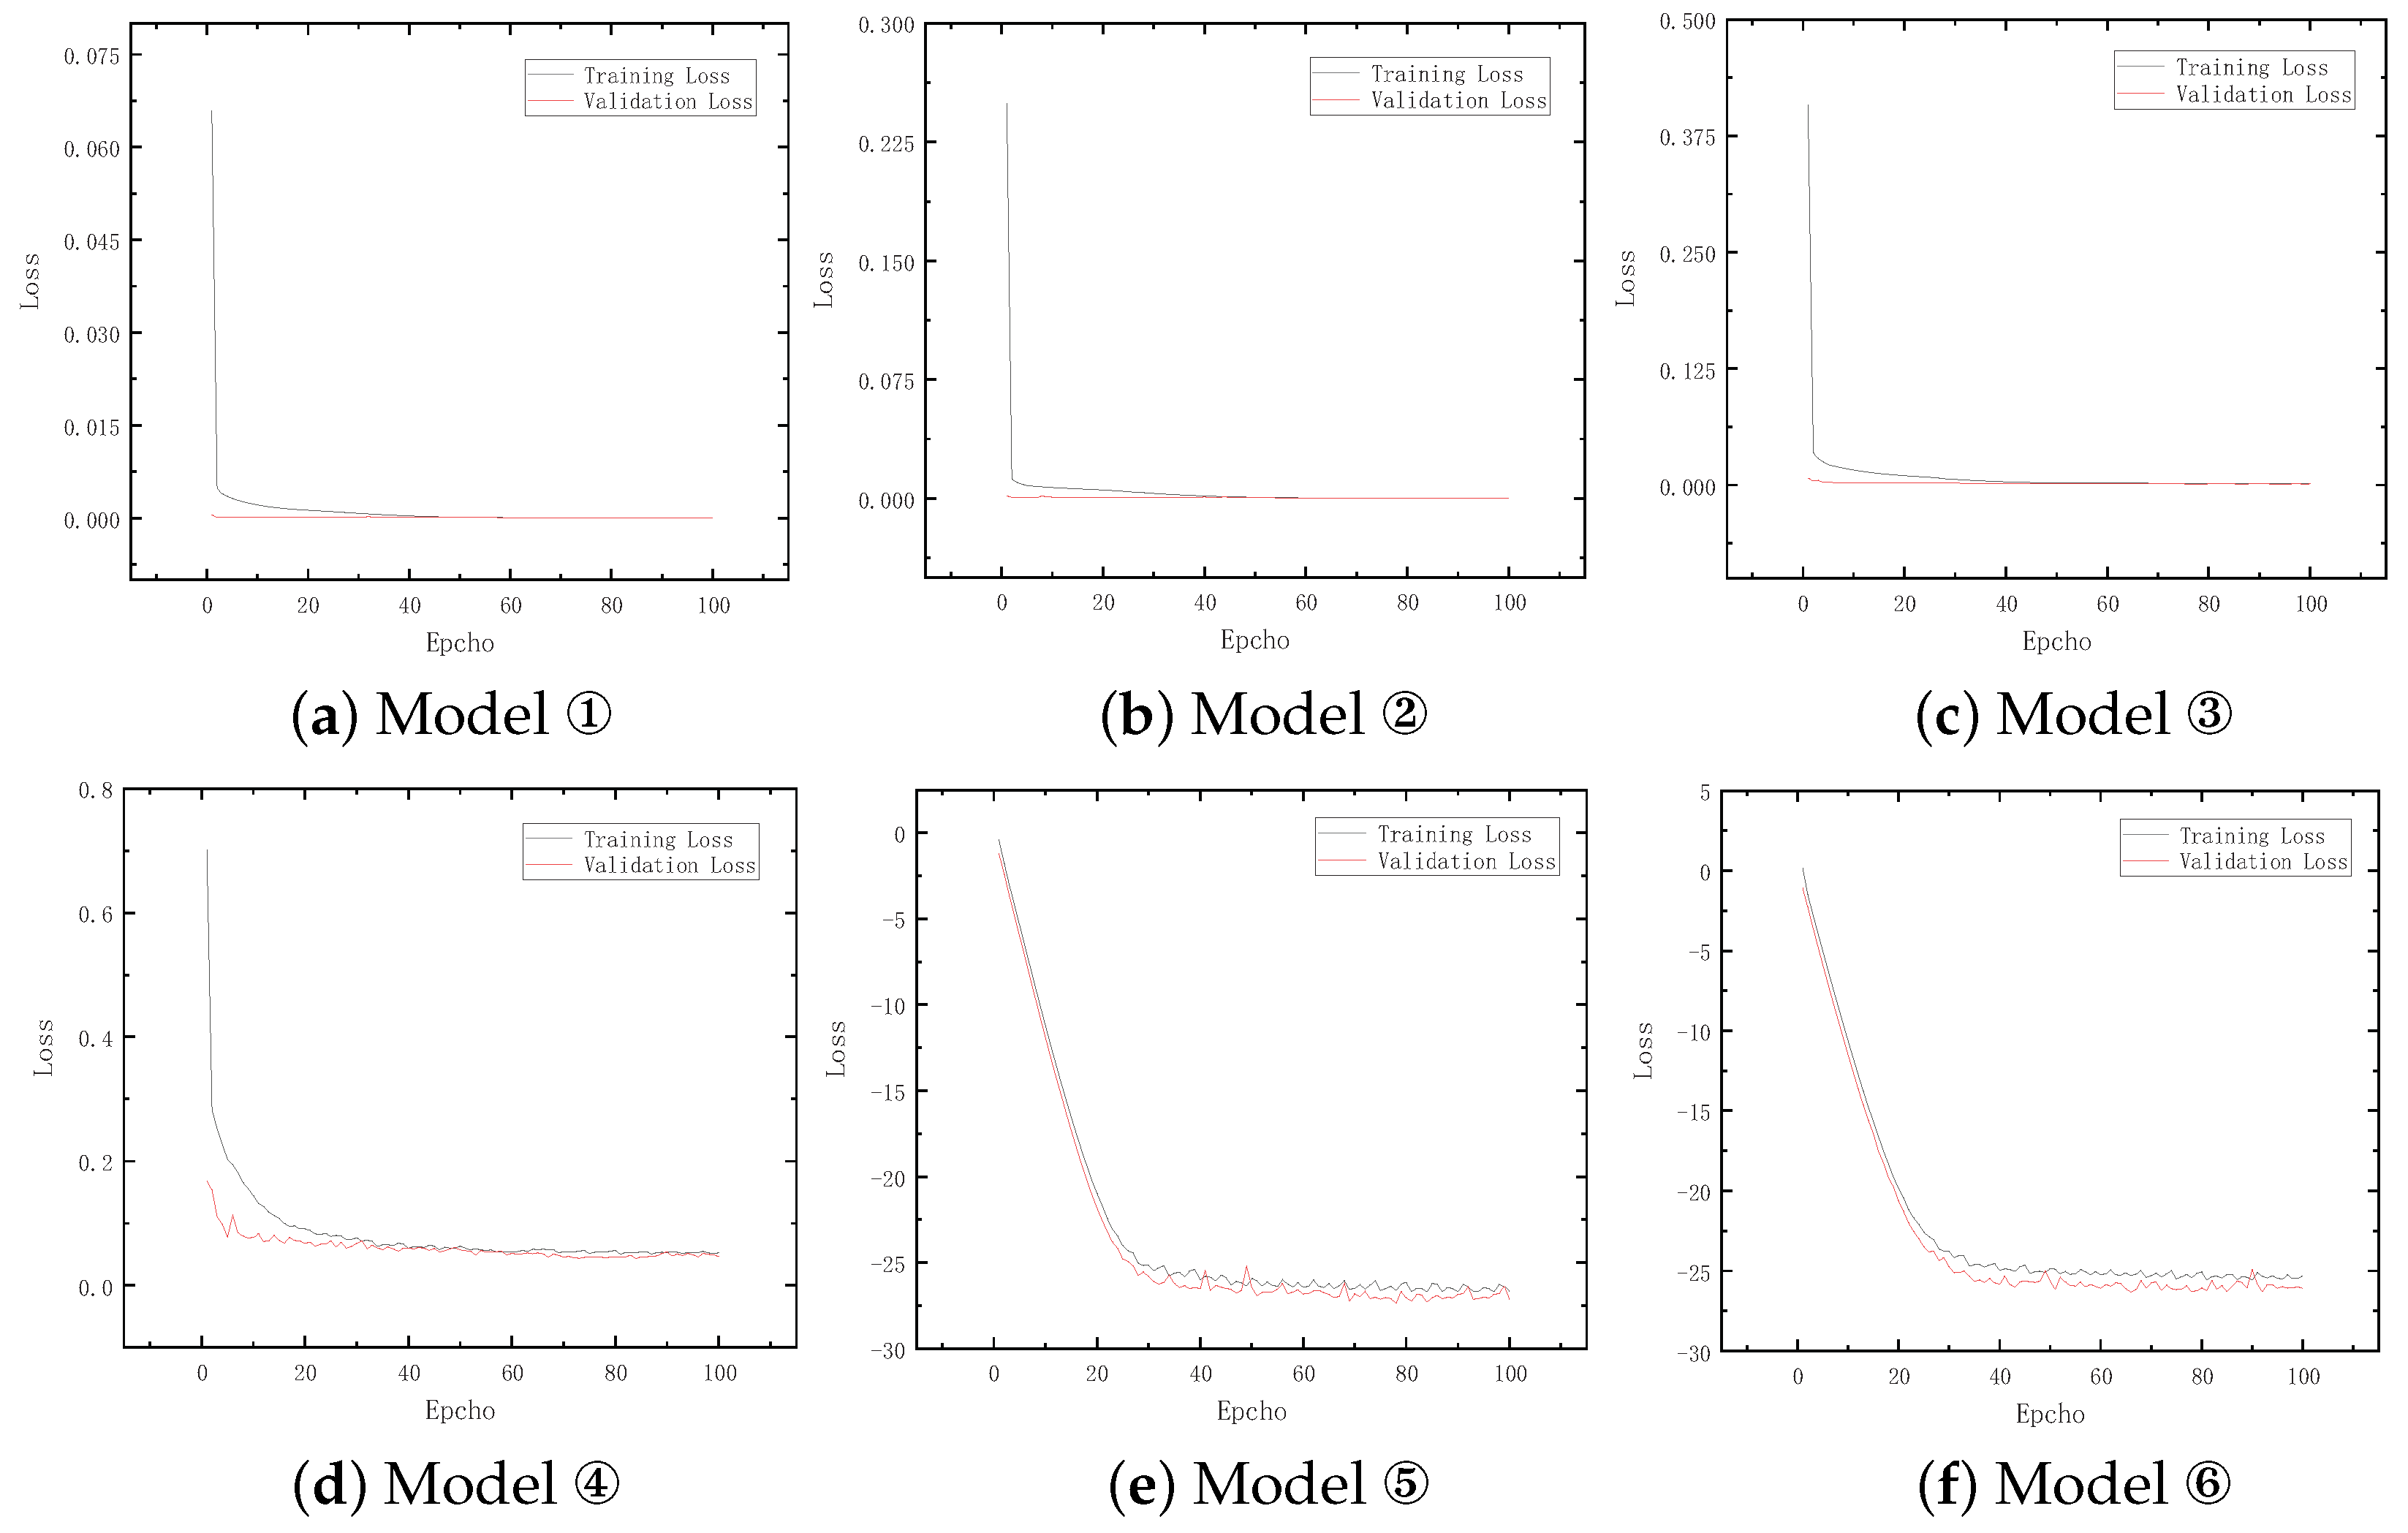
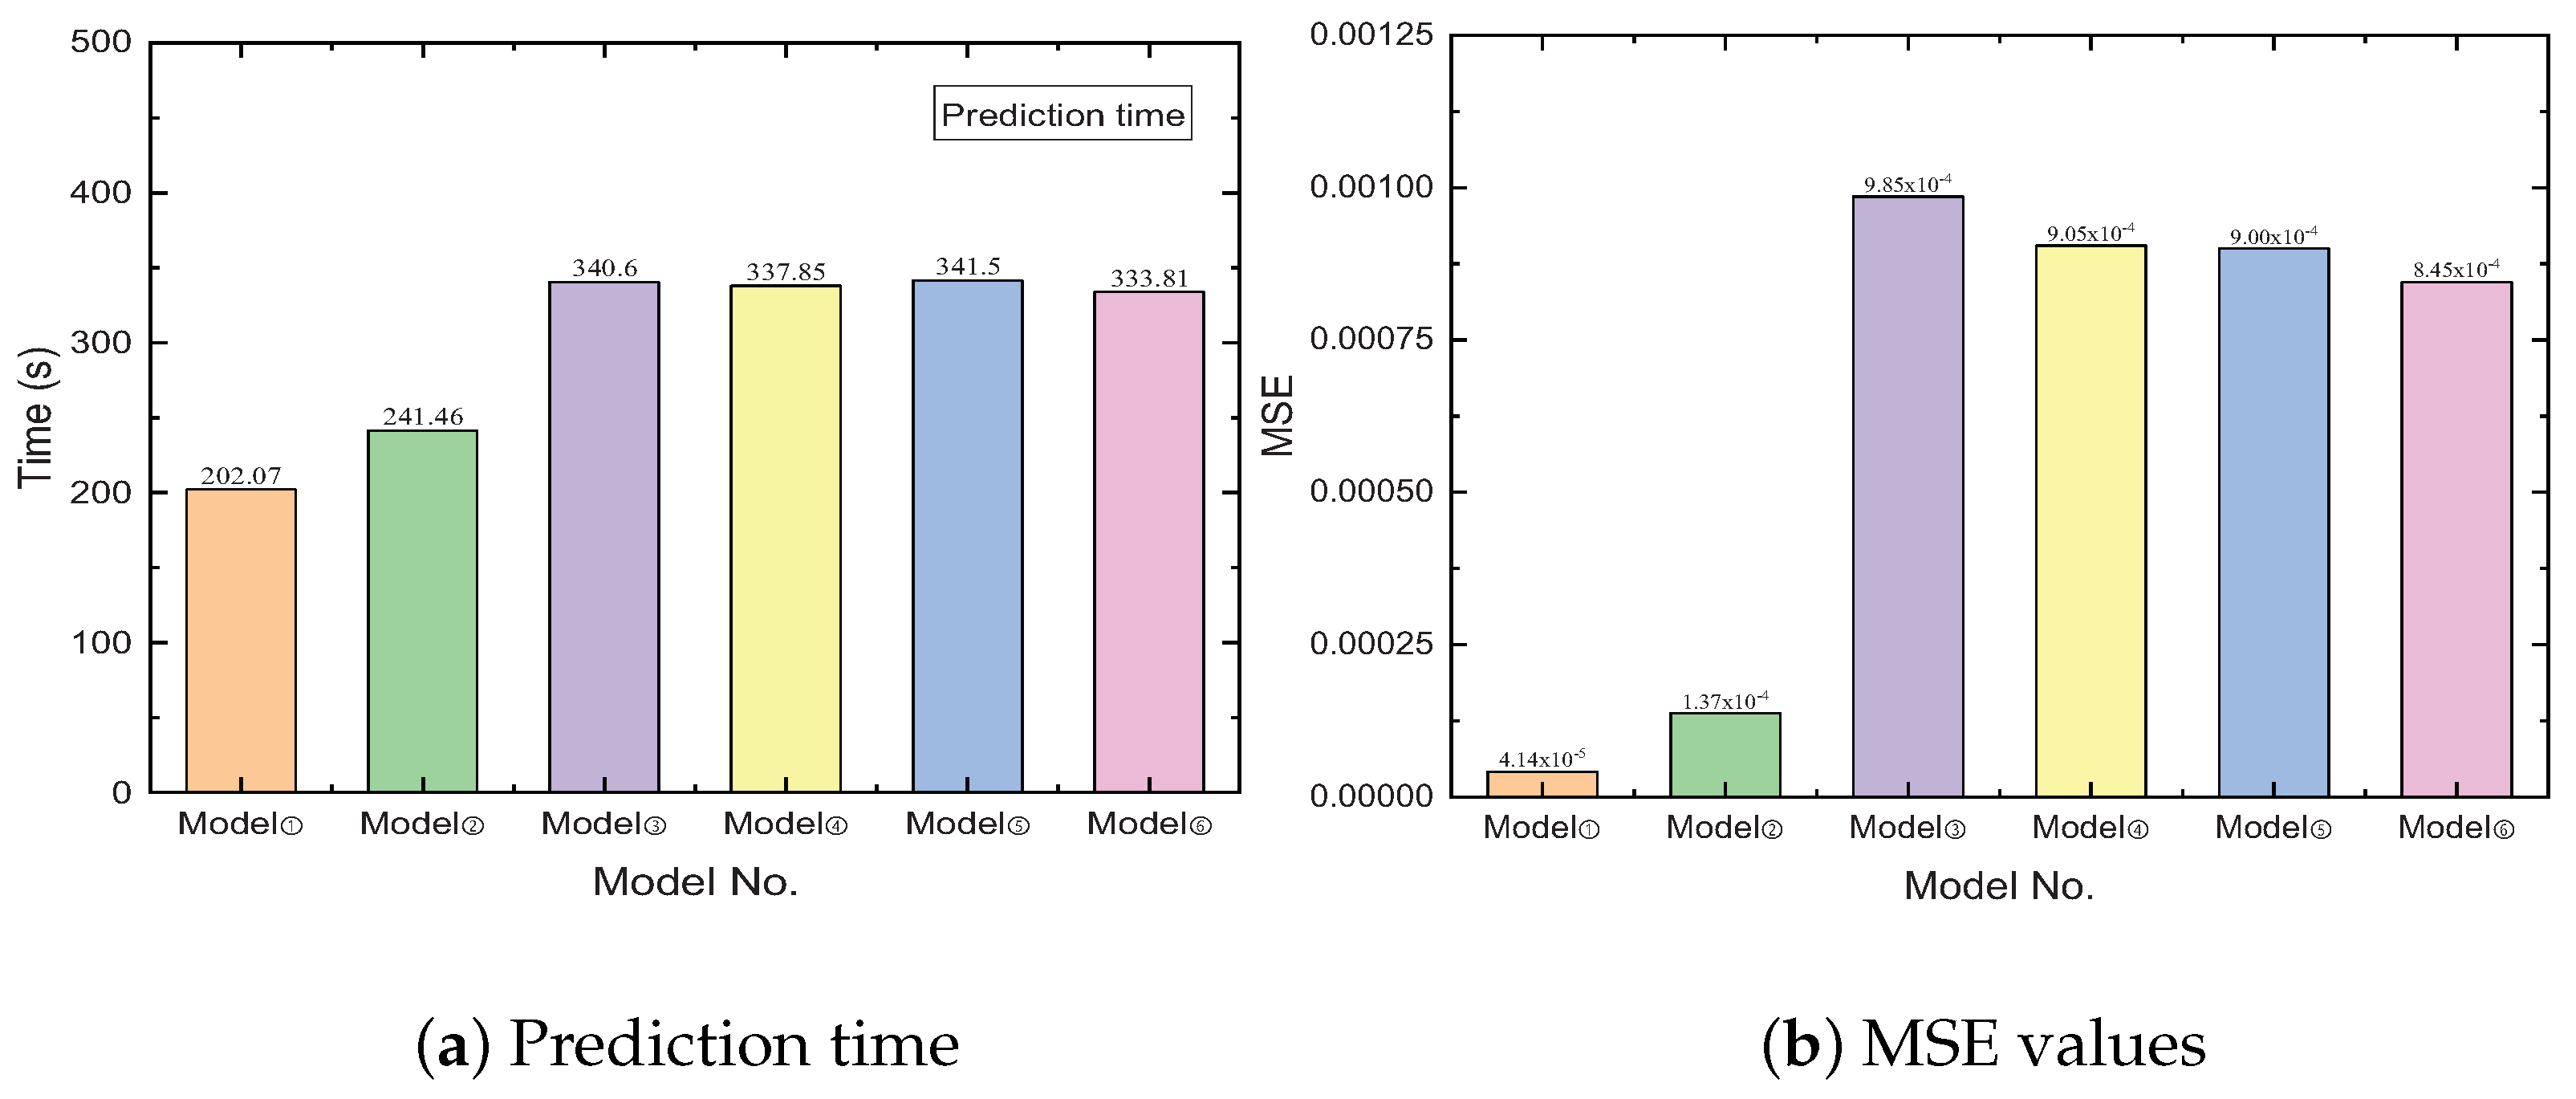
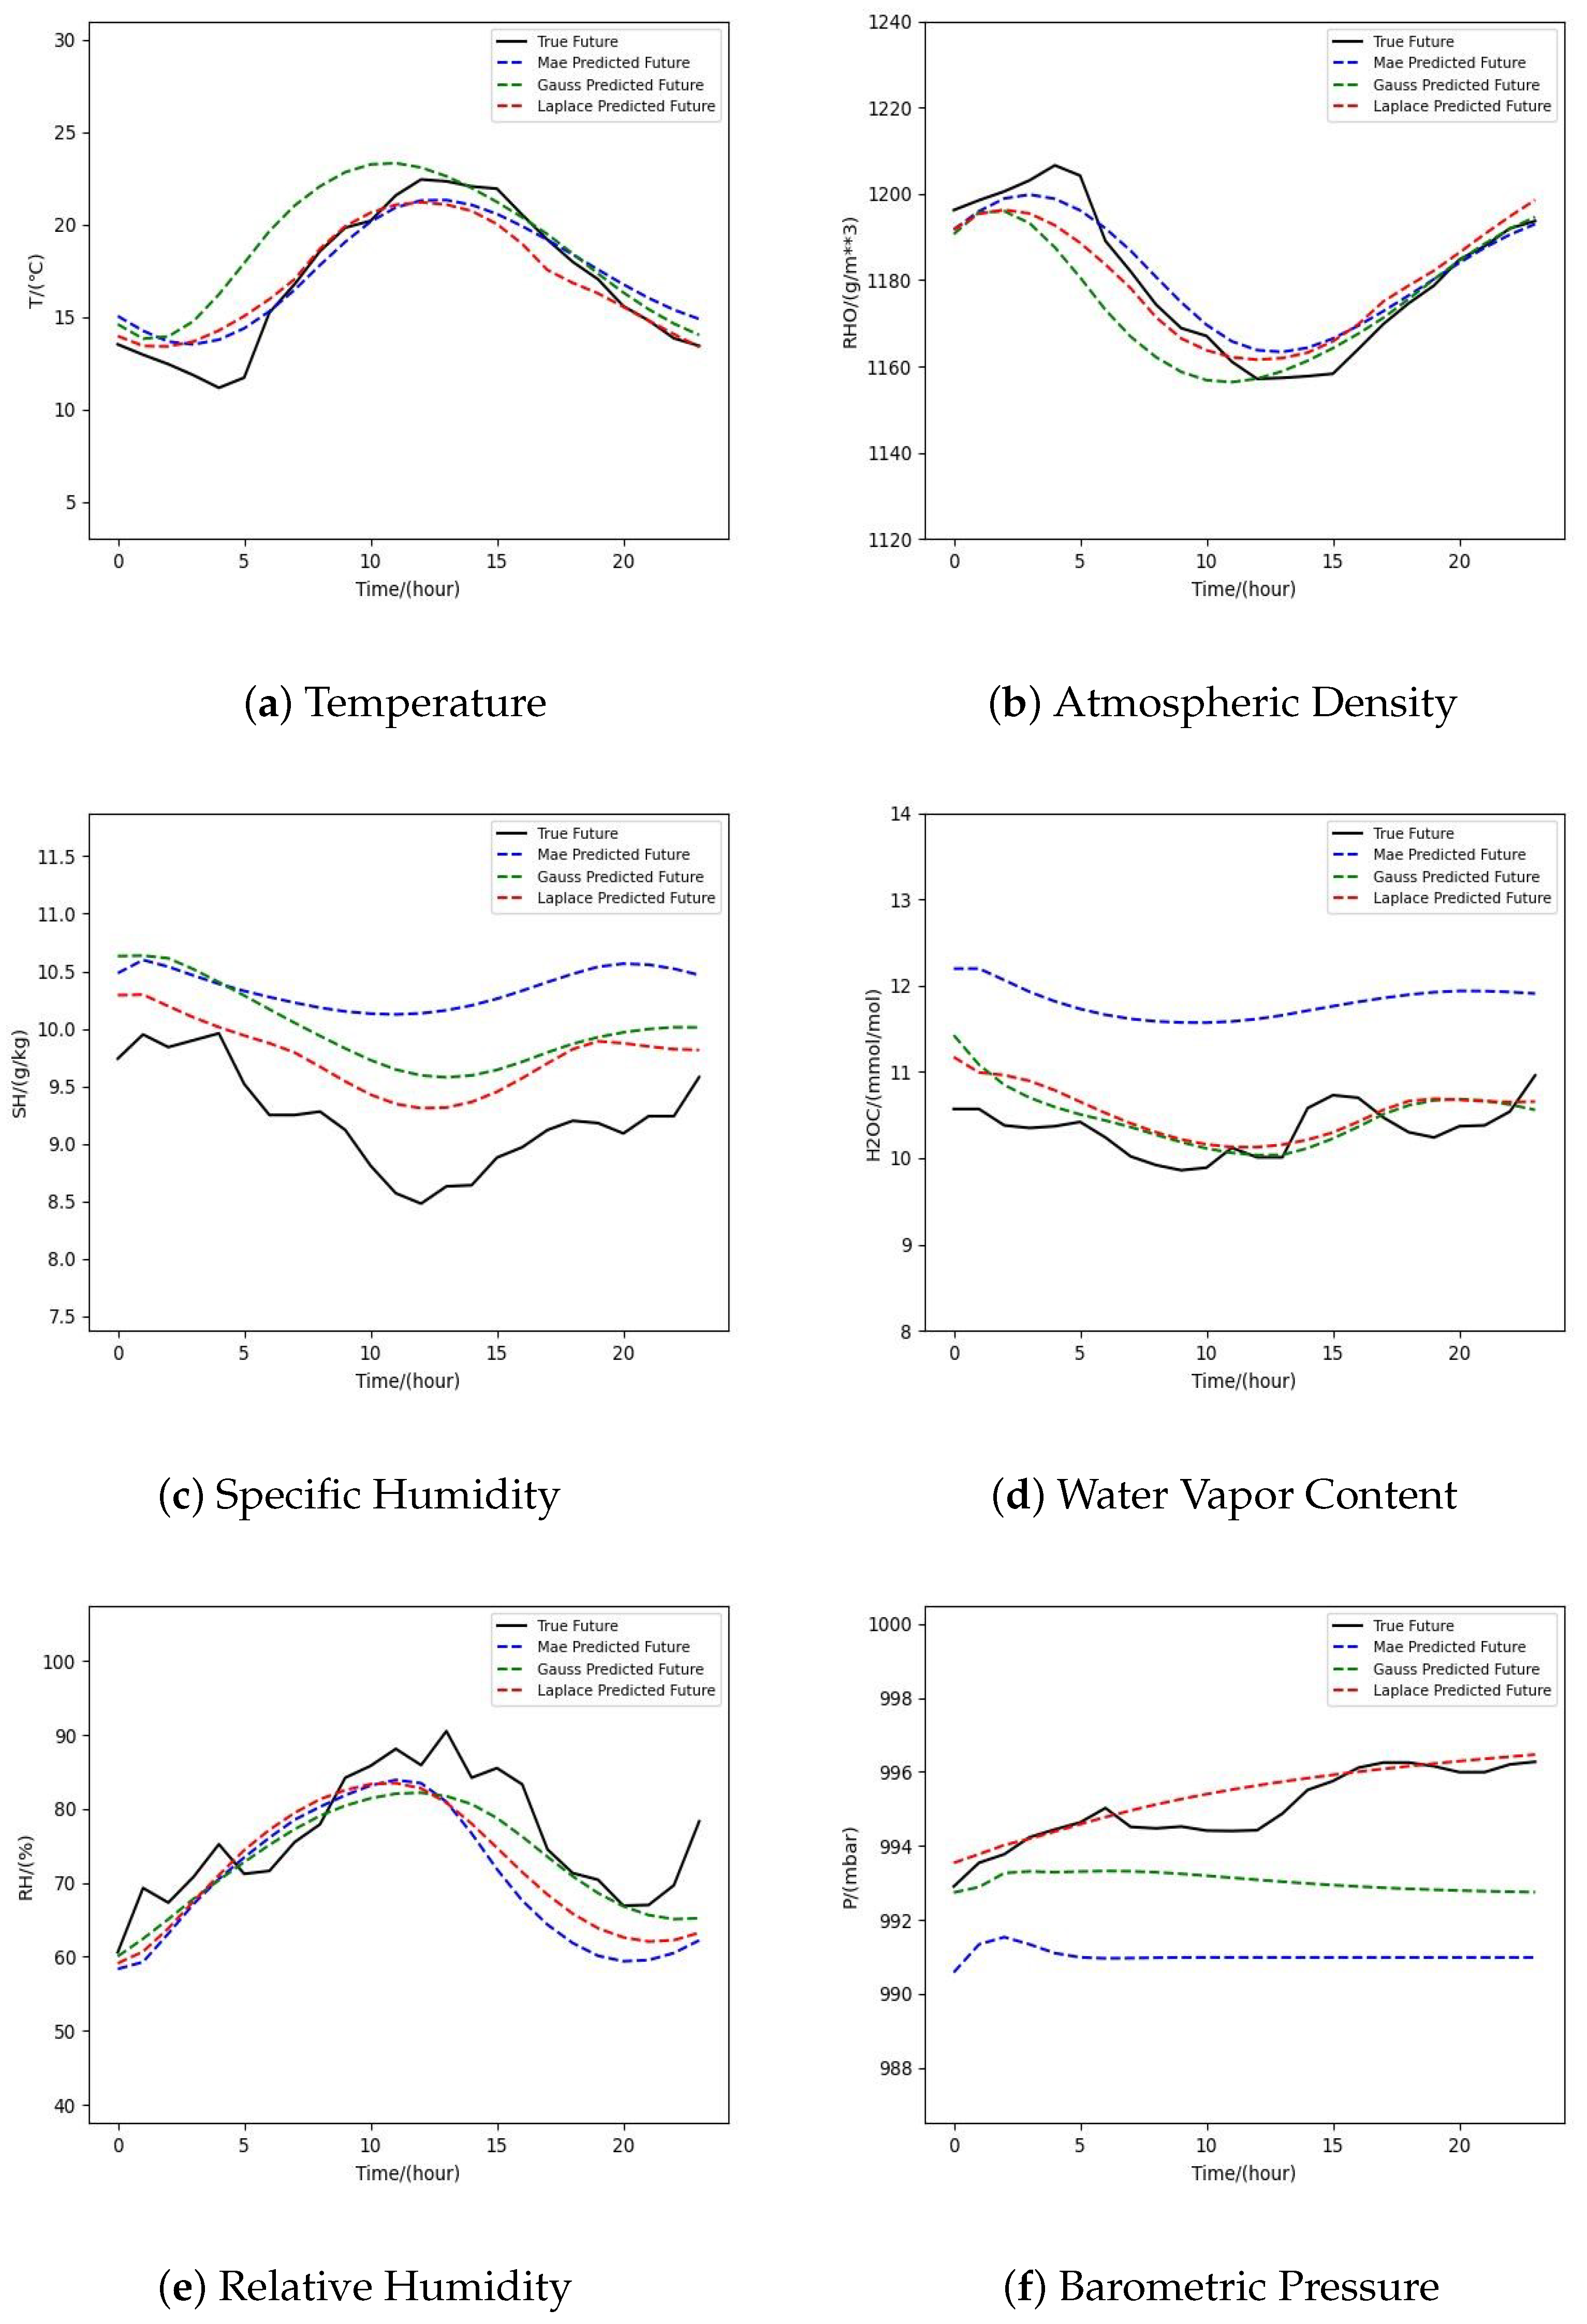
3.2. Analysis and Discussion

Each of the six models was trained with 100 epochs, and the loss variation of each model during the training process is shown in Figure 6. From the figure, we can see that the loss of the models with MSE and MAE as the loss function gradually converges to 0 as the number of training times increases, and the loss of the models with custom loss processing layers converges to some stable negative value. The loss is the minimum of the function after the abstraction of the real problem into a class of convex optimization problems. The abstraction process of the problem is meaningful, while the loss value is not. Therefore, both cases indicate that the model is valid and computationally convergent.
The required prediction time and MSE values for each model are given in Figure 7. The prediction time is defined as a characterization of the model efficiency; 1/MSE is defined as a characterization of the model performance, and the energy efficiency ratio is defined as the ratio of model performance to prediction efficiency. Analyzing the data of Model ① ②, we can see that although the prediction time of the multitask model increase by 16.31%, compared with the single-task model, the prediction performance also increases by 20.86%; in other words, the multitask model can effectively solve the weather parameter dependence problem and has a higher energy efficiency ratio than the single-task model. Analyzing the data of Model ③∼⑥, Model ⑥ shows a 5.2%, 1.20%, and 2.25% reduction in prediction time, but a 14.22%, 6.6%, and 6.07% performance improvement, respectively, over the baseline Model ③④⑤. The Laplace loss function-based model shows the highest energy efficiency ratio among the multitask learning models in this experiment. It should be noted that the multitask model based on Laplace loss function achieved lower MSE values than all benchmark models in the experiments, which indicates that the Laplace loss function is more applicable in the field of meteorological data prediction than the traditional MSE, MAE, and Gauss loss function proposed in the CV field.
To accurately evaluate the performance of the multitask model on each subtask, the MSE values of Model ③∼⑥ on different subtasks and the performance of different loss functions on different subtasks are given in this paper, as shown in Table 4 and Table 5. Table 5 shows the performance differences exhibited by the multitask model on different subtasks when different loss functions are used, calculated as X / Y = ( X Y ) / Y 100 . Analyzing the performance of each model in terms of subtasks, the largest performance gap is reflected in the prediction task of meteorological parameter P. The performance of Model ⑥ is 55.10%, 27.83%, and 16.35% higher than that of Model ③, ④, and ⑤, respectively. The above results show that the proposed multitask learning model can better solve the most difficult problem of predicting weakly correlated meteorological parameters in complex correlation meteorological parameter prediction tasks. Model ⑥ outperforms Models ③ and ④ using the classical loss function in all subtasks and performs significantly better than Model ⑤ on four subtasks, reflecting the superior performance of the loss function based on the homoskedastic uncertainty and Laplace loss distribution assumption proposed in this paper in the multiparameter meteorological data prediction task.
The trained model was used to perform a multi-parameter meteorological data prediction task to obtain meteorological data for the next 24 h. A comparison of the results of Model ④ and Model ⑥ can visually demonstrate the performance improvement brought by the homoscedasticity uncertainty weighted loss method for multitask learning. The comparison of the results of Model ⑤ and Model ⑥ allows a more intuitive analysis of the performance of the Laplace loss distribution assumption and the Gaussian loss distribution assumption in a multitask-learning-based meteorological parameter prediction task. Therefore, this paper focuses on the comparative analysis of the prediction effects of Model ④, Model ⑤, and Model ⑥ for different meteorological parameters. The prediction results are shown in Figure 8.
By analyzing Figure 8, it can be seen that the performance of Model ④ ⑤ ⑥ in the prediction tasks of six meteorological parameters matches exactly with the model performance characterization based on MSE values in Table 5, which proves the reliability of choosing MSE as the model performance evaluation index. The best performance was achieved by Model ⑥ based on homoscedastic uncertainty and the Laplace distribution assumption in the prediction tasks of four meteorological parameters, T, RHO, SH, and P; the prediction results of Model ⑥ in the two prediction tasks of H2OC and RH were slightly worse than those of Model ⑤ based on the Gaussian distribution assumption, indicating that the Laplace loss distribution assumption is more suitable than the Gaussian loss distribution assumption in multitask learning for solving multitask regression problems with outliers such as meteorological data prediction. Model ⑥ performs better than Model ④ in the prediction task for all parameters, which fully illustrates the importance of loss weighting in multitask learning. Model ⑤ shows better performance than Model ④ in the prediction of four meteorological parameters, SH, H2OC, RH, and P. This indicates that the loss treatment method has more influence on the model performance than the loss distribution assumption when using multitask learning for meteorological parameter prediction.

4. Conclusions

In this paper, we designed a network structure based on multitask learning and an asymmetric sharing mechanism for simultaneous multi-parameter meteorological data prediction. It was demonstrated experimentally that the multitask model based on the asymmetric sharing mechanism in the field of multi-parameter meteorological data prediction can effectively solve the problem of meteorological parameter correlation dependence in single-task learning and has a higher energy efficiency ratio in the field of complex correlated meteorological parameter prediction. In this paper, a principled loss function was derived based on the assumption of homoscedasticity uncertainty and the Laplace distribution, which can automatically learn the relative weights during the training process and has better performance and robustness than the existing loss functions. Experimental results showed that appropriate weighting of loss terms can improve model performance and enhance multitask learning, and processing loss terms based on the Laplace distribution assumption and homoscedasticity uncertainty is an effective loss term weighting method. For the field of meteorological data prediction, the loss functions derived based on the above loss term weighting methods can improve the performance of regression tasks such as meteorological parameter prediction. The modeling approach to improve the weighted loss based on the assumption of homoscedasticity uncertainty and Laplace loss distribution has better performance and robustness, which can improve the characterization ability of multitask models and the performance of each subtask.

Author Contributions

Conceptualization, J.W. and L.L.; methodology, J.W.; software, J.W.; validation, J.W., L.L. and Y.Z.; formal analysis, Z.T.; investigation, J.W.; resources, L.L.; data curation, Y.Z.; writing—original draft preparation, J.W.; writing—review and editing, L.L.; visualization, Z.T.; supervision, L.L.; project administration, J.W.; funding acquisition, L.L. All authors have read and agreed to the published version of the manuscript.

Funding

This research received no external funding.

Institutional Review Board Statement

Not applicable.

Informed Consent Statement

Not applicable.

Data Availability Statement

Not applicable.

Conflicts of Interest

The authors declare no conflict of interest.

References

  1. Zhang, S. Short-Term Weather Element Prediction Method Based on EMD with Phase Space Reconstruction Limit Learning Machine and Its Application Research; Nanchang University: Nanchang, China, 2016. [Google Scholar]
  2. Cui, C.; Li, W.T.; Ye, X.T.; Shi, X.W. Hybrid Genetic Algorithm and Modified Iterative Fourier Transform Algorithm for Large Thinned Array Synthesis. IEEE Antennas Wirel. Propag. Lett. 2017, 16, 2150–2154. [Google Scholar] [CrossRef]
  3. Ram, G.; Mandal, D.; Kar, R.; Ghoshal, S.P. Optimal design of non-uniform circular antenna arrays using PSO with wavelet mutation. Int. J. Bio-Inspired Comput. 2014, 6, 424–433. [Google Scholar] [CrossRef]
  4. Saryazdi, N.P. GSA: A Gravitational Search Algorithm. Inf. Sci. 2009, 179, 2232–2248. [Google Scholar]
  5. Liu, Y.; Ma, L. Gravitational Search Algorithms and Their Applications; Shanghai People’s Publishing House: Shanghai, China, 2014. [Google Scholar]
  6. Xu, X.; Yang, Z.; Ma, T. Optimization of weather structured data query based on HBase. Comput. Eng. Appl. 2017, 53, 80–84. [Google Scholar]
  7. Wang, X. Research and Application of Multivariate Meteorological Data Methods; Xi’an University of Electronic Science and Technology: Xi’an, China, 2020. [Google Scholar] [CrossRef]
  8. Zhao, X. Research on Regional Air Temperature and Humidity Prediction Method Based on Deep Learning; Northwest Agriculture and Forestry University: Xianyang, China, 2021. [Google Scholar] [CrossRef]
  9. Xu, X. From physical models to intelligent analysis—A new exploration of reducing weather forecast uncertainty. Meteorology 2018, 44, 341–350. [Google Scholar]
  10. Das, M.; Ghosh, S.K. Data-driven Approaches for Meteorological Time Series Prediction: A Comparative Study of the State-of-the-Art Computational Intelligence Techniques. Pattern Recognit. Lett. 2017, 105, 155–164. [Google Scholar] [CrossRef]
  11. Ferreira, L.B.; da Cunha, F.F.; Fernandes Filho, E.I. Exploring machine learning and multitask learning to estimate meteorological data and reference evapotranspiration across Brazil. Agric. Water Manag. 2022, 259, 107281. [Google Scholar] [CrossRef]
  12. Seng, D.; Zhang, Q.; Zhang, X.; Chen, G.; Chen, X. Spatiotemporal prediction of air quality based on LSTM neural network-ScienceDirect. Alex. Eng. J. 2020. [Google Scholar] [CrossRef]
  13. Zaytar, M.A.; Amrani, C.E. Sequence to Sequence Weather Forecasting with Long Short-Term Memory Recurrent Neural Networks. Int. J. Comput. Appl. 2016, 143, 7–11. [Google Scholar]
  14. Thrun, S. Is learning the n-th thing any easier than learning the first? In Advances in Neural Information Processing Systems 8; The MIT Press: Cambridge, CA, USA, 1995. [Google Scholar]
  15. Caruana, R.A. Multitask Learning; Kluwer Academic Publishers: Hague, Holland, 1998. [Google Scholar]
  16. Ferreira, L.B.; Cunha, F. Multi-step ahead forecasting of daily reference evapotranspiration using deep learning. Comput. Electron. Agric. 2020, 178, 105728. [Google Scholar] [CrossRef]
  17. Han, Y.; Li, V.O.; Lam, J.C.; Pollitt, M. How BLUE is the Sky? Estimating air qualities in Beijing during the Blue Sky Day period (2008–2012) by Bayesian Multitask LSTM-ScienceDirect. Environ. Sci. Policy 2021, 116, 69–77. [Google Scholar] [CrossRef]
  18. Zhang, Q.; Wu, S.; Wang, X.; Sun, B.; Liu, H. A PM2.5 concentration prediction model based on multitask deep learning for intensive air quality monitoring stations. J. Clean. Prod. 2020, 275, 122722. [Google Scholar] [CrossRef]
  19. Kendall, A.; Gal, Y.; Cipolla, R. Multitask Learning Using Uncertainty to Weigh Losses for Scene Geometry and Semantics. In Proceedings of the IEEE Conference on Computer Vision and Pattern Recognition, Salt Lake City, UT, USA, 18–23 June 2018. [Google Scholar]
  20. Sener, O.; Koltun, V. Multitask Learning as Multi-objective Optimization. In Proceedings of the 32nd Conference on Neural Information Processing Systems, Montreal, QC, Canada, 3–8 December 2018; pp. 527–538. [Google Scholar]
  21. Kendall, A.; Gal, Y. What Uncertainties do We Need in Bayesian Deep Learning for Computer Vision? In Proceedings of the 31st International Conference on Neural Information Processing Systems, Long Beach, CA, USA, 4–9 December 2017; pp. 5580–5590. [Google Scholar]
  22. Franzese, M.; Iuliano, A. Correlation Analysis. 2019. Available online: https://www.sciencedirect.com/science/article/pii/B9780128096338203580?via%3Dihub (accessed on 1 June 2022).
  23. Yang, X. Research on Weather Prediction Based on Deep Learning; Harbin Institute of Technology: Harbin, China, 2017. [Google Scholar]
  24. Gal, Y.; Ghahramani, Z. Dropout as a Bayesian Approximation: Representing Model Uncertainty in Deep Learning. In International Conference on Machine Learning; PMLR: New York, NY, USA, 2015. [Google Scholar]
  25. Kendall, A.; Badrinarayanan, V.; Cipolla, R. Bayesian SegNet: Model Uncertainty in Deep Convolutional Encoder-Decoder Architectures for Scene Understanding. Comput. Sci. 2015. [Google Scholar] [CrossRef]
  26. Ravanelli, M.; Brakel, P.; Omologo, M.; Bengio, Y. Light gated recurrent units for speech recognition. IEEE Trans. Emerg. Top. Comput. Intell. 2018, 2, 92–102. [Google Scholar] [CrossRef] [Green Version]
  27. Mumcuoğlu, E.; Öztürk, C.E.; Ozaktas, H.M.; Koç, A. Natural language processing in law: Prediction of outcomes in the higher courts of Turkey. Inf. Process. Manag. 2021, 58, 102684. [Google Scholar] [CrossRef]
  28. Chung, J.; Gulcehre, C.; Cho, K.; Bengio, Y. Empirical evaluation of gated recurrent neural networks on sequence modeling. arXiv 2014, arXiv:1412.3555. [Google Scholar]
  29. Salman, A.G.; Heryadi, Y.; Abdurahman, E.; Suparta, W. Weather forecasting using merged long short-term memory model. Bull. Electr. Eng. Inform. 2018, 7, 377–385. [Google Scholar] [CrossRef]
  30. Zhang, F.; Gao, X.; Zhang, S.; Wang, Q.; Lin, L. Atmospheric Environment Data Generation Method Based on Stacked LSTM-GRU. In Proceedings of the 2021 IEEE 15th International Conference on Electronic Measurement & Instruments (ICEMI), Nanjing, China, 29–31 October 2021; pp. 17–26. [Google Scholar]
  31. Sutskever, I.; Vinyals, O.; Le, Q.V. Sequence to sequence learning with neural networks. Adv. Neural Inf. Process. Syst. 2014, 27, 3104–3112. [Google Scholar]
  32. Alexey, N.; Alois, K. Gradient boosting machines, a tutorial. Front. Neurorobot. 2013, 7, 21. [Google Scholar]
  33. Bauer, E.; Kohavi, R. An Empirical Comparison of Voting Classification Algorithms: Bagging, Boosting, and Variants. Mach. Learn. 1999, 36, 105–139. [Google Scholar] [CrossRef]
Figure 1. Schematic of the asymmetric shared layer structure.
Atmosphere 13 00989 g001
Figure 2. Schematic diagram of data time sliding window processing.
Atmosphere 13 00989 g002
Figure 3. Architecture of simultaneous multi-parameter meteorological data prediction. The total loss of the network is generated by the backbone layer, weighted by the Laplace multitask loss layer, and the gradient updates the parameters of the Laplace multitask loss layer while back propagating.
Atmosphere 13 00989 g003
Figure 4. Structure of single-task learning model using classical loss processing.
Atmosphere 13 00989 g004
Figure 5. Structure of multitask learning model using classical loss processing.
Atmosphere 13 00989 g005
Figure 6. Variation of loss during model training. The loss of all models converges to a certain stable value, which means that all models have reached the optimal performance state under the current network architecture.
Atmosphere 13 00989 g006
Figure 7. Model energy efficiency data.
Atmosphere 13 00989 g007
Figure 8. Prediction results of Model ④ ⑤ ⑥ for meteorological parameters. The black curve is the observed value, and the red, green, and blue lines represent the predicted value when the multitask model uses different loss functions. Among all the results, the model based on Laplace multitask loss function achieved the best prediction results.
Atmosphere 13 00989 g008
Table 1. Correlation coefficients between the parameters in the Jena dataset.
Correlation
Coefficient
TPRHORHWVSHH2OC
T1.0000−0.0453−0.9634−0.5724−0.00460.86680.8671
P−0.04531.00000.3076−0.0183−0.0057−0.0697−0.0698
RHO−0.96340.30761.00000.51420.0032−0.8533−0.8537
RH−0.5724−0.01830.51421.0000−0.0050−0.1508−0.1509
WV−0.0046−0.00570.0032−0.00501.0000−0.0094−0.0095
SH0.8668−0.0697−0.8533−0.1508−0.00941.00000.9999
H2OC0.8671−0.0698−0.8537−0.1509−0.00950.99991.0000
Table 2. Summary of model information.
Model No.ClassifyParametersOutput TypeLoss Handling Method
IH2OC/SH/WV/PSingleMSE
IIH2OC/SH/WV/PMultiMSE
IIT/RHO/SH/H2OC/RH/PMultiMSE
IIT/RHO/SH/H2OC/RH/PMultiMAE
IIIT/RHO/SH/H2OC/RH/PMultiGAUSS
IIIT/RHO/SH/H2OC/RH/PMultiLAPLACE
Table 3. Software and versions used in this paper.
PlatformWindows 10GPUTensorFlowCudaCudnnKeras
Version1909Nvidia Titan XP2.3.010.17.62.3.1
Table 4. MSE values for subtasks in the multitasking model.
LabelModel ③Model ④Model ⑤Model ⑥
T 2.47 × 10 5 2.25 × 10 5 2.40 × 10 5 2.12 × 10 5
RHO 5.48 × 10 4 5.67 × 10 4 5.87 × 10 4 5.38 × 10 4
SH 4.40 × 10 6 3.19 × 10 6 2.95 × 10 6 2.88 × 10 6
H2OC 1.23 × 10 5 8.78 × 10 6 8.06 × 10 6 8.27 × 10 6
RH 3.14 × 10 4 2.52 × 10 4 2.34 × 10 4 2.38 × 10 4
P 8.18 × 10 5 5.09 × 10 5 4.39 × 10 5 3.67 × 10 5
SUM 9.85 × 10 4 9.05 × 10 4 9.00 × 10 4 8.45 × 10 4
Table 5. Performance comparison of different loss functions on different subtasks.
LabelLaplace/GaussLaplace/MseLaplace/MaeGauss/MseGauss/MaeMae/Mse
T11.8514.295.922.77−6.728.89
RHO8.401.915.14−7.09−3.56−3.41
SH2.0734.469.5533.087.6427.54
H2OC−2.6932.825.7534.588.2228.71
RH−1.9624.075.6125.537.4219.55
P16.3555.1027.8346.3313.7237.79
Gauss [19]: multitask loss function proposed by Kendall et al. MAE [32]: Manhattan distance; represents the sum of absolute values of residuals. MSE [33]: Euclidean distance, used to calculate the similarity between data points.
Publisher’s Note: MDPI stays neutral with regard to jurisdictional claims in published maps and institutional affiliations.

