
How Sensitive Morphological Parameters Influence on the PM2.5 Diffusion: An Empirical Study of Two Neighborhoods in Central Beijing


Abstract
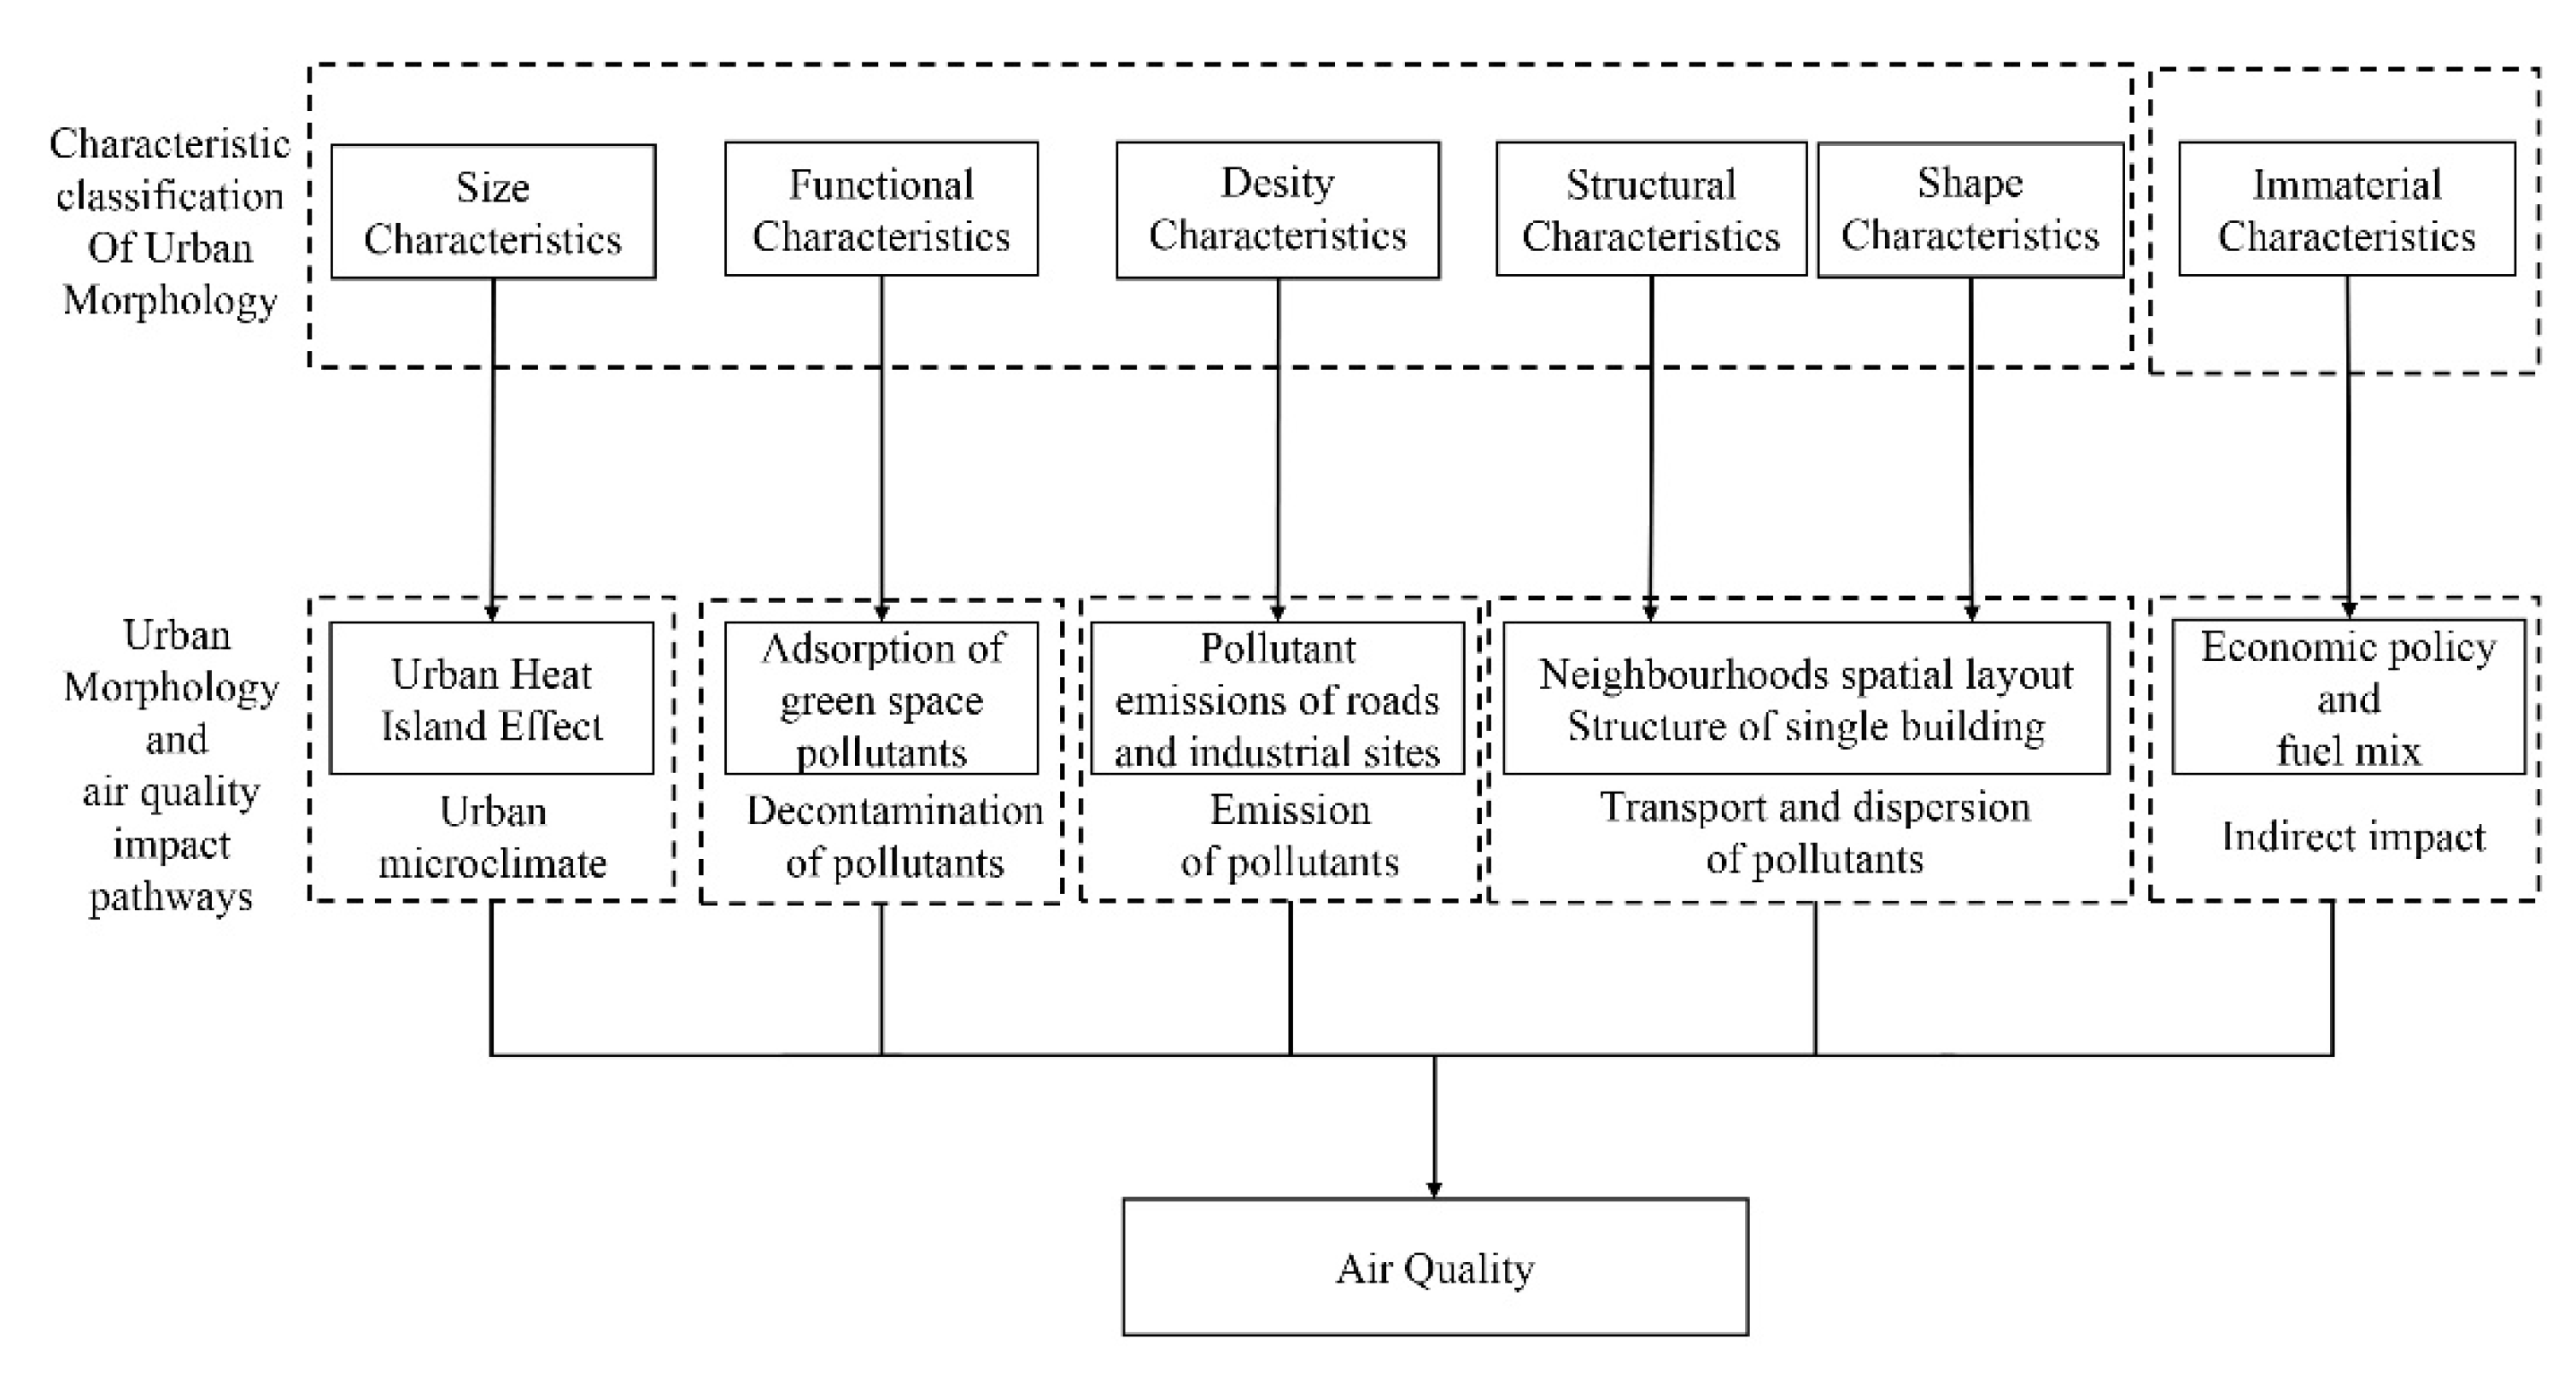
:1. Introduction
2. Data and Methods
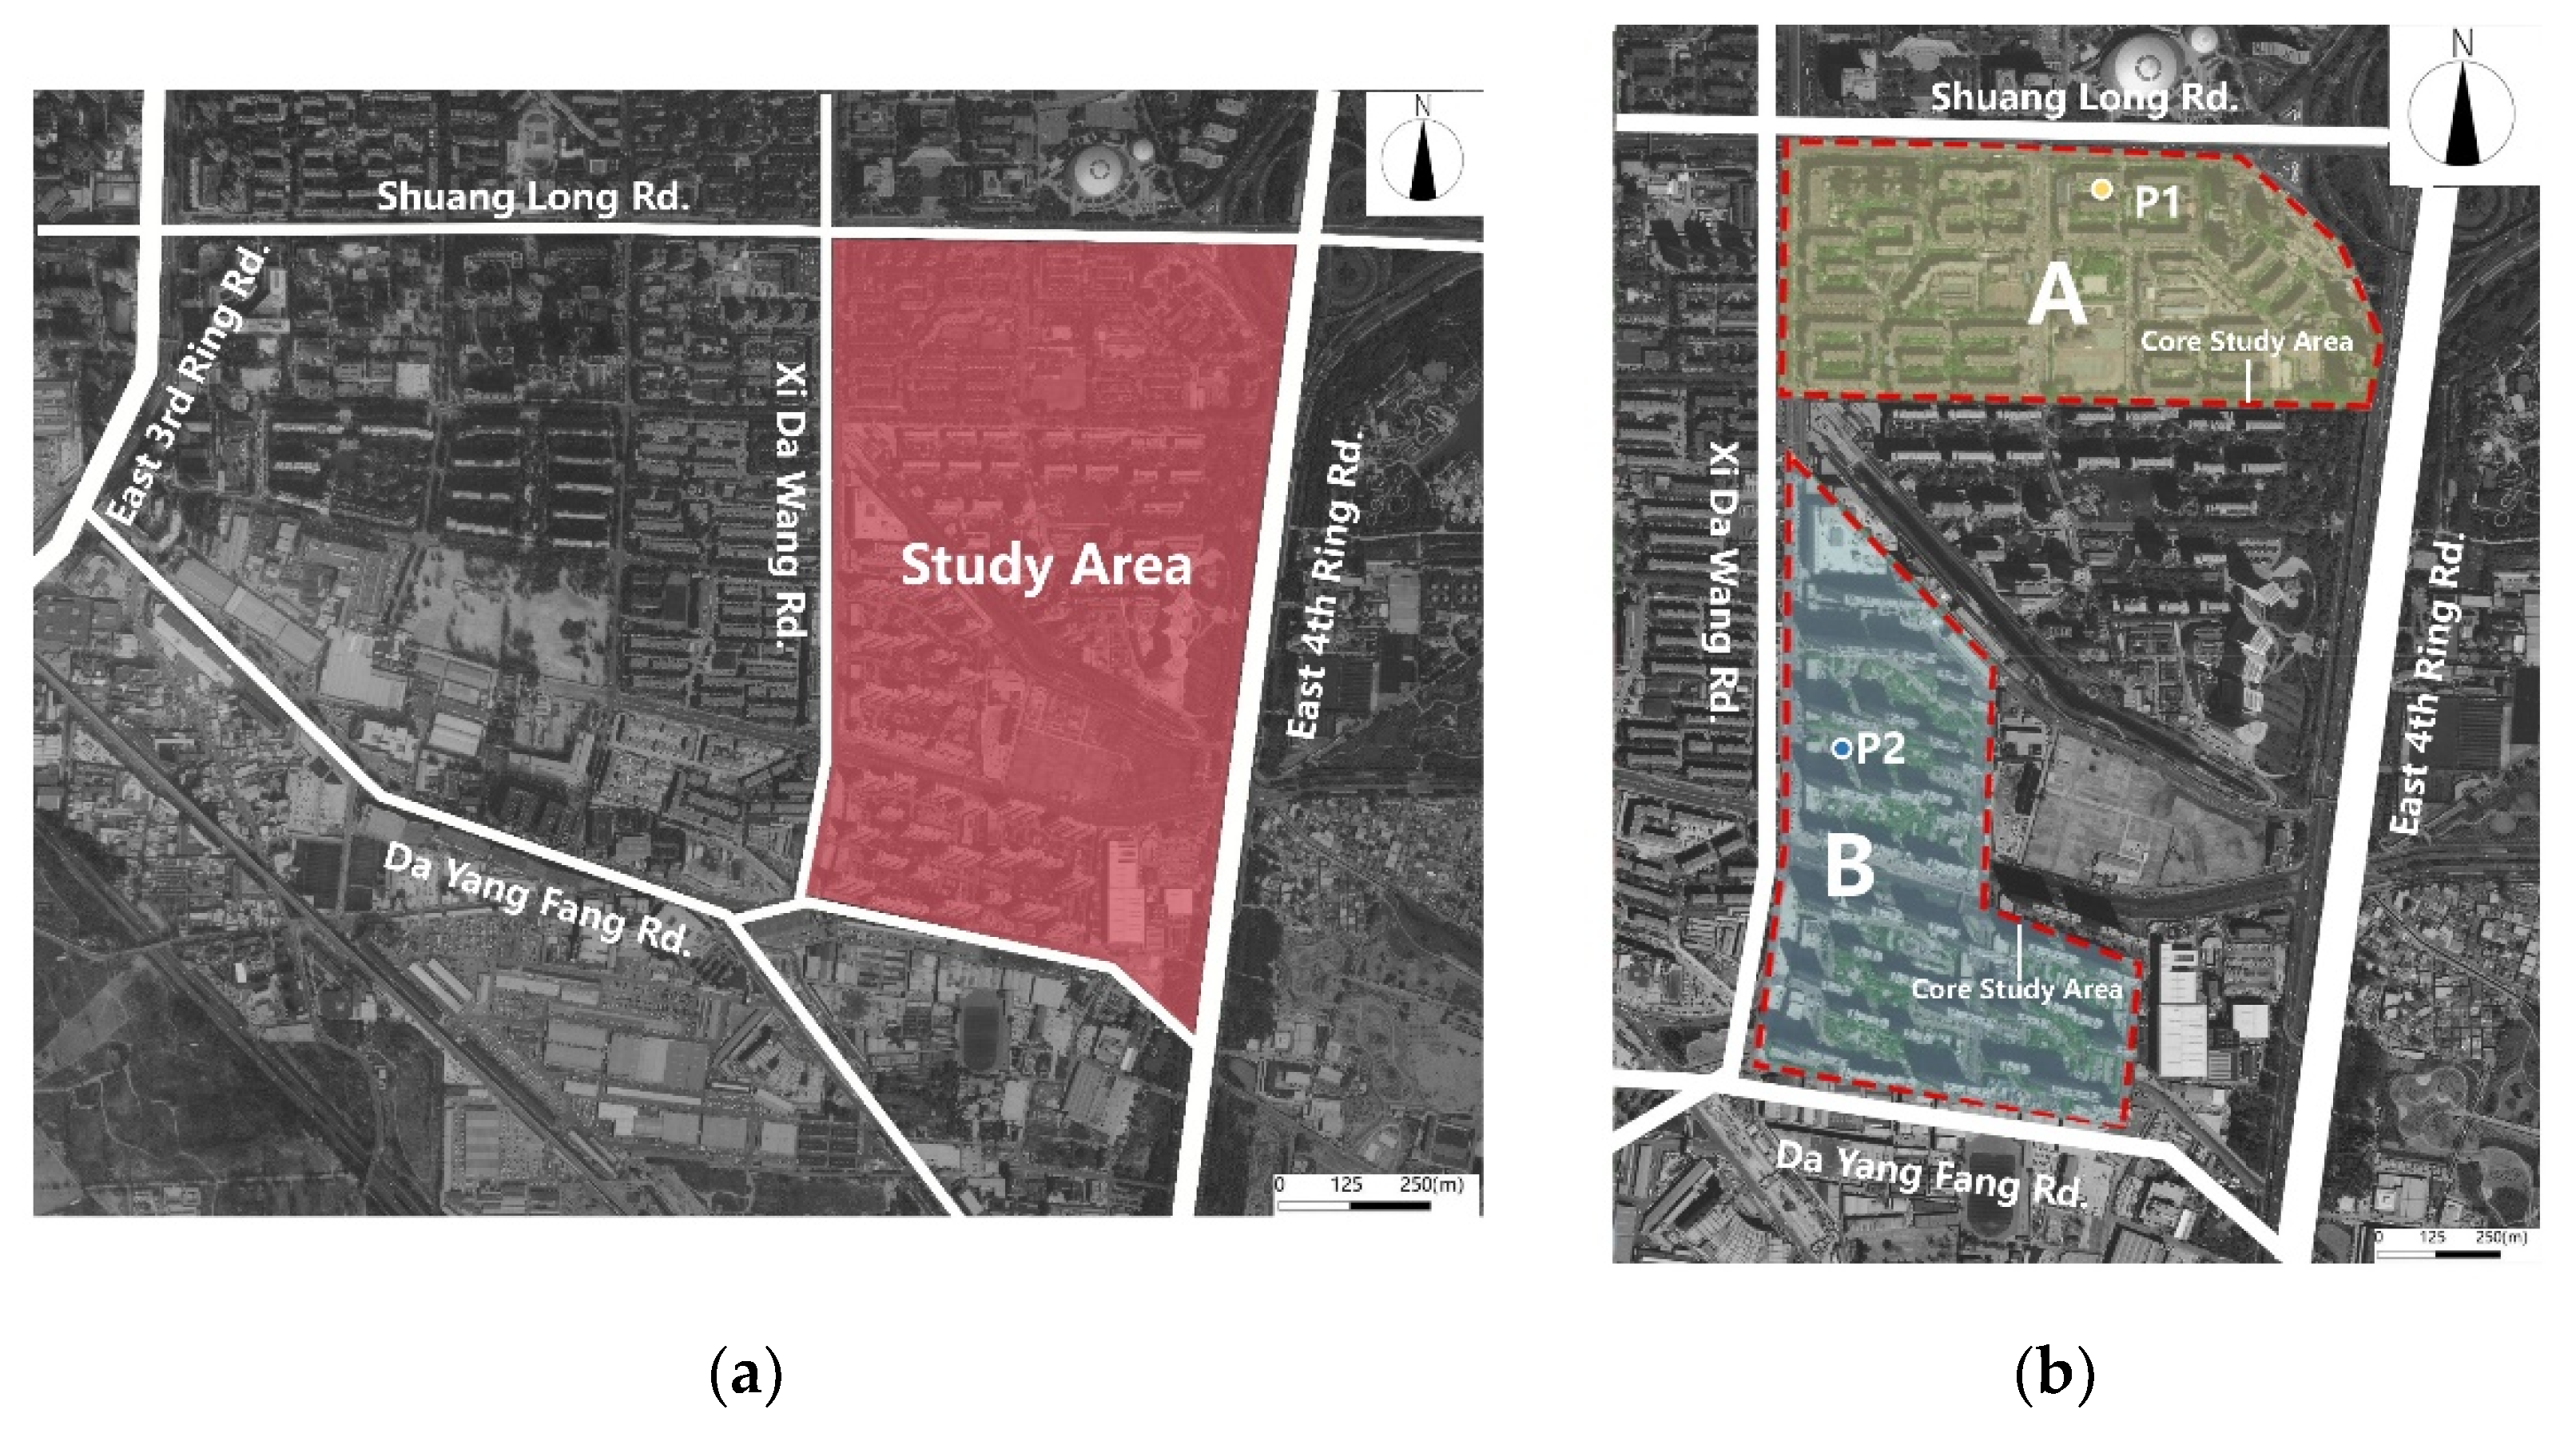
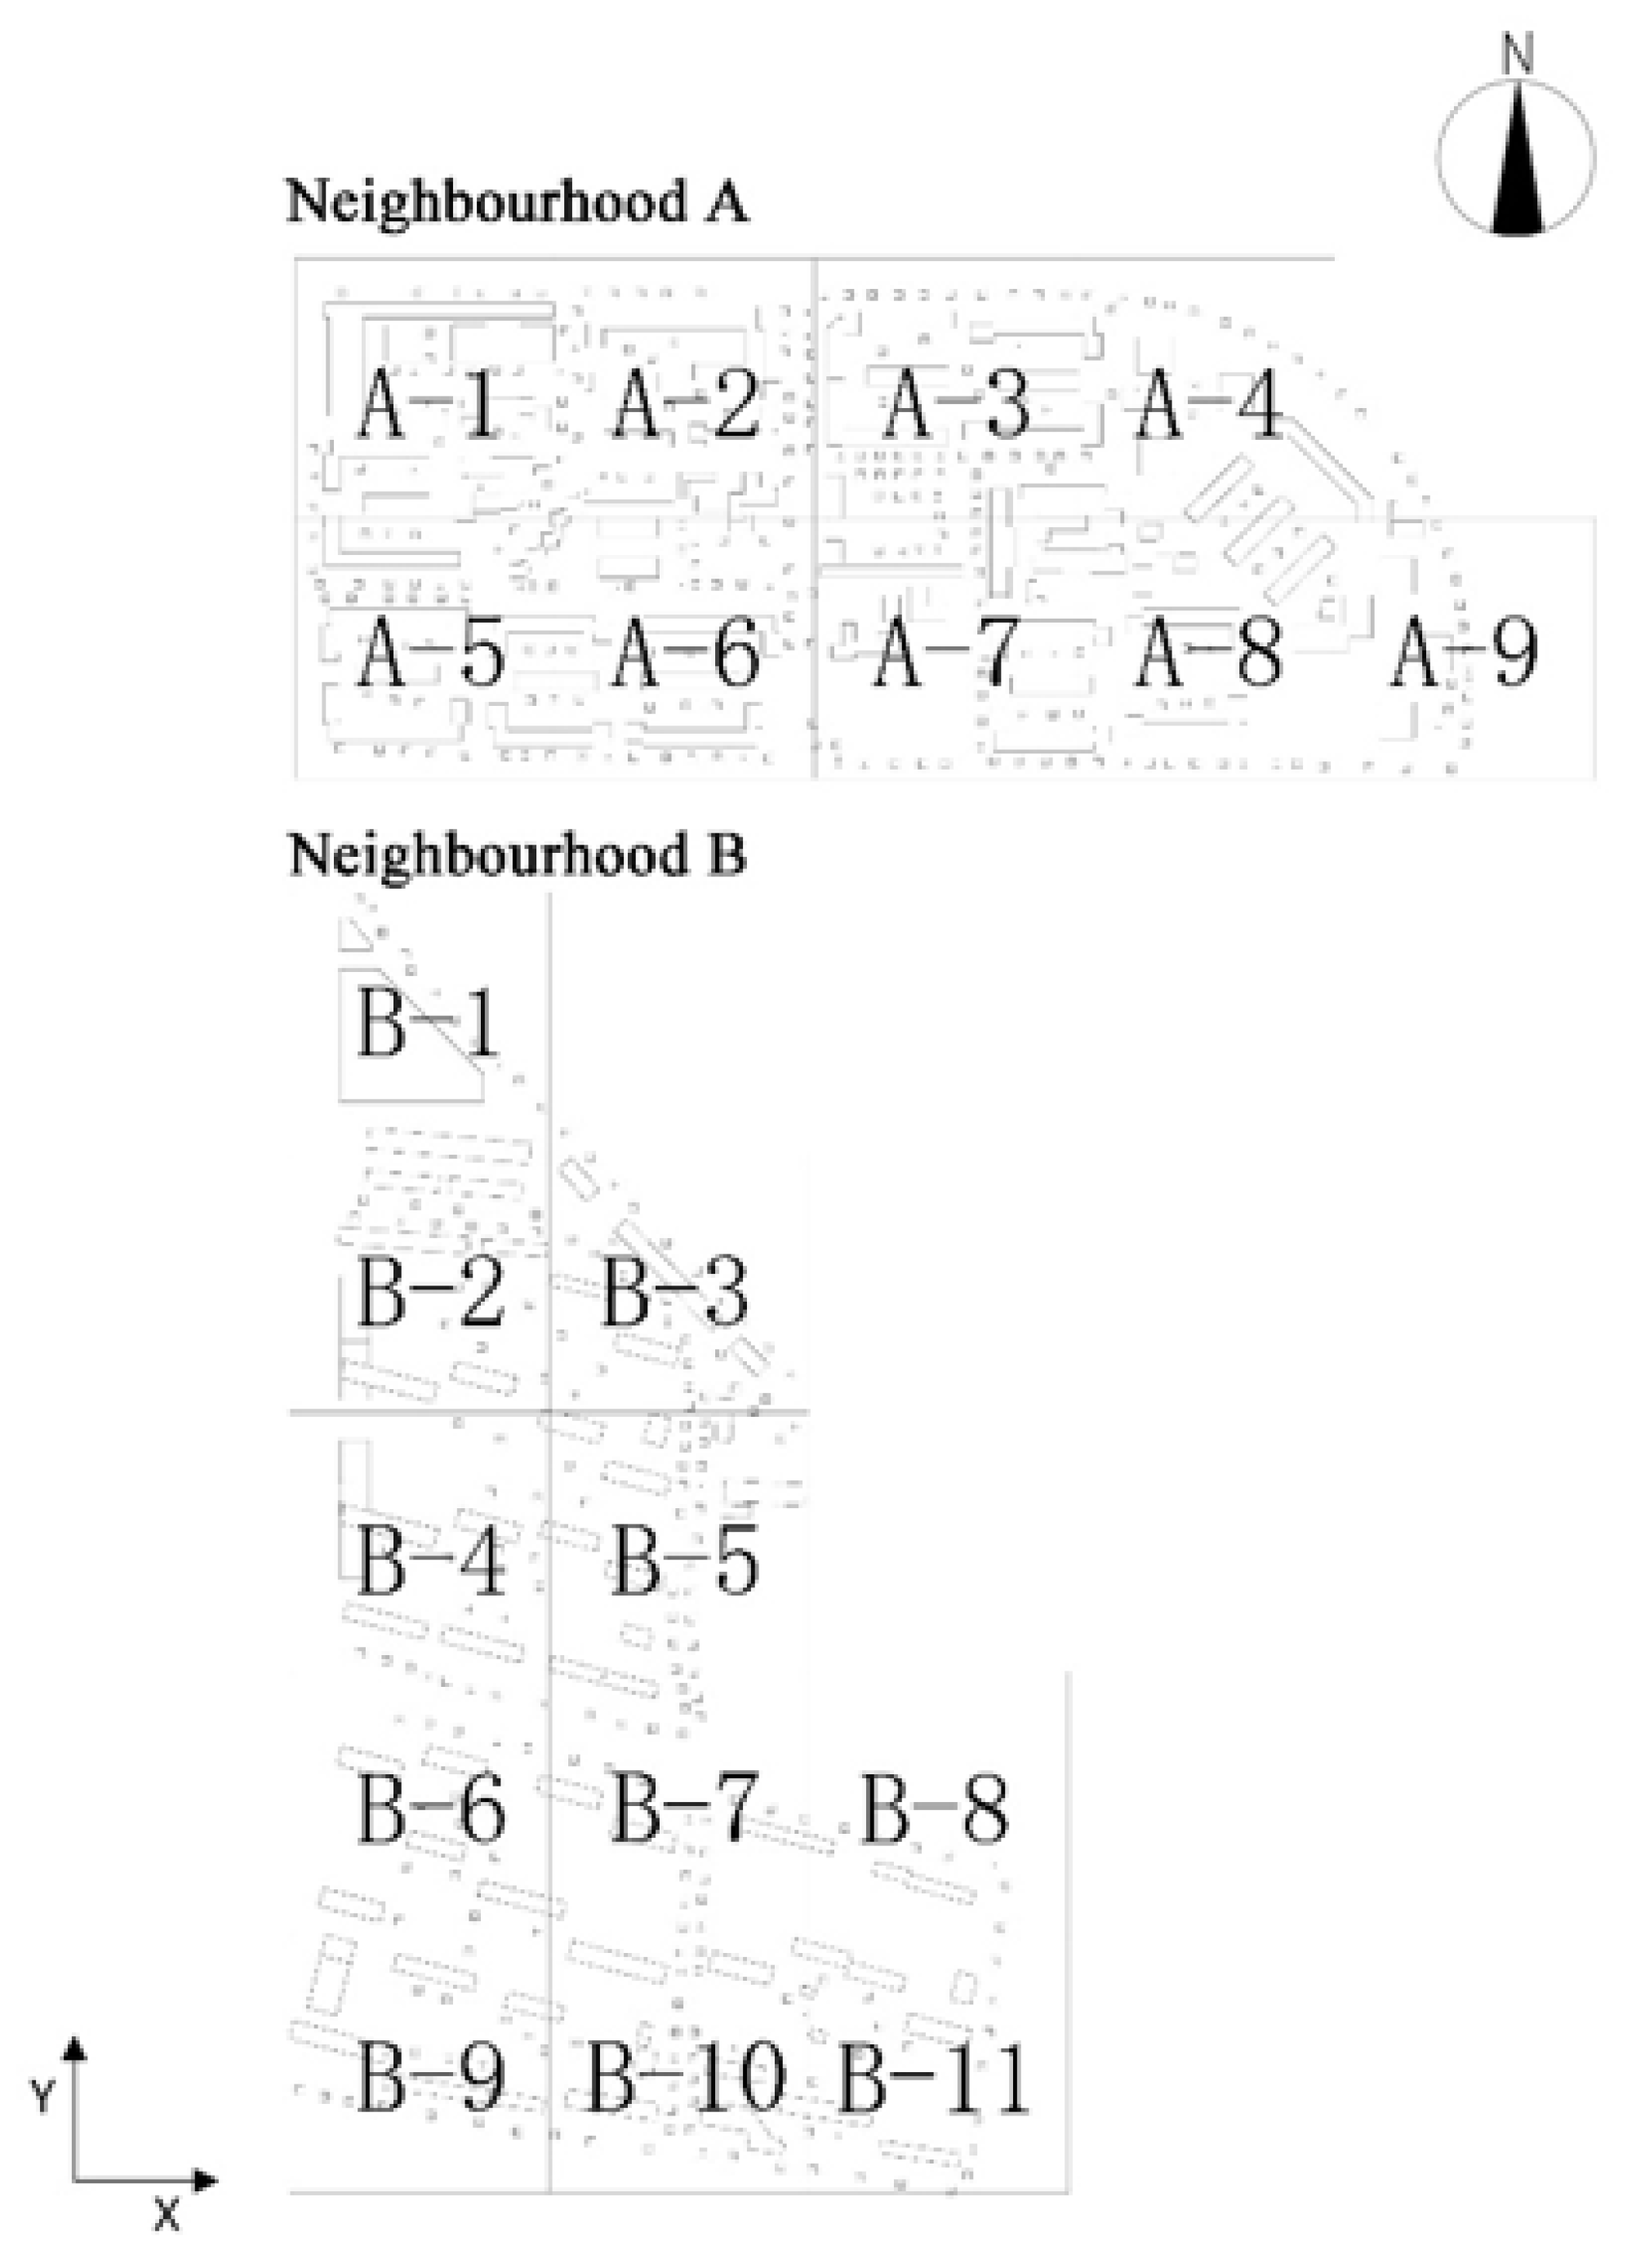
2.1. Study Area
2.2. Wind Environment and Pollutant Monitoring
2.3. “Pollutant-Wind Environment” Model Setting
2.3.1. Computational Domain and Grid Generation
2.3.2. Boundary Condition
- U—horizontal wind speed at height z(m), m/s
- U*—ground friction speed, m/s
- κ—Von·Karman constant, κ = 0.42
- z0—surface roughness, z0 = 0.25
- YPM2.5—Pollutant adsorption capacity per unit area (μg/m2)
- v—Adsorption rate (m/s)
- d—Pollutant concentration (μg/m3)
- LAD—leaf area density; (m2/m3)
- t—Adsorption time (s)
2.3.3. Solution Settings
2.4. Selection and Extraction of Urban Morphological Parameters
2.4.1. Selection of Urban Morphological Parameters
2.4.2. Extraction of Urban Morphological Parameters
2.5. Selection of Indicators for the Evaluation of “Pollutants–Wind Environment”
2.6. Statistic Analysis Model
3. Results
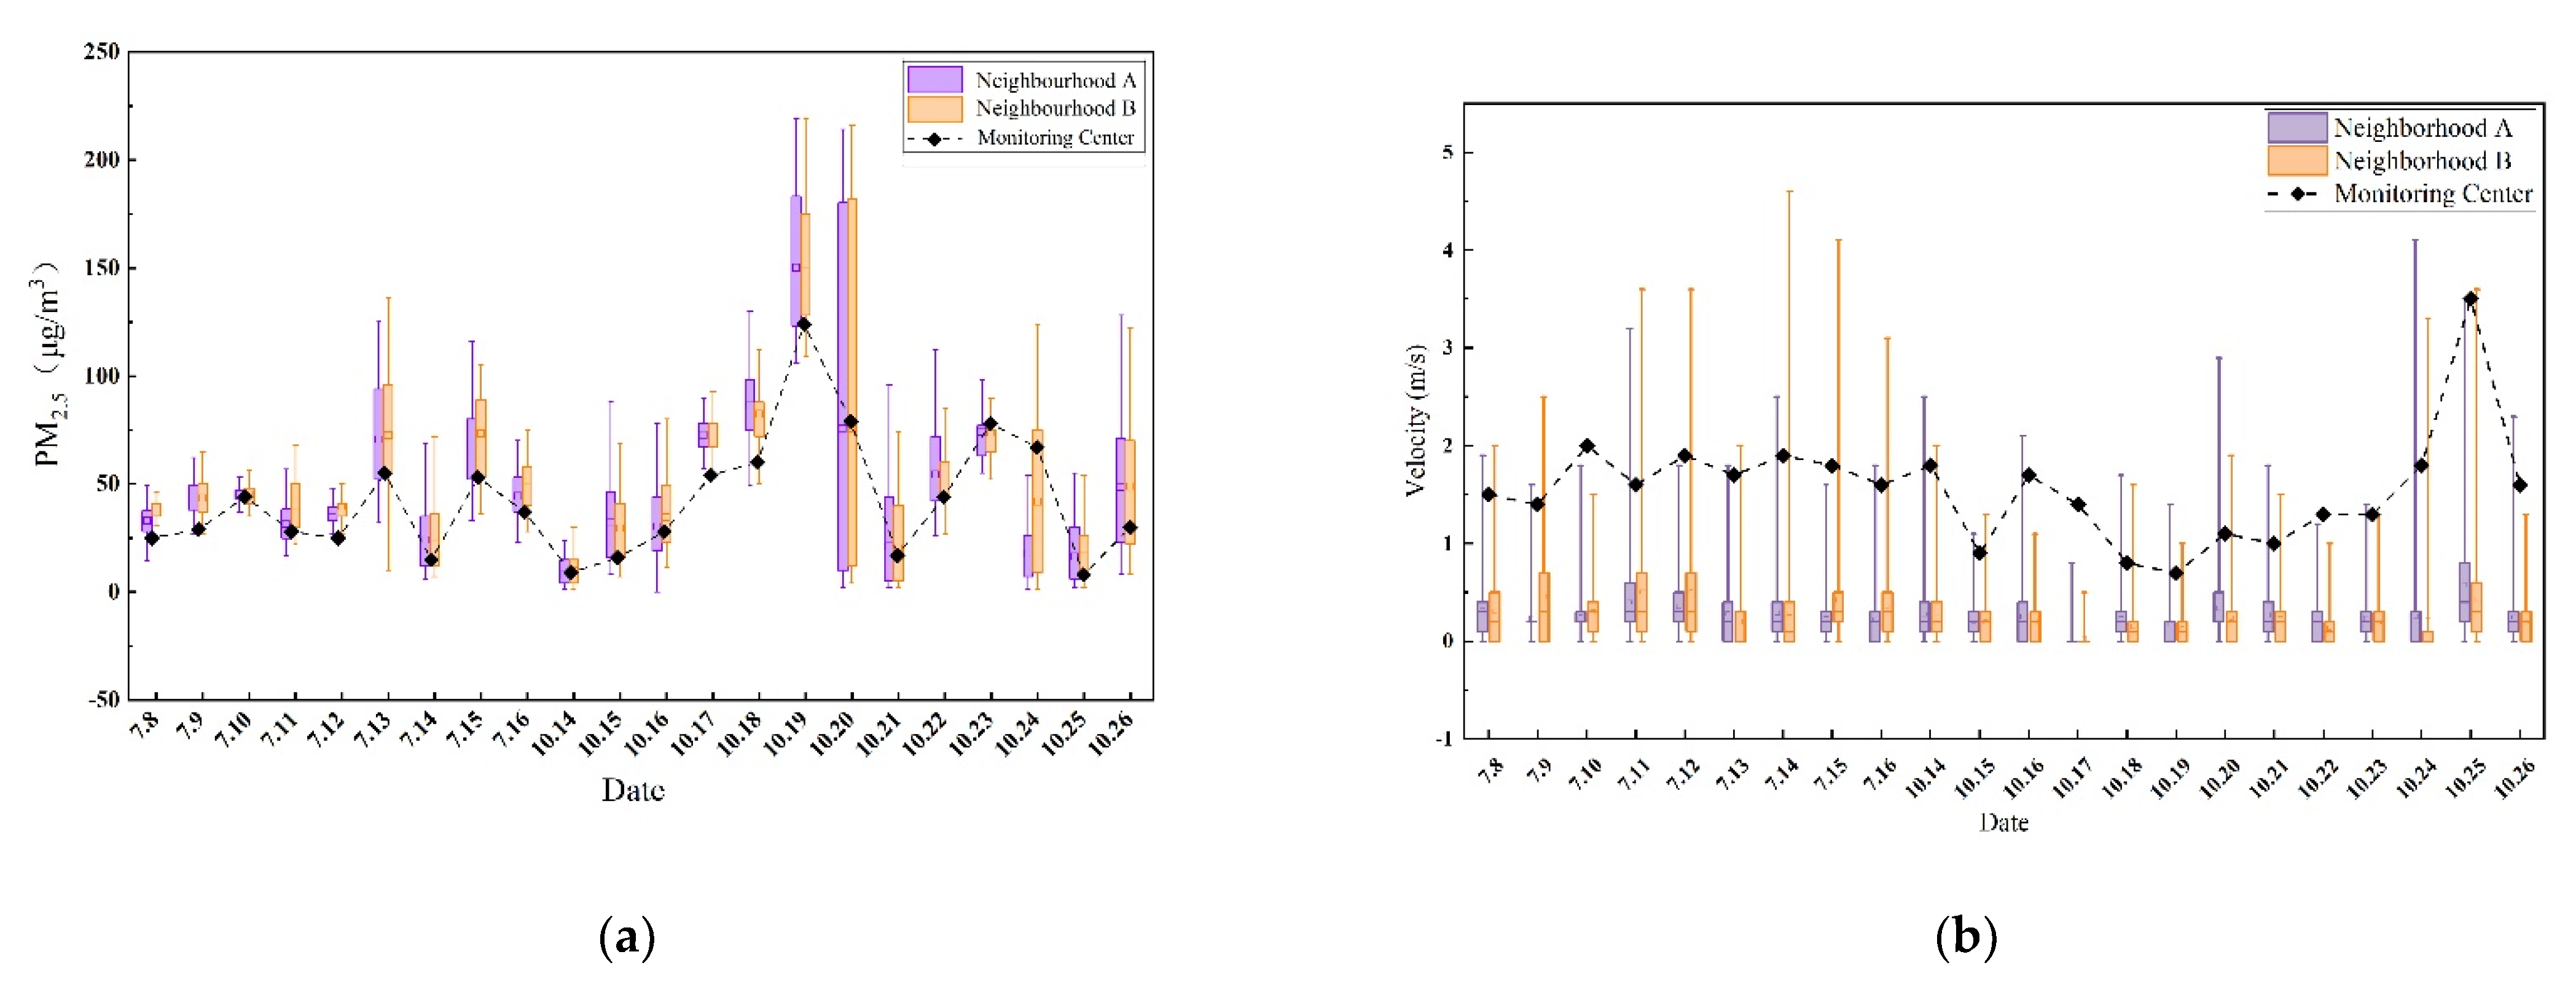
3.1. Monitoring Results
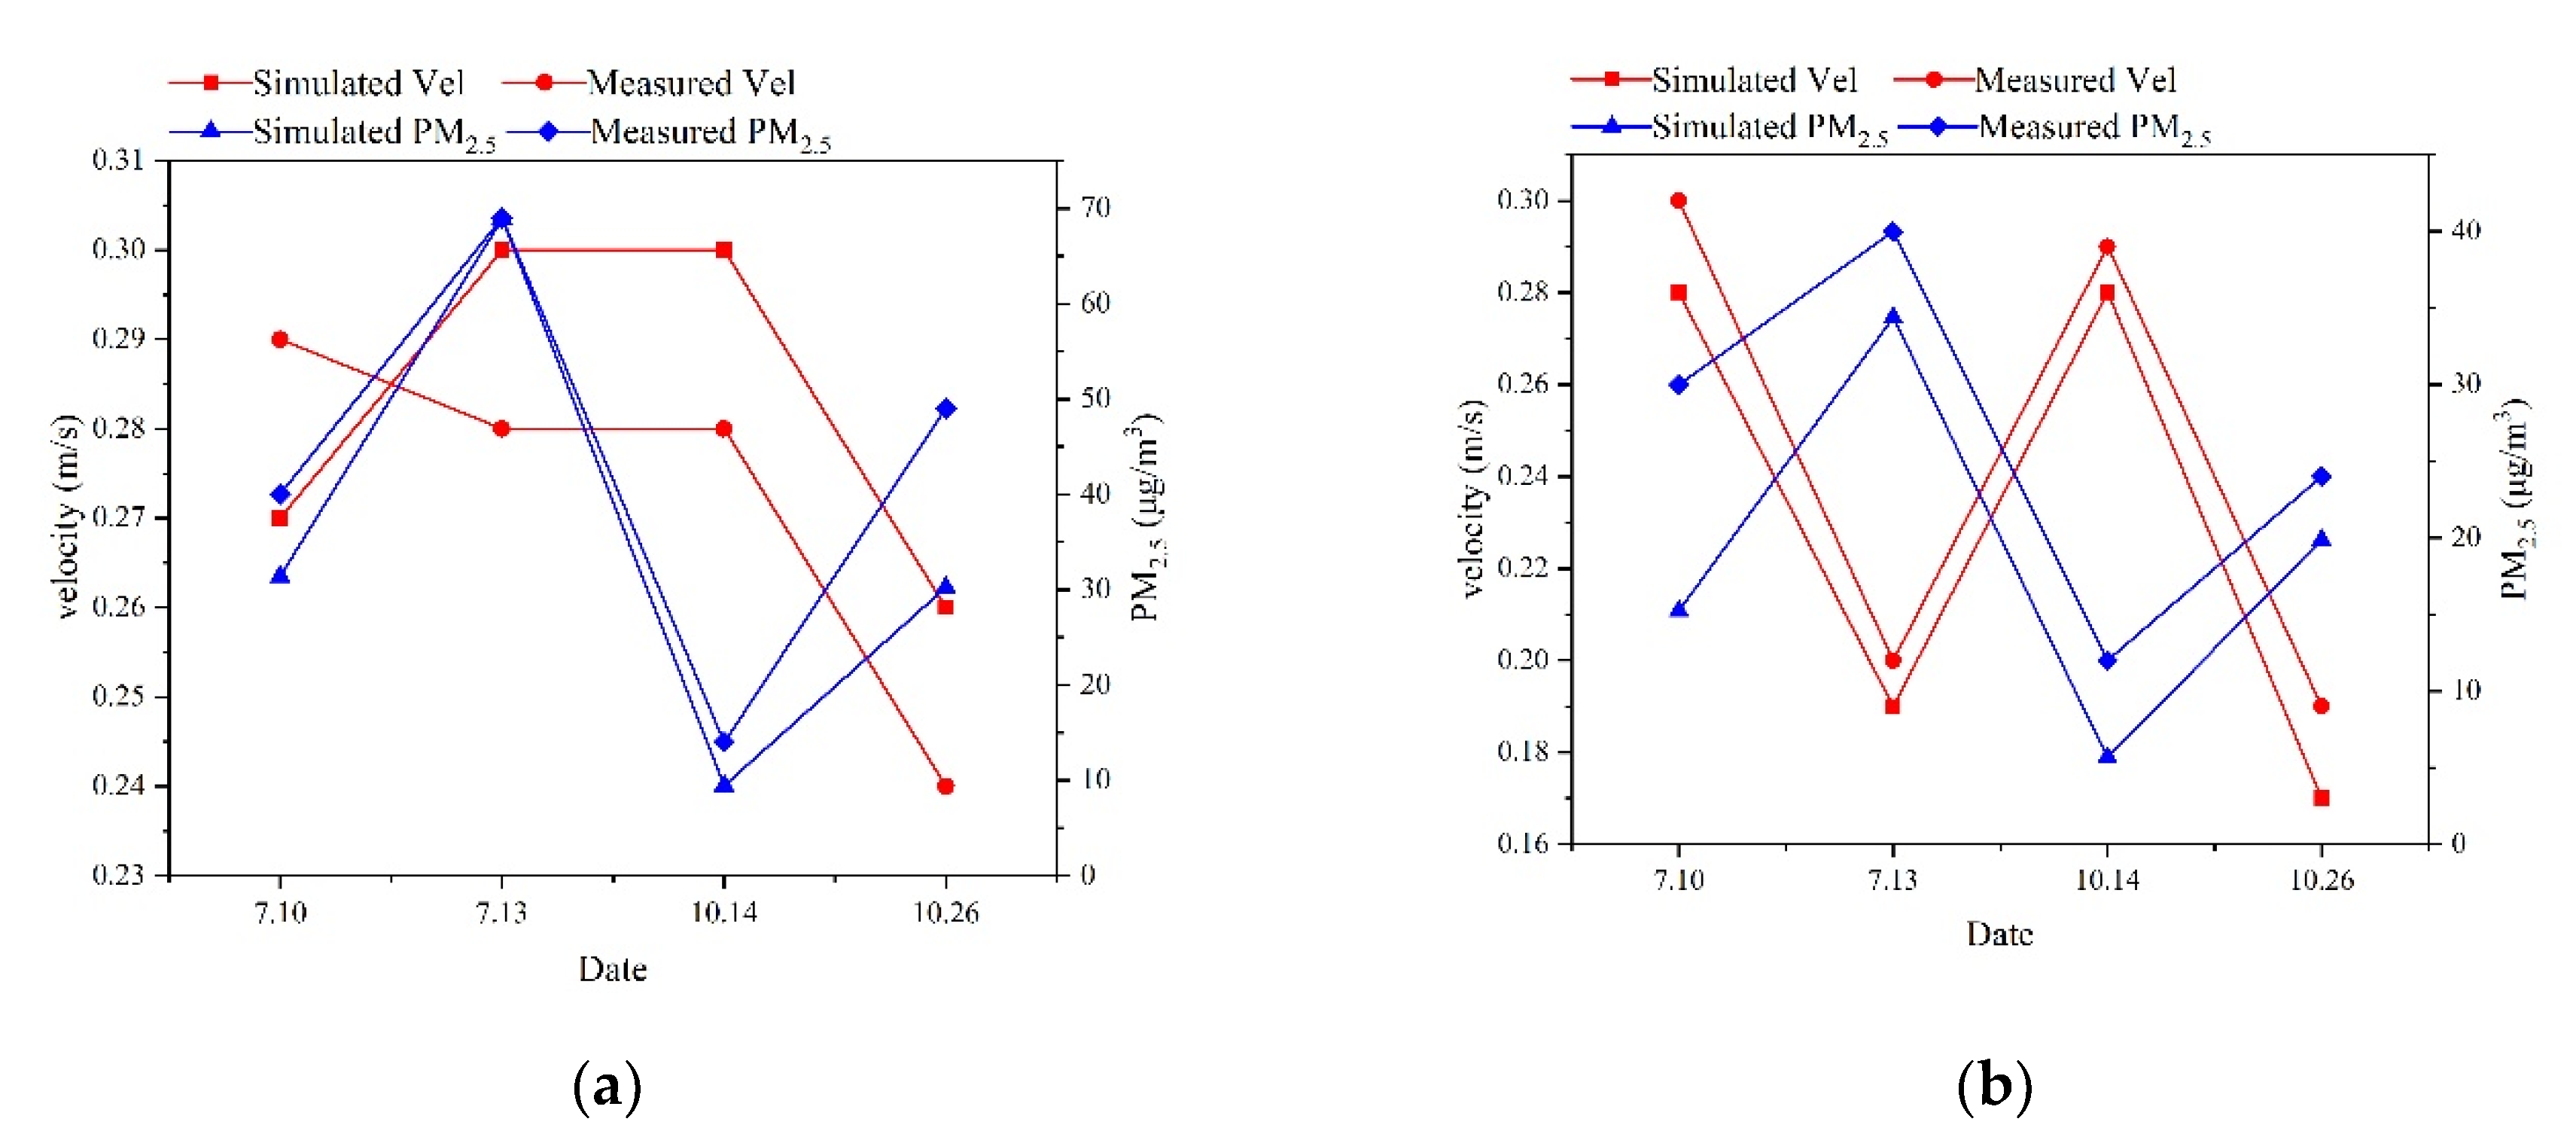
3.2. Simulation Results and Error Analysis
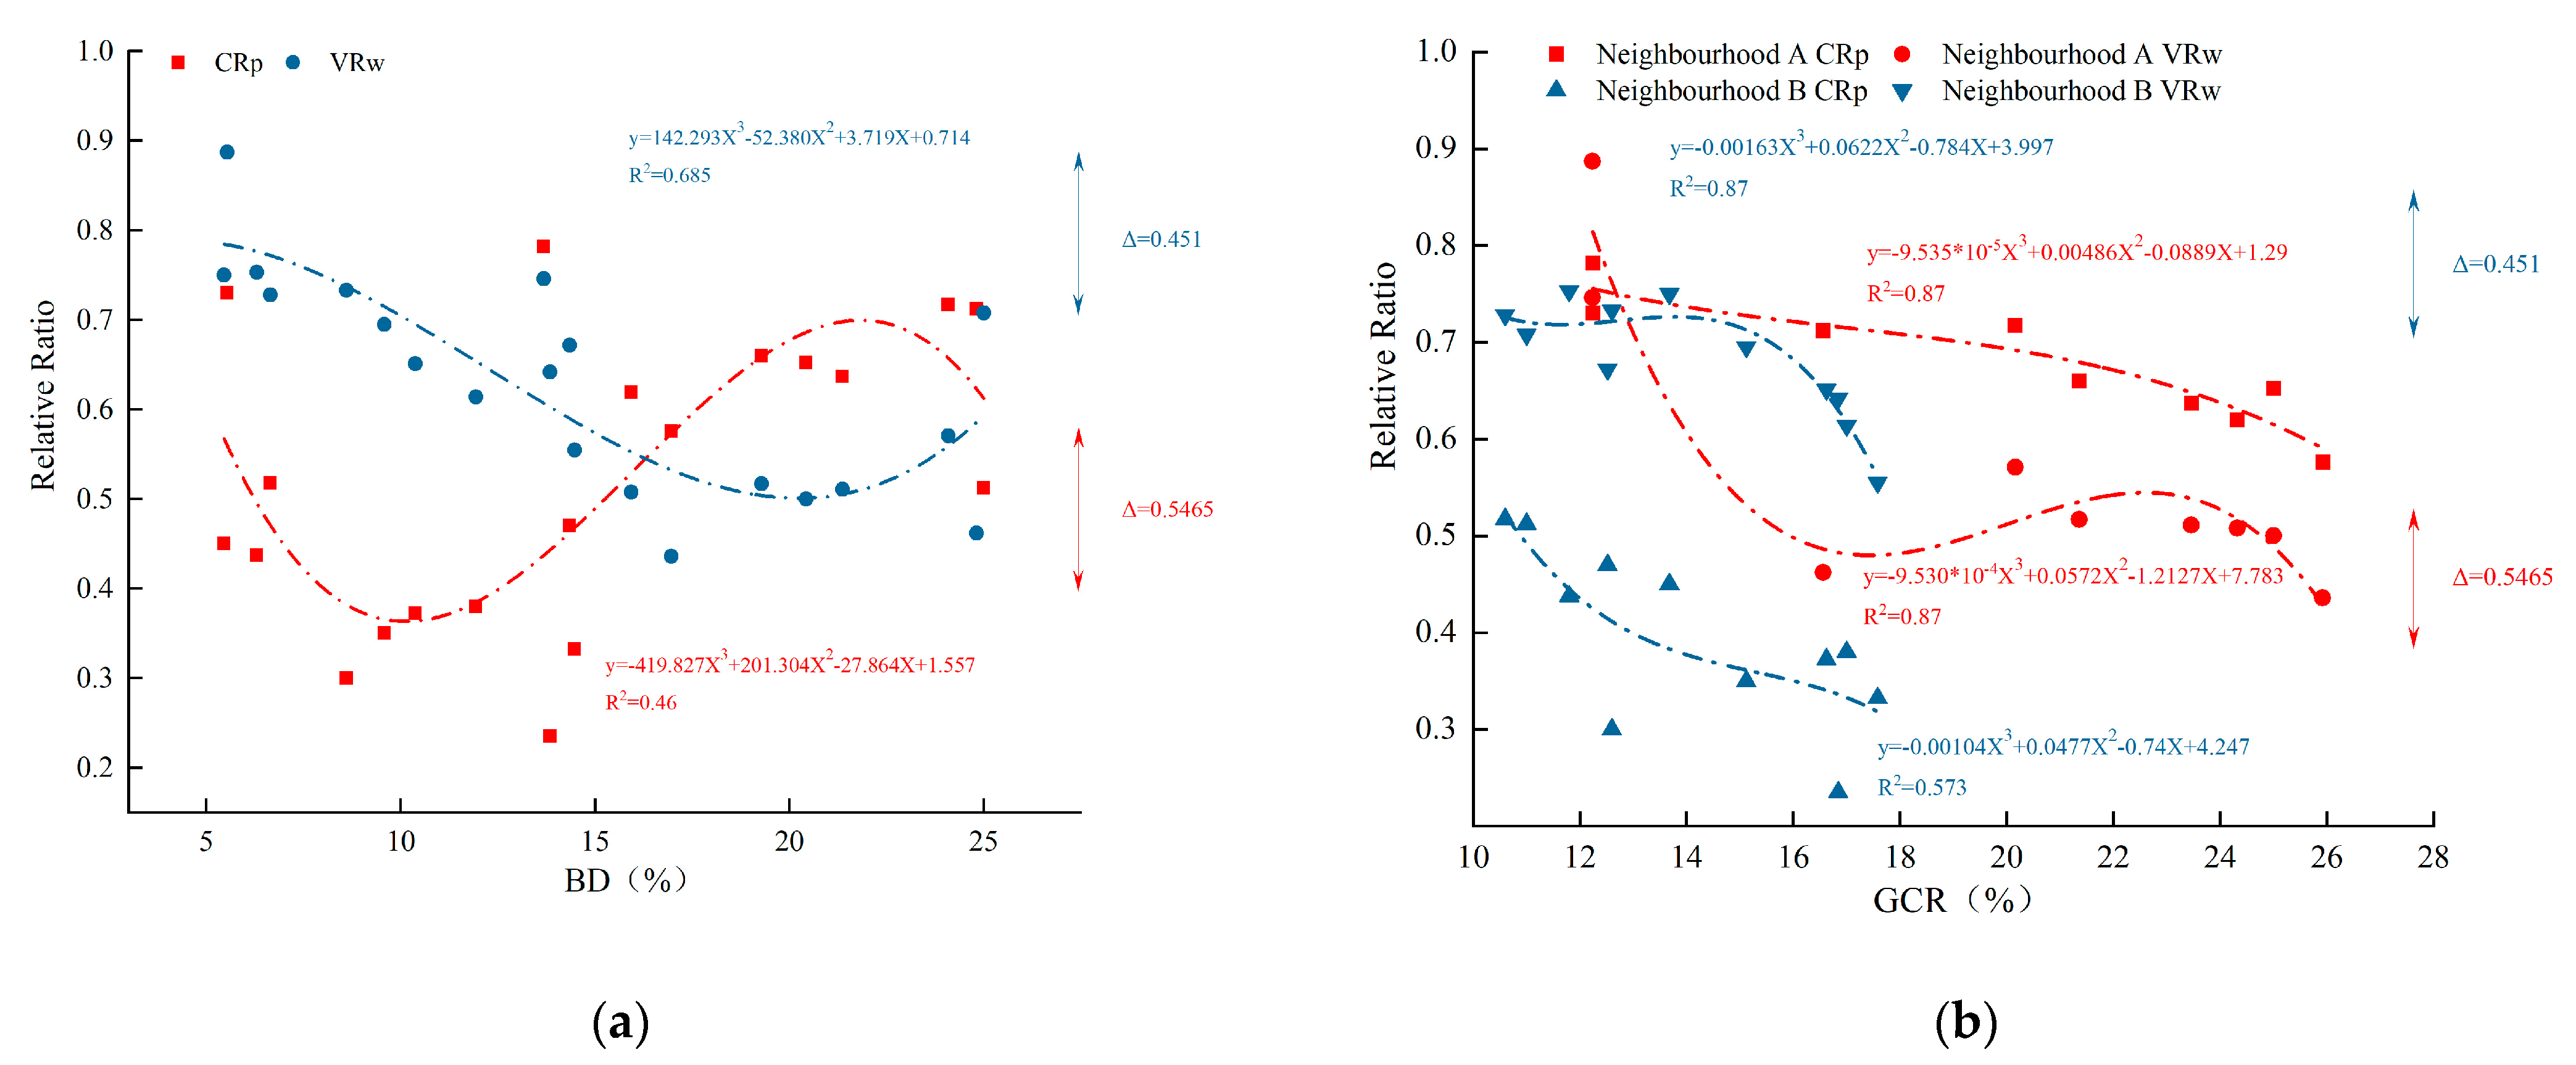
3.3. Sensitive Morphological Parameters Filtrating
4. Discussion
4.1. Trend Analysis of the Influence of SMPs
4.1.1. BD and BED
4.1.2. GCR
4.1.3. ABF, ABV and SDH
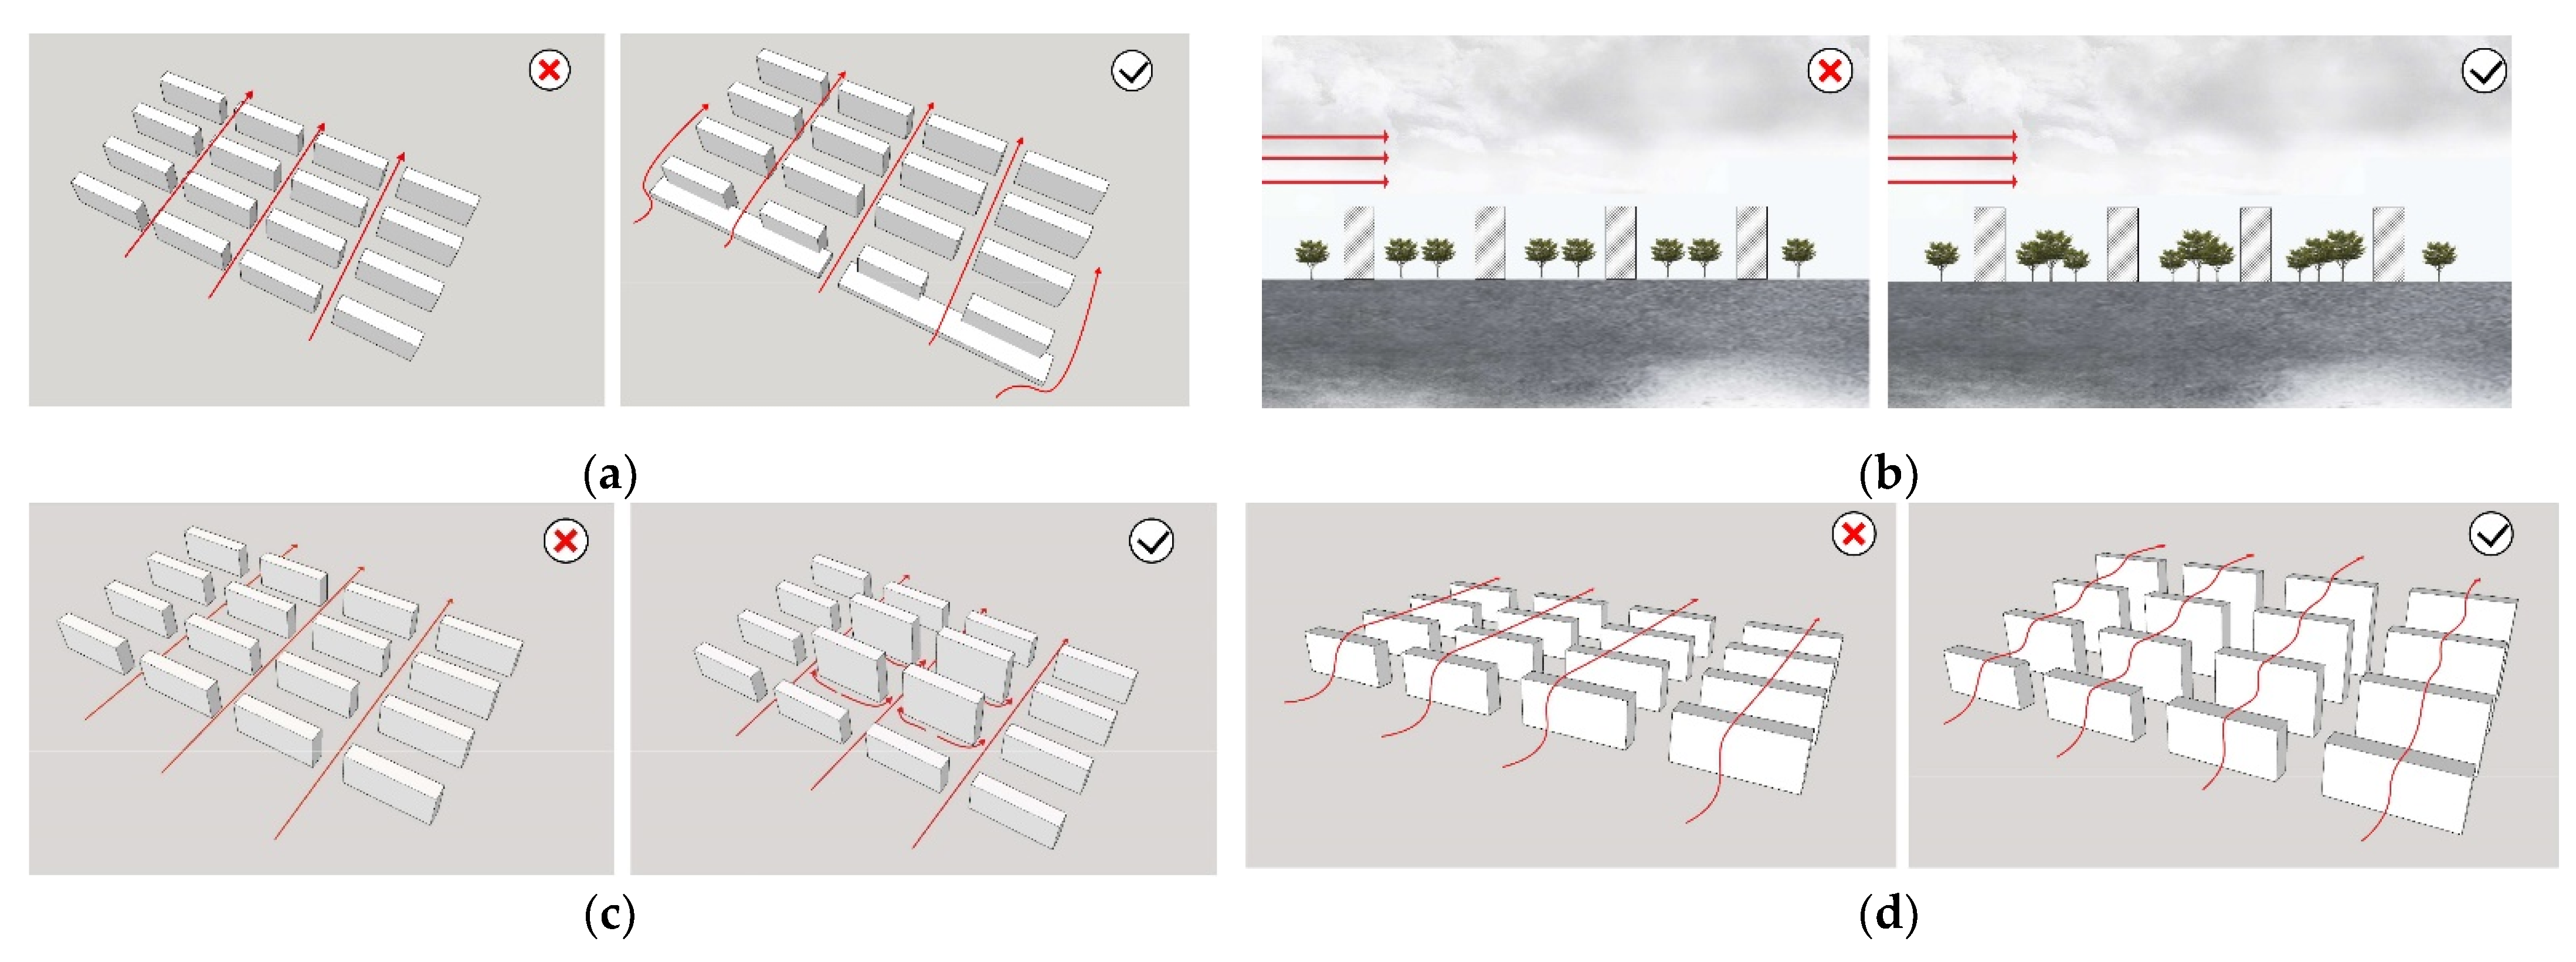
4.2. Morphology-Optimization Strategies for Pollutant Dispersion at Neighborhood-Scale
5. Conclusions
Supplementary Materials
Author Contributions
Funding
Institutional Review Board Statement
Informed Consent Statement
Data Availability Statement
Conflicts of Interest
References
- Beijing Ecological and Environmental Status Bulletin 2020; Beijing Municipal Bureau of Ecology and Environment: Beijing, China, 2020.
- Tao, Y.; Zhang, Z.; Ou, W. How does urban form influence PM2.5 concentrations: Insights from 350 different-sized cities in the rapidly urbanizing Yangtze River Delta region of China, 1998–2015. Cities 2020, 98, 102581. [Google Scholar] [CrossRef]
- McCarty, J.; Kaza, N. Urban form and air quality in the United States. Landsc. Urban Plan. 2015, 139, 168–179. [Google Scholar] [CrossRef]
- Ding, W.; Hu, Y.; Dou, P. Study on the correlation between urban form and urban microclimate. J. Archit. 2012, 7, 16–21. [Google Scholar]
- Chen, M.; Dai, F. PCA-Based Identification of Built Environment Factors Reducing PM2.5 Pollution in Neighborhoods of Five Chinese Megacities. Atmosphere 2022, 13, 115. [Google Scholar]
- Viecco, M.; Jorquera, H.; Sharma, A. Green roofs and green walls layouts for improved urban air quality by mitigating particulate matter. Build. Environ. 2021, 204, 108–120. [Google Scholar] [CrossRef]
- Wang, S.; Wang, J.; Fang, C. Estimating the impacts of urban form on CO2 emission efficiency in the Pearl River Delta, China. Cities 2019, 85, 117–129. [Google Scholar] [CrossRef]
- Moradpour, M.; Hosseini, V. An investigation into the effects of green space on air quality of an urban area using CFD modeling. Urban Clim. 2020, 34, 100686. [Google Scholar] [CrossRef]
- Lee, C. Impacts of multi-scale urban form on PM2.5 concentrations using continuous surface estimates with high-resolution in U.S. metropolitan areas. Landsc. Urban Plan. 2020, 204, 103935. [Google Scholar] [CrossRef]
- Hx, A.; Hong, C. Impact of urban morphology on the spatial and temporal distribution of PM2.5 concentration: A numerical simulation with WRF/CMAQ model in Wuhan, China. J. Environ. Manag. 2021, 290, 112427. [Google Scholar]
- Dai, F.; Chen, M.; Wang, M.; Zhu, S.; Fu, F. Effect of Urban Block Form on Reducing Particulate Matter: A Case Study of Wuhan. Chin. Landsc. Archit. 2020, 36, 109–114. [Google Scholar]
- Cao, Q.; Luan, Q.; Liu, Y. The effects of 2D and 3D building morphology on urban environments: A multi-scale analysis in the Beijing metropolitan region. Build. Environ. 2021, 192, 107635. [Google Scholar] [CrossRef]
- Silva, F.; Reis, N.C.; Santos, J.M. Influence of urban form on air quality: The combined effect of block typology and urban planning indices on city breathability. Sci. Total Environ. 2022, 814, 152670. [Google Scholar] [CrossRef]
- Chao, Y.; Ng, E.; Norford, L.K. Improving air quality in high-density cities by understanding the relationship between air pollutant dispersion and urban morphologies. Build. Environ. 2014, 71, 245–258. [Google Scholar]
- Opa, B.; Pm, A.; Cc, A. Impact of morphological parameters on urban ventilation in compact cities: The case of the Tuscolano-Don Bosco district in Rome. Sci. Total Environ. 2022, 807, 150490. [Google Scholar]
- Yan, L.; Hu, W.; Gu, L. Correlation analysis between air quality in squares and spatial design elements: A case study on six design schemes of Urumqi diamond city square. Urban Plan. 2020, 44, 61–70. [Google Scholar]
- Hassan, A.M.; ELMokadem, A.A.; Megahed, N.A.; Eleinen, O.M.A. Urban morphology as a passive strategy in promoting outdoor air quality. J. Build. Eng. 2020, 29, 101204. [Google Scholar] [CrossRef]
- Li, Q.; Cai, X.; Kang, L. CFD simulations of flow and dispersion under construction disturbance conditions. Res. Environ. Sci. 2013, 26, 829–837. [Google Scholar]
- Wang, J.; Mu, Y. Study on spatial strategy responding to automobile exhaust pollution in urban street cantons. Urban Plan. 2013, 37, 54–60. [Google Scholar]
- Li, S.; Shi, T.; Zhou, S.; Gong, J.; Zhu, L.; Zhou, Y. Diffusion effects of atmospheric pollutants on the three dimensional landscape pattern of urban block. J. Shenyang Jianzhu Univ. Nat. Sci. 2016, 32, 1111–1121. [Google Scholar]
- Franke, J.; Hellsten, A.; Schlunzen, K.H. The COST 732 Best Practice Guideline for CFD simulation of flows in the urban environment: A summary. Int. J. Environ. Pollut. 2011, 44, 419–427. [Google Scholar] [CrossRef]
- Richards, P.J.; Norris, S.E. Appropriate boundary conditions for computational wind engineering models revisited. J. Wind Eng. Ind. Aerodyn. 2011, 99, 257–266. [Google Scholar] [CrossRef]
- Jiang, Z.; Cheng, H.; Zhang, P.; Kang, T. Influence of urban morphological parameters on the distribution and diffusion of air pollutants: A case study in China. J. Environ. Sci. 2021, 105, 163–172. [Google Scholar] [CrossRef] [PubMed]
- Li, L.; Li, X.; Lin, B.; Zhu, Y. Simulation of canopy flows using k-ε two-equation turbulence model with source/sink terms. J. Qing Hua Univ. Nat. Sci. 2006, 4, 753–756. [Google Scholar]
- Liu, W.; Yu, Z. Simulation on PM2.5 detention service of green space in Haidian District, Beijing, China. Chin. J. Appl. Ecol. 2016, 27, 2580–2586. [Google Scholar]
- Zhang, S.; Han, L.; Zhou, W.; Li, W. Impact of urban population on concentrations of nitrogen dioxide (NO2) and fine particles (PM2.5) in China. Acta Ecol. Sin. 2016, 36, 5049–5057. [Google Scholar]
- Gao, Y.; Wang, Z.; Liu, C.; Peng, Z. Assessing neighborhood air pollution exposure and its relationship with the urban form. Build. Environ. 2019, 155, 15–24. [Google Scholar] [CrossRef]
- Wang, Y.; Akbari, H. A simulation study of the effects of street tree planting on Urban Heat Island mitigation in Montreal. In Proceedings of the 21st Canadian Connective Tissue Conference 2015, Quebec, QC, Canada, 28–30 May 2015. [Google Scholar]
- Dai, F.; Deng, Y.; Chen, M.; Guo, X. Effects of Green Space Layout on PM2.5 in Different Types of Residential Areas Based on ENVI-met Simulation. Landsc. Archit. 2021, 28, 70–76. [Google Scholar]
- Yang, J.; Shi, B.; Shi, Y. Air pollution dispersal in high-density urban areas: Research on the triadic relation of wind, air pollution, and urban form. Sustain. Cities Soc. 2019, 54, 101941. [Google Scholar] [CrossRef]
- Aldegunde, J.A.Á.; Sánchez, A.F.; Saba, M.; Bolaños, E.Q.; Palenque, J.Ú. Analysis of PM2.5 and Meteorological Variables Using Enhanced Geospatial Techniques in Developing Countries: A Case Study of Cartagena de Indias City (Colombia). Atmosphere 2022, 13, 506. [Google Scholar] [CrossRef]
- Adolphe, L. A simplified model of urban morphology: Application to an analysis of the environmental performance of cities. Environ. Plan. B Plan. Des. 2001, 28, 183–200. [Google Scholar] [CrossRef]
- Yang, J.; Zhang, T.; Fu, X. Couping Mechianism between Wind Environment and Space form and Optimization Design in City Center, 1st ed.; Southeast University Press: Nanjing, China, 2016; pp. 126–151. [Google Scholar]
- Cheng, H.; Jiang, Z.; Zhang, P.; Kang, T. The influence of urban form parameters on the diffusion of air pollutant in residential area based on the CFD simulation. J. Beijing Univ. Technol. 2021, 47, 1377–1387. [Google Scholar]
- Zhuang, Y.; Lu, J.; Chen, J. Exploring the “Morphological Structure” in contemporary urban design practices. Archit. J. 2021, 5, 91–98. [Google Scholar]


| Date | Wind Direction | Wind Speed (m/s) | PM2.5 (μg/m3) | Temperature (°C) |
|---|---|---|---|---|
| 7.10 | E | 2.0 | 44 | 24.6 |
| 7.13 | SE | 1.7 | 55 | 28.6 |
| 10.14 | N | 1.8 | 9 | 9.2 |
| 10.26 | NW | 1.6 | 30 | 8.8 |
| Morphological Characteristics | Morphological Parameters | Calculation Method |
|---|---|---|
| Size Characteristics | Total building area, TBA | Si—Building single-story area Fi— buildings Floors |
| Floor area ratio, FAR | SA—Neighborhoods area | |
| Functional Characteristics | Greenbelt coverage rate, GCR | TGA—Area of horizontal vegetation projection |
| Density Characteristics | Building density, BD | BBA—Building footprint |
| Structural Characteristics | Block envelope degree, BED | TBP—Building envelope perimeter TSP—Neighborhood perimeter |
| Space openness, SO | ||
| Shape Characteristics | Average building volume, ABV | Vi—Building volume |
| Average building floors, ABF | ||
| The standard deviation of building height, SDH | —Average building height | |
| Immaterial Characteristics | Population density, PD | TP—Neighborhoods population |
| Comparing Criteria | Paired Differences | t | sig. (2-Tailed) | ||||
|---|---|---|---|---|---|---|---|
| Means | Std. Deviation | Std. Error Mean | 95% Confidence Interval of the Difference | ||||
| Lower | Upper | ||||||
| Velocity | 0.00875 | 0.026424 | 0.009342 | −0.013341 | 0.030841 | 0.937 | 0.380 |
| PM2.5 | 8.27500 | 13.066615 | 4.619746 | −2.648964 | 19.198964 | 1.79 | 0.116 |
| Analysis of Variables | ||||
|---|---|---|---|---|
| R | P | R | P | |
| TBA | −0.246 | 0.325 | 0.114 | 0.268 |
| FAR | −0.246 | 0.325 | 0.114 | 0.268 |
| BD | 0.443 | 0.025 | −0.709 ** | 0.000 |
| SO | 0.221 | 0.379 | −0.217 | 0.388 |
| BED | 0.401 | 0.035 | −0.636 ** | 0.001 |
| ABV | −0.564 ** | 0.005 | 0.505 * | 0.012 |
| ABF | −0.628 ** | 0.002 | 0.684 ** | 0.000 |
| SDH | −0.612 ** | 0.001 | 0.573 ** | 0.004 |
| GCR (A) | −0.912 ** | 0.001 | −0.818 ** | 0.007 |
| GCR (B) | −0.726 ** | 0.001 | −0.810 ** | 0.003 |
| PD | 0.162 | 0.520 | −0.128 | 0.296 |
Publisher’s Note: MDPI stays neutral with regard to jurisdictional claims in published maps and institutional affiliations. |
© 2022 by the authors. Licensee MDPI, Basel, Switzerland. This article is an open access article distributed under the terms and conditions of the Creative Commons Attribution (CC BY) license (https://creativecommons.org/licenses/by/4.0/).
Share and Cite
Zhang, P.; Cheng, H.; Jiang, Z.; Xiang, F. How Sensitive Morphological Parameters Influence on the PM2.5 Diffusion: An Empirical Study of Two Neighborhoods in Central Beijing. Atmosphere 2022, 13, 921. https://doi.org/10.3390/atmos13060921
Zhang P, Cheng H, Jiang Z, Xiang F. How Sensitive Morphological Parameters Influence on the PM2.5 Diffusion: An Empirical Study of Two Neighborhoods in Central Beijing. Atmosphere. 2022; 13(6):921. https://doi.org/10.3390/atmos13060921
Chicago/Turabian StyleZhang, Peihao, Haomiao Cheng, Zhiwen Jiang, and Fanding Xiang. 2022. "How Sensitive Morphological Parameters Influence on the PM2.5 Diffusion: An Empirical Study of Two Neighborhoods in Central Beijing" Atmosphere 13, no. 6: 921. https://doi.org/10.3390/atmos13060921