Article

The Effect of Metro Construction on the Air Quality in the Railway Transport System of Sydney, Australia

by
Puchanee Larpruenrudee
1,
Nic C. Surawski
2 and
Mohammad S. Islam
1,*
1
School of Mechanical and Mechatronic Engineering, University of Technology Sydney (UTS), 15 Broadway, Ultimo, NSW 2007, Australia
2
Centre for Green Technology, School of Civil and Environmental Engineering, University of Technology Sydney (UTS), 15 Broadway, Ultimo, NSW 2007, Australia
*
Author to whom correspondence should be addressed.
Atmosphere 2022, 13(5), 759; https://doi.org/10.3390/atmos13050759
Submission received: 20 March 2022 / Revised: 3 May 2022 / Accepted: 5 May 2022 / Published: 8 May 2022
(This article belongs to the Special Issue Heat Wave, Bush Fire and Air-Quality: Impacts on Respiratory Health)

Abstract

:
Sydney Metro is the biggest project of Australia’s public transport, which was designed to provide passengers with more trains and faster services. This project was first implemented in 2017 and is planned to be completed in 2024. As presented, the project is currently in the construction stage located on the ground stations of the Sydney Trains Bankstown line (T3). Based on this stage, several construction activities will generate air pollutants, which will affect the air quality around construction areas. Moreover, it might cause health problems to people around there and also the passengers who usually take the train on the T3 line. However, there is no specific data for air quality inside the train that may be affected by the construction from each area. Therefore, the aim of this study is to investigate the air quality inside the train carriage of all related stations from the T3 line. A sampling campaign was conducted over 3 months to analyze particulate matter (PM) concentration, the main indoor pollutants including formaldehyde (HCHO) and total volatile organic compounds (TVOC). The results of the T3 line were analyzed and compared to Airport & South line (T8) that were not affected by the project’s construction. The results of this study indicate that Sydney Metro construction activities insignificantly affected the air quality inside the train. Average PM2.5 and PM10 inside the train of T3 line in the daytime were slightly higher than in the nighttime. The differences in PM2.5 and PM10 concentrations from these periods were around 6.8 μg/m3 and 12.1 μg/m3, respectively. The PM concentrations inside the train from the T3 line were slightly higher than the T8 line. However, these concentrations were still lower than those recommended by the national air quality standards. For HCHO and TVOC, the average HCHO and TVOC concentrations were less than the recommendation criteria.

1. Introduction

Air pollution is a major public concern because of its effects on human health. The composition of the Earth’s atmosphere has changed due to the complete and incomplete combustion of fossil fuels. Several factors have been used to determine the level of pollutant concentrations, including the difference in chemical compositions, reaction properties, emission, persistence in the environment, and ability to be transported in long and short distances. From these factors, air pollutants can be classified into four categories, including gaseous pollutants, persistent organic pollutants, heavy metals, and particulate matter [1]. The combustion of fossil fuels is the primary source of gaseous pollutants (such as volatile organic compounds, CO, and NOx) which mainly contribute to the composition variations of the atmosphere and affect respiratory health [2]. Heavy metals, including basic metal elements such as lead, mercury, and manganese, are natural components of the Earth’s crust. These heavy metals can enter the environment through various sources, including combustion and manufacturing facilities. Although having a small amount of these metals is essential to maintain normal metabolic reactions, high concentrations of these metals are dangerous to human bodies [3]. Particulate Matter (PM) is well known as the generic term used for a type of air pollutant. PM consists of the complex and various mixtures of particles suspended in the air. PM is mainly produced by various natural and anthropogenic activities [4]. However, the significant sources of this pollutant are factories, power plants, refuse incinerators, motor vehicles, construction activities, fires, and natural windblown dust. Exposure to particle pollutants such as PM significantly causes a wide variety of respiratory, cardiovascular, and pulmonary diseases [5,6,7,8,9,10]. Apart from these impacts, PM10 and PM2.5 can go deeply into the alveolar region of the lungs and cause severe respiratory diseases. Only less than 20% of particle sizes from 1 to 10 microns are deposited in the upper airways, which means that the rest of these particles will escape and go through lower airways. However, the amount of particle deposition is mainly dependent on the airway sizes (human’s age), the daily physical activities that will create different airflow rates, and particle sizes [11,12,13,14,15,16,17,18,19]. According to the International Agency for Research on Cancer [20], outdoor PM is classified as carcinogenic to humans. This PM can be measured as a dose that is inhaled and then deposited in the human respiratory tract [21,22]. Several researchers have investigated air quality in both indoor and outdoor conditions, including inside cars, on buses, near highways, and at bus stations [23,24,25,26,27,28,29,30].
Referring to the International Union of Railways [31], worldwide railway transport is rapidly growing, having increased by over 50% since 2003 and had over 3.1 trillion passenger-km in 2012. In urban areas, people usually use the railway as the main public transport [32]. Although passengers usually take less time on the railway network compared to other transport modes, long-term exposure to high PM concentrations, as well as the associated harmful chemical composition, might lead to health problems [33,34]. From the statistics, each passenger usually travelled around 146.1 km by railway and around 10.4 km by bus [35]. Therefore, passengers are normally taking trains more than the buses. It was found that most passengers usually spend more time inside the train compartments rather than on the platform [36].
There are some measurements that focus on the comparison of PM2.5 and PM10 concentrations from the railway between the ground and underground levels. They were conducted inside and outside (platform) the train on both the ground and underground levels. Results on PM measurements in several locations, including Naples, Italy [37]; Prague, Czech Republic [38]; Rome, Italy [39]; Los Angeles, USA [22,40]; Taipei, Taiwan [41]; Seoul, Korea [42]; Sydney, Australia [43], showed that the PM concentrations on the platform are higher than the concentrations in the train. The PM2.5 and PM10 concentrations on the platform were 2 and 2.4 times higher than inside the train in Los Angeles, USA [36]. In Sydney, Australia, the concentrations of PM2.5 and PM10 on the platform were 1.1 times higher than inside the train [43]. However, this is only for ground-level cases. The PM concentrations in the train are higher than on the platform when the train is on the underground level. From this level, PM10 concentrations in the train were 2.7 times higher than on the platform in Rome, Italy [39]. According to previous studies [44,45,46,47], several factors significantly affect air quality measurements, including the age of the railway network, the braking system used, the ventilation system, the frequency of the train’s train passage, and the air conditioning system.
Sydney Metro is the biggest project of Australia’s public transport. This project was designed to provide passengers with more trains (estimated as 20 trains per hour on the City Circle) and faster services (estimated as a reduction of 4 min per one-way trip) across the network in order to meet a higher growth in travel demand of Sydney’s population [48]. Currently, there are two networks on this project. Sydney Metro Northwest is one of two networks that has been operated since 2019. Sydney Metro City & Southwest is another network that is still under construction and planned to be completed in 2024. For tracks, the Sydney Metro network is designed to use the same network of tracks as the Sydney Trains (only selected stations for stopping) that are currently operating for the suburb stations, which are only on the ground. Therefore, the related railway stations must be upgraded to meet the metro standards and prepare for metro operations. The station upgrade takes place between Sydenham and Bankstown with a distance of approximately 13.5 km. This project aims to improve station facilities, public domain at the station entry, as well as interchange with other transport modes at the station.
Based on the available data from the NSW Office of Environment and Heritage (NSW OEH) [49], the air quality was monitored at the Earlwood, Chullora, and Liverpool stations which are the closest to the metro. Recently, data from the NSW Department of Planning, Industry and Environment (NSW DPIE) [50] proved that air quality within these three areas is still acceptable. However, there is no specific data for air quality inside the Sydney train yet. Therefore, the specific aim of this study is to investigate the effect of Sydney Metro construction on the air quality inside the train by considering the concentrations of PM2.5, PM10, formaldehyde, and total volatile organic compounds. All 11 rail stations from the T3 Bankstown line of Sydney Trains Network are selected in this paper.

2. Methodology

2.1. Instrumentation

The PM concentrations were measured by using a portable PM detector (Temtop LKC-1000S+). This device is a hand-held air quality detecting device that detects the concentration of PM10, PM2.5, temperature, humidity, air quality index (AQI), formaldehyde (HCHO), and total volatile organic compounds (TVOC). The operating environment from this device includes: the temperature range—0–50 °C; humidity range—0–90%; atmospheric pressure—1 atm; PM10 and PM2.5 measurement range—0–999 µg/m3 with a resolution of 0.1 µg/m3; HCHO and TVOC measurement range—0–5000 µg/m3 with a resolution of 10 µg/m3. This device is equipped with a laser particle sensor with 1 min as a time resolution. The evaluation of a laser sensor was done in the laboratory and in the field with the Federal Equivalent Method (FEM)-Grimm as the standard [51,52].

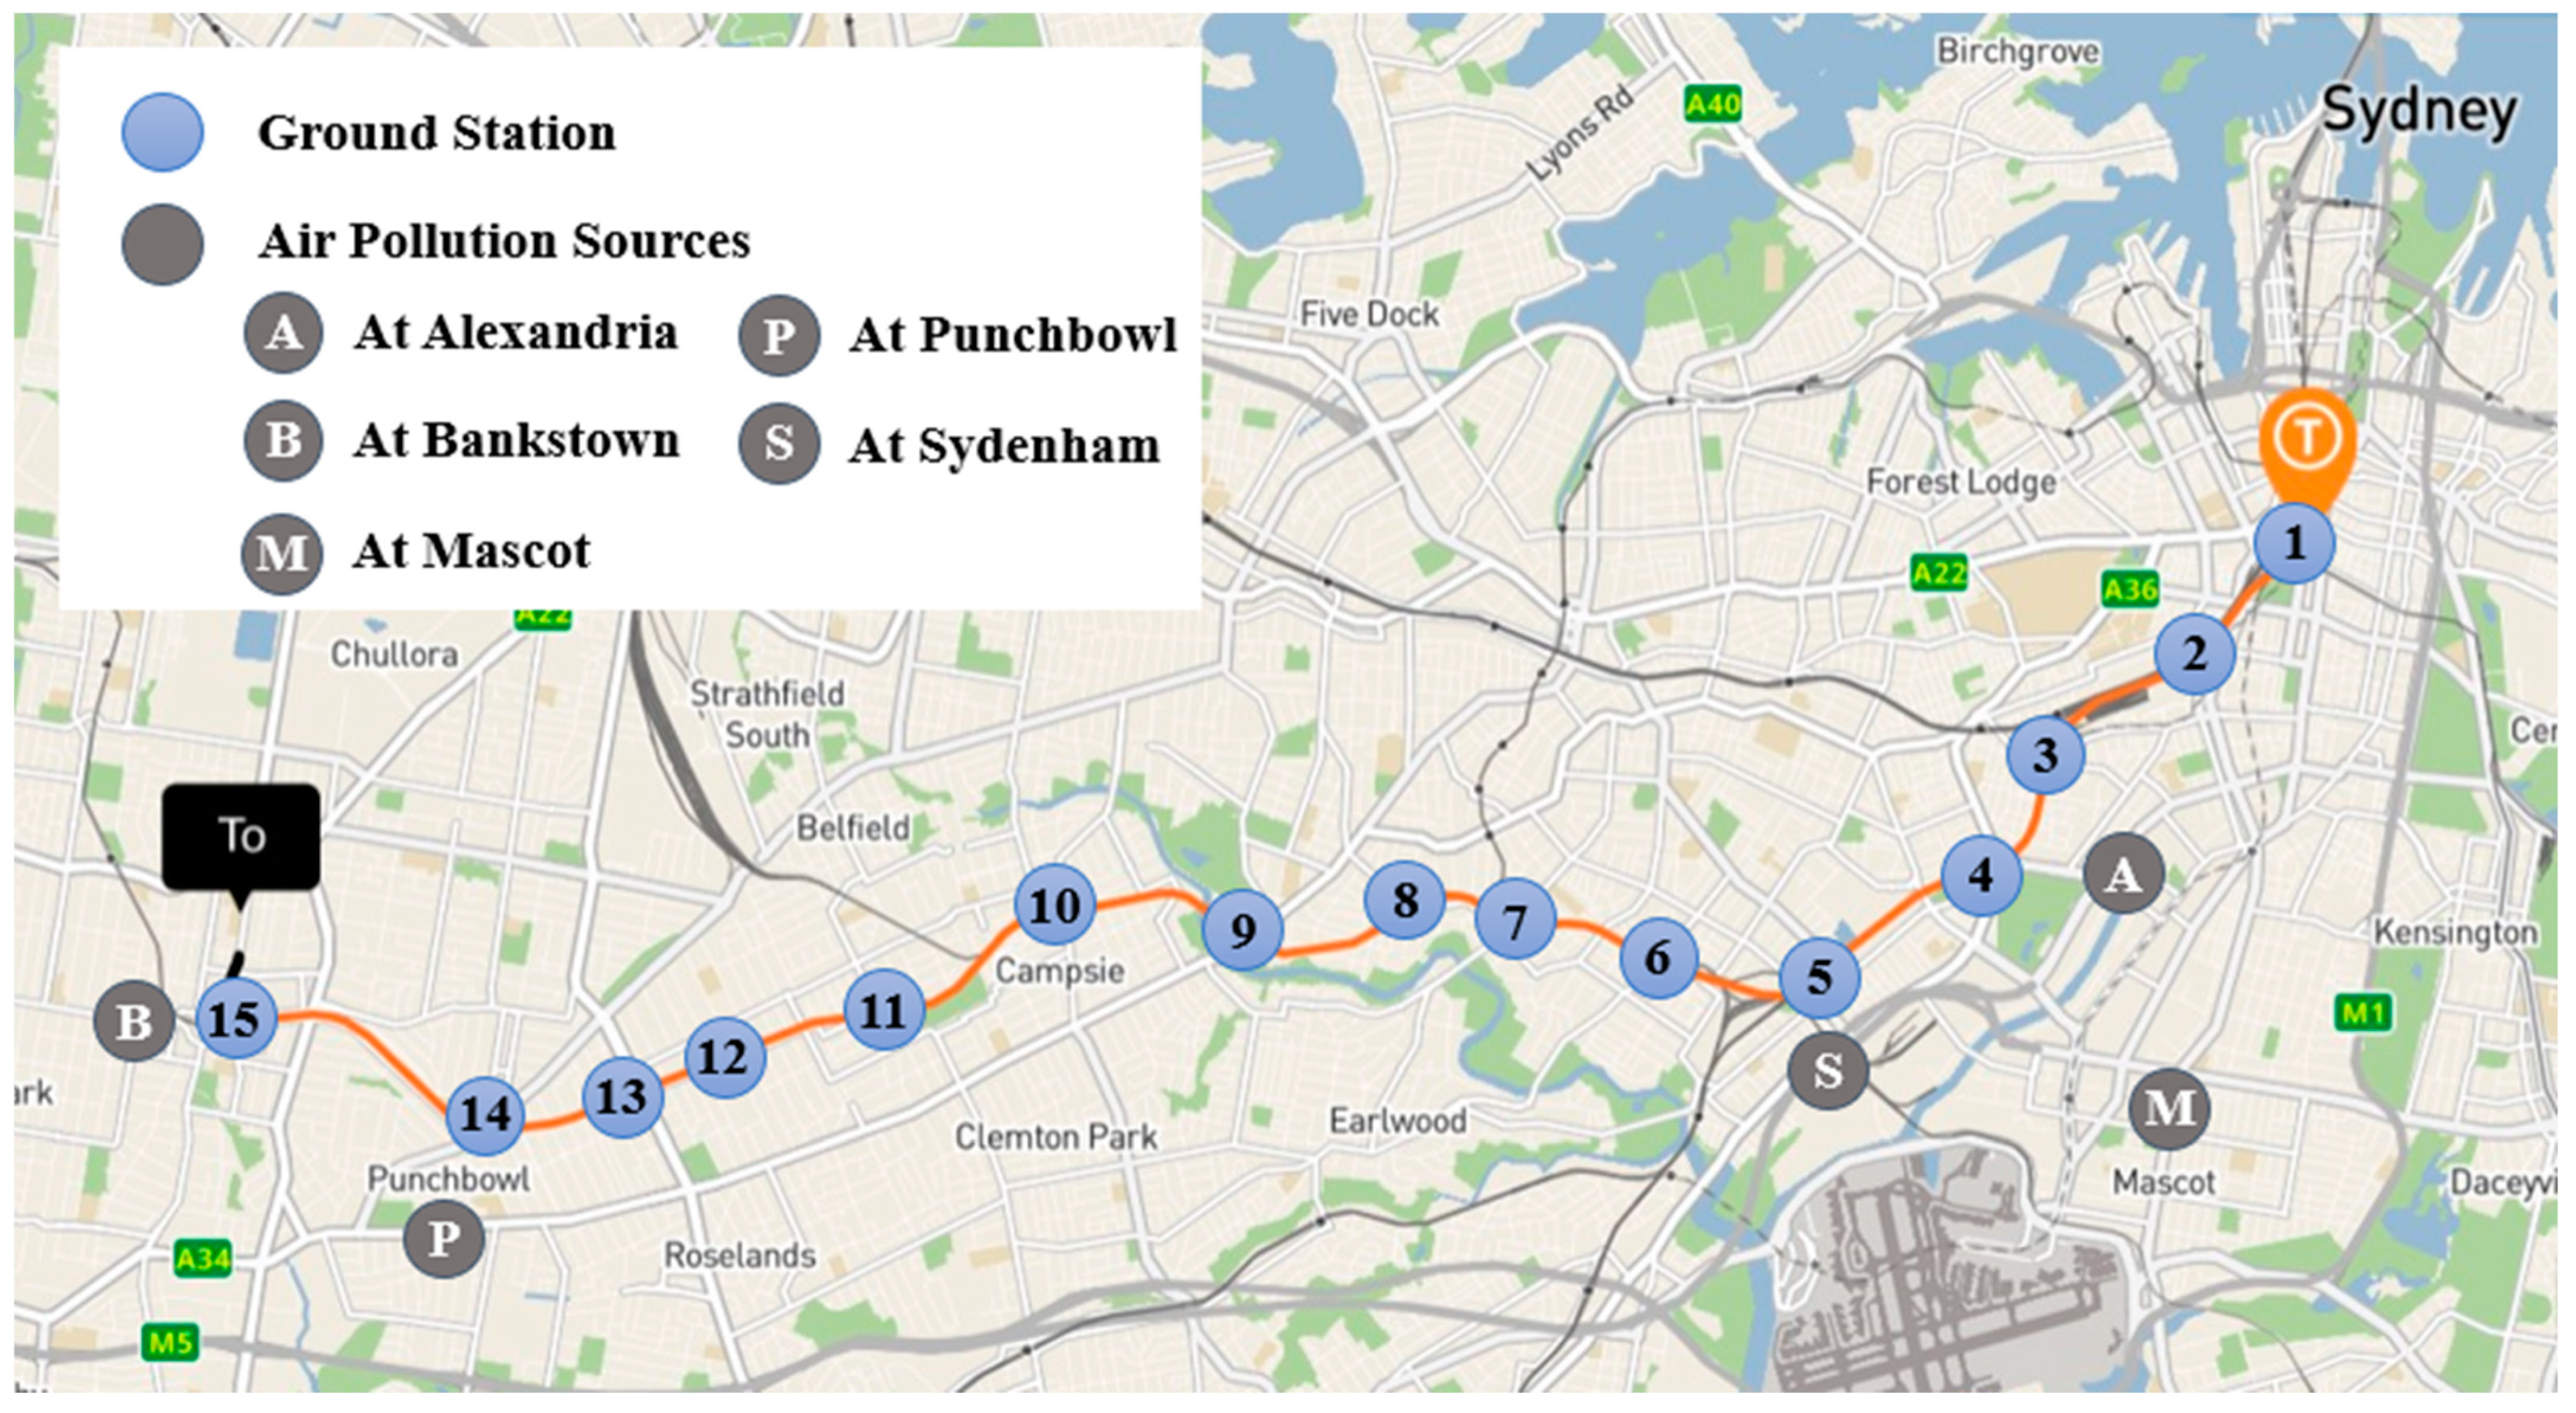
2.2. Railway Route Selection and Measurement Procedure

The measurements were performed inside the train carriage over 3 months, from November 2021 to January 2022, on both weekdays and weekends for daytime from 10:00 to 11:00 and nighttime from 19:30 to 20:30. The average ambient temperature and humidity are 22.21 °C and 53.47%, respectively. All measurements were conducted at the second cabin of the train. The data was collected when the train stopped at the platform and the doors opened for each station. Moreover, the windows were closed all the time.
The railway route between Central to Bankstown (T3 Bankstown line of Sydney Trains Network) was selected to collect the data. In this study, we collected data from Central station to Bankstown station as it is the last station upgrade for Sydney Metro Project. The construction of this project only takes place on the ground level, where it is around the platform at each station. The length of selected stations is approximately 18.7 km with 15 stations located in the Centre of the Sydney (known as Central station), Redfern, Erskineville, St Peters, Sydenham, Marrickville, Dulwich Hill, Hurlstone Park, Canterbury, Campsie, Belmore, Lakemba, Wiley Park, Punchbowl, and Bankstown (see Figure 1). The duration of a one-way trip was 34–40 min.
Air pollution sources can influence the local air quality around the construction sites. According to the Commonwealth Department of the Environment’s National Pollutant Inventory (NPI) [53], there are nine industrial facilities around the construction areas, which are located at Alexandria, Bankstown, Mascot, Punchbowl, and Sydenham. Two of these facilities are classified as petroleum product wholesaling, while other facilities are classified as: petroleum and coal product manufacturing; spring and wire product manufacturing; aircraft manufacturing and repair services; laundry and dry-cleaning services; ceramic product manufacturing; railway rolling stock manufacturing and repair services. The different types of industries are expected to emit the different toxic substances. Among these toxic substances, coarse particles (PM2.5, PM10) and other chemical compounds are highly expected to be the primary local air pollution sources. The location of these sources is provided in Figure 1.
In order to investigate the effect of the air quality during the construction of the Sydney Metro Project, the T8 Airport & South line was selected to compare the data for both weekdays and weekends as well as daytime and nighttime. The sampling of this T8 line was performed between April and May 2021 for five weeks. Moreover, this line was used to collect PM10 and PM2.5 only. The length of this route is approximately 56.73 km, with 1 h and 11 min of the duration as a one-way trip and 25 stations, including Central, Green Square, Mascot, Sydney Domestic Airport, Sydney International Airport, Wolli Creek, Turrella, Bardwell Park, Bexley North, Kingsgrove, Beverly Hills, Narwee, Riverwood, Padstow, Revesby, Panania, East Hills, Holsworthy, Glenfield, Macquarie Fields, Ingleburn, Minto, Leumeah, Campbelltown, and Macarthur. The T8 line was selected for this analysis because it is one of the busiest lines and the presence of both international and domestic terminals in this line makes it necessary to travel in this line for people who are taking flights from Sydney. Furthermore, there is a tunnel in this line which may affect the air quality. Figure 2 presents the location for each station of the T8 line.

3. Result and Discussion

3.1. PM Concentration inside Train Cabins

3.1.1. Average PM Concentrations of All Related Stations and Effect of Weather on PM Concentrations

Due to the COVID-19 outbreak in Sydney, there were lockdown restrictions during air quality measurements of the T3 line, which took time from the end of June to October 2021. The measurements of the T3 line had to be started in November 2021. Table 1 presents the obtained data over 3 months of sampling for 15 stations, including average PM concentrations, temperature, and relative humidity.
From Table 1, the average PM concentrations for both PM2.5 and PM10 were higher at three stations, namely Central, Canterbury, and Bankstown. Central had the highest average concentrations, followed by Bankstown and Canterbury. Hurlstone Park was found to have the lowest PM concentrations, followed by Punchbowl and Dulwich Hill. In addition, high standard deviation (SD) for both concentrations was found at almost all stations. This can be because the air comes from the platform when a train stops at stations and the doors open. Therefore, the air quality and the direction of air flow around platforms directly affect PM concentrations inside the train cabins. However, there are also other aspects that might affect the level of PM concentrations inside the train carriages, such as the resuspension of dust from passengers moving in and out, passenger density, and travelling time.
There are several weather conditions that play a role in the dispersion of the pollutants and the change in the air pollution level of an area, such as rainfall, temperature, wind speed, wind direction, and relative humidity. Temperature also plays a role in the rate of air movement. Because of the air movement, it will affect the movement of pollutants as well [54]. From Table 1, the highest temperature was found at Punchbowl and Bankstown at 25 °C, while the lowest temperature was found at Central at 24.1 °C. For the relative humidity (RH), the highest RH was found at Central (58.5%) followed by Bankstown (57.3%) and Canterbury (57%). The lowest RH was found at Wiley Park (51.4%) followed by Lakemba (51.6%) and Punchbowl (51.7%). From the results of temperature and RH, the difference in temperatures was around 1 °C, and the difference in the RH was around 7.1%. These differences were very small, which could not significantly affect the PM concentrations inside the trains. It is worth mentioning that the meteorology and dispersion of air pollutants will vary throughout the year due to seasonality.

3.1.2. Comparison of PM Concentrations in Different Periods

The average PM2.5 and PM10 concentrations inside the train carriage over three months are separated into day and night times with weekdays and weekends in Figure 3. Figure 3a,b show the comparison of PM2.5 concentrations between daytime and nighttime, while Figure 3c,d are for PM10.
From Figure 3, PM concentrations (Figure 3a,c) on weekdays were higher than at weekends in the daytime for Canterbury (Station 9) and Bankstown (Station 15), while the concentrations at the weekends from Central Station (Station 1) were found to be slightly higher than at weekdays. The concentrations on weekdays from other stations (Station 2–8 and Station 10–14) were slightly higher than at weekends. Focusing on the daytime only (Figure 3a,c), Bankstown (Station 15) had the highest PM2.5 and PM10 concentrations on the weekday at 10.1 μg/m3 and 14.1 μg/m3, and on the weekend at 7.1 μg/m3 and 9.9 μg/m3, respectively. St Peters (Station 4) had the lowest PM2.5 and PM10 concentrations on the weekday at 4.0 μg/m3 and 5.6 μg/m3, while Dulwich Hill (Station 7) had the lowest PM2.5 and PM10 concentrations on the weekend at 3.3 μg/m3 and 4.8 μg/m3.
In the nighttime (Figure 3b,d), the PM concentrations at the weekend were observed to be slightly higher than on the weekday for all stations except Central Station, where the concentrations on weekdays were slightly higher than at weekends, and Campsie (Station 10), where the concentrations were similar for both weekdays and weekends. For the nighttime (Figure 3b,d), Central (Station 1) had the highest PM2.5 and PM10 concentrations on the weekday at 10.1 μg/m3 and 14.2 μg/m3, and on the weekend at 9.3 μg/m3 and 12.9 μg/m3, respectively. Punchbowl (Station 14) had the lowest PM2.5 and PM10 concentrations on the weekday at 3.3 μg/m3 and 4.6 μg/m3, while Campsie (Station 10) had the lowest PM2.5 and PM10 concentrations on the weekend at 3.5 μg/m3 and 4.9 μg/m3.
However, there is no significant difference in PM concentrations between weekdays vs. weekends as well as daytime vs. nighttime, and the difference is still within the SD. Moreover, the difference in PM concentrations from all periods was around 12.1 μg/m3.
According to the National Environment Protection Council (NEPC) [55], the average concentration of PM2.5 and PM10 for 24 h should be less than 25 µg/m3 and 50 µg/m3, respectively. Based on the overall concentrations from all periods, the highest concentrations of PM2.5 is 10.1 μg/m3, while the highest concentrations of PM10 are 14.2 μg/m3. Therefore, the overall level of PM concentrations from all stations is still acceptable. During measurement, it is worth highlighting that the PM concentrations for each day were also lower than the average concentrations from NEPC [55].

3.1.3. Comparison of PM Concentration inside Train Cabins between Ground and Underground Levels

This section provides the comparison of PM concentrations inside the train between T3 and T8 lines by considering the effect of ground and underground levels. It is worth mentioning that the measurements between these two lines were not the same period due to the COVID-19 outbreak in Sydney. The lockdown restrictions in Sydney took time from the end of June to October 2021. Therefore, the measurements of the T3 line had to be started in November 2021 and ended in January 2022, while the measurements of the T8 line were earlier completed between April and May 2021. The concentrations of PM2.5 and PM10 are presented in Figure 4. It should be noted that there are only the ground stations for the T3 line.
From Figure 4, the average PM concentrations at the underground levels from T8 line were higher than at the ground levels from both T3 and T8 lines. For the cases of the ground level only, PM10 and PM2.5 concentrations from T3 line were slightly higher than T8 line at 1.2 μg/m3 and 0.7 μg/m3, respectively. According to the case study from Mohsen et al. [43], they studied PM concentrations and heavy metal contamination levels in the Sydney transport system. The sampling was conducted over 6 weeks to measure PM concentrations from the Sydney Train airport line (T2) at the ground and underground levels. They reported that PM concentrations inside the train were lower than outside the train in case of the ground level. In contrast, PM concentrations inside the train were higher than outside in the case of the underground level. PM2.5 and PM10 concentrations inside the train at the underground level were 2.5 and 2.8 times higher than ground level. The results from T8 line also support this point. PM10 concentrations at the underground level from T8 line were 1.9 and 2.3 times higher than at the ground level from T3 and T8 lines, respectively. For PM2.5 concentrations at the underground level of T8 line, these concentrations were 1.9 and 2.2 times higher than the concentrations from T3 and T8 lines at the ground level. The different PM concentrations between the ground and underground levels might be because the surrounding air quality in the underground tunnel is significantly affected by the internal environment due to it being an enclosed environment with a reliance on ventilation systems. In fact, there are also other factors that could affect the air pollution inside the underground stations, including the aerosol sources, dispersion, etc. However, the data from this present study does not allow us to analyze the effect of air pollution by these factors. Thus, aerosol sampling and chemical characterization are advisable for future work.

3.2. Impact of the Existing Environment Pollution and Sydney Metro Construction Activities on Air Quality inside Train Cabins

Focusing on PM concentrations inside the train cabins from the T3 line and T8 line in Figure 4, the concentrations inside the train at the underground level from the T8 line were higher than at the ground level for both the T3 line and T8 line. In the case of the concentrations at the ground levels, the level of concentrations from the T3 line were slightly higher than the T8 line for both PM2.5 and PM10. The slightly different concentrations can be influenced by the rail system age, geographic level of measurements, surrounding conditions, and other factors. Referring to the state significant infrastructure application report of Sydney Metro project from NSW government [56], the air quality impacts around related stations of T3 line are divided into two main factors that are the effect of the existing environment pollution and the potential construction.

3.2.1. Effect of the Existing Environmental Pollution

The construction areas of the Sydney Metro project are located in the Sydney Basin, which is part of a major basin system that extends over 1500 km from the Bowen Basin in Queensland through to the Gunnedah Basin in New South Wales. The ambient air quality around the Sydney Basin is influenced by topography, prevailing meteorological conditions (such as wind and temperature), and local and regional air pollution sources (such as motor vehicles, industrial facilities and bushfires) [56]. Several major components determine the pollutant’s concentrations, including the source nature, emission rate, source periodicity, emission particle size and chemical composition.
According to the latest update from NPI [53], the local air quality is likely influenced by the air pollution sources close to the project area, which include:
(a) Industrial facilities at Alexandria, Sydenham, Mascot, Punchbowl, and Bankstown: all the air pollution sources from these locations are summarized in Table 2 (see Figure 1 for the positions of related locations).
From Table 2, it can be seen that several substances were emitted by the industrial facilities around the construction sites. The different types of industries will generate different toxic substances. Both PM2.5 and PM10 were generated by six facilities from all related locations except one facility at Mascot and Sydenham and two facilities at Bankstown. Referring to the operating hours from these six facilities, all facilities generated PM2.5 and PM10 during daytime only except Qantas Sydney, which was operating for 24 h a day. However, the TVOC was generated by all facilities. This pollutant will be further discussed in the next section.
(b) Commercial businesses such as service stations and smash repairs: the operation of a diesel freight train from Sydenham to the west of Campsie and the operation of the Sydney Trains Maintenance Centre at Sydenham are likely one of the air pollution sources [56].
(c) Domestic activities, such as wood-fired home heaters and lawn mowing.
(d) Transportation from other areas: The vehicles on the major roads and road network around the construction areas are also the primary impact on the local air quality. These include Stacey Street/Fairford Road (at Bankstown), King Georges Road (at Wiley Park), Canterbury Road (at Canterbury), and Princes Highway (at Sydenham) [56].

3.2.2. Effect of Potential Construction

The construction activities of the Sydney Metro project are likely to generate local air pollution such as dust and exhaust emissions.
(a) Dust: According to the Southwest Metro project update from November 2021 [52], the construction activities during the collected data measurement period involved platform reconstruction work, upgrade of overhead wiring, new lifts and accessibility upgrades, services building construction, bridge upgrade and remediation work, installation of anti-throw screens, and upgrade of track, signaling and communication equipment. During the work implementation of each activity, the dust (PM2.5 and PM10) could be generated by some working processes. These included:
  • Excavation, handling, stockpiling, loading and unloading, and transport of spoil;
  • Demolition of structures and the handling, stockpiling and transport of demolition material;
  • Transport, loading and unloading, stockpiling, and handling of imported construction materials such as imported fill;
  • Creation of exposed surfaces through the stripping of topsoil and other overlying structures (such as road and footpath pavements); the potential generation of dust emissions would be increased due to the wind erosion;
  • Concrete batching and pre-cast concreting.
(b) Exhaust emissions: The exhaust emissions during the construction would generate particulate matter (PM), carbon monoxide (CO), oxides of nitrogen (NOx), sulfur dioxide (SO2), and volatile organic compounds (VOCs). These pollutants could be generated by the following:
  • During the combustion of fuel in construction plant, machinery and equipment;
  • Handling and on-site storage of fuel and other chemicals.
In general, the standard construction hours were generally in the daytime, from 7:00 a.m. to 6:00 p.m. on weekdays and from 8:00 a.m. to 6:00 p.m. at weekend (Saturday only). There was no work on Sundays and public holidays. However, there might be some activities that were implemented out-of-hours (including night) when the trains were not running. Therefore, the measurement was not taken at these times. The information on construction activities for each station could be taken from the construction update report on the Sydney Metro website [57]. By the periods, overall construction activities from each station covered the sampling time from this study.
From the above discussions, the Sydney Metro construction activities are expected to have a higher contribution to PM concentrations inside the train carriage from the T3 line. However, the PM concentrations from the T3 line were slightly higher than the T8 line (1.2 μg/m3 for PM10 and 0.7 μg/m3 for PM2.5). Furthermore, there is no significant difference in the PM concentrations from T3 line between daytime and nighttime (see Figure 3). PM concentrations from these periods were around 6.8 μg/m3 for PM2.5 and 12.1 μg/m3 for PM10. Furthermore, the difference between these concentrations is still in the SD. Therefore, the construction activities from the Sydney Metro are not likely the main contribution that affects the PM concentrations inside the train. The local air pollution sources, including industrial facilities, commercial businesses, domestic activities, and transportation from other areas, are possible factors that affect the PM concentrations inside the train.

3.3. HCHO and TVOC Levels inside Train Cabins

Long term exposure to indoor pollutants, especially HCHO and TVOC can cause acute and chronic health effects due to sensory irritation, drowsiness, or even headaches due to cancer [58,59,60,61,62,63,64,65,66,67,68]. Both HCHO and TVOC concentrations of indoors are 2–10 times higher than outdoors [69,70]. TVOC is a group of Volatile organic compounds (VOCs) which is used to represent the entire pool of pollutants. For VOCs, these pollutants are a group of carbon-based chemicals that can evaporate at room temperature. VOCs could be generated by both natural and human-made sources, including trees and grass, aerosols and solvents, paints, road transport and residential wood heaters. For HCHO, it is part of TVOCs that could be generated by combustion sources such as petrol and diesel vehicles, commercial businesses, and industries. In Sydney, the largest source of HCHO emissions is residential wood heaters [71].
The HCHO and TVOC were measured in the same time period as PM pollutants inside the train from all stations of the T3 line. Table 3 summarizes the pollutant concentrations of HCHO and TVOC over 3 months (from November 2021 to January 2022), with the average, minimum, median, maximum, and the total samples exceeding recommended levels. The total samples that exceeded recommended levels were calculated based on the sample times that exceeded the recommended criteria and the total sample times (the number of observations within three months; N = 1380).
According to NSW Environment Protection Authority (EPA) [71], the average concentration of HCHO for 1 h should not exceed 100 µg/m3. Based on the recommended level of TVOC from the National Construction Code: Australian Building Codes Board [72], the average concentration of this pollutant for 1 h should not exceed 500 µg/m3. From Table 3, the average HCHO and TVOC were less than the recommended criteria. During the measurement, the concentrations of HCHO exceeded the recommended value 10-times. For TVOC concentrations, the concentrations of this pollutant exceeded the recommended value by 14 times. However, the sample exceeding recommended levels were only 1.0% and 1.4% for HCHO and TVOC, respectively.
Table 4 and Table 5 present the comparison of average HCHO and TVOC concentrations between 15 stations from the T3 line. The average indoor pollutant concentrations of HCHO and TVOC were lower than the recommended criteria. The highest indoor concentrations of both pollutants were measured at Canterbury and followed by Central Station. Furthermore, HCHO concentrations from Central Station were found to be about 1-time lower than Canterbury Station, while TVOC concentrations from Central Station were slightly higher than Canterbury Station. During sampling, HCHO concentrations (Table 4) from five stations exceeded the recommended levels which were around 1–5%. For TVOC concentrations (Table 5), six stations exceeded the recommended levels of approximately 1–5%. It should be noted that the samples exceeding recommended levels were calculated based on the sample times that exceeded the recommended criteria from each station and the total sample times (the number of observations for each station within three months; N = 92).
The comparisons of the average HCHO and TVOC between daytime and nighttime were made and provided in Figure 5 and Figure 6, respectively. From Figure 5, HCHO concentrations from all stations were higher at the weekend for both daytime and nighttime except Canterbury (Station 9), Campsie (Station 10), Belmore (Station 11), and Punchbowl (Station 14). These four stations had higher concentrations on weekdays during daytime. Two highest concentrations and SD were found from Central (Station 1) at the weekend and Canterbury (Station 9) on weekdays and weekends. TVOC concentrations at the daytime (Figure 6a) from all stations were higher at the weekend except Campsie (Station 10) and Belmore (Station 11). TVOC concentrations (Figure 6b) from all stations were higher at the weekend for both daytime and nighttime except Central (Station 1). The highest concentrations were found at Central (Station 1), followed by Canterbury (Station 9) and Dulwich Hill (Station 7). However, a higher SD from TVOC was found at Central (Station 1) and Canterbury (Station 9).
From Section 3.2, the existing environment, including industrial facilities, domestic activities, and transportation from other areas, are likely to be the sources of HCHO and TVOC pollutants. The summary of substance releases from Table 2 indicated that all industrial facilities emitted TVOC pollutants. As mentioned earlier, the exhaust emissions during the construction of the Sydney Metro project could generate VOCs. From the Sydney Metro construction activities, both HCHO and TVOC from all related stations (Sydenham to Bankstown) are expected to be higher than other stations (Central to St Peters). However, the average concentrations of these pollutants (Table 4 and Table 5) from all stations were not significantly different except at Canterbury. The average HCHO from Canterbury station was about one-time higher than other stations. The average TVOC from this station was slightly higher than Central and about one-time to three-times higher than other stations.

4. Conclusions

The air quality inside the train carriages in the Sydney railway system was measured under consideration of Sydney Metro constructions. The level of PM concentrations, HCHO, as well as TVOC were analyzed in this study. The measurements were conducted from all related stations of the T3 Bankstown line, where the construction took place. The results of the T3 line were compared to T8 Airport & South line that were not affected by the project’s construction.
The key findings from this study are summarized as follows:
  • The Sydney Metro construction activities insignificantly affect the PM concentrations inside the train at T3 line. The concentrations during the daytime are slightly higher than the nighttime. The difference in PM concentrations from these periods was around 6.8 μg/m3 for PM2.5 and 12.1 μg/m3 for PM10.
  • PM concentrations inside the train at the ground level were lower than PM concentrations inside the train at the underground level. However, these concentrations were still lower than the national air quality standards.
  • The meteorology insignificantly affects the PM concentrations inside the train at T3 line. From all related stations, the difference in temperatures was around 1 °C, while the difference in the RH was around 7.1%.
  • The average HCHO and TVOC concentrations were lower than the recommendation criteria. The sample exceeding recommended levels of these compounds was around 1–1.4% of the total.
The comprehensive assessment of air quality inside the railway systems, including PM, HCHO, and TVOC can be applied to examine the potential health risks due to the ‘passengers’ exposure to the air pollutant in the railway systems caused by Sydney Metro construction. Further research should be focused on other heavy metal contaminants inside the train. Moreover, the comparison of PM concentrations inside the train cabins and at the platform should be considered.

Author Contributions

Conceptualization, M.S.I., N.C.S. and P.L.; methodology, M.S.I. and P.L.; formal analysis, P.L.; investigation, P.L.; resources, M.S.I.; data curation, P.L.; writing—original draft preparation, P.L., M.S.I. and N.C.S.; writing—review and editing, P.L., M.S.I. and N.C.S.; visualization, P.L.; supervision, M.S.I. All authors have read and agreed to the published version of the manuscript.

Funding

This research received no external funding.

Institutional Review Board Statement

Not applicable.

Informed Consent Statement

Not applicable.

Data Availability Statement

Data will be available upon request.

Acknowledgments

The authors would like to acknowledge the Sydney Trains for allowing us to access the Bankstown line (T3) and Airport & South line (T8) train carriages. The results and discussion in this study are independent of, and not formally endorsed by Sydney Trains and Sydney Metro.

Conflicts of Interest

The authors declare no conflict of interest.

References

  1. Kampa, M.; Castanas, E. Human health effects of air pollution. Environ. Pollut. 2007, 151, 362–367. [Google Scholar] [CrossRef] [PubMed]
  2. Katsouyanni, K. Ambient air pollution and health. Br. Med Bull. 2003, 68, 143. [Google Scholar] [CrossRef] [PubMed] [Green Version]
  3. Jarup, L. Hazards of heavy metal contamination. Br. Med. Bull. 2003, 68, 167. [Google Scholar] [CrossRef] [Green Version]
  4. Pöschl, U. Atmospheric Aerosols: Composition, Transformation, Climate and Health Effects. Angew. Chem. Int. Ed. 2005, 44, 7520. [Google Scholar] [CrossRef]
  5. Campbell, A. Inflammation, neurodegenerative diseases, and environmental exposures. Ann. N. Y. Acad. Sci. 2004, 1035, 117–132. [Google Scholar] [CrossRef] [PubMed]
  6. Delfino, R.J.; Sioutas, C.; Malik, S. Potential Role of Ultrafine Particles in Associations between Airborne Particle Mass and Cardiovascular Health. Environ. Heal. Perspect. 2005, 113, 934–946. [Google Scholar] [CrossRef] [PubMed] [Green Version]
  7. Dominici, F.; Peng, R.D.; Bell, M.L.; Pham, L.; McDermott, A.; Zeger, S.L.; Samet, J.M. Fine particulate air pollution and hospital admission for cardiovascular and respiratory diseases. JAMA 2006, 295, 1127–1134. [Google Scholar] [CrossRef] [Green Version]
  8. Pope, C.A.; Burnett, R.T.; Thurston, G.D.; Thun, M.J.; Calle, E.E.; Krewski, D.; Godleski, J.J. Cardiovascular mortality and long-term exposure to particulate air pollution: Epidemiological evidence of general pathophysiological pathways of disease. Circulation 2004, 109, 71–77. [Google Scholar] [CrossRef] [PubMed] [Green Version]
  9. Vallero, D. Fundamentals of Air Pollution; Academic Press: New York, NY, USA, 2008. [Google Scholar]
  10. Chuang, K.J.; Chan, C.C.; Su, T.C.; Lee, C.T.; Tang, C.S. The effect of urban air pollution on inflammation, oxidative stress, coagulation, and autonomic dysfunction in young adults. Am. J. Resp. Crit. Care 2007, 176, 370–376. [Google Scholar] [CrossRef]
  11. Larpruenrudee, P.; Islam, M.S.; Paul, G.; Paul, A.R.; Gu, Y.T.; Saha, S.C. Model for Pharmaceutical aerosol transport through stenosis airway. In Handbook of Lung Targeted Drug Delivery Systems: Recent Trends and Clinical Evidences; CRC Press: Boca Raton, FL, USA, 2021; p. 91. [Google Scholar]
  12. Islam, M.; Larpruenrudee, P.; Hossain, S.; Rahimi-Gorji, M.; Gu, Y.; Saha, S.; Paul, G. Polydisperse Aerosol Transport and Deposition in Upper Airways of Age-Specific Lung. Int. J. Environ. Res. Public Health 2021, 18, 6239. [Google Scholar] [CrossRef]
  13. Gu, Q.; Qi, S.; Yue, Y.; Shen, J.; Zhang, B.; Sun, W.; Qian, W.; Islam, M.S.; Saha, S.; Wu, J. Structural and functional alterations of the tracheobronchial tree after left upper pulmonary lobectomy for lung cancer. Biomed. Eng. Online 2019, 18, 105. [Google Scholar] [CrossRef] [PubMed] [Green Version]
  14. Islam, M.S.; Saha, S.C.; Sauret, E.; Ong, H.; Young, P.; Gu, Y. Euler–Lagrange approach to investigate respiratory anatomical shape effects on aerosol particle transport and deposition. Toxicol. Res. Appl. 2019, 3. [Google Scholar] [CrossRef] [Green Version]
  15. Ghosh, A.; Islam, M.S.; Saha, S.C. Targeted Drug Delivery of Magnetic Nano-Particle in the Specific Lung Region. Computation 2020, 8, 10. [Google Scholar] [CrossRef] [Green Version]
  16. Islam, M.S.; Larpruenrudee, P.; Paul, A.R.; Paul, G.; Gemci, T.; Gu, Y.; Saha, S.C. SARS CoV-2 aerosol: How far it can travel to the lower airways? Phys. Fluids 2021, 33, 61903. [Google Scholar] [CrossRef] [PubMed]
  17. Singh, P.; Raghav, V.; Padhmashali, V.; Paul, G.; Islam, M.S.; Saha, S.C. Airflow and Particle Transport Prediction through Stenosis Airways. Int. J. Environ. Res. Public Health 2020, 17, 1119. [Google Scholar] [CrossRef] [Green Version]
  18. Islam, M.S.; Gu, Y.; Farkas, A.; Paul, G.; Saha, S.C. Helium–Oxygen Mixture Model for Particle Transport in CT-Based Upper Airways. Int. J. Environ. Res. Public Health 2020, 17, 3574. [Google Scholar] [CrossRef]
  19. Islam, M.S.; Saha, S.C.; Sauret, E.; Gu, Y.; Ristovski, Z. Numerical investigation of aerosol particle transport and deposition in realistic lung airway. In Proceedings of the International Conference on Computational Methods, Auckland, New Zealand, 14–17 July 2015. [Google Scholar]
  20. IARC International Agency for Research on Cancer. Air Pollution and Cancer; IARC Scientific Publications: Geneva, Switzerland, 2013. [Google Scholar]
  21. Löndahl, J.; Massling, A.; Pagels, J.; Swietlicki, E.; Vaclavik, E.; Loft, S. Size-Resolved Respiratory-Tract Deposition of Fine and Ultrafine Hydrophobic and Hygroscopic Aerosol Particles During Rest and Exercise. Inhal. Toxicol. 2007, 19, 109–116. [Google Scholar] [CrossRef]
  22. Russell, A.G.; Brunekreef, B. A Focus on Particulate Matter and Health. Environ. Sci. Technol. 2009, 43, 4620–4625. [Google Scholar] [CrossRef] [Green Version]
  23. Farrell, W.; Weichenthal, S.; Goldberg, M.; Valois, M.F.; Shekarrizfard, M.; Hatzopoulou, M. Near roadway air pollution across a spatially extensive road and cycling network. Environ. Pollut. 2016, 212, 498–507. [Google Scholar] [CrossRef]
  24. Gramotnev, D.K.; Gramotnev, J. A new mechanism of aerosol evolution near a busy road: Fragmentation of nanoparticles. J. Aerosol Sci. 2005, 36, 323–340. [Google Scholar] [CrossRef]
  25. Kingham, S.; Longley, I.; Salmond, J.; Pattinson, W.; Shrestha, K. Variations in exposure to traffic pollution while travelling by different modes in a low density, less congested city. Environ. Pollut. 2013, 181, 211–218. [Google Scholar] [CrossRef] [PubMed]
  26. Tartakovsky, L.; Baibikov, V.; Czerwinski, J.; Gutman, M.; Kasper, M.; Popescu, D.; Veinblat, M.; Zvirin, Y. In-vehicle particle air pollution and its mitigation. Atmos. Environ. 2013, 64, 320–328. [Google Scholar] [CrossRef]
  27. Whitlow, T.H.; Hall, A.; Zhang, K.M.; Anguita, J. Impact of local traffic exclusion on near-road air quality: Findings from the New York City “Summer Streets” campaign. Environ. Pollut. 2011, 159, 2016–2027. [Google Scholar] [CrossRef] [PubMed]
  28. Zhang, Q.; Zhu, Y. Measurements of ultrafine particles and other vehicular pollutants inside school buses in South Texas. Atmos. Environ. 2010, 44, 253–261. [Google Scholar] [CrossRef]
  29. Zuurbier, M.; Hoek, G.; Oldenwening, M.; Lenters, V.; Meliefste, K.; Van den Hazel, P.; Brunekreef, B. Commuters’ exposure to particulate matter air pollution is affected by mode of transport, fuel type, and route. Environ. Health Perspect. 2010, 118, 783–789. [Google Scholar] [CrossRef] [PubMed] [Green Version]
  30. Joodatnia, P.; Kumar, P.; Robins, A. Fast response sequential measurements and modelling of nanoparticles inside and outside a car cabin. Atmos. Environ. 2013, 71, 364–375. [Google Scholar] [CrossRef] [Green Version]
  31. UIC—International Union of Railways. Railway Handbook 2015—Energy Consumption and CO2 Emissions: Focus on Vehicle Efficiency; OECD/IEA: Paris, France, 2015; p. 102. [Google Scholar]
  32. Song, M.; Zhang, G.; Zeng, W.; Liu, J.; Fang, K. Railway transportation and environmental efficiency in China. Transp. Res. Part D Transp. Environ. 2016, 48, 488–498. [Google Scholar] [CrossRef]
  33. Fridell, E.; Ferm, M.; Ekberg, A. Emissions of particulate matters from railways—Emission factors and condition monitoring. Transp. Res. Part D Transp. Environ. 2010, 15, 240–245. [Google Scholar] [CrossRef]
  34. Karlsson, H.L.; Nilsson, L.; Möller, L. Subway particles are more genotoxic than street particles and induce oxidative stress in cultured human lung cells. Chem. Res. Toxicol. 2005, 18, 19–23. [Google Scholar] [CrossRef]
  35. Alexeyev, A. Transport Trends and Challenges in the Russian Federation. In Proceedings of the 24th Session Working Party on Transport Trends and Economics (WP.5) UNECE Inland Transport Committee, Geneva, Switzerland, 6–7 September 2011; The Ministry of Transport of the Russian Federation: Moscow, Russia. [Google Scholar]
  36. Kam, W.; Cheung, K.; Daher, N.; Sioutas, C. Particulate matter (PM) concentrations in underground and ground-level rail systems of the Los Angeles Metro. Atmos. Environ. 2011, 45, 1506–1516. [Google Scholar] [CrossRef]
  37. Cartenì, A.; Cascetta, F.; Campana, S. Underground and ground level particulate matter concentrations in an Italian metro system. Atmos. Environ. 2015, 101, 328–337. [Google Scholar] [CrossRef]
  38. Cusack, M.; Talbot, N.; Ondráček, J.; Minguillón, M.; Martins, V.; Klouda, K.; Schwarz, J.; Ždímal, V. Variability of aerosols and chemical composition of PM10, PM2.5 and PM1 on a platform of the Prague underground metro. Atmos. Environ. 2015, 118, 176–183. [Google Scholar] [CrossRef]
  39. Perrino, C.; Marcovecchio, F.; Tofful, L.; Canepari, S. Particulate matter concentration and chemical composition in the metro system of Rome, Italy. Environ. Sci. Pollut. Res. 2015, 22, 9204–9214. [Google Scholar] [CrossRef] [PubMed]
  40. Kam, W.; Ning, Z.; Shafer, M.; Schauer, J.; Sioutas, C. Chemical characterisation of coarse and fine particulate matter (PM) in underground and ground-level rail systems of the Los Angeles metro. Environ. Sci. Technol. 2011, 45, 6769–6776. [Google Scholar] [CrossRef] [PubMed]
  41. Cheng, Y.-H.; Yan, J.-W. Comparisons of particulate matter, CO, and CO2 levels in underground and ground-level stations in the Taipei mass rapid transit system. Atmos. Environ. 2011, 45, 4882–4891. [Google Scholar] [CrossRef]
  42. Park, D.-U.; Ha, K.-C. Characteristics of PM10, PM2.5, CO2 and CO monitored in interiors and platforms of subway train in Seoul, Korea. Environ. Int. 2008, 34, 629–634. [Google Scholar] [CrossRef]
  43. Mohsen, M.; Ahmed, M.B.; Zhou, J.L. Particulate matter concentrations and heavy metal contamination levels in the railway transport system of Sydney, Australia. Transp. Res. Part D Transp. Environ. 2018, 62, 112–124. [Google Scholar] [CrossRef]
  44. Aarnio, P.; Yli-Tuomi, T.; Kousa, A.; Mäkelä, T.; Hirsikko, A.; Hämeri, K.; Räisänen, M.; Hillamo, R.; Koskentalo, T.; Jantunen, M. The concentrations and composition of and exposure to fine particles (PM2.5) in the Helsinki subway system. Atmos. Environ. 2005, 39, 5059–5066. [Google Scholar] [CrossRef]
  45. Abbasi, S.; Wahlström, J.; Olander, L.; Larsson, C.; Olofsson, U.; Sellgren, U. A study of airborne wear particles generated from organic railway brake pads and brake discs. Wear 2011, 273, 93–99. [Google Scholar] [CrossRef] [Green Version]
  46. Moreno, T.; Perez, N.; Reche, C.; Martins, V.; De Miguel, E.; Capdevila, M.; Centelles, S.; Minguillón, M.C.; Amato, F.; Alastuey, A.; et al. Subway platform air quality: Assessing the influences of tunnel ventilation, train piston effect and station design. Atmos. Environ. 2014, 92, 461–468. [Google Scholar] [CrossRef]
  47. Namgung, H.-G.; Kim, J.-B.; Woo, S.-H.; Park, S.; Kim, M.; Kim, M.-S.; Bae, G.-N.; Park, D.; Kwon, S.-B. Generation of Nanoparticles from Friction between Railway Brake Disks and Pads. Environ. Sci. Technol. 2016, 50, 3453–3461. [Google Scholar] [CrossRef] [PubMed]
  48. Sydney Metro City & Southwest. Sydenham to Bankstown Upgrade: State Significant Infrastructure Application Report; Transport for NSW: Sydney, Australia, 2017.
  49. Office of Environment and Heritage. Annual Report 2015-16; NSW Office of Environment and Heritage: Sidney, Australia, 2016.
  50. NSW Department of Planning and Environment. Air Quality Map. Available online: https://www.dpie.nsw.gov.au/air-quality/air-quality-maps/sydney-map (accessed on 5 February 2022).
  51. Elitech. Field Evaluation, Elitech Temtop LKC-1000+. Available online: http://www.aqmd.gov/docs/default-source/aq-spec/field-evaluations/elitech-temtop-lkc-1000s---field-evaluation.pdf?sfvrsn=14 (accessed on 17 March 2022).
  52. Elitech. Laboratory Evaluation: Elitch Temtop LKC-1000+. Available online: http://www.aqmd.gov/docs/default-source/aq-spec/laboratory-evaluations/elitech-temtop-lkc-1000s---lab-evaluation.pdf?sfvrsn=8 (accessed on 17 March 2022).
  53. Department of the Environment and Energy. National Pollutant Inventory. Available online: https://data.gov.au/dataset/ds-dga-043f58e0-a188-4458-b61c-04e5b540aea4/details?q= (accessed on 27 April 2022).
  54. Jacob, D.J.; Winner, D.A. Effect of climate change on air quality. Atmos. Environ. 2009, 43, 51–63. [Google Scholar] [CrossRef] [Green Version]
  55. NSW Department of Planning and Environment. Standards and Goals for Measuring air Pollution. Available online: https://www.environment.nsw.gov.au/topics/air/understanding-air-quality-data/standards-and-goals (accessed on 5 February 2022).
  56. Sydney Metro City & Southwest. Sydenham to Bankstown Upgrade: Environmental Impact Statement Volume 1B-Parts C and D; Transport for NSW: Sidney, Australia, 2017.
  57. Sydney Metro: Sydenham to Bankstown Substations. Stations and Sites. Available online: https://www.sydneymetro.info/station/sydenham-bankstown-substations (accessed on 17 March 2022).
  58. Mølhave, L. The sick buildings and other buildings with indoor climate problems. Environ. Int. 1989, 15, 65–74. [Google Scholar] [CrossRef]
  59. Henderson, L.; Brusick, D.; Ratpan, F.; Veenstra, G. A review of the genotoxicity of ethylbenzene. Mutat. Res.-Rev. Mutat. Res. 2007, 635, 81–89. [Google Scholar] [CrossRef]
  60. Atkinson, T.J. A review of the role of benzene metabolites and mechanisms in malignant transformation: Summative evidence for a lack of research in nonmyelogenous cancer type. Int. J. Hyg. Env. Health 2009, 212, 1–10. [Google Scholar] [CrossRef]
  61. Possanzini, M.; Di Palo, V. Simultaneous determination of HCHO, CH3CHO and O-X in ambient air by hydrazine reagent and HPLC. Ann. Chim. Rome 2003, 93, 149–156. [Google Scholar]
  62. Nissen, N.I.; Ohlsen, A.S. Erythromyelosis; review and report of a case in a Benzene (Benzol) worker. Acta Medica Scand. 1953, 145, 56–71. [Google Scholar] [CrossRef]
  63. Ohura, T.; Amagai, T.; Fusaya, M. Regional assessment of ambient volatile organic compounds in an industrial harbor area, Shizuoka, Japan. Atmos. Environ. 2006, 40, 238–248. [Google Scholar] [CrossRef]
  64. Weng, M.L.; Zhu, L.Z.; Yang, K. Levels and health risks of carbonyl compounds in selected public places in Hangzhou, China. J. Hazard. Mater. 2009, 164, 700–706. [Google Scholar] [CrossRef]
  65. Seow, A.; Poh, W.T.; Teh, M.; Eng, P.; Wang, Y.T.; Tan, W.C.; Yu, M.C.; Lee, H.P. Fumes from meat cooking and lung cancer risk in Chinese women. Cancer Epidemiol. Biomark. Prev. 2000, 9, 1215–1221. [Google Scholar]
  66. Wang, H.-W.; Chen, T.-L.; Yang, P.-C.; Ma, Y.-C.; Yu, C.-C.; Ueng, T.-H. Induction of cytochromes P450 1A1 and 1B1 in human lung adenocarcinoma CL5 cells by frying-meat emission particulate. Food Chem. Toxicol. 2002, 40, 653–661. [Google Scholar] [CrossRef]
  67. Saguy, L.S.; Dana, D. Integrated approach to deep fat frying: Engineering, nutrition, health and consumer aspects. J. Food Eng. 2003, 56, 143–152. [Google Scholar] [CrossRef]
  68. Aksoy, M. Different types of malignancies due to occupational exposure to benzene: A review of recent observations in Turkey. Environ. Res. 1980, 23, 181–190. [Google Scholar] [CrossRef]
  69. Plaisance, H.; Blondel, A.; Desauziers, V.; Mocho, P. Characteristics of formaldehyde emissions from indoor materials assessed by a method using passive flux sampler measurements. Build. Environ. 2014, 73, 249–255. [Google Scholar] [CrossRef]
  70. Tang, J.; Chan, C.; Wang, X.; Chan, L.; Sheng, G.; Fu, J. Volatile organic compounds in a multi-storey shopping mall in guangzhou, South China. Atmos. Environ. 2005, 39, 7374–7383. [Google Scholar] [CrossRef]
  71. NSW Environment Protection Authority. Air Emission in My Community Web Tool: Substance Information. Available online: https://www.epa.nsw.gov.au/~/media/EPA/Corporate%20Site/resources/air/130841AEsubstance.ashx (accessed on 27 April 2022).
  72. National Construction Code: Australian Building Codes Board. Handbook: Indoor Air Quality. Available online: https://ncc.abcb.gov.au/sites/default/files/resources/2021/Handbook-Indoor-Air-Quality.pdf (accessed on 27 April 2022).
Figure 1. Map of the T3 line from Central Station to Bankstown Station: 1. Central Station, 2. Redfern Station, 3. Erskineville Station, 4. St Peters Station, 5. Sydenham Station, 6. Marrickville Station, 7. Dulwich Hill Station, 8. Hurlstone Park Station, 9. Canterbury Station, 10. Campsie Station, 11. Belmore Station, 12. Lakemba Station, 13. Wiley Park Station, 14. Punchbowl Station, and 15. Bankstown Station.
Atmosphere 13 00759 g001
Figure 2. Map of the T8 line from Central Station to Macarthur Station: 1. Central Station, 2. Green Square Station, 3. Mascot Station, 4. Sydney Domestic Airport Station, 5. Sydney International Airport Station, 6. Wolli Creek Station, 7. Turrella Station, 8. Bardwell Park Station, 9. Bexley North Station, 10. Kingsgrove Station, 11. Beverly Hills Station, 12. Narwee Station, 13. Riverwood Station, 14. Padstow Station, 15. Revesby Station, 16. Panania Station, 17. East Hills Station, 18. Holsworthy Station, 19. Glenfield Station, 20. Macquarie Fields Station, 21. Ingleburn Station, 22. Minto Station, 23. Leumeah Station, 24. Campbelltown Station, and 25. Macarthur Station.
Atmosphere 13 00759 g002
Figure 3. Average PM2.5 and PM10 concentrations inside the train carriage for daytime and nighttime for all 15 stations. (a) PM2.5 concentrations at daytime, (b) PM2.5 concentrations at nighttime, (c) PM10 concentrations at daytime, (d) PM10 concentrations at nighttime.
Atmosphere 13 00759 g003
Figure 4. Average PM concentrations inside the train carriages from T3 line (measured over three months from November 2021 to January 2022), and T8 line (measured from April to May 2021).
Atmosphere 13 00759 g004
Figure 5. Average HCHO concentrations inside the train carriage for daytime and nighttime for all 15 stations. (a) HCHO concentrations for daytime, and (b) HCHO concentrations for nighttime.
Atmosphere 13 00759 g005
Figure 6. Average TVOC concentrations for daytime and nighttime for all 15 stations. (a) TVOC concentrations for daytime, and (b) TVOC concentrations for nighttime.
Atmosphere 13 00759 g006
Table 1. Average concentrations of PM2.5, PM10, temperature, and relative humidity (Average ± Standard Deviation) inside the train carriage on the ground level for over three months from November 2021 to January 2022.
StationPM2.5 (µg/m3)
Avg ± SD
PM10 (µg/m3)
Avg ± SD
Temperature (°C)
Avg ± SD
Relative Humidity (%)
Avg ± SD
Central7.7 ± 5.210.8 ± 7.324.1 ± 1.958.5 ± 10.4
Redfern4.6 ± 2.76.5 ± 3.824.3 ± 1.754.8 ± 7.3
Erskineville4.2 ± 2.95.9 ± 4.124.3 ± 1.553.7 ± 6.0
St Peters4.1 ± 2.85.8 ± 3.924.3 ± 1.353.3 ± 5.8
Sydenham4.6 ± 3.96.5 ± 5.424.4 ± 1.253.3 ± 5.5
Marrickville4.5 ± 3.66.3 ± 4.824.4 ± 1.253.4 ± 5.2
Dulwich Hill4.1 ± 3.05.8 ± 4.224.4 ± 1.453.6 ± 5.6
Hurlstone Park4.0 ± 2.65.6 ± 3.724.5 ± 1.653.9 ± 5.7
Canterbury6.4 ± 4.78.9 ± 6.624.3 ± 1.757.0 ± 6.8
Campsie4.6 ± 3.66.5 ± 5.124.9 ± 1.052.1 ± 4.7
Belmore4.4 ± 3.66.2 ± 5.024.9 ± 1.051.9 ± 5.0
Lakemba4.2 ± 3.46.0 ± 4.824.9 ± 1.151.6 ± 4.6
Wiley Park4.3 ± 3.56.0 ± 4.924.9 ± 1.251.4 ± 3.3
Punchbowl4.1 ± 3.35.7 ± 4.625.0 ± 1.251.7 ± 4.3
Bankstown6.8 ± 4.79.5 ± 6.625.0 ± 1.357.3 ± 4.4
Number of samples (N) for each station = 92 (i.e., the number of observations for each station within 3 months).
Table 2. The air pollution sources close to the project area by industrial facility [53].
Facility NameIndustrial FacilitySubstance ReleaseLocationOpening Hours
Asphalt PlantOther petroleum and coal product manufacturingCO, NOx, PM2.5, PM10, PAHs SO2, TVOCs, other chemical compounds (F, Mn)AlexandriaWeekday:
6:00 a.m.–3:00 p.m.
Weekend:
6:00 a.m.–1:00 p.m. (Saturday only)
Monroe SpringsSpring and wire product manufacturingCO, C8H10, C6H12, C7H8, C4H8O2, C4H8O, C6H12O, NOx, PM2.5, PM10, PAHs, SO2, TVOCs, other chemical compounds (Hg)AlexandriaWeekday:
8:00 a.m.–4:30 p.m.
Weekend:
closed
Viva Energy AirportPetroleum product wholesalingC7H8, C8H10, TVOCsBankstownWeekday:
5:00 a.m.–10:30 p.m.
Weekend:
6:00 a.m.–6:00 p.m.
Bankstown AirportPetroleum product wholesalingC6H6, C9H12, C8H10, C7H8, C8H10, C6H14, TVOCsBankstown24 h a day
Qantas SydneyAircraft manufacturing and repair servicesCO, C8H10, C9H12, NOx, PM2.5, PM10, PAHs, SO2, TVOCs, other chemical compounds (As, Be, Cd, Cr2O3, Cu, Pb, Hg, Ni, Zn), Polychlorinated dioxins & furans Mascot24 h a day
Sydney AirportAirport operations and other air transport support servicesCO, C8H10, C9H12, NOx, PM2.5, PM10, PAHs, SO2, TVOCs, other chemical compounds (As, Be, Cd, Cr2O3, Cu, Pb, Hg, Ni, Zn), Polychlorinated dioxins & furans Mascot24 h a day
Ensign ServicesLaundry and dry-cleaning servicesCO, SO2, C8H10, NOx, PM2.5, PM10, TVOCs, PAHsPunchbowlWeekday:
7:30 a.m.–5:00 p.m.
Weekend:
7:30 a.m.–5:00 p.m. (Saturday only)
Austral BricksOther ceramic product manufacturingCO, SO2, NOx, PM2.5, PM10, TVOCs, HCI, PAHs, other chemical compounds (As, Be, Cd, Cr2O3, CrO3, Cu, F, Pb, Mn, Hg, Ni, Zn), Polychlorinated dioxins & furansPunchbowlWeekday:
8:00 a.m.–4:00 p.m.
Weekend:
9:00 a.m.–12:00 p.m. (Saturday only)
Sydney Trains Maintenance CentreRailway rolling stock manufacturing and repair servicesC9H12, C8H10, TVOCs,Sydenham24 h a day
PAHs = Polycyclic aromatic hydrocarbons, HCI = Hydrochloric acid.
Table 3. Average concentrations of HCHO and TVOC inside the train carriage over 3 months (from November 2021 to January 2022) of T3 line.
Object (Unit)AvgMin.MedianMax.Recommended CriteriaSample Exceeding Recommended Levels (%)
HCHO (µg/m3)18.810101500<1001.0
TVOC (µg/m3)88.940604250<5001.4
Table 4. Average concentrations of HCHO inside the train carriage over 3 months (from November 2021 to January 2022) for all stations of T3 line.
StationAvgMin.MedianMax.Sample Exceeding Recommended Levels (%)
Central21.010102702.2
Redfern17.51010800
Erskineville15.41010700
St Peters15.01010800
Sydenham15.51010700
Marrickville16.610101101.1
Dulwich Hill18.610101701.1
Hurlstone Park18.01010700
Canterbury41.0101015005.4
Campsie19.61010800
Belmore17.710101301.1
Lakemba15.41010900
Wiley Park10.41010200
Punchbowl11.91010200
Bankstown10.81010200
Table 5. Average concentrations of TVOC inside the train carriage over 3 months (from November 2021 to January 2022) for all stations of T3 line.
StationAvgMin.MedianMax.Sample Exceeding Recommended Levels (%)
Central115.540609305.4
Redfern86.140604200
Erskineville76.940603200
St Peters88.3406014001.1
Sydenham73.740603200
Marrickville80.540605401.1
Dulwich Hill89.040606901.1
Hurlstone Park84.240603300
Canterbury149.8406042505.4
Campsie90.440454200
Belmore79.640405801.1
Lakemba77.340504700
Wiley Park50.44050800
Punchbowl58.540601100
Bankstown55.440501000
Publisher’s Note: MDPI stays neutral with regard to jurisdictional claims in published maps and institutional affiliations.

