Article

Impact of Climate Change on the Yield and Water Footprint of Winter Wheat in the Haihe River Basin, China

1
College of Water Resources, North China University of Water Resources and Electric Power, Zhengzhou 450046, China
2
Henan Key Laboratory of Water Resources Conservation and Intensive Utilization in the Yellow River Basin, Zhengzhou 450046, China
3
School of Environmental and Municipal Engineering, North China University of Water Resources and Electric Power, Zhengzhou 450046, China
*
Author to whom correspondence should be addressed.
Atmosphere 2022, 13(4), 630; https://doi.org/10.3390/atmos13040630
Submission received: 18 March 2022 / Revised: 11 April 2022 / Accepted: 13 April 2022 / Published: 15 April 2022
(This article belongs to the Topic Climate Change and Environmental Sustainability)

Abstract

:
Climate change can impact the yield and water footprint of crops. Therefore, assessing such impacts carries great significance for regional water and food security. This study validated and verified the variety parameters of winter wheat for the Decision Support System for Agrotechnology Transfer (DSSAT) model, using the long-term (1993–2013) growth and yield data observed from six agricultural experiment stations in the Haihe River Basin (HRB), China. The growth process was simulated under three representative concentration pathways (RCPs), named RCP2.6, RCP4.5, and RCP8.5—climate scenarios driven by the HadGEM2-ES model. The variety parameters of winter wheat showed high accuracy in the simulation of the anthesis and maturity dates, and could be used for long-term prediction of the growth process. The trends of climate change had positive impacts on the water footprint of winter wheat but adverse impacts on the yield. The growing period was shortened by 3.6 days, 4.7 days, and 5.0 days per decade in the RCP2.6, RCP4.5, and RCP8.5 scenarios, respectively, due to the rapid accumulation of heat. The yield would be increased in lower emissions scenarios (17% in RCP2.6), but decreased in high-emissions scenarios due to high temperatures, which may restrict the growth of wheat. The water footprint was decreased by 10%, 11%, and 13% in the RCP2.6, RCP4.5, and RCP8.5 scenarios, respectively, indicating that the water-use efficiency could be improved in the future. The results showed broad application prospects of the DSSAT model in simulating the response of crop growth to climate change.

1. Introduction

Climate change poses a huge threat to the world’s water and food security. According to the sixth assessment report (AR6) of the Intergovernmental Panel on Climate Change (IPCC), the global surface temperature was 1.09 °C higher in 2011–2020 than in 1850–1900, and the global surface in each of the last four decades has been successively warmer than any decade since 1850 [1,2]. Agriculture has been significantly affected by climate change [3,4,5]. The rising temperature has affected photosynthesis and transpiration, the growing period, and production [6,7,8,9]. In addition, the increase in temperature has affected the hydrological process and brought changes in evapotranspiration and precipitation [10,11,12]. The water footprint can be recognized as a comprehensive indicator to evaluate the sustainable utilization of agricultural water under climate change, which reflects water volumes, water sources, and the amount of water required to eliminate agricultural water pollution [13,14,15,16]. Assessing the impact of climate change on the yield and water footprint of winter wheat could improve our understanding of the vulnerability of agricultural water systems to climate change, and also provide advice with respect to protecting water and food security in case of future climate change [17,18].
The impact of climate change on crop yield and related water footprint has been assessed around the world. [19]. Prior studies have assessed the impact of climate change on crops based on observed historical data, showing direct changes in the yield and crop growth. Lobell and Asner noted that yields of corn and soybeans tended to decrease by roughly 17% for each 1 °C increase in temperature in the growing season in the United States [20]. The sensitivity analysis provides an important approach to the assessment of the impact of climate change on crops [21,22,23]. A series of meteorological factors are sensitive to crop evapotranspiration, such as temperature [24,25,26], vapor pressure [27,28], and other climate factors [29]. These studies improve our understanding of the effects of climate change on crops. However, the changes in crop growth and yield and the related water footprint in future climate scenarios are still uncertain.
Crop models are powerful tools to predict crop growth and yield under climate change scenarios [30,31]. A number of models—such as Crop Environment Resources Synthesis (CERES), Decision Support System for Agrotechnology Transfer (DSSAT), Agriculture Production Systems Simulator (APSIM), World Food Studies (WOFOST), and Soil–Water–Atmosphere–Plant (SWAP) [32,33,34,35]—are coupled with some climate scenarios to simulate crop growth and yield. Yano et al., (2007) pointed out that the rising temperature accelerated crop development and shortened the growing period by 24 days for wheat, and the irrigation amounts would increase by 10–30% according to the CGCM2 data in a Mediterranean environment [36]. Gao et al., indicated that the crop water requirement increased by 11.6–86.2% under the impacts of climate change in the multiple cropping areas in North China [37]. Garofalo et al., demonstrated that the yield would increase by 9% while the water consumption remained stable in a continental area of Europe [38]. Boonwichai et al., pointed out the rising temperature would increase the water requirements of rice in Thailand [39]. Fu and Zhao simulated the yield and water-use efficiency of wheat under different warming rates [40].
Prior studies have made significant progress in simulating the crop growth and yield and clarifying the response of crops to climate change in many areas, using crop models [41,42,43]. However, for some especially climate-sensitive areas (e.g., temperate semi-humid and semi-arid monsoon climate areas), studies using crop models coupled with scenarios of representative concentration pathways (RCPs) are still scarce. In addition, many crop models simulate the crop growth using 2–3-year observed data (especially the genetic parameters) in the process of model calibration and validation due to a lack of long-term historical data. The short-term observed data would be not enough for estimating long-term climate change processes [44,45,46].
The Haihe River Basin (HRB) is a political, economic, and cultural center of China with 146 million inhabitants. It is also a major grain-producing area, with a total yield of 24.7 million tons of wheat. The HRB is located in the temperate semi-humid and semi-arid monsoon climate zones. The per capita water resources are 210 m3—less than 1/10 of the national average. Water resources and crop growth are sensitive to climate change in this typical water-deficient region [47,48,49]. Therefore, this paper studies the case of the HRB, and aims to (1) determine proper variety parameters of winter wheat for the simulation of long-term climate conditions, (2) assess the yield and water footprint of winter wheat in future RCP scenarios, and (3) clarify the response of yield and water footprint to climate change.

2. Methodology and Data

2.1. Study Areas

The HRB is located between 112° E–120° E and 35° N–43° N, with a drainage area of 318,200 km2. It encompasses Beijing, Tianjin, and 23 other large- and medium-sized cities. The basin is located in a continental monsoon climate zone with annual mean temperatures of −4.9–15 °C and annual precipitation ranging from 380 mm to 580 mm. The precipitation in the monsoon season (June–September) generally accounts for 70–85% of the annual total precipitation. This study collected data on soil, genetic parameters, weather, and field management from six agricultural experimental sites, i.e., Dingzhou and Luancheng in Shijiazhuang (SJZ), Miyun and Tongxian in Beijing (BJ), and Baodi and Jinghai in Tianjin (TJ). The locations of the HRB, the weather stations, and the experimental sites are shown in Figure 1.

2.2. Data Inputs, Calibration, and Validation of the DSSAT Model

The inputs of the DSSAT model include data on soil, genetic parameters, weather, and field management. The genetic parameters of wheat were calibrated and validated using the “trial and error” method, based on the historical data observed from 1993 to 2013 at six agricultural experimental sites. The data for crop growth were obtained from the China Meteorological Administration (Beijing, China) [50], which only offered data from 1993 to 2013, and did not provide data after 2014. The observed data in the periods 2005–2013 and 1993–2004 were used to calibrate and validate the model, respectively. The wheat was cultivated in rows, with spacing of 20 cm. There were 240 plants of winter wheat per square meter. Ammonium bicarbonate (NH4HCO3) was mostly applied as the fertilizer. In the model, the crops were fertilized twice in the growing period, with 86 kg of pure nitrogen per hectare each time, and were irrigated four times, with 60 mm of water each time, during the periods of wintering (12/01), stem elongation (3/29), heading (4/20), and grain filling (5/15) [51,52]. Phosphorus and potassium were not simulated in the model.
The soil data were obtained from the Chinese Soil Database [53,54]. The dominant soil type was “Loess soil,” with a texture of sandy clay loam. The diameter, nutrients, and physical and chemical properties of the soil particles are listed in Table 1 below.
The genetic parameters of winter wheat include ecological parameters and variety parameters. The default “USWH01” was used for the ecological parameters. The key variety parameters used in the model are listed in Table 2 [51,55,56]. The variety parameters were manually calibrated and validated based on the observed data from 2005–2013 and 1993–2004, respectively. The growth data were obtained from 6 agricultural experimental sites. The calibrated and validated results are shown in Table 2.
The weather data were obtained from the China Meteorological Administration [50], including daily maximum and minimum air temperatures, wind speed at 2 m height, relative humidity, and daily sunshine duration. The data were proofread and corrected and the missing data were interpolated. The weather data in average years in the HRB are shown in Table 3.
In the DSSAT model, the infiltration and soil water dynamics were simulated based on the equation provided by the Soil Conservations Service of America (Washington, DC, USA) and the one-dimensional water balance model developed by Ritchie [57] (pp. 41–54). The evapotranspiration was simulated daily using the Penman–Monteith method in FAO-56. The life cycle of winter wheat was divided into several phases, and the development rate was controlled by accumulated heat quantified by growing degree-days (GDD). The yields were simulated based on the potential seed weight and kernel numbers derived from genetic parameters and the conversion of cumulated carbohydrates.
The water consumption of winter wheat was calculated by summing up the simulated daily evapotranspiration during the growth period. The water footprints of winter wheat were calculated by dividing the amount of consumed water by the simulated crop yield [47,58].

2.3. Model Evaluation

The performance of the model was evaluated by a number of indicators named “the normalized root mean square, NRMSE”, “the coefficient of residual mass, CRM”, “the coefficient of determination for linear relationship, r2”, and “the index of agreement, d”.
The NRMSE was used to measure the relative difference between the simulated and measured values [59]. The results were graded as “excellent”, “good”, “moderate”, or “poor”, corresponding to an NRMSE of “≤10%”, “10–20%”, “20–30%”, or “≥30%”, respectively.
NRMSE = i = 1 n S i R i 2 n * 100 R ¯
where NRMSE is the normalized root-mean-square error, n is the number of samples, S i is the simulated value, R i is the observed value, and R ¯ is the average of observed values.
The CRM is an indicator of whether the model predictions tend to over- or underestimate the observed data [60]. A negative or positive CRM value indicates a tendency of the model toward over- or underestimation, respectively.
CRM = 1 i = 1 n S i i = 1 n R i
where CRM is the coefficient of residual mass.
The index of agreement (d) was used to verify the consistency between the simulated and measured values.
d = 1 i = 1 n S i R i 2 i = 1 n S i R ¯ + R i R ¯ 2
where d is the index of agreement. We considered the index of agreement between measured and simulated values to be “excellent” when d > 0.9, “good” when 0.8 ≤ d < 0.9, “moderate” when 0.7 ≤ d < 0.8, and “poor” when d < 0.7.

2.4. Simulation in Future Climate Scenarios

The IPCC distinguishes four RCPs (RCP2.6, 4.5, 6, and 8.5) based on radiative forcing levels by 2100 (from 2.6 to 8.5 W/m2) [61]. RCP2.6, RCP4.5, and RCP8.5 were employed in this study, representing pathways below the 10th percentile, moderate, and below the 90th percentile of the reference emissions range, respectively [62]. The future climate data for the RCP2.6, RCP4.5, and RCP8.5 scenarios were generated driven by the HadGEM2-ES model developed by the Hadley Centre of the UK Met Office (Exeter, UK). The generated data were scaled down to the HRB by a monthly scaling-down method.
The growth process and yield in the future were simulated by the DSSAT model coupled with RCP scenarios by creating corresponding new weather stations to store the generated weather data. The planting time of winter wheat in the RCP scenarios was assumed to be the same in the simulation model.

3. Results

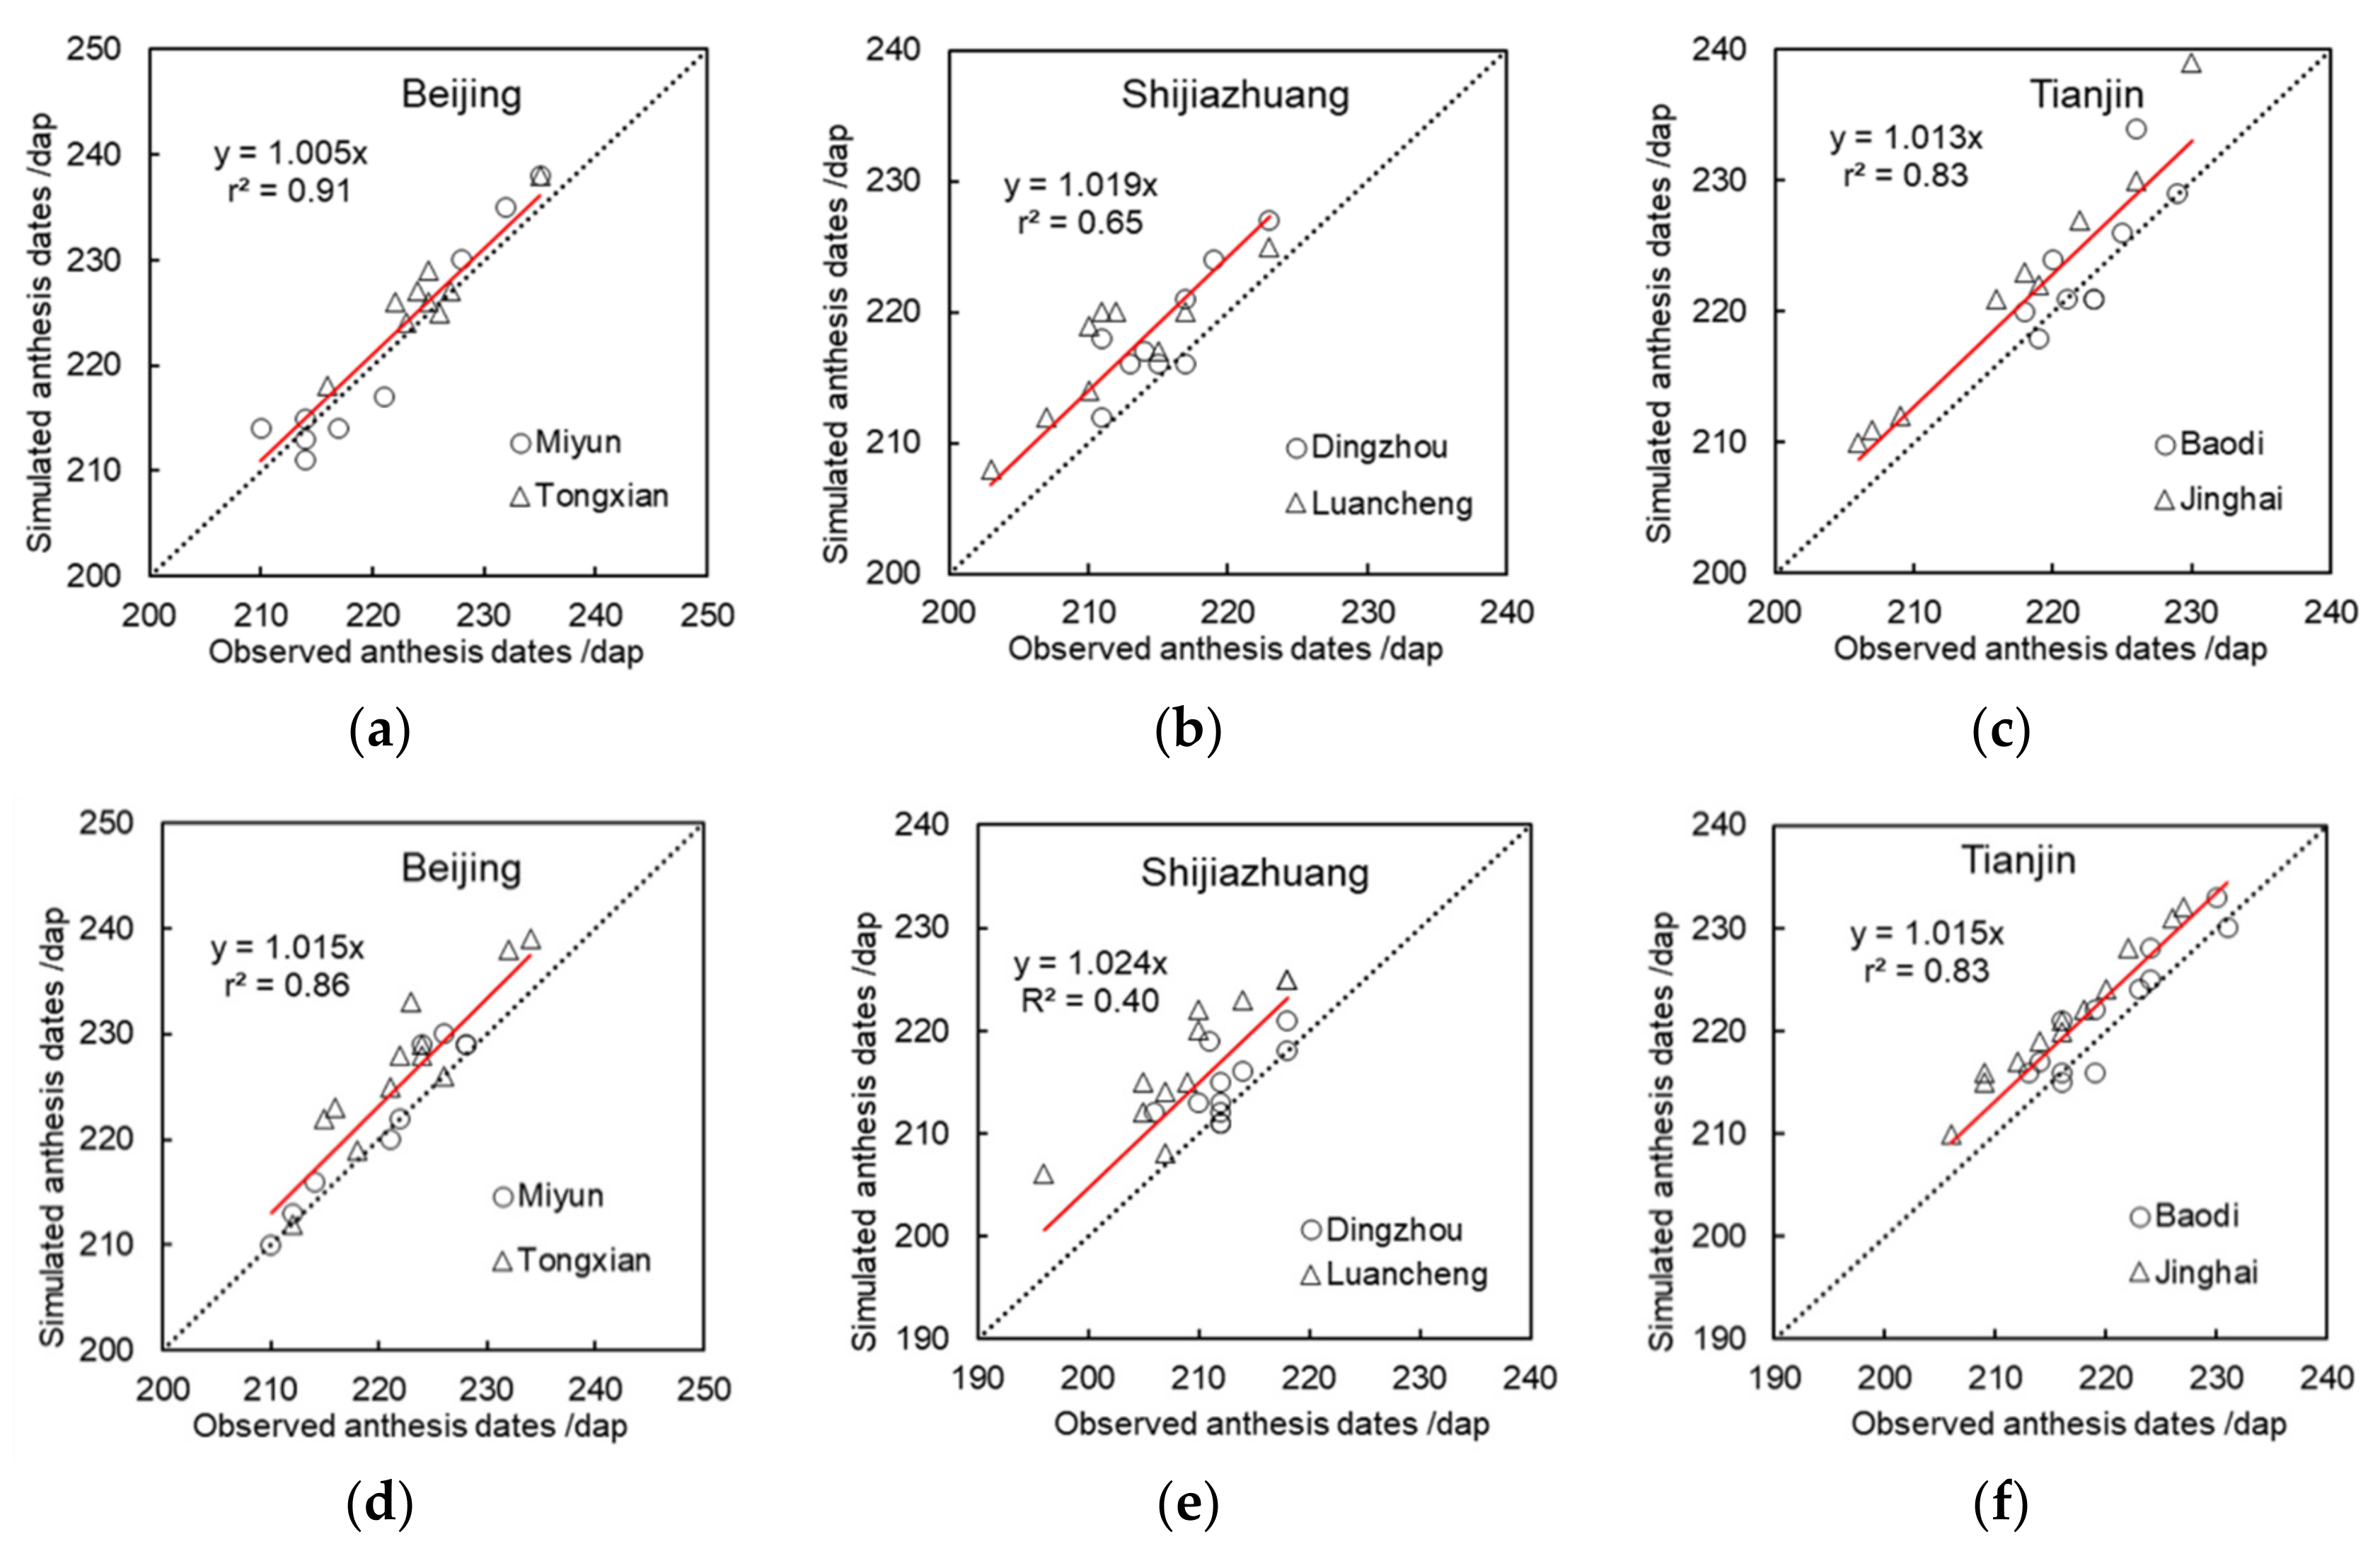
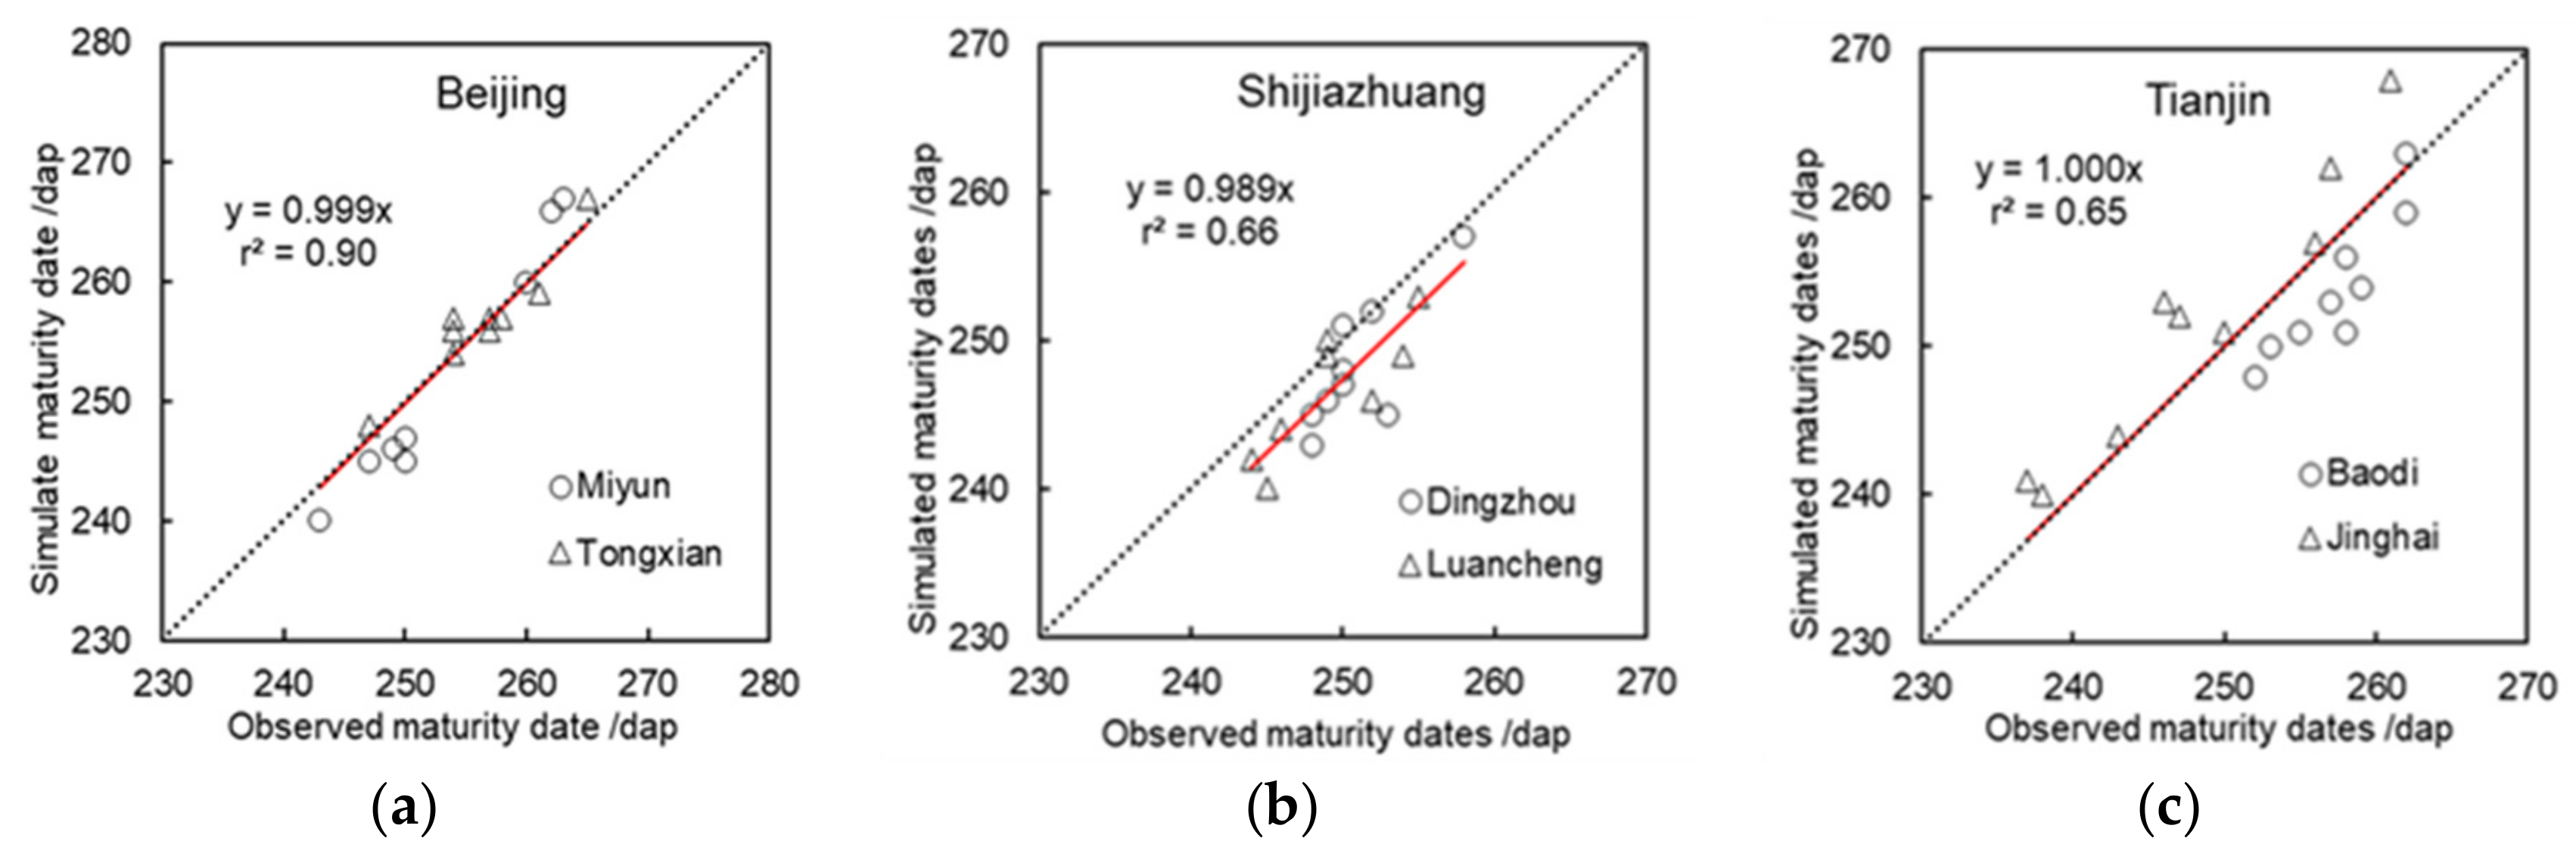
3.1. Simulation of Winter Wheat Growth and Yield Using the DSSAT Model

(1) Anthesis dates
The regression between the observed and simulated values of anthesis dates was conducted using the 1:1 line, and the results are shown in Figure 2; r2 explained most of the deviations between the simulated and measured values during calibration and validation for Beijing and Tianjin, with results ranging from 0.83 to 0.91, while for Shijiazhuang, the r2 was poor at 0.40.
The calibration and validation results for anthesis dates are shown in Table 4. The simulated mean values were 211–223 days after planting (DAP)—1–4 days later than the observed values. The NRMSE shows an “excellent” performance of the model, with values ranging from 1.9% to 2.3%. The CRM shows that the anthesis date estimated was later than the observed dates, with a range from −0.023 to −0.004. The values of “r” show that the simulated and observed days for anthesis were significantly correlated (p < 0.001).
(2) Maturity dates
The calibration and validation results of maturity dates are shown in Figure 3. Most of the deviations between the simulated and measured values could be explained by r2, with values ranging from 0.65 to 0.91, except for the validation for Shijiazhuang (0.42). The calibration and validation results for maturity dates are shown in Table 5. The simulated mean was 247–255 days after planting (DAP)—close to the observed numbers for calibration and validation, with a range from 3 days earlier to 2 days later. The NRMSE shows an “excellent” performance of the model, with values ranging from 1.0% to 1.7%. The CRM ranging from −0.008 to 0.011 also shows that the simulated values were close to the observed ones. The negative or positive values indicate that the simulated values were underestimated or overestimated compared with the observed ones, respectively. The values of “r” show that the simulated and observed days for maturity were significantly correlated (p < 0.001).
(3) Yield of winter wheat
The calibration and validation results of yield are shown in Figure 4. The NRMSE shows a “good” performance in “Shijiazhuang”, “Beijing”, and “Tianjin”, with values of 12.5%, 18.8%, and 17.5%, respectively. The index of agreement “d” shows a moderate performance in “Shijiazhuang”, “Beijing”, and “Tianjin”, with values of 0.38, 0.53, and 0.41, respectively.

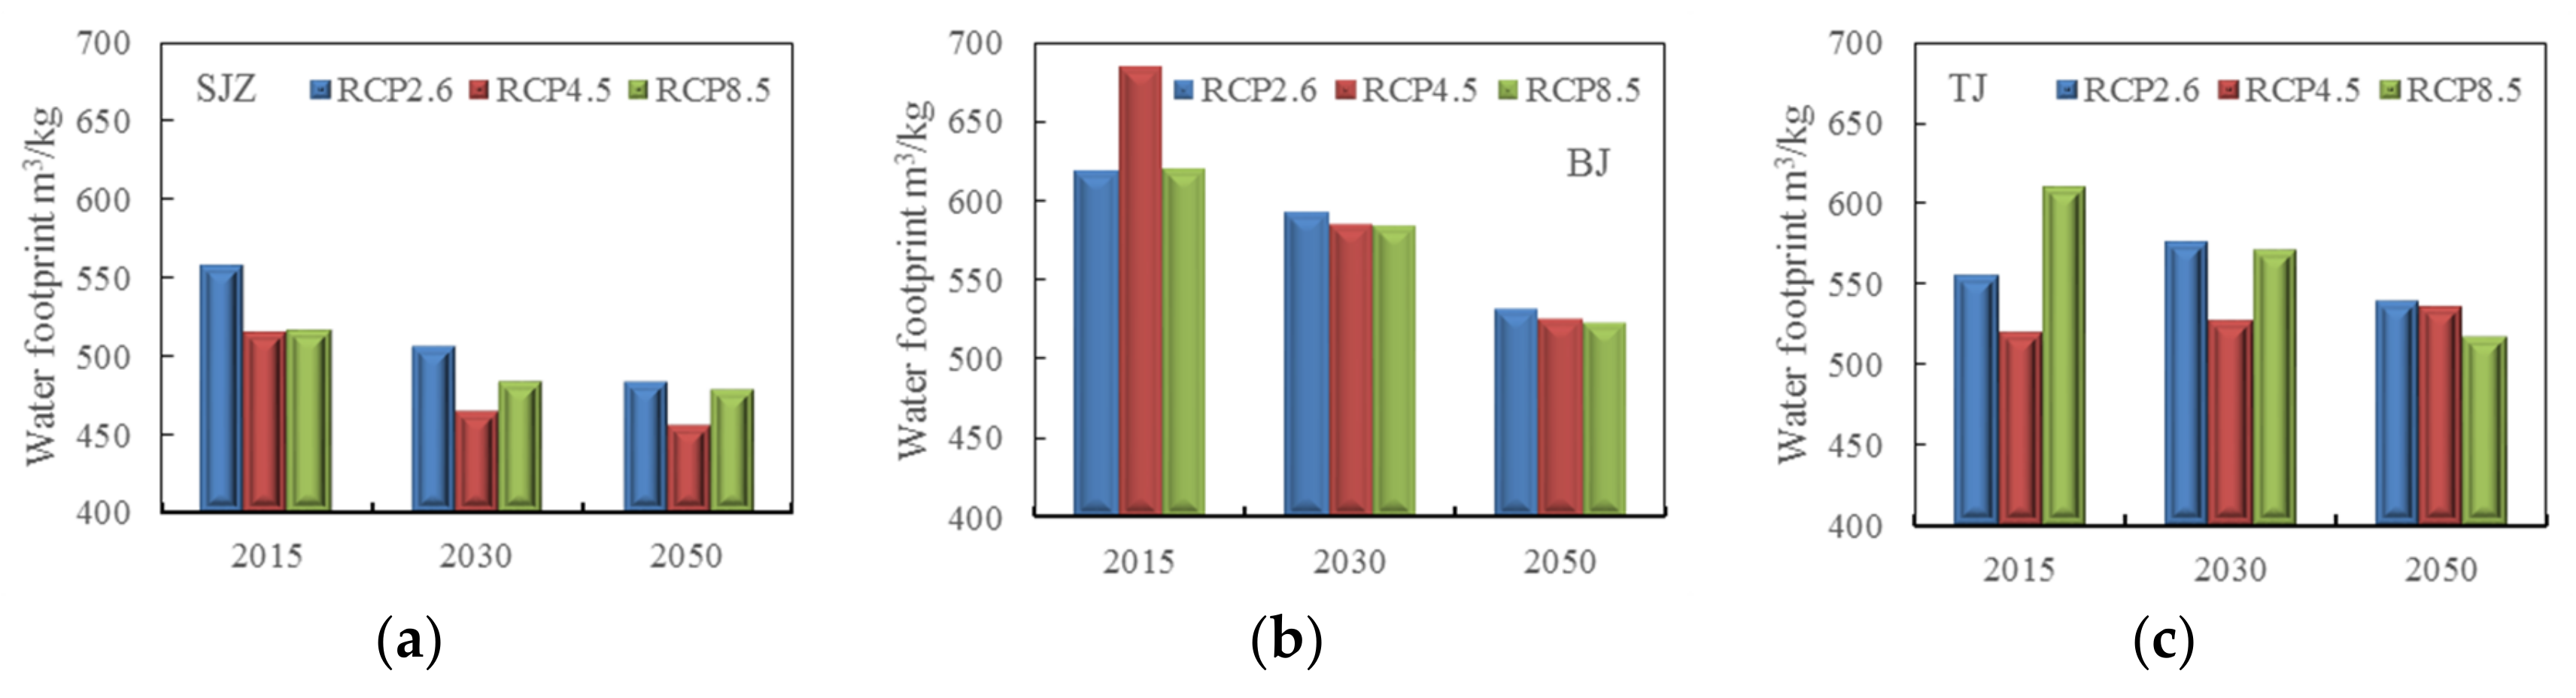
3.2. Prediction of Growth Process, Yield, and Water Footprint under RCP Scenarios

(1) Growing period
The growing periods of winter wheat were significantly shortened in the RCP2.6, RCP4.5, and RCP8.5 scenarios, as shown in Figure 5. By 2050, the growing period would be shortened by 13 days, 16 days, and 18 days compared to 2015 in the RCP2.6, RCP4.5, and RCP8.5 scenarios, respectively, meaning that the decrease was 3.6 days, 4.7 days, and 5.0 days per decade, respectively. The downward trends were more significant in Tianjin, with a decrease of 4.9 days, 5.7 days, and 6.6 days per decade in RCP2.6, RCP4.5, and RCP8.5, respectively.
(2) Crop yield
The simulation results of yields are shown in Figure 6. Although the yields increased in all climate scenarios, the increase was even greater in the low-emissions scenario of RCP2.6. By 2050, the yield would increase by 1.5 t/ha, 1.46 t/ha, and 1.39 t/ha compared to 2015, respectively. The ranges of increased yields were inhomogeneous in space. In Tianjin and Beijing, the yields increased more than those in Shijiazhuang, mainly because the starting yields in 2015 were lower in Tianjin and Beijing.
(3) Water consumption
The simulated results of water consumption during the growth process of winter wheat are shown in Figure 7. The volumes of water consumption increased in the lower emissions scenario (RCP2.6), but the trends were not significant in the RCP4.5 and RCP8.5 scenarios. These results may be related to the length of the growing period. In the RCP4.5 and RCP8.5 scenarios, the growing period was shortened by 16 and 18 days, respectively, according to the previous section of this study. From the perspective of daily water consumption in the growing period, the water consumption was increased in all scenarios.
(4) Water footprint
The simulated results for water footprint production are shown in Figure 8. The water footprints significantly decreased, indicating that the water-use efficiency would be improved—especially in high-emissions scenarios (RCP8.5). By 2030, the water footprint would decrease by 4%, 8%, and 6% in the RCP2.6, RCP4.5, and RCP8.5 scenarios, respectively. By 2050, the water footprint would decrease by 10%, 11%, and 13% in the RCP2.6, RCP4.5, and RCP8.5 scenarios, respectively. Water footprints decreased the most in Beijing in terms of space, by 14%, 23%, and 16% in the RCP2.6, RCP4.5, and RCP8.5 scenarios, respectively.

4. Discussion

The calibrated and validated results of variety parameters were compared to others in the HRB, and are shown in Table 6. Du calibrated two varieties (“41,581” and “Kenong199”) at the Luancheng agricultural experimental station in Shijiazhuang [50]. The variety of winter wheat in this study was similar to “41,581”.
The growing period decreased by 3.6 days, 4.7 days, and 5.0 days per decade in the RCP2.6, RCP4.5, and RCP8.5 scenarios, respectively, which were compared to others. Zhang et al., found that the growing period of winter wheat would be shortened by 0.84 days per decade in the combination model of BCCT63 and WOFOST [63]. Li et al., found that the growing period from sowing to ripening in the RCP8.5 climate scenario would be shortened by 4 days and 15 days in the periods 2010–2039 and 2040–2069, respectively [64]. The reason for the shorter time period in this study than in Li’s study was mainly because the observation point was at a higher latitude than Li’s, with a lower temperature and more pronounced monsoon climate—especially in Beijing and Tianjin. A few scholars indicated changes in the growing period based on historical data observed in the HRB. Ji et al., indicated that the heading and ripening dates were 4.6 days and 2.7 days earlier each decade, respectively, in 1983–2005 [65]. Yu et al., indicated that the growing period was shortened by 1.3 days per decade, and that the decreasing trend would be even faster in future climate scenarios [66]. The changes in the growing period in the RCP scenarios were related to the thermal time or so-called “growing degree-days (GDD)” [19,32]. As temperature rises, the GDD of winter wheat reaches the threshold in advance for maturity.
In Shijiazhuang, we found a relatively poor correlation (r2) for the anthesis dates and maturity dates. This is also related to the accumulation of heat. Shijiazhuang is in the south of the Haihe River Basin, and the temperature differences between spring and summer are smaller than in Beijing and Tianjin (in summer, the temperature is high in the whole basin, or even throughout China, while in the winter there is large difference between different latitudes). Hence, in Shijiazhuang the dates of anthesis (or maturity) are more centralized, as can also be seen in Figure 2 and Figure 3. This may lead to a relatively poor correlation (r2) in anthesis (or maturity) dates in Shijiazhuang than in the other two regions.
The yields showed an increasing trend in future climate scenarios. Li believed that the yields in the RCP8.5 scenario would increase by 14.88% in the period 2040–2069 [64]. Meanwhile, in this study, the yield increased by 14.7% in the RCP8.5 scenario for Shijiazhuang, which is close to Li’s estimate. Yang et al., clarified that the actual yield of winter wheat in Ningjin (a city in southern Shijiazhuang) increased by 1.36 tons per decade in the period 1982–2018 [67], while in this study, it was 0.2–0.3 tons per decade, indicating that the increasing trend would slow down in the future. The yield would increase in future climate scenarios because the increasing temperature can boost photosynthesis and dry matter accumulation in winter wheat. Among them, the effects of low- and medium-emission conditions on the increase in winter wheat yield is higher than that of high-emission conditions, because in high-emission scenarios, a higher temperature may cause damage to the growing process of crops.
By 2050, the water footprints would decrease by 10%, 11%, and 13% in the RCP2.6, RCP4.5, and RCP8.5 scenarios, respectively, indicating that the water-use efficiency would be improved. The water footprint was influenced by two factors: the water consumption during the growing seasons, and the yield. The water consumption in the growing seasons of wheat was not significantly increased—especially in high-emission scenarios—because the growth days were significantly shortened, although the daily consumption of water did increase to a certain extent. Meanwhile, the yields were increased, according to the experimental results and above analysis.
Because of the lack of data on biomass, the accuracy of yield simulation was affected. In addition to the genetic kernel numbers and the weight of winter wheat, a portion of the yield was derived from the conversion of biomass. When photosynthesis declines, the protein and carbohydrates mobilized from vegetative tissue contribute to seed growth [32]. In the future, a few parameters (e.g., biomass) should be monitored to improve the accuracy of yield simulation. In addition to climate change, the water footprint of winter wheat was also influenced by such factors as technological innovation, and their effects would be greater than the impact of climate change [68,69,70]. In the future, the influence of multiple factors on crop yield and water footprint should be considered.

5. Conclusions

In this study, the variety parameters of winter wheat were validated and verified with the DSSAT model using the long-term (1993–2013) growth and yield data observed from six agricultural experimental stations in the HRB, China. The growth processes were simulated by the DSSAT model coupled with RCP scenarios (RCP2.6, RCP4.5, and RCP8.5) driven by the HadGEM2-ES model, so as to understand the impacts of climate change on the yield and water footprint of winter wheat. The calibrated and validated variety parameters of winter wheat had high accuracy in simulating the anthesis and maturity dates, and could be used for the prediction of future winter wheat growth processes in the HRB. The results showed that future climate scenarios could speed up the growth process and improve the yield. The growing periods were significantly shortened, by 3.6 days, 4.7 days, and 5.0 days per decade in the RCP2.6, RCP4.5, and RCP8.5 scenarios, respectively, due to the rapid accumulation of heat. The yield increased more in lower emissions scenarios (by 17% in RCP2.6) than in higher emissions scenarios. In the RCP8.5 scenario, the rising temperature adversely affected the growth process of winter wheat. The water footprint decreased by 10%, 11%, and 13% in the RCP2.6, RCP4.5, and RCP8.5 scenarios, respectively, indicating that climate change could improve water-use efficiency in the future.

Author Contributions

D.J. simulated the yield and water footprint employing the DSSAT model and drafted the manuscript; C.W. and H.H. revised the manuscript; Y.H. designed the methodology; and H.X. processed the historical and future climate data. All authors have read and agreed to the published version of the manuscript.

Funding

This study was funded by the National Natural Science Foundation of China (51679089; 52009043).

Institutional Review Board Statement

Not applicable.

Informed Consent Statement

Not applicable.

Data Availability Statement

The crop growth data from 1993 to 2013 and climate data can be found from China Meteorological Data Service Centre: http://data.cma.cn (accessed on 29 November 2016). The soil data are available from the Chinese Soil Database or Harmonized World Soil Database (Version 1.1), which can be download at: http://webarchive.iiasa.ac.at/Research/LUC/External-World-soil-database/HTML/index.html?sb=1 (accessed on 17 March 2022).

Acknowledgments

The authors appreciate Henan Key Laboratory of Water Resources Conservation and Intensive Utilization in the Yellow River Basin for its support. The authors also thank the editor and three anonymous reviewers for their insightful comments and constructive suggestions.

Conflicts of Interest

The authors declare no conflict of interest.

References

  1. Pachauri, R.K.; Reisinger, A. (Eds.) Climate Change: Synthesis Report; IPCC: Geneva, Switzerland, 2014. [Google Scholar]
  2. Masson-Delmotte, V.P.; Zhai, A.; Pirani, S.L. (Eds.) Climate Change 2021: The Physical Science Basis. Contribution of Working Group I to the Sixth Assessment Report of the Intergovernment Panel on Climate Change; Cambridge University Press: Cambridge, UK, 2021. [Google Scholar]
  3. Schmidhuber, J.; Tubiello, F.N. Global food security under climate change. Proc. Natl. Acad. Sci. USA 2007, 104, 19703–19708. [Google Scholar] [CrossRef] [PubMed] [Green Version]
  4. Piao, S.; Ciais, P.; Huang, Y.; Shen, Z.; Peng, S.; Li, J.; Fang, J. The impacts of climate change on water resources and agriculture in China. Nature 2010, 467, 43–51. [Google Scholar] [CrossRef] [PubMed]
  5. Elbeltagi, A.; Aslam, M.R.; Malik, A.; Mehdinejadiani, B.; Srivastava, A.; Bhatia, A.S.; Deng, J. The impact of climate changes on the water footprint of wheat and maize production in the Nile Delta, Egypt. Sci. Total Environ. 2020, 743, 140770. [Google Scholar] [CrossRef] [PubMed]
  6. Asseng, S.; Ewert, F.; Martre, P.; Rötter, R.P.; Lobell, D.B.; Cammarano, D.; Zhu, Y. Rising temperatures reduce global wheat production. Nat. Clim. Chang. 2015, 5, 143–147. [Google Scholar] [CrossRef]
  7. Shrestha, S.; Chapagain, R.; Babel, M.S. Quantifying the impact of climate change on crop yield and water footprint of rice in the Nam Oon Irrigation Project, Thailand. Sci. Total Environ. 2017, 599–600, 689–699. [Google Scholar] [CrossRef]
  8. Das, J.; Poonia, V.; Jha, S.; Goyal, M.K. Understanding the climate change impact on crop yield over Eastern Himalayan Region: Ascertaining GCM and scenario uncertainty. Theor. Appl. Climatol. 2020, 142, 467–482. [Google Scholar] [CrossRef]
  9. Deihimfard, R.; Rahimi-Moghaddam, S.; Collins, B.; Azizi, K. Future climate change could reduce irrigated and rainfed wheat water footprint in arid environments. Sci. Total Environ. 2021, 807, 150991. [Google Scholar] [CrossRef]
  10. Felzer, B.; Heard, P. Precipitation differences amongst GCMs used for the U.S. national assessment. JAWRA J. Am. Water Resour. Assoc. 1999, 35, 1327–1340. [Google Scholar] [CrossRef]
  11. Nijssen, B.; O’Donnell, G.M.; Hamlet, A.F.; Lettenmaier, D.P. Hydrologic sensitivity of global rivers to climate change. Clim. Chang. 2001, 50, 143–175. [Google Scholar] [CrossRef]
  12. Alexander, L.V.; Zhang, X.; Peterson, T.C.; Caesar, J.; Gleason, B.; Klein Tank, A.M.G.; Haylock, M.; Collins, D.; Trewin, B.; Rahimzadeh, F.; et al. Global observed changes in daily climate extremes of temperature and precipitation. J. Geophys. Res. 2006, 111, D05109. [Google Scholar] [CrossRef] [Green Version]
  13. Hoekstra, A.Y. (Ed.) Virtual Water Trade. In Virtual Water Trade, Proceedings of the International Expert Meeting on Virtual Water Trade, Delft, The Netherlands, 12–13 December 2002; UNESCO-IHE: Delft, The Netherlands, 2003. [Google Scholar]
  14. Hoekstra, A.Y. Water footprint assessment: Evolvement of a new research field. Water Resour. Manag. 2017, 31, 3061–3081. [Google Scholar] [CrossRef] [Green Version]
  15. Hoekstra, A.Y.; Chapagain, A.K.; Aldaya, M.M.; Mekonnen, M.M. The Water Footprint Manual: Setting the Global Standard; Earthscan: London, UK, 2011. [Google Scholar]
  16. Mekonnen, M.M.; Hoekstra, A.Y. The green, blue and grey water footprint of crops and derived crop products. Hydrol. Earth Syst. Sci. 2011, 15, 1577–1600. [Google Scholar] [CrossRef] [Green Version]
  17. Huang, H.P.; Han, Y.P.; Jia, D.D. Impact of climate change on the blue water footprint of agriculture on regional scale. Water Sci. Technol. Water Supply 2019, 19, 52–59. [Google Scholar] [CrossRef] [Green Version]
  18. Arshad Awan, Z.; Khaliq, T.; Masood Akhtar, M.; Imran, A.; Irfan, M.; Jarrar Ahmed, M.; Ahmad, A. Building climate-resilient cotton production system for changing climate scenarios using the DSSAT model. Sustainability 2021, 13, 10495. [Google Scholar] [CrossRef]
  19. Govere, S.; Nyamangara, J.; Nyakatawa, E.Z. Climate change signals in the historical water footprint of wheat production in Zimbabwe. Sci. Total Environ. 2020, 742, 140473. [Google Scholar] [CrossRef]
  20. Lobell, D.B.; Asner, G.P. Climate and management in U.S. agricultural yields. Science 2003, 299, 1032. [Google Scholar] [CrossRef]
  21. Gong, L.; Xu, C.Y.; Chen, D.; Halldin, S.; Chen, Y.D. Sensitivity of the Penman-Monteith reference evapotranspiration to key climatic variables in the Changjiang (Yangtze River) basin. J. Hydrol. 2006, 329, 620–629. [Google Scholar] [CrossRef]
  22. Sharifi, A.; Dinpashoh, Y. Sensitivity Analysis of the Penman-Monteith reference Crop Evapotranspiration to Climatic Variables in Iran. Water Resour. Manag. 2014, 28, 5465–5476. [Google Scholar] [CrossRef]
  23. Tuninetti, M.; Tamea, S.; D’Odorico, P.; Laio, F.; Ridolfi, L. Global sensitivity of high-resolution estimates of crop water footprint. Water Resour. Res. 2015, 51, 8257–8272. [Google Scholar] [CrossRef] [Green Version]
  24. Yang, J.; Liu, C.; Qiao, F.; Juan, D.U.; Wang, M. Seasonal response of reference crop evapotranspiration to key climatic variables in North China Plain. Clim. Environ. Res. 2016, 21, 418–428. [Google Scholar]
  25. Liang, L.; Li, L.; Li, Z.; Li, J.; Jiang, D.; Xu, M.; Song, W. Sensitivity on the reference crop evapotranspiration in growing season in the West Songnen Plain. Trans. Chin. Soc. Agric. Eng. 2008, 5, 1–5. (In Chinese) [Google Scholar]
  26. Wang, Z.; Fang, G.; Zhang, H.; Tang, X.; Duan, L. Sensitivity Analysis of crop water requirement to meteorological factors in Aksu Irrigation Area. Desert Oasis Meteorol. 2018, 12, 33–39. [Google Scholar]
  27. Liu, C.; Zhang, D. Temporal and spatial changes analysis of the sensitivity of potential evapotranspiration to meteorological influencing factors in China. Acta Geogr. Sin. 2011, 66, 579–588. [Google Scholar]
  28. Liu, X.; Zheng, H.; Liu, C. Sensitivity of the potential evapotranspiration to key climatic variables in the Haihe River Basin. Resour. Sci. 2009, 31, 1470–1476. (In Chinese) [Google Scholar]
  29. Yang, J.; Liu, Q.; Mei, X.; Yan, C.; Hui, J.; Xu, J. Spatiotemporal characteristics of reference evapotranspiration and its sensitivity coefficients to climate factors in Huang-Huai-Hai Plain, China. J. Integr. Agric. 2013, 12, 2280–2291. [Google Scholar] [CrossRef]
  30. Dettori, M.; Cesaraccio, C.; Motroni, A.; Spano, D.; Duce, P. Using CERES-Wheat to simulate durum wheat production and phenology in Southern Sardinia. Field Crop Res. 2011, 102, 179–188. [Google Scholar] [CrossRef]
  31. Jing, Q.; McConkey, B.; Qian, B.; Smith, W.N.; Luce, M.S. Assessing water management effects on spring wheat yield in the Canadian Prairies using DSSAT wheat models. Agric. Water Manag. 2021, 244, 106591. [Google Scholar] [CrossRef]
  32. Jones, J.W.; Hoogenboom, G.; Porter, C.H.; Boote, K.J.; Batchelor, W.D.; Hunt, L.A.; Wilkens, P.W.; Singh, U.; Gijsman, A.J.; Ritchie, J.T. The DSSAT cropping system model. Eur. J. Agron. 2003, 18, 235–265. [Google Scholar] [CrossRef]
  33. Kroes, J.G.; Van Dam, J.C. Reference manual SWAP version 3.0.3. In Alterra-Report: Alterra Green World Research; Wageningen University and Research Centre: Wageningen, The Netherlands, 2003; Volume 773, pp. 1–211. [Google Scholar]
  34. Kroes, J.G.; Wesseling, J.G.; Van Dam, J.C. Integrated modelling of the soil–water -atmosphere-plant system using the model SWAP 2.0, an overview of theory and an application. Hydrol. Process 2000, 14, 1993–2002. [Google Scholar] [CrossRef]
  35. Hoogenboom, G.; Jones, J.E.; Wikens, P.W.; Porter, C.Q.; Boote, K.J.; Hunt, L.D.; Singh, U.; Lizaso, J.I.; White, J.M.; Uryasev, O. (Eds.) Decision Support System for Agro-technology Transfer (DSSAT); Version 4.5; University of Hawaii: Honolulu, HI, USA, 2010. [Google Scholar]
  36. Yano, T.; Aydin, M.; Haraguchi, T. Impact of climate change on irrigation demand and crop growth in a Mediterranean environment of Turkey. Sensors 2007, 7, 2297–2315. [Google Scholar] [CrossRef] [Green Version]
  37. Gao, J.; Yang, X.; Zheng, B.; Liu, Z.; Zhao, J.; Sun, S.; Li, K.; Dong, C. Effects of climate change on the extension of the potential double cropping region and crop water requirements in Northern China. Agric. For. Meteorol. 2019, 268, 146–155. [Google Scholar] [CrossRef]
  38. Garofalo, P.; Ventrella, D.; Kersebaum, K.C.; Gobin, A.; Trnka, M.; Giglio, L.; Dubrovsky, M.; Castellini, M. Water footprint of winter wheat under climate change: Trends and uncertainties associated to the ensemble of crop models. Sci. Total Environ. 2019, 658, 1186–1208. [Google Scholar] [CrossRef]
  39. Boonwichai, S.; Shrestha, S.; Babel, M.S.; Weesakul, S.; Datta, A. Climate change impacts on irrigation water requirement, crop water productivity and rice yield in the Songkhram River Basin, Thailand. J. Clean. Prod. 2018, 198, 1157–1164. [Google Scholar] [CrossRef]
  40. Fu, L.T.; Zhao, Z. Impacts of climate change as a function of global mean temperature: Maize productivity and water use in China. Clim. Chang. 2011, 105, 409–422. [Google Scholar]
  41. Rahimi-Moghaddam, S.; Kambouzia, J.; Deihimfard, R. Adaptation strategies to lessen negative impact of climate change on grain maize under hot climatic conditions: A model-based assessment. Agric. For. Meteorol. 2018, 253–254, 1–14. [Google Scholar] [CrossRef]
  42. Phetheet, J.; Hill, M.C.; Barron, R.W.; Rossi, M.W.; Amanor-Boadu, V.; Wu, H.; Kisekka, I. Consequences of climate change on food-energy-water systems in arid regions without agricultural adaptation, analyzed using FEWCalc and DSSAT. Resources. Conserv. Recycl. 2020, 168, 105309. [Google Scholar] [CrossRef]
  43. Tooley, B.E.; Mallory, E.B.; Porter, G.A.; Hoogenboom, G. Predicting the response of a potato-grain production system to climate change for a humid continental climate using DSSAT. Agric. For. Meteorol. 2021, 307, 108452. [Google Scholar] [CrossRef]
  44. Masud, M.B.; McAllister, T.; Cordeiro, M.R.C.; Faramarzi, M. Modelling future water footprint of barley production in Alberta, Canada: Implications for water use and yields to 2064. Sci. Total Environ. 2018, 616–617, 208–222. [Google Scholar] [CrossRef]
  45. Mubeen, M.; Ahmad, A.; Hammad, H.M.; Awais, M.; Farid, H.U.; Saleem, M.; ul Din, M.S.; Amin, A.; Ali, A.; Fahad, S.; et al. Evaluating the climate change impact on water use efficiency of cotton-wheat in semi-arid conditions using DSSAT model. J. Water Clim. Chang. 2020, 11, 1661–1675. [Google Scholar] [CrossRef]
  46. Alejo, L.A. Assessing the impacts of climate change on aerobic rice production using the DSSAT-CERES-Rice model. J. Water Clim. Chang. 2021, 12, 1–13. [Google Scholar] [CrossRef]
  47. Han, Y.P.; Jia, D.D.; Zhuo, L.; Sauvage, S.; Sánchez-Pérez, J.M.; Huang, H.P.; Wang, C.Y. Assessing the Water Footprint of Wheat and Maize in Haihe River Basin, Northern China (1956–2015). Water 2018, 10, 867. [Google Scholar] [CrossRef] [Green Version]
  48. Bao, Z.X.; Zhang, J.Y.; Wang, G.Q.; Fu, G.B.; He, R.M.; Yan, X.L.; Jin, J.L.; Liu, Y.L.; Zhang, A.J. Attribution for decreasing stream flow of the Haihe River Basin, northern China: Climate variability or human activities? J. Hydrol. 2012, 460–461, 117–129. [Google Scholar] [CrossRef]
  49. Zou, J.; Xie, Z.H.; Zhan, C.S.; Qin, P.H.; Sun, Q.; Jia, B.H.; Xia, J. Effects of anthropogenic groundwater exploitation on land surface processes: A case study of the Haihe River Basin, northern China. J. Hydrol. 2015, 524, 625–641. [Google Scholar] [CrossRef]
  50. CMA (China Meteorological Administration). China Meteorological Data Sharing Service System, Beijing, China. Available online: http://data.cma.cn/ (accessed on 29 November 2016).
  51. Du, X.Y. Study on Optimal Irrigation Scheme of Winter Wheat in North China Based on DSSAT Model. Master’s Thesis, Hebei Normal University, Shijiazhuang, China, 2016. (In Chinese). [Google Scholar]
  52. Liu, J.G.; Chu, Q.Q.; Wang, G.Y.; Chen, F.; Zhang, Y.Y. Simulation yield gap of winter wheat in response to nitrogen management in North China Plain based on DSSAT model. Trans. Chin. Soc. Agric. Eng. 2013, 29, 124–129. (In Chinese) [Google Scholar]
  53. FAO; IIASA; ISRIC; ISS-CAS; JRC. Harmonized World Soil Database; Version 1.1; FAO: Rome, Italy; IIASA: Laxenburg, Austria, 2009. [Google Scholar]
  54. Shi, X.Z.; Yu, D.S.; Warner, E.D.; Pan, X.Z.; Petersen, G.W.; Gong, Z.G.; Weindorf, D.C. Soil database of 1: 1,000,000 digital soil survey and reference system of the Chinese genetic soil classification system. Soil Surv. Horiz. 2004, 45, 129–136. [Google Scholar] [CrossRef]
  55. Cong, Z.T.; Xin, R.; Yao, B.Z.; Lei, Z.D. Impact of climate change on water use of winter wheat with HadCM3 model. J. Hydraul. Eng. 2010, 41, 1101–1107. (In Chinese) [Google Scholar]
  56. Chen, S.; He, L.; Cao, Y.; Wang, R.; Wu, L.; Wang, Z.; Zou, Y.; Siddique, K.H.M.; Xiong, W.; Liu, M.; et al. Comparisons among four different upscaling strategies for cultivar genetic parameters in rain-fed spring wheat phenology simulations with the DSSAT-CERES-Wheat model. Agric. Water Manag. 2021, 258, 107181. [Google Scholar] [CrossRef]
  57. Ritchie, J.T. Soil water balance and plant stress. In Understanding Options for Agricultural Production; Tsuji, G.Y., Hoogenboom, G., Thornton, P.K., Eds.; Kluwer Academic Publishers: Dordrecht, The Netherlands, 1998; pp. 41–54. [Google Scholar]
  58. Muratoglu, A. Assessment of wheat’s water footprint and virtual water trade: A case study for Turkey. Ecol. Processes 2020, 9, 1–16. [Google Scholar] [CrossRef] [Green Version]
  59. Liu, H.L.; Liu, H.B.; Lei, Q.L.; Zhai, L.M.; Wang, H.Y.; Zhang, J.Z.; Zhu, Y.P.; Liu, S.P.; Li, S.J.; Zhang, J.S. Using the DSSAT model to simulate wheat yield and soil organic carbon under a wheat-maize cropping system in the North China Plain. J. Integr. Agric. 2017, 16, 2300–2307. [Google Scholar] [CrossRef] [Green Version]
  60. Xevi, E.; Gilley, J.; Feyen, J. Comparative study of two crop yield simulation models. Agric. Water Manag. 1996, 30, 155–173. [Google Scholar] [CrossRef]
  61. Van Vuuren, D.P.; Edmonds, J.; Kainuma, M.; Riahi, K.; Thomson, A.; Hibbard, K.; Hurtt, G.C.; Kram, T.; Krey, V.; Lamarque, J.F.; et al. The representative concentration pathways: An overview. Clim. Chang. 2011, 81, 119–159. [Google Scholar] [CrossRef] [Green Version]
  62. Moss, R.; Babiker, M.; Brinkman, S.; Calvo, E.; Carter, T.; Edmonds, J.A.; Elgizouli, I.; Emori, S.; Lin, E.; Hibbard, K.; et al. Towards New Scenarios for Analysis of Emissions, Climate Change, Impacts, and Response Strategies; IPCC: Noordwijkerhout, The Netherlands, 2007. [Google Scholar]
  63. Zhang, J.P.; Zhao, Y.X.; Wang, C.Y.; He, Y. Effect of climate change on winter wheat growth and yield in North China. Chin. J. Appl. Ecol. 2006, 17, 1179–1184. (In Chinese) [Google Scholar]
  64. Li, X.X. The Impact of Future Climate Change on Winter Wheat and the Adaptive Capacity of Technologies to Drought Risks in the Huang-Huai-Hai Plain. Master’s Thesis, Chinese Academy of Agricultural Sciences, Beijing, China, 2017. (In Chinese). [Google Scholar]
  65. Ji, X.J.; Zhu, Y.Y.; Liu, X.Y.; Xiong, S.P.; Wang, G. Impacts of climate change on the winter wheat growth stage in North China. Chin. J. Agrometeorol. 2011, 32, 561–581. (In Chinese) [Google Scholar]
  66. Yu, W.D.; Zhao, G.Q.; Chen, H.L. Impacts of climate change on growing stages of main crops in Henan province. Chin. J. Agrometeorol. 2007, 28, 9–12. (In Chinese) [Google Scholar]
  67. Yang, L.; Liu, H.J.; Tang, X.P.; Feng, D.X.; Li, L. Effect of climate change on winter wheat yield in low/high yield years in Ningjin Country, Hebei Province. South North Water Transf. Water Sci. Technol. 2021, 19, 971. (In Chinese) [Google Scholar]
  68. Sun, S.; Wu, P.; Wang, Y.; Zhao, X.; Liu, J.; Zhang, X. The impacts of interannual climate variability and agricultural inputs on water footprint of crop production in an irrigation district of China. Sci. Total Environ. 2013, 444, 498–507. [Google Scholar] [CrossRef]
  69. Zhi, Y.; Yang, Z.F.; Yin, X.A. Decomposition analysis of water footprint changes in a water-limited river basin: A case study of the Haihe River basin, China. Hydrol. Earth Syst. Sci. 2014, 18, 1549–1559. [Google Scholar] [CrossRef] [Green Version]
  70. Feng, L.; Chen, B.; Hayat, T.; Alsaedi, A.; Ahmad, B. The driving force of water footprint under the rapid urbanization process: A structural decomposition analysis for Zhangye city in China. J. Clean. Prod. 2017, 163, 322–328. [Google Scholar] [CrossRef]
Figure 1. Locations of the study areas and agricultural experiment stations.
Atmosphere 13 00630 g001
Figure 2. Calibration and validation results of anthesis dates. (ac) are calibration results for Beijing, Shijiazhuang, and Tianjin, respectively; (df) are validation results for Beijing, Shijiazhuang, and Tianjin, respectively.
Atmosphere 13 00630 g002
Figure 3. Calibration and validation results of the DSSAT model for maturity. (ac) are calibration results for Beijing, Shijiazhuang, and Tianjin, respectively; (df) are validation results for Beijing, Shijiazhuang, and Tianjin, respectively.
Atmosphere 13 00630 g003aAtmosphere 13 00630 g003b
Figure 4. Calibration and validation results of yield for winter wheat. (ac) are simulated yield for Shijiazhuang, Beijing, and Tianjin, respectively.
Atmosphere 13 00630 g004
Figure 5. The growing period of wheat in the different RCP scenarios. (ac) are growth period for Shijiazhuang, Beijing, and Tianjin, respectively.
Atmosphere 13 00630 g005
Figure 6. The yield of wheat in the different RCP scenarios. (ac) are yield for Shijiazhuang, Beijing, and Tianjin, respectively.
Atmosphere 13 00630 g006
Figure 7. The water consumption of winter wheat in the different RCP scenarios. (ac) are water consumption for Shijiazhuang, Beijing, and Tianjin, respectively.
Atmosphere 13 00630 g007
Figure 8. The water footprint of wheat in the different RCP scenarios. (ac) are water footprint for Shijiazhuang, Beijing, and Tianjin, respectively.
Atmosphere 13 00630 g008
Table 1. Typical characteristics of soil in HRB.
Soil TypeRelative Thickness
(cm)
The Percentage of Soil SizeNutrients, and Physical and Chemical Properties
2–0.02
mm
0.02–0.002
mm
<0.002
mm
Loess1861.223.5515.3Cation exchange capacity: 11.5 cmol/(+); organic matter: 8.3 g/kg; total nitrogen: 0.59 g/kg; total phosphorus: 0.46 g/kg; total potassium: 17.5 g/kg; water extraction pH: 8.2.
2362.7923.1815.1
7656.4325.7217.9
3356.1326.9316.9
Table 2. The variety parameters of winter wheat.
ParametersExplanations [32]ShijiazhuangBeijingTianjin
PIVVernalization sensitivity coefficient, days353515
PIDPhotoperiod sensitivity coefficient, %h756565
P5Thermal time from the onset of linear filling to maturity, °C.days550550550
G1Kernel number per unit stem + spike weight at anthesis, numbers/g171515
G2Standard kernel size under optimal conditions, mg323030
G3Standard, non-stressed dry weight of a single tiller at maturity, g1.41.41.1
PHINTThermal time between the appearance of leaf tips, °C.days707070
Table 3. The average weather data in the study areas.
Precipitation (mm)Min. Temperature (°C)Max. Temperature (°C)Wind Speed (m/s)Relative Humidity (%)Sunshine Hours (h)
Shijiazhuang5109.919.51.557.02135
Beijing4968.518.52.352.72425
Tianjin5279.218.11.259.12244
Table 4. Calibration and validation results of the DSSAT model for anthesis dates.
ParametersShijiazhuangBeijingTianjin
ObsSimObsSimObsSim
CalibrationMean214218223224220223
Standard deviation5.14.87978
Minimum203208210211206210
Maximum223227235238230239
Data number181818
r0.85 ***0.96 ***0.91 ***
NRMSE, %2.31.21.9
CRM−0.019−0.004−0.013
d0.210.030.09
ValidationMean211216222225218222
Standard deviation5.25.37876
Minimum196206210210206210
Maximum218225234239231233
Data number222124
r0.71 ***0.93 ***0.92 ***
nRMSE, %31.91.8
CRM−0.023−0.015−0.015
d0.310.090.10
Notes: *** represents significance levels of 0.001; “Obs” means observation values; “Sim” means simulation values.
Table 5. Calibration and validation results of the DSSAT model for maturity dates.
ParametersShijiazhuangBeijingTianjin
ObsSimObsSimObsSim
CalibrationMean250247255255253253
Standard deviation3.64.36.48.27.87.3
Minimum244240243240237240
Maximum258257265267262268
Data number171718
r0.81 ***0.97 ***0.84 ***
nRMSE, %1.41.01.7
CRM0.0110.001−0.000
ValidationMean248247251253252253
Standard deviation2.84.56.68.86.26.4
Minimum243238240241242241
Maximum253256265269263262
Data number181724
r0.65 **0.92 ***0.76 ***
nRMSE, %1.41.71.7
CRM0.004−0.008−0.002
Notes: ** and *** represent significance levels of 0.01 and 0.001, respectively. “Obs” means observation values; “Sim” means simulation values.
Table 6. Comparison of the current study vs. others.
PIVPIDP5G1G2G3PHINT
Current study357555017321.470
“41,581”32.7682.79558.217.1634.311.14470
“Kenong199”39.2259.13656.317.5537.771.93370
Publisher’s Note: MDPI stays neutral with regard to jurisdictional claims in published maps and institutional affiliations.

