Article

Extreme Rainfall Simulations with Changing Resolution of Orography Based on the Yin-He Global Spectrum Model: A Case Study of the Zhengzhou 20·7 Extreme Rainfall Event

1
College of Computer Science and Technology, National University of Defense Technology, Changsha 410000, China
2
College of Meteorology and Oceanography, National University of Defense Technology, Changsha 410000, China
*
Author to whom correspondence should be addressed.
Atmosphere 2022, 13(4), 600; https://doi.org/10.3390/atmos13040600
Submission received: 10 March 2022 / Revised: 23 March 2022 / Accepted: 6 April 2022 / Published: 8 April 2022
(This article belongs to the Special Issue Weather Conditions Triggering Floods)

Abstract

:
In recent years, the study of numerical weather prediction (NWP) in complex orographic areas has attracted a great deal of attention. Complex orography plays an important role in the occurrence and development of extreme rainfall events. In this study, the Yin–He Global Spectrum Model (YHGSM) was used, and the wave number truncation method was employed to decompose the orographic data to different resolutions. The obtained orographic data with different resolutions were used to simulate the extreme rainfall in Zhengzhou, Henan Province, China, to discuss the degree of influence and mechanism of the different orographic resolutions on the extreme rainfall. The results show that the simulation results of the YHGSM with high-resolution orography are better than those of the low-resolution orography in terms of the rainfall intensity and range. When the rainfall intensity is higher, the results of the low-resolution orography simulated the rainfall range of big heavy rainfall better. The orography mainly affected the rainfall by affecting the velocity of the updraft, but it had a limited influence on the maximum height that the updraft could reach. A strong updraft is one of the key factors leading to extreme rainfall in Henan Province. When the orographic resolution changes, the sensitivity of the vertical velocity of the updraft to the orographic resolution is the greatest, the sensitivity of the upper-air divergence and low-level vorticity to the orographic resolution is lower than that of the vertical velocity. In conclusion, the high-resolution orography is helpful in improving the model’s prediction of extreme rainfall, and when predicting extreme rainfall in complex orographic areas, forecasters may need to artificially increase rainfall based on model results.

1. Introduction

The accurate prediction of rainfall via numerical weather prediction (NWP) can make up for the lack of precipitation data in areas where meteorological stations are scarce or insufficient, which is very important for gaining a better understanding of and conducting research on the hydrological cycle and for water management planning. Moreover, rainfall also has a significant impact on the other physical components involved in earth system modeling [1]. However, the current global and regional NWP models still have the problem of inaccurate prediction in complex orographic regions [2,3,4,5]. Due to the limitations of NWP models’ resolution and orographic resolution, NWP models cannot fully resolve the orographic effects of extreme rainfall in complex orographic areas. Although the parameterization of physical processes related to rainfall and orography compensates for the unresolved part of the models, these parameterization schemes also bring a lot of uncertainty to the NWP models. In addition, due to the involvement of a large number of physical processes and interactions between different processes, it is still difficult for current NWP models to accurately predict the range and level of extreme rainfall. For example, Moya-Álvarez et al. [6] evaluated the rainfall simulation of the Weather Research and Forecasting (WRF) model over the complex Peruvian orography, and they simulated nine 10-day rainfall and five extreme rainfall events in their experiments. Overall, the model overestimated the rainfall, but in the case of the five extreme rainfall events, it underestimated the rainfall. Yáñez-Morroni et al. [7] also found that the NWP model was not ideal for simulating rainfall in complex orographic areas. They conducted numerical simulations of rainfall events in complex orography, such as Chilean mountainous terrain and foothills, and found that some problems remained. The NWP models remain a challenge for extreme rainfall prediction over complex orography.
Complex orography can lead to intense extreme rainfall [8]. Extreme rainfall not only causes a great deal of damage to the environment, but it also may pose a great threat to the property and lives of local residents. From 19–21 July 2021, the biggest super rainstorm in history occurred in Zhengzhou, Henan Province, central China, causing hundreds of deaths, dozens of missing people, and severe property loss [9,10]. The orography around Zhengzhou, China, is complex, and it is also an area with frequent rainstorms over the years. Therefore, it is of great significance to study the extreme rainfall in the surrounding areas of Zhengzhou to protect people’s lives and safety, and to provide a useful reference for extreme rainfall prediction in other complex orographic areas. The extreme rainfall in Henan Province was mainly affected by the orography, typhoon In-Fa, typhoon Cempaka, the Western Pacific Subtropical High (WPSH), and other systems. The orography played a role in blocking and uplifting airflow. The combined action of the two typhoons and the WPSH formed a strong water vapor transport channel, which led to the air flow with a large amount of water vapor being transported to mainland China. In addition, under the influence of stable atmospheric circulation, the rainfall in Henan was supported by continuous water vapor, which led to this extreme rainfall event. During this weather event, the maximum rainfall in a single hour was greater than 200 mm [11], which attracted a great deal of attention in China and abroad. However, no consensus has been reached as to the specific mechanism of the heavy rainfall in Zhengzhou. It is well known that accurate representation of the orography in NWP models has a great influence on the simulation of extreme rainfall events, but the specific extent of the impact of the orographic resolution on the simulation results is not completely clear.
In recent years, an increasing number of scholars have begun to study the simulation of extreme rainfall events using NWP, and the simulation results have been gradually improving [12,13,14,15]. The possible reasons for this are improvement in the horizontal resolution of the NWP models, the optimization of the parameterization schemes, and improvement in the orographic representation. In view of the orographic problem, several scholars have reported that using high-resolution orographic data in the model is crucial to improving the accuracy of rainfall predictions in mountainous areas [16]. Improved orographic representation allows better prediction of the changes in the airflow, thus improving the prediction performance of the model [17]. Currently, the computational resources available allow NWP models to resolve orography data with increasingly fine resolutions, thereby reducing the impact of the orographic representation uncertainties on the NWP. Davini [18] found that if the model’s horizontal resolution is improved by refining the grid while the resolved orography remains unchanged, the model biases are reduced only in some specific cases. Conversely, increasing the orographic resolution significantly reduces several important systematic model errors, including synoptic transient eddies, the North Atlantic jet stream variability, and the frequency and duration of the atmospheric blocking. Therefore, it is very important to fully understand the influence of the orographic resolution on numerical weather prediction. In this study, the Yin–He Global Spectrum Model (YHGSM) and orography data with different resolutions were used to simulate the extreme rainfall in Zhengzhou, Henan Province, in order to analyze the influence and mechanism of orography with different resolutions on the extreme rainfall. The results of this study provide a reference based upon which NWP models can accurately forecast complex orographic regions.

2. Materials and Methods

The YHGSM is a global spectral numerical weather prediction model developed by the National University of Defense Technology (NUDT). The YHGSM adopts a global spectral dynamical core, which satisfies the dry-mass conservation principle [19], and the fast spherical harmonic transform algorithm developed by Yin et al. [20]. In the horizontal direction, a spherical harmonic spectrum expansion based on trigonometric truncation (the maximum truncated wave number is 1279) and a linear Gaussian reduced mesh are used. In the vertical direction, a finite element discretization based on a cubic spline and the terrain following pressure-based coordinate are used. There are a total of 137 vertical layers. The time step is 600 s. The parameterized physical and chemical processes include radiation, turbulence, sub-grid orographic drag, cumulus convection, large-scale rainfall, land surface processes, and methane and ozone chemistry [21]. Additional details about the YHGSM have been reported in previous studies [22,23,24,25]. For the wave number truncation problem of the infinite expansion of the spherical harmonic function in numerical simulations, when the wave number truncation increases, the horizontal scale of the atmospheric motion described becomes finer. For example, the orographic height on the earth’s surface can be expressed by the following formula
F λ ,   υ = m n = m F n m Y n m λ ,   υ
where F λ ,   υ is a function representing the orography, λ is the longitude, υ = sin φ , φ is the latitude, n is called the order of the spherical harmonics, F n m is the spectral coefficient, Y n m λ ,   υ is the spherical harmonics. The Equation (1) contains an infinite number of spectral coefficients. However, in the actual numerical calculation, we can only consider a limited number of spectral coefficients, which is the wave number truncation of the orography. As m   and n increase, the orographic details described by the spectral coefficients increase. By choosing m and n appropriately, we can filter out the details we do not need. This filtering method is consistent with the grid spacing selection in the grid field [26]. However, the way of wave number truncation can make Equation (1) converge to F λ ,   υ at a fast speed, and stability is better and its program is simple and easy to understand. Therefore, we used wave number truncation to decompose the initial orographic data to different resolutions. When the spherical harmonic function was expanded, the truncated wave numbers were 511 (T511 orography, which corresponds roughly to a 40 km grid spacing), 639 (T639 orography, about 31 km), 799 (T799 orography, about 25 km), and 1279 (T1279 orography, about 16 km) (Table 1). In the horizontal direction, all of the experiments adopted spherical harmonic spectrum expansion based on triangular truncation and a linear Gaussian grid, with a truncation wave number of 1279 (horizontal resolution of about 16 km). All observational data used in this paper are from the China Meteorological Administration.

3. Results

3.1. Overview of the Study Area

3.1.1. Circulation Background

The study area (30–38° N, 108–118° E) includes all of Henan Province. The main body of the WPSH remained north of 30° N, and the ridge line of the WPSH was close to the eastern edge of China (Figure 1). In the western Pacific, typhoon In-Fa moved westward under the guidance of the southern wind steam of the WPSH. The contours between typhoon In-Fa and the WPSH became denser. Under the influence of the pressure gradient, the westerly winds between typhoon In-Fa and the WPSH continued to strengthen. At 850 hPa, i.e., the height of the water vapor transport, an obvious water vapor channel formed in the lower layer between the Western Pacific Ocean and eastern China. Water vapor and air were transported into central China along the westerly jet stream between the typhoon and the WPSH. The westward airflow reached the Taihang Mountains and the Funiu Mountains in western Henan and was uplifted, triggering upward movement, which was also one of the reasons why the center of the heavy rainfall remained in this area for a long period of time.
Zhengzhou in Henan Province was located in the center of a low-pressure zone with strong upward movement. Analysis showed that the joint action of the systems with different scales, including the WPSH, typhoons, and low-pressure center, led to continuous water vapor transportation. The orography in Henan is high in the west and low in the east, providing important background conditions for this heavy rainfall. During this extreme rainfall event in Henan, the peak rainfall occurred at 09:00 UTC on 20 July 2021, and the rainfall in a single hour was as high as 201.9 mm, exceeding all historical records (Figure 2). This time is called the peak rainfall time, which was extremely abnormal and disastrous. In this study, in order to explore the impact of the orography data with different resolutions on the Henan’s rainfall simulation before and after the enhancement of the airflow and water vapor transport, the accumulated rainfall was mainly simulated in two periods, i.e., from 00:00 on 19 July 2021 to 00:00 on 20 July 2021 before the peak of rainfall and from 12:00 on 19 July 2021 to 12:00 on 20 July 2021 during the peak rainfall period. The starting times of these experiments were 00:00 on 18 July 2021 and 12:00 on 18 July 2021, respectively (Table 2), and the two simulation time periods represent periods of relatively weak and relatively strong airflow and water vapor transport, respectively. All of the times reported in this paper are in universal time.

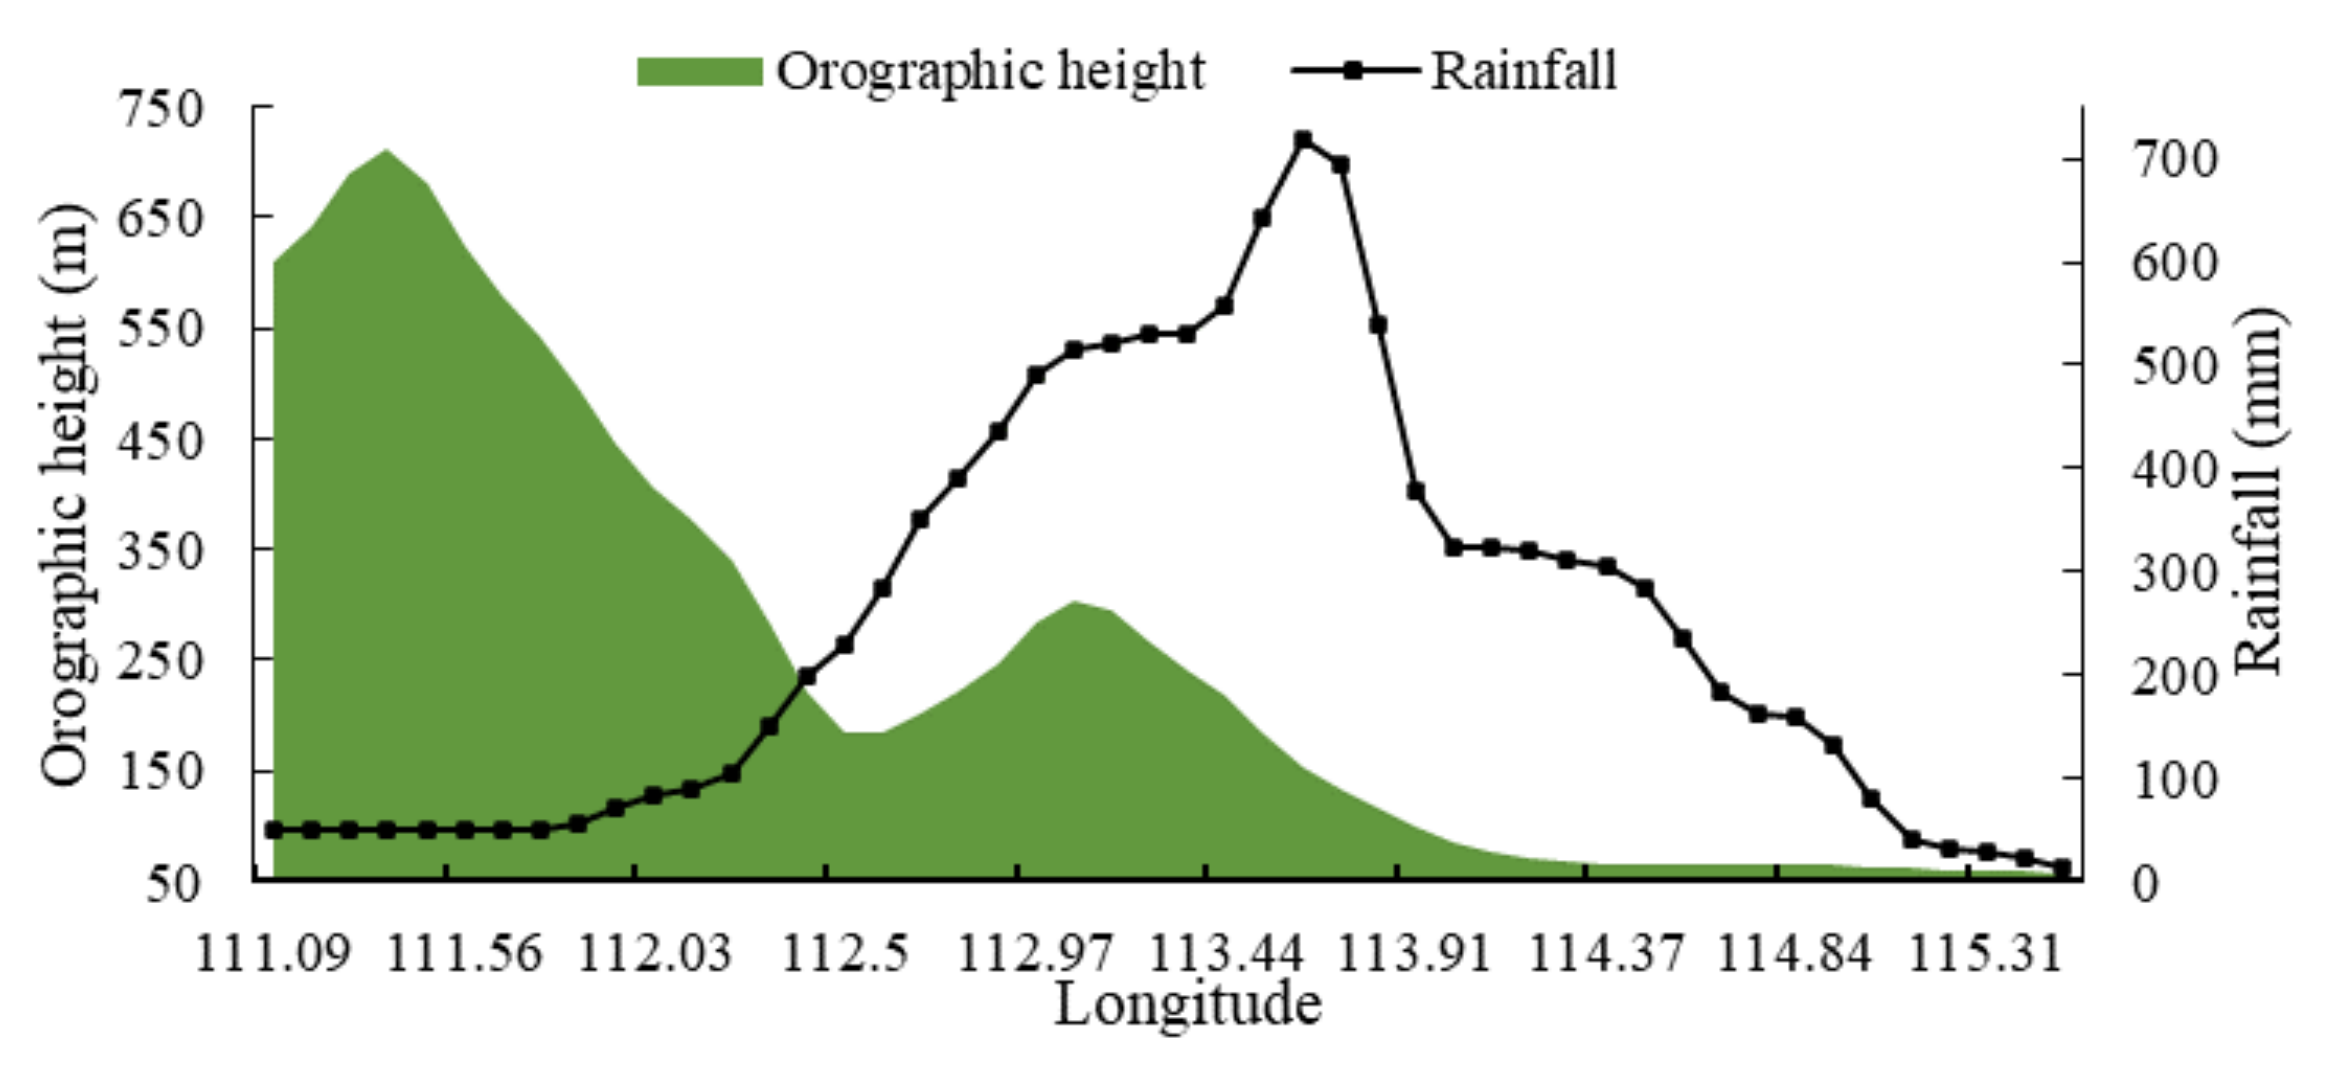
3.1.2. Orographic Features

The Zhengzhou is located in the northern part of central Henan, and the orography in Henan is high in the west and low in the east (Figure 3). Zhengzhou is located at the junction of the high mountains in the west and the plains in the east. On the northwest side of Zhengzhou is the famous Taihang Mountains, with an average altitude of more than 1200 m; on the southwest side is the Funiu Mountains, with altitudes of more than 1000 m. The main part of the Funiu Mountains lies on the western edge of Henan, but the Songshan Mountain are also close to Zhengzhou. Their highest peak is over 1000 m. The Loess Plateau and Qinghai–Tibet Plateau are located on the west side of the Taihang Mountains and Funiu Mountains. Such orographic features allow warm and moist air to flow from the South China Sea and Pacific Ocean into the study area, where it is blocked by mountains and accumulates or rises.
By comparing the T1279 orography and T511 orography, it was found that the wave number truncation method filters out the details of the orography, and the orographic height distribution becomes smooth. In T511 orography, the 1000 m contour of the Funiu Mountains is shifted westward. The height of the Song Mountains is completely filtered and disappears. The orography at the edge of the Funiu Mountains becomes very smooth. The peak 1500 m above the Taihang Mountains on the north side of Zhengzhou disappears, and the overall height decreases.

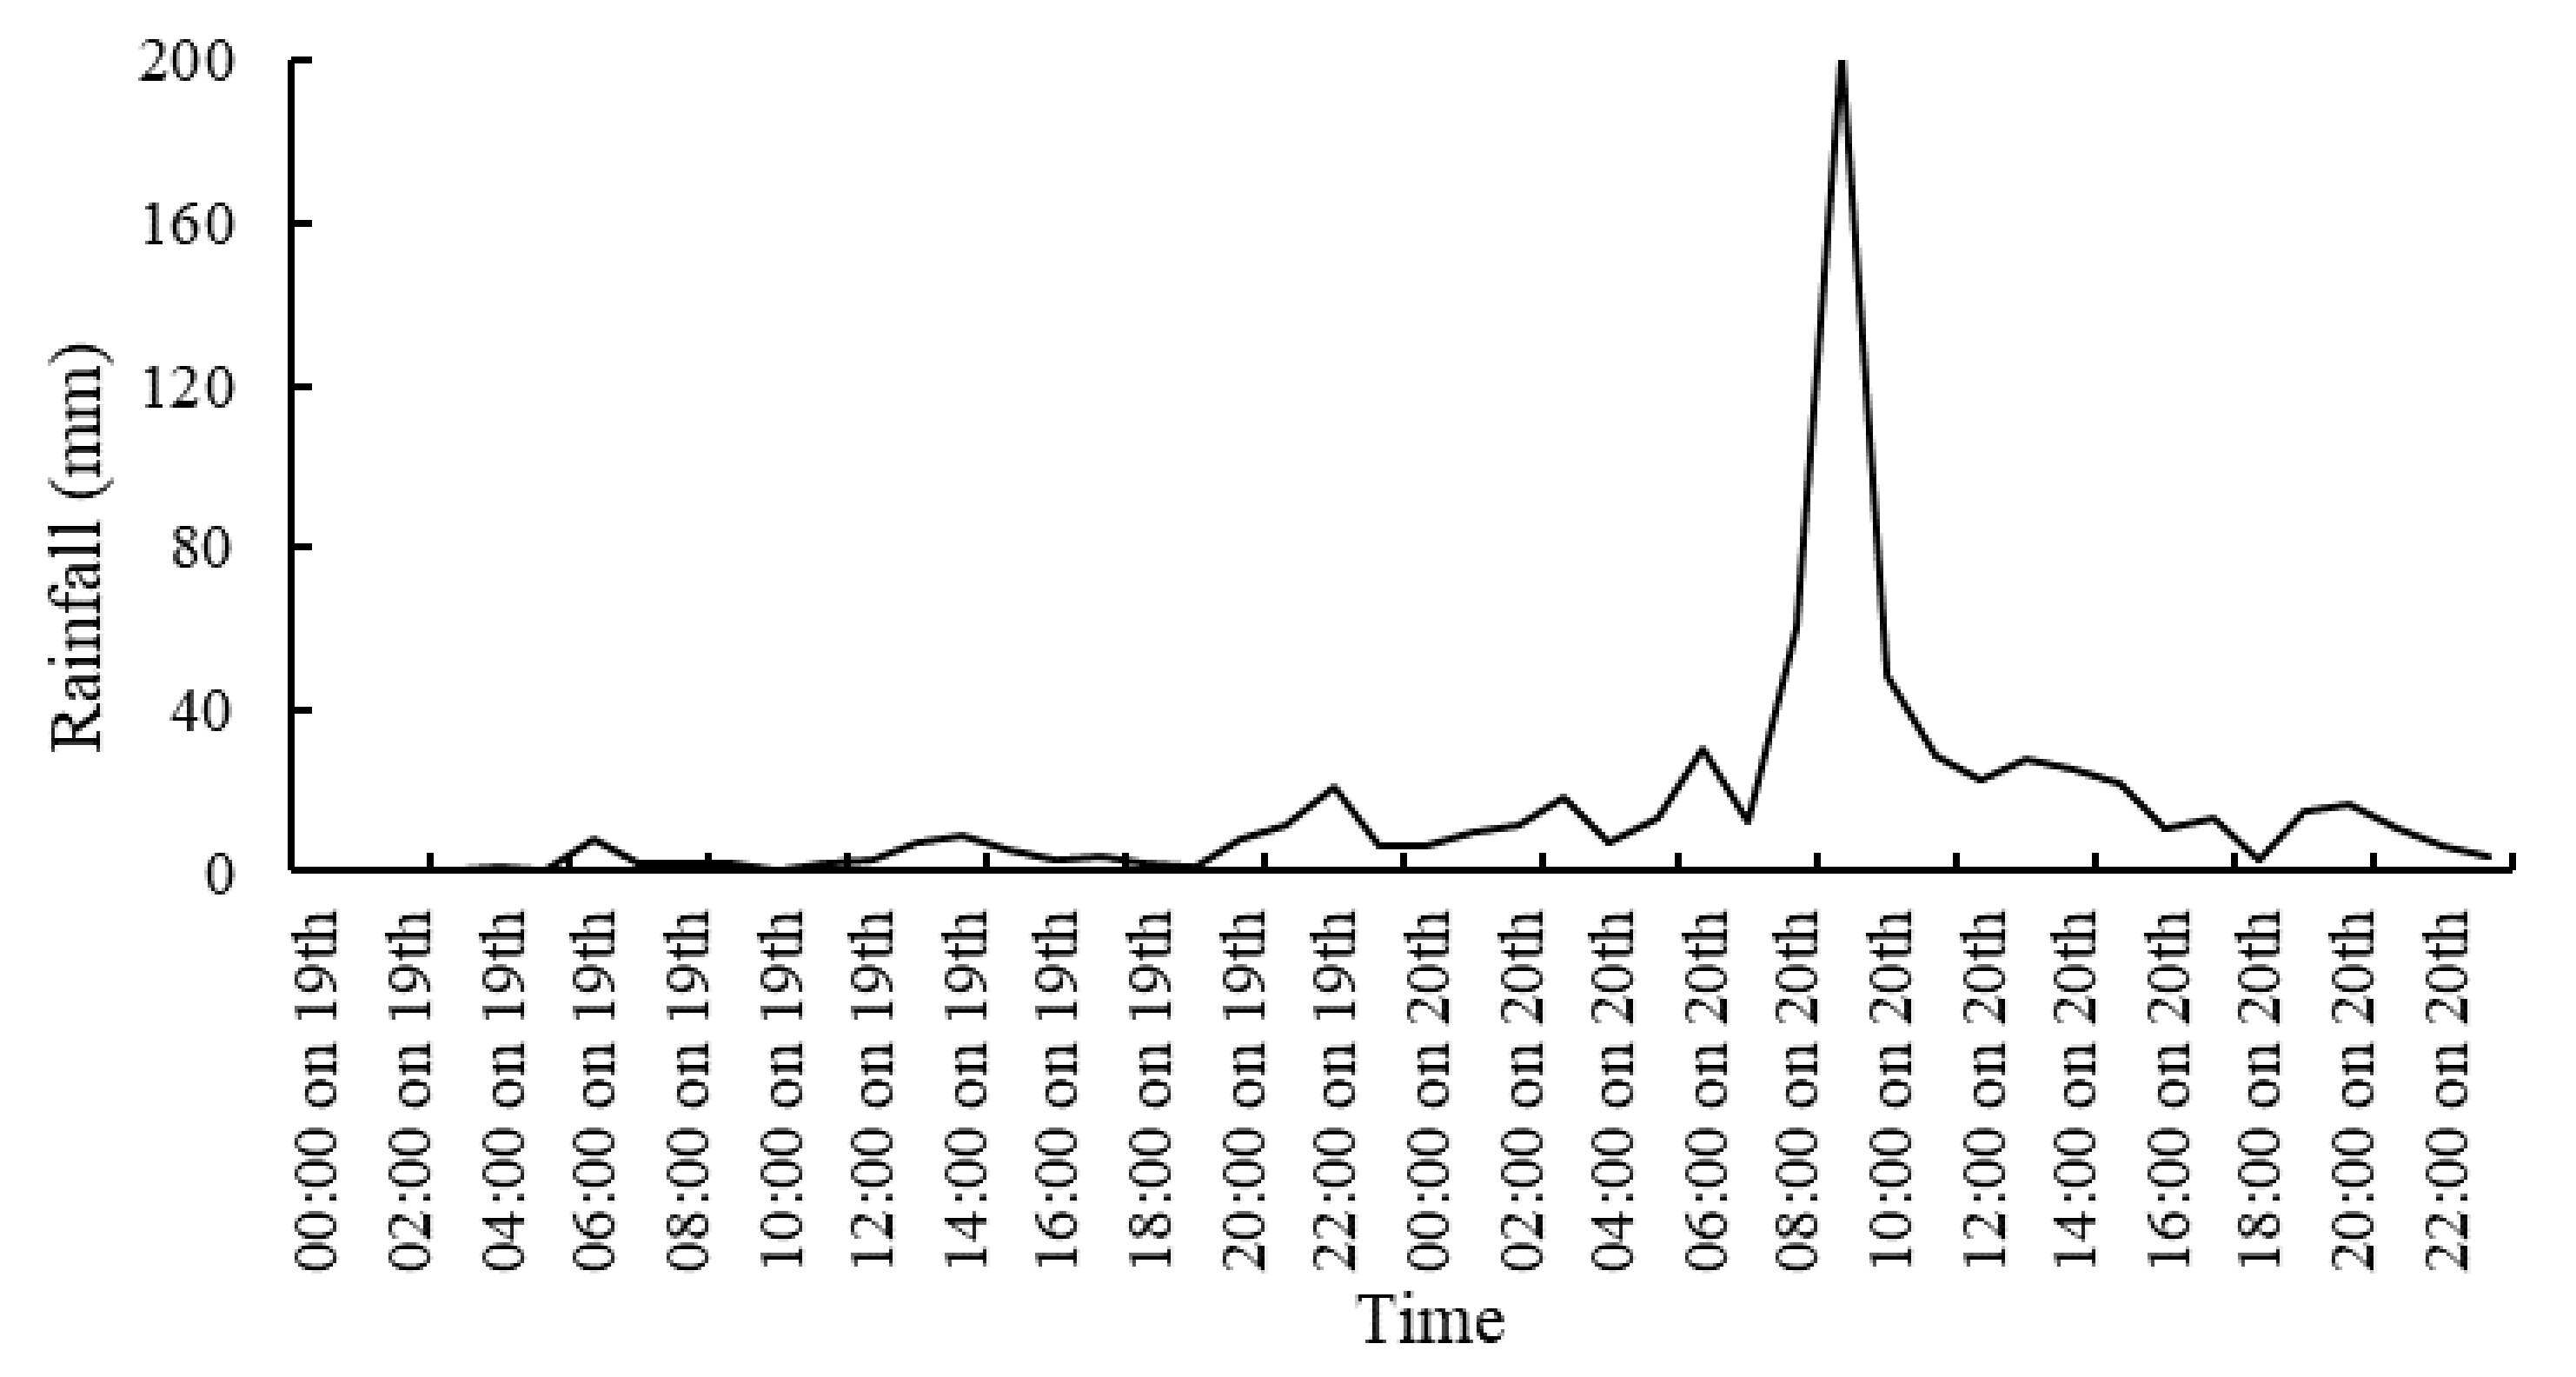
3.2. Rainfall Analysis

In the main rainfall areas (33–38° N,111–116° E), compared with the actual rainfall, the intensity of the simulated accumulative rainfall was low, but the change in the rainfall was successfully simulated to different degrees. In the main area, the rainfall gradually increased on 19 July 2021, and a small peak appeared around 00:00 on 20 July 2021. Then, the rainfall decreased slightly and then increased again. The maximum rainfall was recorded at 20:00 on 20 July 2021, and then the rainfall gradually weakened (Figure 4). It can be seen that the YHGSM has a certain degree of credibility for the simulation of rainfall trends in complex orographic areas.
Figure 5a,b are obtained by interpolating the measured meteorological station data to the plane, which show that the heavy rainfall area on 19 July 2021 was mainly distributed near Zhengzhou, and the 24 h accumulated rainfall in this area was >150 mm.
On 19 July, there were two main strong rainfall centers: one on the south side of the Taihang Mountains and the other on the east side of the Funiu Mountains. During the period from 12:00 on 19 July 2021 to 12:00 on 20 July 2021, the rainfall intensity increased. The previous two rainfall centers combined into one center, and the rainfall range continued to expand. Based on the classification of rainfall levels by the China Meteorological Administration (Table 3), the maximum rainfall at the station was more than twice the standard for extraordinarily heavy rain. Most of the rainfall was distributed on the windward side of the front side of the mountains, which is consistent with Kirshbaum’s first case in the study of wet orographic convection (Figure 6a) [27]. Kirshbaum et al. [27] studied the physical mechanisms of different moist orographic convection, and its connection to ground exchange processes (Figure 6).
Among them, the triggering mechanism of orographic forced ascent to produce rainfall was the simplest (Figure 6a). The airflow hits or climbs up the mountains and is forced to rise to a higher position, or it saturates the unstable layer, thereby causing rainfall. Most of this type of rainfall occurred on the front side of the mountains. Khodayar et al. [28] also found that this type of rainfall mostly occurs at lower heights in the mountains. Zhengzhou is located on the south side of the Taihang Mountains and the east side of the Funiu Mountains. From Zhengzhou to the west, the altitude gradually increases, while the rainfall mainly occurred at a lower altitude on the east side of the mountains (around 113.5° E). Zhengzhou is located at exactly 113.5° E (Figure 7). All of these facts confirm that the orographic features of Zhengzhou had an important influence on this extreme rainfall event.
The Global Precipitation Measurement (GPM) mission is an international network of satellites that provide next-generation global observations of rain and snow. To validate the model and results, this study intensified the comparison of rainfall results from different sources. The study used measured data of 521 meteorological stations in the main study area from the China Meteorological Administration (Figure 5c,d) and the Integrated Multi-satellitE Retrievals for GPM (IMERG), which is the unified U.S. algorithm that provides the multi-satellite precipitation product (Figure 5g,h). The spatial resolution of GPM IMERG version 6 data is 0.1° × 0.1°, and its high spatial and time resolution makes it often used in many studies. Before the peak rainfall, the YHGSM also simulated two rainfall centers. The two rainfall centers were located along the north–south direction (Figure 5e). One was located on the south side of the Taihang Mountains and the other was located on the east side of the Funiu Mountains, which is roughly similar to the actual locations of the rainfall centers. The area of the simulated rainfall center was larger than the actual area of the rainfall center, and the intensity was lower, but it also successfully simulated the rainfall of the heavy rainfall level. When the peak rainfall occurred, the range and intensity of the simulated 24 h accumulated rainfall increased compared with that before the peak rainfall (Figure 5f). Compared with the actual rainfall, there was a certain difference, but the simulated rainfall center had a > 150 mm big heavy rainfall level. Compared with GPM IMERG data, the range and intensity of the simulated rainfall were better than GPM IMERG data. The GPM IMERG rainfall range is exactly the intensity center of the actual rainfall. It can be seen that although the rainfall simulated by YHGSM is worse than the actual observed rainfall, it still has great advantages compared with the rainfall products. After the airflow and water vapor transportation were strengthened, the simulated rainfall mainly exhibited three rainfall centers. The two rainfall centers crossed the mountains and moved into the Taihang Mountain gorge, similar to the rainfall mechanism shown in Figure 6f. There are two possible reasons for this phenomenon. One is that the model overestimated the height of the airflow from the Pacific Ocean, which caused the airflow to cross the mountains; the other is that the high-resolution T1279 orography still cannot completely represent the true orographic height, which caused the airflow to flow around or climb over the mountains. The maximum rainfall occurred on the east side of the Funiu Mountains, with a maximum of 210.6 mm, and the rainfall intensity was closer to the actual rainfall. Overall, the YHGSM simulated the area of the extreme rainfall in Henan. Although the simulated rainfall intensity was smaller than the actual rainfall intensity, the YHGSM also successfully simulated the heavy rainfall level and the big heavy rainfall level. In addition, the orography with different resolutions successfully simulated the general trend of the rainfall, which shows that the YHGSM has a good forecasting ability.

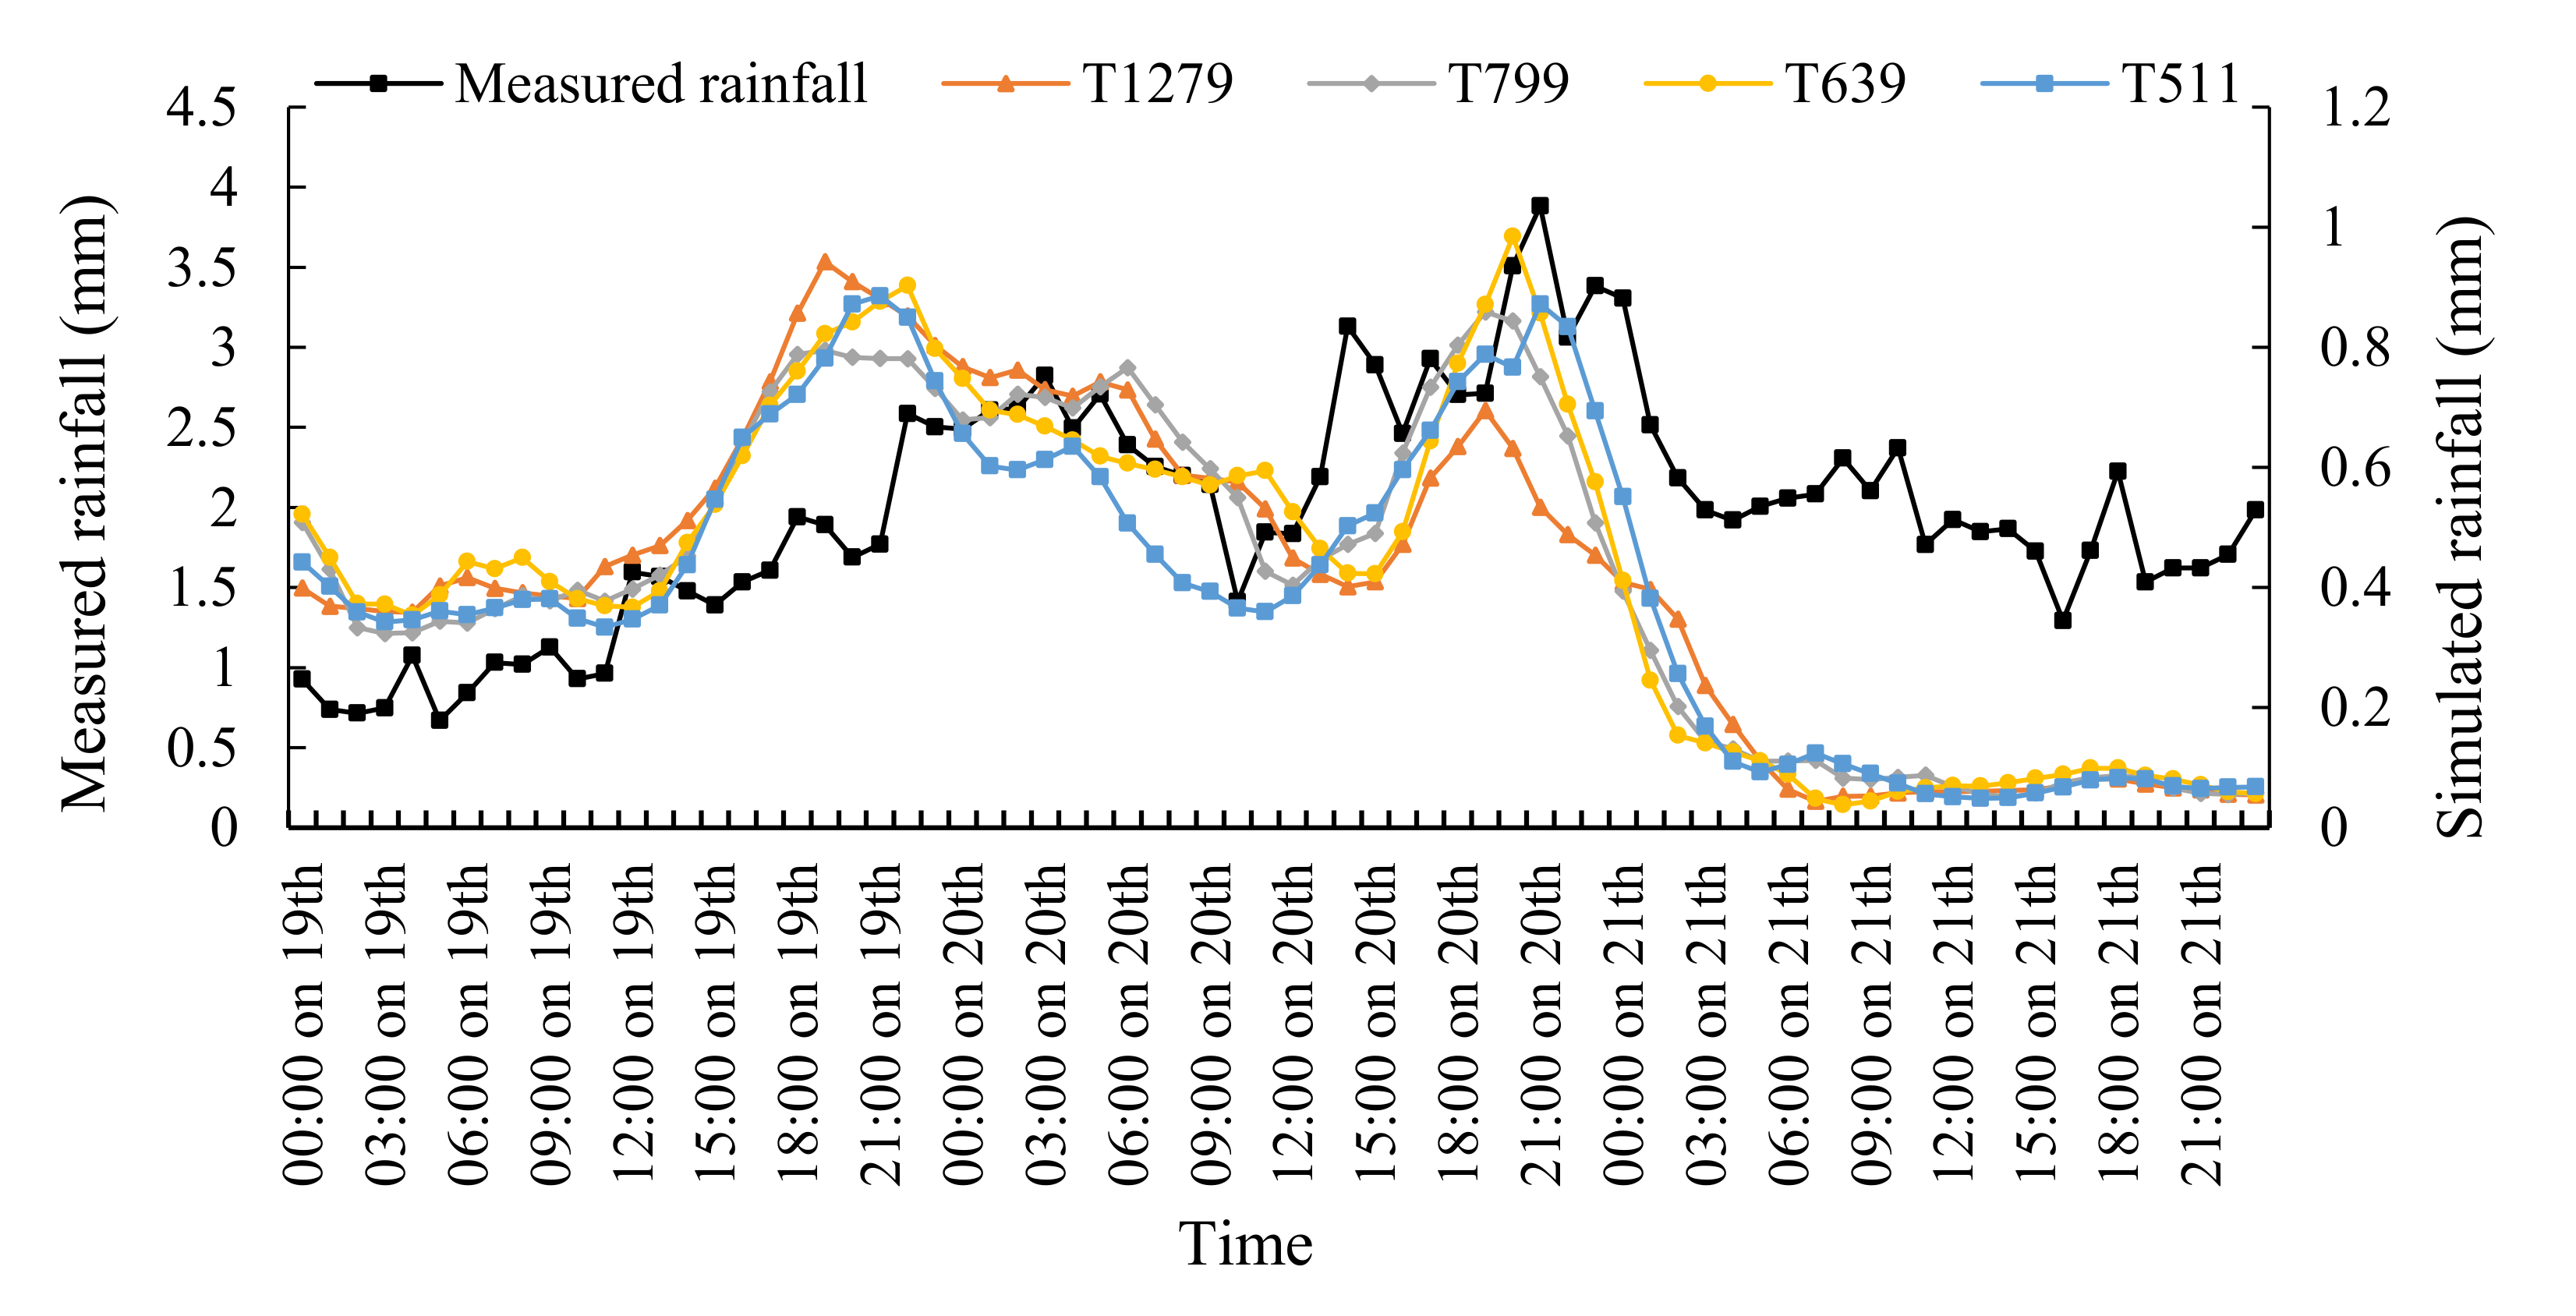
3.3. Sensitivity of the Rainfall to the Orographic Resolution

The orography contributed greatly to the extreme rainfall in Zhengzhou. In NWP, it is generally believed that the higher the orographic resolution, the better the forecasting results. However, few scholars have analyzed the degree of influence of the orographic resolution on rainfall and the main aspects of the impact of the orography on rainfall. Aiming at these problems, in this study, the rainfall simulation results under different orographic resolutions were compared.
For the rainfall simulated using the T799 orography, the main rainfall range occurred in the central part of Henan, which is similar to the actual rainfall, but the simulated rainfall intensity was lower than the actual rainfall (Figure 8a).
Compared with the T1279 orography simulation, the T799 orography only simulated the rainfall center on the east side of the Funiu Mountains and missed the rainfall center on the south side of the Taihang Mountains (Figure 8d). The possible reason for this is that the surrounding height of the Taihang Mountains decreased, and the airflow flowed around from the lower altitude surrounding areas after being blocked by the Taihang Mountains, which is similar to the mechanism shown in Figure 6c. However, after the end of the detour, the airflow did not merge or the merged airflow was weak, so no strong rainfall center formed.
For the rainfall simulated using the T639 orography, the rainfall center area was slightly different. The rainfall center on the east side of the Funiu Mountains was shifted southward, and only a small area of heavy rainfall occurred on the south side of the Taihang Mountains (Figure 8b). The difference between the simulation results for the T1279 orography and the T799 orography was mainly reflected in the rainfall intensity. The difference between the simulation results for the T1279 orography and the T639 orography was not only reflected in the rainfall intensity but also in the range of the rainfall center (Figure 8e).
When the orographic resolution was further reduced, for the rainfall simulated using the T511 orography, the rainfall center’s area was significantly different. The rainfall center split into one center on the south side of the Taihang Mountains and another on the east side of the Funiu Mountains (Figure 8c). The airflow on the south side of the Taihang Mountains exhibited obvious climbing movement. Part of the airflow produced convection on the windward slope in front of the mountains and caused rainfall, and the other part of the airflow crossed the mountains and caused rainfall in Shanxi Province due to the greatly reduced mountain height. The maximum rainfall on the eastern side of the Funiu Mountains reached 112.6 mm. It can be seen that the rainfall intensity simulation was improved. The possible reason for this is that convective rainfall with the mechanism shown in Figure 6c occurred after the orographic height of the mountain range on the south side of Henan decreased. In general, the high-resolution orography simulated the east side of the Funiu Mountains relatively well. When the orographic resolution was reduced, the simulated rainfall intensity on the south side of the Taihang Mountains and the east side of the Funiu Mountains was lower.
When the airflow and water vapor transportation were further strengthened and the peak rainfall occurred, the simulated accumulated rainfall from 12:00 on 19 July 2021 to 12:00 on 20 July 2021 is shown in Figure 9. For the rainfall simulated using the T799 orography, the rainfall on the east side of the Funiu Mountains and the rainfall on the south side of the Taihang Mountains formed a rainfall belt. The range of the heavy rainfall level was similar to the simulation results for the T1279 orography, but the range of big heavy rainfall level was larger than that of the simulation results obtained using the T1279 orography (Figure 9a).
For the rainfall simulated using the T639 orography, the range of the heavy rainfall level was obviously smaller than that for the simulation result obtained using the T1279 orography, but the range of the big heavy rainfall level was larger than that for the simulation results obtained using the T1279 orography (Figure 9b). The maximum rainfall obtained using the T639 orography reached 251.2 mm, and the maximum rainfall obtained using the T1279 orography was 210.6 mm. However, the maximum rainfall area obtained using the T639 orography was located farther east than that obtained using the T1279 orography. The ranges of the big heavy rainfall level simulated using the lower resolution T799 orography and T639 orography were slightly larger than that of the simulation result obtained using the high-resolution T1279 orography. The reason for this phenomenon may be that after the orographic resolution was reduced, the detailed features and height extremes of the mountains were filtered out, causing the orographic slope to decrease. The shallower slope was more conducive to the rise of the airflow, causing convection to develop.
When the orographic resolution was further reduced, for the rainfall simulated using the T511 orography, the range of the heavy rainfall level was also smaller than that for the simulation results obtained using the T1279 orography, and the range of the big heavy rainfall level was also slightly larger than that for the simulation results obtained using the T1279 orography, but the rainfall center of the big heavy rainfall level was located farther south (Figure 9c). In general, when the peak rainfall occurred, the rainfall simulation obtained using the high-resolution orography was better than that obtained using the low-resolution orography during the heavy level. However, from the perspective of the big heavy rainfall level, the rainfall range of the low-resolution orographic simulations were relatively large, but the position of the rainfall center of the big heavy rainfall level was different.

3.4. Analysis of Element Fields Related to Orography and Rainfall

In order to explore the specific mechanism by which the orography affects the rainfall, the element fields related to the orography and rainfall, such as the high-level divergence, bottom-level vorticity, and vertical velocity, were calculated under different orographic resolutions. At 700 hPa, from 19 July 2021 to 20 July 2021, the upward vertical velocity increased significantly, and most of Henan was in the updraft zone (Figure 10). Before the peak rainfall occurred, the large vertical velocity areas simulated using the T1279 orography were mainly located on the south side of the Taihang Mountains and the east side of the Funiu Mountains (Figure 10a), which is consistent with the rainfall center shown in Figure 5e. However, the simulated updraft centers for the T799 orography (Figure 10c), T639 orography (Figure 10e), and T511 orography (Figure 10g) were only located on the east side of the Funiu Mountains, and the strong updraft on the south side of the Taihang Mountains was missing. The areas with large vertical velocities in Figure 10c,e,g are consistent with the positions of the rainfall centers in Figure 8a–c, indicating that the strong updraft was one of the key factors leading to the extreme rainfall in Henan.
When the peak rainfall occurred, the airflow was further strengthened and greatly uplifted by the mountains, and the vertical velocity increased further. From 12:00 on 19 July 2021 to 12:00 on 20 July 2021, the area with large vertical velocities simulated using the T1279 orography was mainly located on the east side of the Funiu Mountains, while the vertical velocity on the south side of the Taihang Mountains was relatively small (Figure 10b). However, the low-resolution T799 orography (Figure 10d), T639 orography (Figure 10f), and T511 orography (Figure 10h) all simulated the updraft on the south side of the Taihang Mountains to varying degrees, which confirms the conclusion in Section 3.3.; that is, using low-resolution orography to simulate big heavy rainfall produces a larger rainfall range. In the low-resolution orography, the mountain details were filtered out and the altitude was smoothed, resulting in a shallower slope, which was more conducive to the development of updrafts.
In order to better understand the rising intensity of the airflow at different heights, vertical velocity zonal profiles along Zhengzhou (34.7° N) were constructed (Figure 11). Before the peak rainfall occurred, the T1279 orography simulated a strong updraft over Zhengzhou (at about 113° E), with an average vertical velocity of 1.3 Pa/s. The strong updraft center was located at about 600 hPa and extended upward to about 300 hPa (Figure 11a). The updraft strengths simulated using the T799 orography (Figure 11c), T639 orography (Figure 11d), and T511 orography (Figure 11g) were weaker than that simulated using the T1279 orography, and there was no strong updraft center. However, the maximum heights of the upward extension were similar to that for the T1279 orography.
When the peak rainfall occurred, the updraft became stronger. The strongest center of the updraft simulated using the T1279 orography was located at about 400 hPa, and the maximum height of the upward extension was 200 hPa (Figure 11b). Compared with the updraft before the peak rainfall occurred, the height of the strongest updraft center and the maximum height of the upward extension were both higher. This indicates that from 19 July 2021 to 20 July 2021, the convective system over Zhengzhou, Henan, quickly developed into a deep system located directly in the tropopause. The long-term maintenance of this deep convection system provided the dynamic conditions for the heavy rainfall in Zhengzhou, Henan. The updraft intensity simulated using the T799 orography was much stronger than that simulated using the T1279 orography (Figure 11d), which confirms the conclusion and conjectures in Section 3.3 The airflow with an intensity of >1.0 Pa/s simulated using the T799 orography extended from 800 hPa to 300 hPa, which better reflected the deep convection system over Zhengzhou, Henan. The updraft strengths simulated using the T639 orography (Figure 11f) and the T511 orography (Figure 11h) were slightly weaker than that simulated using the T799 orography, but their maximum upward extensions were similar. This demonstrates that the orography had a great influence on the velocity of the updraft, but it had a limited influence on the maximum height that the updraft could reach.
Before the peak rainfall occurred, the vorticity distributions and intensities simulated using the different orographic resolutions were roughly the same. When the peak rainfall occurred, compared with the vorticity before the peak rainfall, the convergence center moved further westward on the east side of the Funiu Mountains, and the vorticity intensity was also greater (Figure 12).
In Henan Province, Zhengzhou was located on the dividing line. There was positive vorticity advection in the west of Zhengzhou, while the vorticity value in the east of Zhengzhou was very small. The vorticity simulated using the different orographic resolutions was roughly the same, and it was found that the orography had little effect on the vorticity. However, the vorticity at the bottom had a good corresponding relationship with the divergence in the upper level (Figure 13).
It can be seen from Figure 13a,c,e,g that the divergence value was very small because the updraft did not develop to a height of 200 hPa before the peak rainfall occurred. This demonstrates the correctness of the results, i.e., that the updraft simulated in Figure 11 extended to 300 hPa before the peak rainfall occurred. When the peak rainfall occurred, the updraft was strong and the airflow rose higher. There were many divergent centers at 200 hPa. The 200 hPa divergence simulated using the T1279 orography showed that there were clear divergence areas over Henan with strong upward motion (Figure 13b). The divergence intensities on the south side of the Taihang Mountains simulated using the T799 orography (Figure 13d), T639 orography (Figure 13f), and T511 orography (Figure 13h) were larger than that simulated using the T1279 orography, so the updraft was stronger. This confirms the conclusion that the updrafts simulated using the lower resolution orography were stronger (Figure 10 and Figure 11).

4. Discussion and Conclusions

In this study, the YHGSM was used to simulate an extreme rainfall event in Zhengzhou, Henan Province. Four orographic resolutions were used in the model, i.e., the T1279 orography, T799 orography, T639 orography, and T511 orography, to test the degree of influence and influence mechanism of the different orographic resolutions on the extreme rainfall in Henan Province.
The extreme rainfall in Zhengzhou, Henan, was closely related to the continuous strong divergence in the upper troposphere and the strong convergence in the lower troposphere. The orography in western Henan lifted the westward airflow between the typhoon and the WPSH to a higher level, causing strong upward movement and forming a deep convection system. These processes were conducive to the long-term maintenance of heavy rainfall, thus forming an unprecedented heavy rainfall event in Henan. Before the peak rainfall occurred, the difference between the rainfall simulations obtained using the T1279 orography and the T799 orography was mainly reflected in the rainfall intensity. However, when the orographic resolution was further reduced, the difference in the rainfall simulation was not only reflected in the rainfall intensity but also in the rainfall range. When the peak rainfall occurred, the airflow and water vapor transport were further strengthened, and a false rainfall area behind the Taihang Mountains was simulated using the orography with different resolutions. There are two possible reasons for this phenomenon. One is that the model overestimated the height of the airflow from the Pacific Ocean, which caused the airflow to cross the mountains. The other is that the orography still cannot completely represent the true orographic height, which caused the airflow to flow around or climb over the mountains. When simulating the rainfall with a heavy rainfall level, the high-resolution orography performed better than the low-resolution orography. When simulating rainfall with a big heavy rainfall level, the rainfall range simulated using the low-resolution orography was relatively large, but the position of the simulated big heavy rainfall center deviated from the real position. Based on the analysis illustrated in Figure 10 and Figure 11, it was determined that the reason for this phenomenon may be that the low-resolution orography in Henan was more conducive to the development of updrafts.
When the orographic resolution changed, the vertical velocity was the most sensitive to the orographic resolution. Before the peak rainfall occurred, the high-resolution orography simulated the updrafts on the south side of the Taihang Mountains and the east side of the Funiu Mountains better. The simulations obtained using the lower resolution orography did not reproduce the updraft on the south side of the Taihang Mountains. When the peak rainfall occurred, the airflow was strengthened, and the low-resolution orography simulated the stronger updraft on the south side of the Taihang Mountains. The possible reason for this is that when the orographic resolution was reduced, the slope of the mountains became shallower, which was more conducive to the development of vertical airflow. The sensitivity of the high-level divergence to the orographic resolution was less than that of the vertical velocity. However, the divergence and the vertical velocity have something in common. For example, when the peak rainfall occurred, the simulated value of the low-resolution orography on the south side of the Taihang Mountains was larger than that for the T1279 orography. The low-level vorticity was the least sensitive to the orographic resolution. It was found that the vorticity was not directly affected by the orography in this extreme rainfall event in Henan.
In conclusion, although the YHGSM simulated the range of big heavy rainfall level (100–249.9 mm) better in Henan by using low-resolution orography when the rainfall intensity increased, the simulation deviation in rainfall intensity still existed. In most cases, the simulations of extreme rainfall in Henan using high-resolution orography were better than those using low-resolution orography. This is similar to what Torma and Giorgi [16] found. When studying rainfall in the complex orographic region of the Carpathians, they found that representation of high-resolution orography is crucial for the accurate prediction of rainfall in mountainous areas. Moreover, Caccamo et al. [13] and Kirthiga et al. [29] also introduced high-resolution orography into the NWP model, respectively, and found that both improved the prediction performance of the model. The orography mainly affected the rainfall by affecting the velocity of the updraft, but it had a limited influence on the maximum height that the updraft could reach. A strong updraft was one of the key factors leading to the extreme rainfall in Henan Province. In general, YHGSM’s simulations of the extreme rainfall in Henan are slightly lower. Moya-Álvarez et al. [30] also found that the NWP model underestimates the simulation of extreme rainfall totals in the Central Andes of Peru in approximately 50–60% of cases. Moreover, many studies have found that NWP models underestimate rainfall in complex orographic areas [6,31,32,33,34]. This seems to be a common problem with most NWP models. When predicting extreme rainfall in complex orographic areas, forecasters may need to artificially increase rainfall based on model results.

Author Contributions

Conceptualization, Y.W., J.W.; data curation, J.P., X.Y. and D.L.; formal analysis, J.P. and X.Y.; funding acquisition, J.W.; Investigation, Y.W.; methodology, J.P. and X.Y.; project administration, J.W.; software, J.P., X.Y. and D.L.; visualization, D.L.; writing—original draft preparation, Y.W.; writing—review and editing, J.W. All authors have read and agreed to the published version of the manuscript.

Funding

This research was funded by the National Natural Science Foundation of China, grant number 41875121.

Institutional Review Board Statement

Not applicable.

Informed Consent Statement

Not applicable.

Data Availability Statement

The data presented in this study are available in https://disc.gsfc.nasa.gov/datasets/GPM_3IMERGDF_06/summary (accessed on 21 March 2022) and http://data.cma.cn/dataService/cdcindex/datacode/A.0012.0001 (accessed on 10 May 2021).

Acknowledgments

The aforementioned funding and supports are committedly acknowledged.

Conflicts of Interest

The authors declare no conflict of interest.

References

  1. Roe, G.H. Orographic precipitation. Annu. Rev. Earth Planet. Sci. 2005, 33, 645–671. [Google Scholar] [CrossRef]
  2. Chao, W.C. Correction of Excessive Precipitation over Steep and High Mountains in a GCM. J. Atmos. Sci. 2012, 69, 1547–1561. [Google Scholar] [CrossRef]
  3. Alpert, P.; Jin, F.; Shafir, H. Orographic Precipitation Simulated by a Super-High Resolution Global Climate Model over the Middle East. NATO Sci. Peace Secur. Ser. C Environ. Secur. 2012, 125, 301–306. [Google Scholar] [CrossRef]
  4. Kunz, M.; Kottmeier, C. Orographic Enhancement of Precipitation over Low Mountain Ranges. Part I: Model Formulation and Idealized Simulations. J. Appl. Meteorol. Climatol. 2006, 45, 1025–1040. [Google Scholar] [CrossRef]
  5. Colle, B.A.; Mass, C.F.; Westrick, K.J. MM5 Precipitation Verification over the Pacific Northwest during the 1997–99 Cool Seasons. Weather Forecast. 2000, 15, 730–744. [Google Scholar] [CrossRef]
  6. Moya-Álvarez, A.S.; Martínez-Castro, D.; Kumar, S.; Estevan, R.; Silva, Y. Response of the WRF model to different resolutions in the rainfall forecast over the complex Peruvian orography. Theor. Appl. Climatol. 2019, 137, 2993–3007. [Google Scholar] [CrossRef]
  7. Yáñez-Morroni, G.; Gironás, J.; Caneo, M.; Delgado, R.; Garreaud, R. Using the Weather Research and Forecasting (WRF) Model for Precipitation Forecasting in an Andean Region with Complex Topography. Atmosphere 2018, 9, 304. [Google Scholar] [CrossRef] [Green Version]
  8. Stohl, A.; Forster, C.; Sodemann, H. Remote sources of water vapor forming precipitation on the Norwegian west coast at 60° N-a tale of hurricanes and an atmospheric river. J. Geophys. Res. Atmos. 2008, 113, D05102. [Google Scholar] [CrossRef] [Green Version]
  9. Xia, Z.; Hui, Y.; Xinmin, W.; Lin, S.; Di, W.; Han, L. Analysis on characteristic and abnormality of atmospheric circulations of the July 2021 extreme precipitation in Henan. Trans. Atmos. Sci. 2021, 44, 672–687. [Google Scholar] [CrossRef]
  10. Wenru, S.; Xin, L.; Mingjian, Z.; Bing, Z.; Hongbin, W.; Kefeng, Z.; Xiaoyong, Z. Multi-model comparison and high-resolution regional model forecast analysis for the “7·20” Zhengzhou Severe Heavy Rain. Trans. Atmos. Sci. 2021, 44, 688–702. [Google Scholar] [CrossRef]
  11. Aifang, S.; Xiaona, L.; Liman, C.; Zhou, L.; Le, X.; Han, L. The basic observational analysis of “7.20” extreme rainstorm in Zhengzhou. Torrential Rain Disasters 2021, 40, 445–454. [Google Scholar]
  12. Sethunadh, J.; Jayakumar, A.; Mohandas, S.; Rajagopal, E.; Nagulu, A. Impact of Cartosat-1 orography on weather prediction in a high-resolution NCMRWF unified model. J. Earth Syst. Sci. 2019, 128, 110. [Google Scholar] [CrossRef] [Green Version]
  13. Caccamo, M.T.; Castorina, G.; Colombo, F.; Insinga, V.; Maiorana, E.; Magazù, S. Weather forecast performances for complex orographic areas: Impact of different grid resolutions and of geographic data on heavy rainfall event simulations in Sicily. Atmos. Res. 2017, 198, 22–33. [Google Scholar] [CrossRef]
  14. Nunalee, C.G.; Horváth, Á. High-resolution numerical modeling of mesoscale island wakes and sensitivity to static topographic relief data. Geosci. Model Dev. 2015, 8, 2973–2990. [Google Scholar] [CrossRef] [Green Version]
  15. Dimri, A.P. Impact of horizontal model resolution and orography on the simulation of a western disturbance and its associated precipitation. Meteorol. Appl. 2004, 11, 115–127. [Google Scholar] [CrossRef]
  16. Torma, C.; Giorgi, F. On the evidence of orographical modulation of regional fine scale precipitation change signals: The Carpathians. Atmos. Sci. Lett. 2020, 21, e967. [Google Scholar] [CrossRef] [Green Version]
  17. Webster, S.; Brown, A.R.; Cameron, D.R.; Jones, C.P. Improvements to the representation of orography in the Met Office Unified Model. Q. J. R. Meteorol. Soc. 2003, 129, 1989–2010. [Google Scholar] [CrossRef]
  18. Davini, P.; Fabiano, F.; Sandu, I. Orographic resolution driving the improvements associated with horizontal resolution increase in the Northern Hemisphere winter mid-latitudes. Weather Clim. Dynam. Discuss. 2021, 2021, 1–25. [Google Scholar] [CrossRef]
  19. Peng, J.; Wu, J.; Zhang, W.; Zhao, J.; Zhang, L.; Yang, J. A modified nonhydrostatic moist global spectral dynamical core using a dry-mass vertical coordinate. Q. J. R. Meteorol. Soc. 2019, 145, 2477–2490. [Google Scholar] [CrossRef]
  20. Yin, F.; Wu, G.; Wu, J.; Zhao, J.; Song, J. Performance Evaluation of the Fast Spherical Harmonic Transform Algorithm in the Yin–He Global Spectral Model. J. Mon. Weather Rev. 2018, 146, 3163–3182. [Google Scholar] [CrossRef]
  21. Jiang, T.; Guo, P.; Wu, J. One-sided on-demand communication technology for the semi-Lagrange scheme in the YHGSM. Concurr. Comput. Pract. Exp. 2020, 32, e5586. [Google Scholar] [CrossRef]
  22. Peng, J.; Zhao, J.; Zhang, W.; Zhang, L.; Wu, J.; Yang, X. Towards a dry-mass conserving hydrostatic global spectral dynamical core in a general moist atmosphere. Q. J. R. Meteorol. Soc. 2020, 146, 3206–3224. [Google Scholar] [CrossRef]
  23. Yang, J.; Song, J.; Wu, J.; Ying, F.; Peng, J.; Leng, H. A semi-implicit deep-atmosphere spectral dynamical kernel using a hydrostatic-pressure coordinate. Q. J. R. Meteorol. Soc. 2017, 143, 2703–2713. [Google Scholar] [CrossRef]
  24. Yang, J.; Song, J.; Wu, J.; Ren, K.; Leng, H. A high-order vertical discretization method for a semi-implicit mass-based non-hydrostatic kernel. Q. J. R. Meteorol. Soc. 2015, 141, 2880–2885. [Google Scholar] [CrossRef]
  25. Jianping, W.; Jun, Z.; Junqiang, S.; Weiming, Z. Preliminary design of dynamic framework for global non-hydrostatic spectral mode. Comput. Eng. Des. 2011, 32, 3539–3543. [Google Scholar] [CrossRef]
  26. Chenghai, W.; Xiao, L.; Yi, Y. Atmospheric Numerical Model and Simulation; China Meteorological Press: Beijing, China, 2011; pp. 109–110. [Google Scholar]
  27. Kirshbaum, D.J.; Adler, B.; Kalthoff, N.; Barthlott, C.; Serafin, S. Moist Orographic Convection: Physical Mechanisms and Links to Surface-Exchange Processes. Atmosphere 2018, 9, 80. [Google Scholar] [CrossRef] [Green Version]
  28. Khodayar, S.; Kalthoff, N.; Kottmeier, C. Atmospheric conditions associated with heavy precipitation events in comparison to seasonal means in the western mediterranean region. Clim. Dyn. 2018, 51, 951–967. [Google Scholar] [CrossRef]
  29. Kirthiga, S.M.; Patel, N.R. Impact of updating land surface data on micrometeorological weather simulations from the WRF model. Atmosfera 2018, 31, 165–183. [Google Scholar] [CrossRef] [Green Version]
  30. Moya-Álvarez, A.S.; Gálvez, J.; Holguín, A.; Estevan, R.; Kumar, S.; Villalobos, E.; Martínez-Castro, D.; Silva, Y. Extreme Rainfall Forecast with the WRF-ARW Model in the Central Andes of Peru. Atmosphere 2018, 9, 362. [Google Scholar] [CrossRef] [Green Version]
  31. Chawla, I.; Osuri, K.K.; Mujumdar, P.P.; Niyogi, D. Assessment of the Weather Research and Forecasting (WRF) model for simulation of extreme rainfall events in the upper Ganga Basin. Hydrol. Earth Syst. Sci. 2018, 22, 1095–1117. [Google Scholar] [CrossRef] [Green Version]
  32. Shrestha, R.; Connolly, P.; Gallagher, M. Sensitivity of WRF Cloud Microphysics to Simulations of a Convective Storm over the Nepal Himalayas. Open Atmos. Sci. J. 2017, 11, 29–43. [Google Scholar] [CrossRef] [Green Version]
  33. Orr, A.; Listowski, C.; Couttet, M.; Collier, E.; Immerzeel, W.; Deb, P.; Bannister, D. Sensitivity of simulated summer monsoonal precipitation in Langtang Valley, Himalaya, to cloud microphysics schemes in WRF. J. Geophys. Res. Atmos. 2017, 122, 6298–6318. [Google Scholar] [CrossRef] [Green Version]
  34. Rama Rao, Y.V.; Alves, L.; Seulall, B.; Mitchell, Z.; Samaroo, K.; Cummings, G. Evaluation of the weather research and forecasting (WRF) model over Guyana. Nat. Hazards 2012, 61, 1243–1261. [Google Scholar] [CrossRef]
Figure 1. 500 hPa height field (colored) (unit: m2/s2) and 850 hPa wind field at 20:00 UTC on 19 July 2021. The white solid line is the Western Pacific Subtropical High ridge.
Atmosphere 13 00600 g001
Figure 2. Change in the hourly measured rainfall with time at Zhengzhou Station from 00:00 19 July 2021 to 22:00 20 July 2021.
Atmosphere 13 00600 g002
Figure 3. Truncated orography (unit: m): (a) T1279 orography and (b) T511 orography. The solid black lines are the 1000 m contour lines. The black dot denotes the location of Zhengzhou. The two large white rectangles indicate the Taihang Mountains (top) and the Funiu Mountains (bottom). The small white rectangle in the lower rectangle indicates the Songshan Mountains, which are part of the Funiu Mountains.
Atmosphere 13 00600 g003
Figure 4. The average hourly rainfall measured and simulated at different orographic resolutions in the main rainfall area (33–38° N, 111–116° E).
Atmosphere 13 00600 g004
Figure 5. The 24 h accumulated rainfall (a,c,e,f) from 00:00 on 19 July 2021 to 00:00 on 20 July 2021, and (b,d,f,h) from 12:00 on 19 July 2021 to 12:00 on 20 July 2021. (a,b) Measured rainfall, (c,d) station rainfall, (e,f) T1279_orography simulation rainfall, (g,h) GPM IMERG rainfall data (unit: mm).
Atmosphere 13 00600 g005
Figure 6. Schematic diagram of the basic mechanisms of convective initiation over mountains: (a) forced ascent, (b) upstream blocking, (c) lee-side convergence, (d) thermally forced anabatic flow and convection over the crest, (e) nocturnal katabatic flow and convection near the mountain base, (f) lee-side thermally driven upslope flow and gravity-wave ascent aloft, and (g) a quasi-stationary cold pool beneath precipitating convection [27].
Atmosphere 13 00600 g006
Figure 7. The change in the altitude (column shadow) at the same latitude of 34.7° N passing Zhengzhou Station and the cumulative rainfall from 08:00 on 19 July 2021 to 20:00 on 21 July 2021.
Atmosphere 13 00600 g007
Figure 8. Rainfall simulations (unit: mm) for the (a) T799 orography, (b) T639 orography, and (c) T511 orography from 00:00 on 19 July 2021 to 00:00 on 20 July 2021 and their differences from the T1279 orography simulation: (d) T1279−T799, (e) T1279−T639, and (f) T1279−T511.
Atmosphere 13 00600 g008
Figure 9. Rainfall simulations (unit: mm) for the (a) T799 orography, (b) T639 orography, and (c) T511 orography from 12:00 on 19 July 2021 to 12:00 on 20 July 2021 and their differences from the T1279 orography simulation: (d) T1279−T799, (e) T1279−T639, and (f) T1279−T511.
Atmosphere 13 00600 g009
Figure 10. The average vertical velocities (unit: Pa/s) at 700 hPa simulated using the different orographic resolutions: (a,b) T1279 orography; (c,d) T799 orography; (e,f) T639 orography; (g,h) T511 orography; (a,c,e,g) from 00:00 on 19 July 2021 to 00:00 on 20 July 2021 and (b,d,f,h) from 12:00 on 19 July 2021 to 12:00 on 20 July 2021.
Atmosphere 13 00600 g010
Figure 11. The vertical velocity zonal profiles (unit: Pa/s) along Zhengzhou (34.7° N) simulated by using different orographic resolutions: (a,b) T1279 orography; (c,d) T799 orography; (e,f) T639 orography; (g,h) T511 orography; (a,c,e,g) from 00:00 on 19 July 2021 to 00:00 on 20 July 2021 and (b,d,f,h) from 12:00 on 19 July 2021 to 12:00 on 20 July 2021.
Atmosphere 13 00600 g011
Figure 12. The average vorticity (unit: s−1) at 850 hPa simulated using the different orographic resolutions: (a,b) T1279 orography; (c,d) T799 orography; (e,f) T639 orography; (g,h) T511 orography; (a,c,e,g) from 00:00 on 19 July 2021 to 00:00 on 20 July 2021 and (b,d,f,h) from 12:00 on 19 July 2021 to 12:00 on 20 July 2021.
Atmosphere 13 00600 g012
Figure 13. The average divergence (unit: s−1) at 200 hPa simulated using the different orographic resolutions: (a,b) T1279 orography; (c,d) T799 orography; (e,f) T639 orography; (g,h) T511 orography; (a,c,e,g) from 00:00 on 19 July 2021 to 00:00 on 20 July 20201 and (b,d,f,h) from 12:00 on 19 July 2021 to 12:00 on 20 July 2021.
Atmosphere 13 00600 g013
Table 1. Truncated wave number of orography and its corresponding horizontal resolution.
Experiment NameTruncated Wave NumberHorizontal Resolution
T1279 orography1279~16 km
T799 orography799~25 km
T639 orography639~31 km
T511 orography511~40 km
Table 2. Initiation time and simulation intervals of the experiments.
Start TimeTime RangeInterval
Experiment 10000 UTC 18 July 20210000 UTC 19 July 2021–0000 UTC 19 July 202124 h
Experiment 21200 UTC 18 July 20211200 UTC 19 July 2021–1200 UTC 20 July 202124 h
Table 3. Classification standards of rainfall intensity in the inland areas of China.
Rainfall Level24 h Total Rainfall (mm)
Light rain0.1–9.9
Moderate rain10.0–24.9
Big rain25.0–49.9
Heavy rain50.0–99.9
Big heavy rain100.0–249.9
Extraordinarily heavy rain≥250.0
Publisher’s Note: MDPI stays neutral with regard to jurisdictional claims in published maps and institutional affiliations.

