Article

Characterization and Source Discovery of Wintertime Fog on Coastal Island, Bangladesh

1
Department of Chemistry, Faculty of Science, University of Dhaka, Dhaka 1000, Bangladesh
2
Atomic Energy Centre, Dhaka, 4, Kazi Nuzrul Islam Avenue, Ramna, Dhaka 1000, Bangladesh
*
Author to whom correspondence should be addressed.
Atmosphere 2022, 13(3), 497; https://doi.org/10.3390/atmos13030497
Submission received: 9 February 2022 / Revised: 6 March 2022 / Accepted: 14 March 2022 / Published: 19 March 2022
(This article belongs to the Section Biosphere/Hydrosphere/Land–Atmosphere Interactions)

Abstract

:
An extensive chemical investigation of fog water’s chemical composition, as well as source characterization, were carried out during the winter season (December to February) at an outflow location (Bhola, Bangladesh) of the Indo-Gangetic Plain (IGP). Characterization of the source involved correlational analysis, enrichment factor analysis, estimation of percentage sources, and air mass trajectory analysis. The average pH of fog water in Bhola was found to be 7.03 ± 0.02, demonstrating that acid-neutralizing components were successful in neutralizing acidifying species. The concentrations of the water-soluble ions were determined, and they were in the following order: Ca2+ > NO3 > Cl > Na+ > SO42− > NH4+ > Mg2+ > K+ > F > HCO3. Of the six trace elements (Fe, Zn, Mn, Cu, Ni, Cr, Pb) that were analyzed, Zn ions were found in the highest concentration, followed by Mn ions. Neutralization factor analysis showed that the key neutralization components of fog-water were Ca2+ and NH4+. Enrichment factor (EF) calculation revealed the anthropogenic origin of NO3, SO42−, Zn, Mn, and Cu. The percentage source contributions of NO3 (99.74%), SO42− (84.02%), and Cl (8.30%) further support the anthropogenic origin. Backward air mass trajectory analysis was performed using the NOAA-HYSPLIT model. Long-range transport of contaminants over the IGP area was found to have a profound impact on the chemical composition of fog on the Bhola coast. This research has provided novel findings for the chemical characterization of fog water and the detection of its source at IGP outflow, and highlighted the anthropogenic contributions to local air pollution, as well as the transboundary influence on local air quality.

1. Introduction

Fog is a global meteorological phenomenon that occurs close to the earth’s surface and is composed of solid or liquid particles floating in the surrounding atmosphere [1]. The concentration of aerosol particles is very high in the lower atmosphere during winter due to low temperature, low wind velocity, and a boundary layer height of 500 m to 800 m [2]. Consequently, fog’s chemical composition is regulated by physicochemical interactions between gases, aerosol particles, and fog droplets [3,4,5,6]. Aerosol particles serve as cloud condensation nuclei (CCN) for the formation of fog and are considered a critical transport medium for pollutants from the atmosphere to enter the biosphere [7,8,9]. The chemical composition of fog varies from time to time and from place to place depending on many factors, such as accumulation and precipitation of aerosols, adsorption of atmospheric gases, temperature, atmospheric boundary layer height, deposition of contaminants from evaporated fog or rain, etc. [10,11,12]. The presence of NOx, SOx, and hydrogen acids make fog acidic. However, these are neutralized by the alkaline components existing in soil and atmospheric ammonia [13]. Suspended particles in the air also contribute to the composition of fog [14]. During the formation of fog on a surface, fog droplets dissolve the soluble components of the surface, which then react with one another to generate new substances. In addition, gases are absorbed by fog, resulting in chemical reactions with a variety of products in the environment. In this way, fog serves as a scavenger for soluble gases, such as nitric acid and ammonia, and encourages different chemical reactions in the aqueous phase [6]. The formation of secondary aerosols is often facilitated by such reactions [15]. During the winter, aerosols remain suspended in the air for an extended length of time, resulting in fog that has greater ionic concentrations [10,11,12]. To a significant extent, the ionic content of fog serves as a marker for the local environment [10,11]. For obvious reasons, fog chemistry is regarded as a tracer for atmospheric pollutants [16].
Over many years, dense fog events have been observed during winter in the Indo-Gangetic Plain (IGP), encompassing northern India, southern Nepal, Bangladesh, and Bhutan [17,18]. In the winter season, incineration of agricultural waste and biomass burning in the IGP region is mostly responsible for loading aerosol particles in the atmosphere [19]. The IGP region acts as a receptor and emitter for transporting aerosols among Arabia, Southeast Asia, and the rest of the Indian subcontinent [20]. As a result, the composition of the lower atmosphere is altered due to the absorption of regional air pollutants. Such polluted air flows from the northern part to the southern region of IGP. Eventually, it gets mixed with comparatively pure air over the ocean during the winter northeast (NE) monsoon season (December–April) [20]. Hence, a somewhat high aerosol concentration was found in coastal Bhola Island, an IGP outflow site located near the Bay of Bengal [21]. Bhola is a remote area with no industry and little population, so pollutant anthropogenic origin is mostly attributed to biomass burning and the transboundary effect [22]. However, there are few research investigations of the chemical characterization of fog water and the nature of its source at this crucial site. A thorough analysis of the chemical composition of Bhola fog water can provide valuable information about regional and transboundary air pollution problems. Therefore, the objective of this study was to characterize the physical and chemical properties of Bhola fog water. Based on the enrichment factor and the percentage source contribution, water soluble ions and trace metals were detected from various sources, such as natural or anthropogenic. In addition, we calculated the trans-boundary effect on fog composition in order to assess the local air quality in the study area. The findings of this study will assist policymakers in better understanding the mitigation options for the anthropogenic contribution to atmospheric pollution in this region.

2. Materials and Methods

2.1. Sampling Location

This study was carried out at Bhola, the largest island in Bangladesh. Bhola has a latitude of 22.4967° N and a longitude of 90.7564° E and covers 1441 km², as shown in Figure 1. The Bay of Bengal is situated in the south of Bhola district. Therefore, contaminants from the IGP area flow over Bhola to the Bay of Bengal. Bhola has a population of 1.7 million, with a density of 1162.39/km2. 80% of the total population earn their living by fishing. No significant industry is found on this island owing to its geographical location. People use biomass for cooking, and biomass burning severely degrades local air quality [22]. The mean annual temperature in Bhola is 25.9 °C, and the average yearly precipitation is 230 mm [23].

2.2. Collection of Samples and Chemical Analysis

Fog water samples were collected in Bhola, Bangladesh, at night for a mean period of 9 h during the winter season (December 2017–February 2018). Rain did not occur throughout the sampling period. A handmade fog sampler utilized in the current investigation was approximately 71 cm tall and was mounted on a stand (Figure 1) (Ahmed et al. 2018). The collector was placed above an air pollution monitoring tower, with a height of 6 m. Fog samples were condensed at the collector’s surface and later collected in a PET (polyethylene terephthalate) bottle attached to the collector’s bottom. During the sampling period, 18 fog samples were collected; blank samples were also collected simultaneously. All samples were filtered using Whatman 41 (0.45 μm pore size) filter paper. The filtrate was divided into two portions, one of which was subjected to acid digestion for trace metal analysis. In the other half, pH, conductivity, total dissolved solids (TDS), water-soluble ions, and total organic carbon (TOC) were determined. Field blanks were collected and analyzed using the same process that was used for fog water in order to reduce the possibility of error. A reagents blank was also used in order to limit experimental error.
Seven metals (Fe, Zn, Mn, Cu, Ni, Cr, Pb) were quantified in fog samples using a flame atomic absorption spectrophotometer (Model: SpectrAA 55B, Varian). Before preservation in the refrigerator, samples were acidified with 65% HNO3 acid. Standard solutions of different concentrations were prepared for individual elements to determine their sample concentration using a calibration curve. Blank samples were also analyzed in the same manner to ensure accuracy of the obtained data.
The pH of the fog water was determined using a pH meter (pH 211, Hanna Instruments). The electrical conductivity (EC) of the sample was measured using a conductivity meter (CM-5S, DKK-TOA Corporation, Japan). A TDS meter was used to measure fog water total dissolved solids (TDS), while total organic carbon (TOC) was quantified using a TOC analyzer (Apollo 9000).
The concentration of water-soluble anions (SO42−, NO3, F, and Cl) and cations (NH4+, K+, Na+, Ca2+, and Mg2+) in filtered fog samples was measured using the ion chromatography technique. For this purpose, the analytical columns IonPac CS17 and IonPac AS11-HC (Ion Chromatograph, Dionex DX-3000, USA) were used. The concentration of HCO3 ion was calculated from pH using Equation (1) (Lu et al. 2010).
[HCO3] = 10−11.2+pH

2.3. Quality Control

Clean and dry PET bottles were used for the collection of fog samples. After overnight sampling, fog water was collected at dawn to prevent evaporation caused by sunlight. Samples were kept in an airtight container and stored in the refrigerator to ensure minimum contamination. Pure deionized water was used for cleaning the instruments and containers. All standard solutions were prepared by dissolving high purity salts in ≥18.2 M of deionized water. Triplicate analysis of 10% of all samples was carried out using the AAS technique. Several samples were diluted so that results could be obtained within the instruments’ analytical range. The calibration curve for individual species was carefully constructed.

3. Results and Discussion

3.1. Physical Properties of Fog Water

Color and Odor

The unfiltered fog samples were slightly turbid due to suspended solids. The insoluble solid particles might be soil-derived aerosols and wind-blown dust particles. After filtration, clear fog samples were obtained. All the samples were odorless, which was attributed to the absence of pungent compounds in Bhola fog water.

3.2. pH, TDS, and EC

The average pH of the fog samples was 7.03 ± 0.02 (pH range 6.85–7.25), which was within the WHO’s recommended limit [24]. Such a pH of fog water indicates a neutral condition. Different acidic compounds are formed when acidic gases, e.g., NOx and SOx, are dissolved in fog water [25]. As fog is created close to the earth’s surface, these acidic compounds are neutralized by soil-derived essential compounds and ammonia [25]. This fact accounts for the neutralization of fog water.
The amount of total dissolved solids (TDS) of fog samples ranged from 101 to 465 ppm, with an average of 235.8 ± 128 ppm. According to WHO (2003), fog water with a TDS level of less than 600 ppm is considered palatable, and it becomes significantly unpalatable with a TDS level of above 1000 ppm. Hence, the fog samples were suitable for all-purpose usage.
The average electrical conductivity (EC) of the collected fog samples was 371.22 µS.cm−1, and the EC value ranged within 275–489 µS.cm−1. A trend between TDS and EC of Bhola fog water was noted as shown in Figure 2. It can be assumed that electrical conductivity (EC) correlates positively with total dissolved solids (TDS). The higher the TDS in fog water, the higher is the electrical conductivity.

3.3. Total Organic Carbon (TOC)

The total organic carbon (TOC) content of fog water provides an indication of the quantity of natural organic matter (NOM) present in fog water. Figure 3 displays the total organic carbon (TOC) concentrations found in fog water collected on several days throughout the year. During the sampling period, the total organic carbon (TOC) concentration averaged 15.83 ppm, with the highest concentration recorded on 13 January (27.37 ppm) and the lowest concentration recorded on 22 December (6.32 ppm).

3.4. Water-Soluble Ions

In the fog water sample, the average concentrations of F, Cl, SO42−, NO3, HCO3, Na+, K+, NH4+, Ca2+, and Mg2+ were determined to be 77.7 ± 38.5, 937 ± 416.5, 725.24 ± 383.9, 1002.4 ± 562.2, 70 ± 48.2, 733.8 ± 205.3, 338.6 ± 188.7, 562.5 ± 402.9, 1147.4 ± 616.2 and 350 ± 125.5 µeqL−1, respectively, as presented in Figure 4. The order of ionic concentration was found to be: Ca2+ > NO3 > Cl > Na+ > SO42− > NH4+ > Mg2+ > K+ > F > HCO3. The crustal sources of Ca2+ were responsible for the highest concentration of Ca2+ [14]. Scavenging of aerosols and dissolution of gaseous nitric acid may account for the highest concentration of NO3 among the anions [26]. High concentrations of Na+ and Cl ions suggest a considerable marine contribution in Bhola fog water [14]. Figure 5 depicts the percent contribution of each ion element of fog water to the total measured ions; it can be seen that Ca2+ provided the highest contribution (37%) of all the cations, followed by Na+ (23%). NO3 had the highest concentration (37%) among all the anions, followed by Cl (34%) and SO42− (26%).
The concentration of total cations, ∑cation (3.13 × 10³ µeqL−1) was nearly equal to total anions, ∑anion (2.91 × 10³ µeqL−1). The ratio of ∑cation to ∑anion was 1.07, which indicated that Bhola fog water was almost neutral, aligning with the recorded pH. According to World Meteorological Organization guidelines, the ion balance (IB) value should be less than 25% for pH > 5.5 [27]. Ion balance was calculated using Equation (2) [26] and was found to be 3.6%. The observed anion deficiency in fog samples may, however, be due to the exclusion of HCOO and CH3COO ions from the measurements, changing the ratio of ∑cation/∑anion. As forests and agricultural fields encompass Bhola, organic ions may have contributed in large quantity. Moreover, as Bhola is close to the Bay of Bengal, sea-derived organic species could also be responsible for the ion imbalance (O’Dowd et al. 2004).
Ion balance (IB) = [(∑anion − ∑cation)/(∑anion + ∑cation)] × 100

3.5. Trace Metals

In Bhola fog water, the average concentration of Zn, Mn, Fe, and Cu was 336 ± 150, 272 ± 123, 50 ± 30, and 23 ± 15 μgL−1, respectively, whereas the concentration of Pb, Cr, and Ni was very low. The average trace metal concentration sequence was found to be Zn > Mn > Fe > Cu > Ni > Cr > Pb, as shown in Figure 6. The trace metal sources in fog water can be both natural and anthropogenic. In Bangladesh, the maximum recommended values for Fe, Cu, Mn, and Zn are 1000, 1000, 100, and 5000 µgL−1, respectively [24]. With the exception of Mn, the concentrations of all other trace metals were lower than the recommended levels.

3.6. Correlation Analysis

Table 1 shows the correlation matrix for measured ion pairs and trace metals in fog water. HCO3 was excluded as it was determined mathematically using the measured pH of fog. Pb, Ni, and Cr were excluded because of their low concentrations. Mg2+ and Ca2+ in the fog were attributed to crustal sources, which was evident from their correlation value (r = 0.62). A strong correlation was found between NH4+ and Ca2+ (0.68), indicating that NH4+ ion could be present in the soil. K+ might have a crustal origin as it correlated strongly with Ca2+. Correlation values between Na+ and Mg2+ (r = 0.79) and Na+ and Ca2+ (r = 0.61) suggested that some Ca2+ and Mg2+ ions might have originated from sea salt spray. SO42− showed a significant correlation with NH4+ (at p = 0.03), indicating anthropogenic sources. The correlation value (r = 0.79) between SO42− and NO3 demonstrated co-emission of their precursors (SOx and NOx). The strong correlation of Cl- with Na+ (r = 0.95), indicated a significant marine contribution to fog water.
Anthropogenic sources might be responsible for the presence of Mn, NO3 and SO42− ions in fog water, apparent from their high correlation values. Mn and Zn might have similar sources, as they showed an apparent correlation with each other. Zn, showing a marked correlation with NH4+ and SO42−, indicating both crustal and anthropogenic origins. Cu correlated strongly with Cl, indicating marine origin. Thus, correlation analysis revealed both natural and anthropogenic influences on the chemical composition of Bhola fog water.

3.7. Fractional Acidity and Neutralizing Factor

The fog water fractional acidity (FA) was determined using Equation (3) [28]:
FA = [H+]/([SO42−] + [NO3])
When FA is zero, it denotes maximum neutralization, whereas FA = 1 indicates no neutralization.
The average FA for Bhola fog water was 0.0005, and FA varied within the range 0.001–0.0001. This value implies effective neutralization of the major acidic constituents (SO42− and NO3) by major acid-neutralizing constituents (Ca2+, K+, NH4+, and Mg2+) of fog water. The contribution of Cl to acidity and Na+ to alkalinity was not considered since they mainly emerged from sea salt spray that has a neutral composition [29].
The relative contribution of SO42− and NO3 ions to acidification was evaluated using Equations (4) and (5) [28].
C(SO42−) = [SO42−]/([SO42−] + [NO3])
C(NO3) = [NO3]/([SO42−] + [NO3]).
The average contribution of SO42− to acidity was 54.7%, whereas that of NO3 was 45.3%. In some fog samples, the dominating acidifying component was SO42− and that for other samples was NO3.
Using Equation (6), the neutralization factor (NF) was calculated [28].
NFx = [X]/([NO3] + [SO42−])
where X is the species for which the neutralization factor is to be determined. The contribution of alkaline components to neutralization can be inferred from the value of NF. The neutralization factors of Ca2+, NH4+, Mg2+ and K+ were calculated and the order was: NFCa2+ (0.66) > NFNH4+ (0.33) > NFMg2+ (0.20) > NFK+ (0.19). So, Ca2+ and NH4+ played a major role in neutralizing the acidic constituents.
The ratio of neutralizing potential (NP) to acidifying potential (AP) was calculated to determine the balance between acidity and alkalinity. Neutralizing potential (NP) and acidifying potential (AP) are defined as [30]:
NP = ([nss- Ca2+] + [NH4+])
and AP = ([nss- SO42−] + [NO3])
Equations (9) and (10) were used to evaluate non-sea salt sulfate (nss- SO42−) and non-sea salt calcium (nss- Ca2+):
nss- sulphate= SO42− − (SO42− / Na+) sea ∗ Na+
nss- calcium= Ca2+ − (Ca2+ / Na+) sea ∗ Na+
where (SO42−/Na+) sea and (Ca2+/Na+) sea were the ratios of the concentration of SO42− to Na+ and that of Ca2+ to Na+ in sea water, with values equal to 0.12 and 0.44, respectively [31]. The average NP/AP ratio was 0.98 (≈1), indicating an exact balance between the alkaline and acidic constituents of fog [29]. The recorded pH (7.03) of Bhola fog water also aligned with this fact.
To verify the neutralizing action of alkaline components, [Ca2+ + Na+ + NH4+ + Mg2+] was plotted against [SO42− + NO3 + Cl] as shown in Figure 7 [32]. The value of R2 (=0.9841) also confirmed effective neutralization of fog samples.

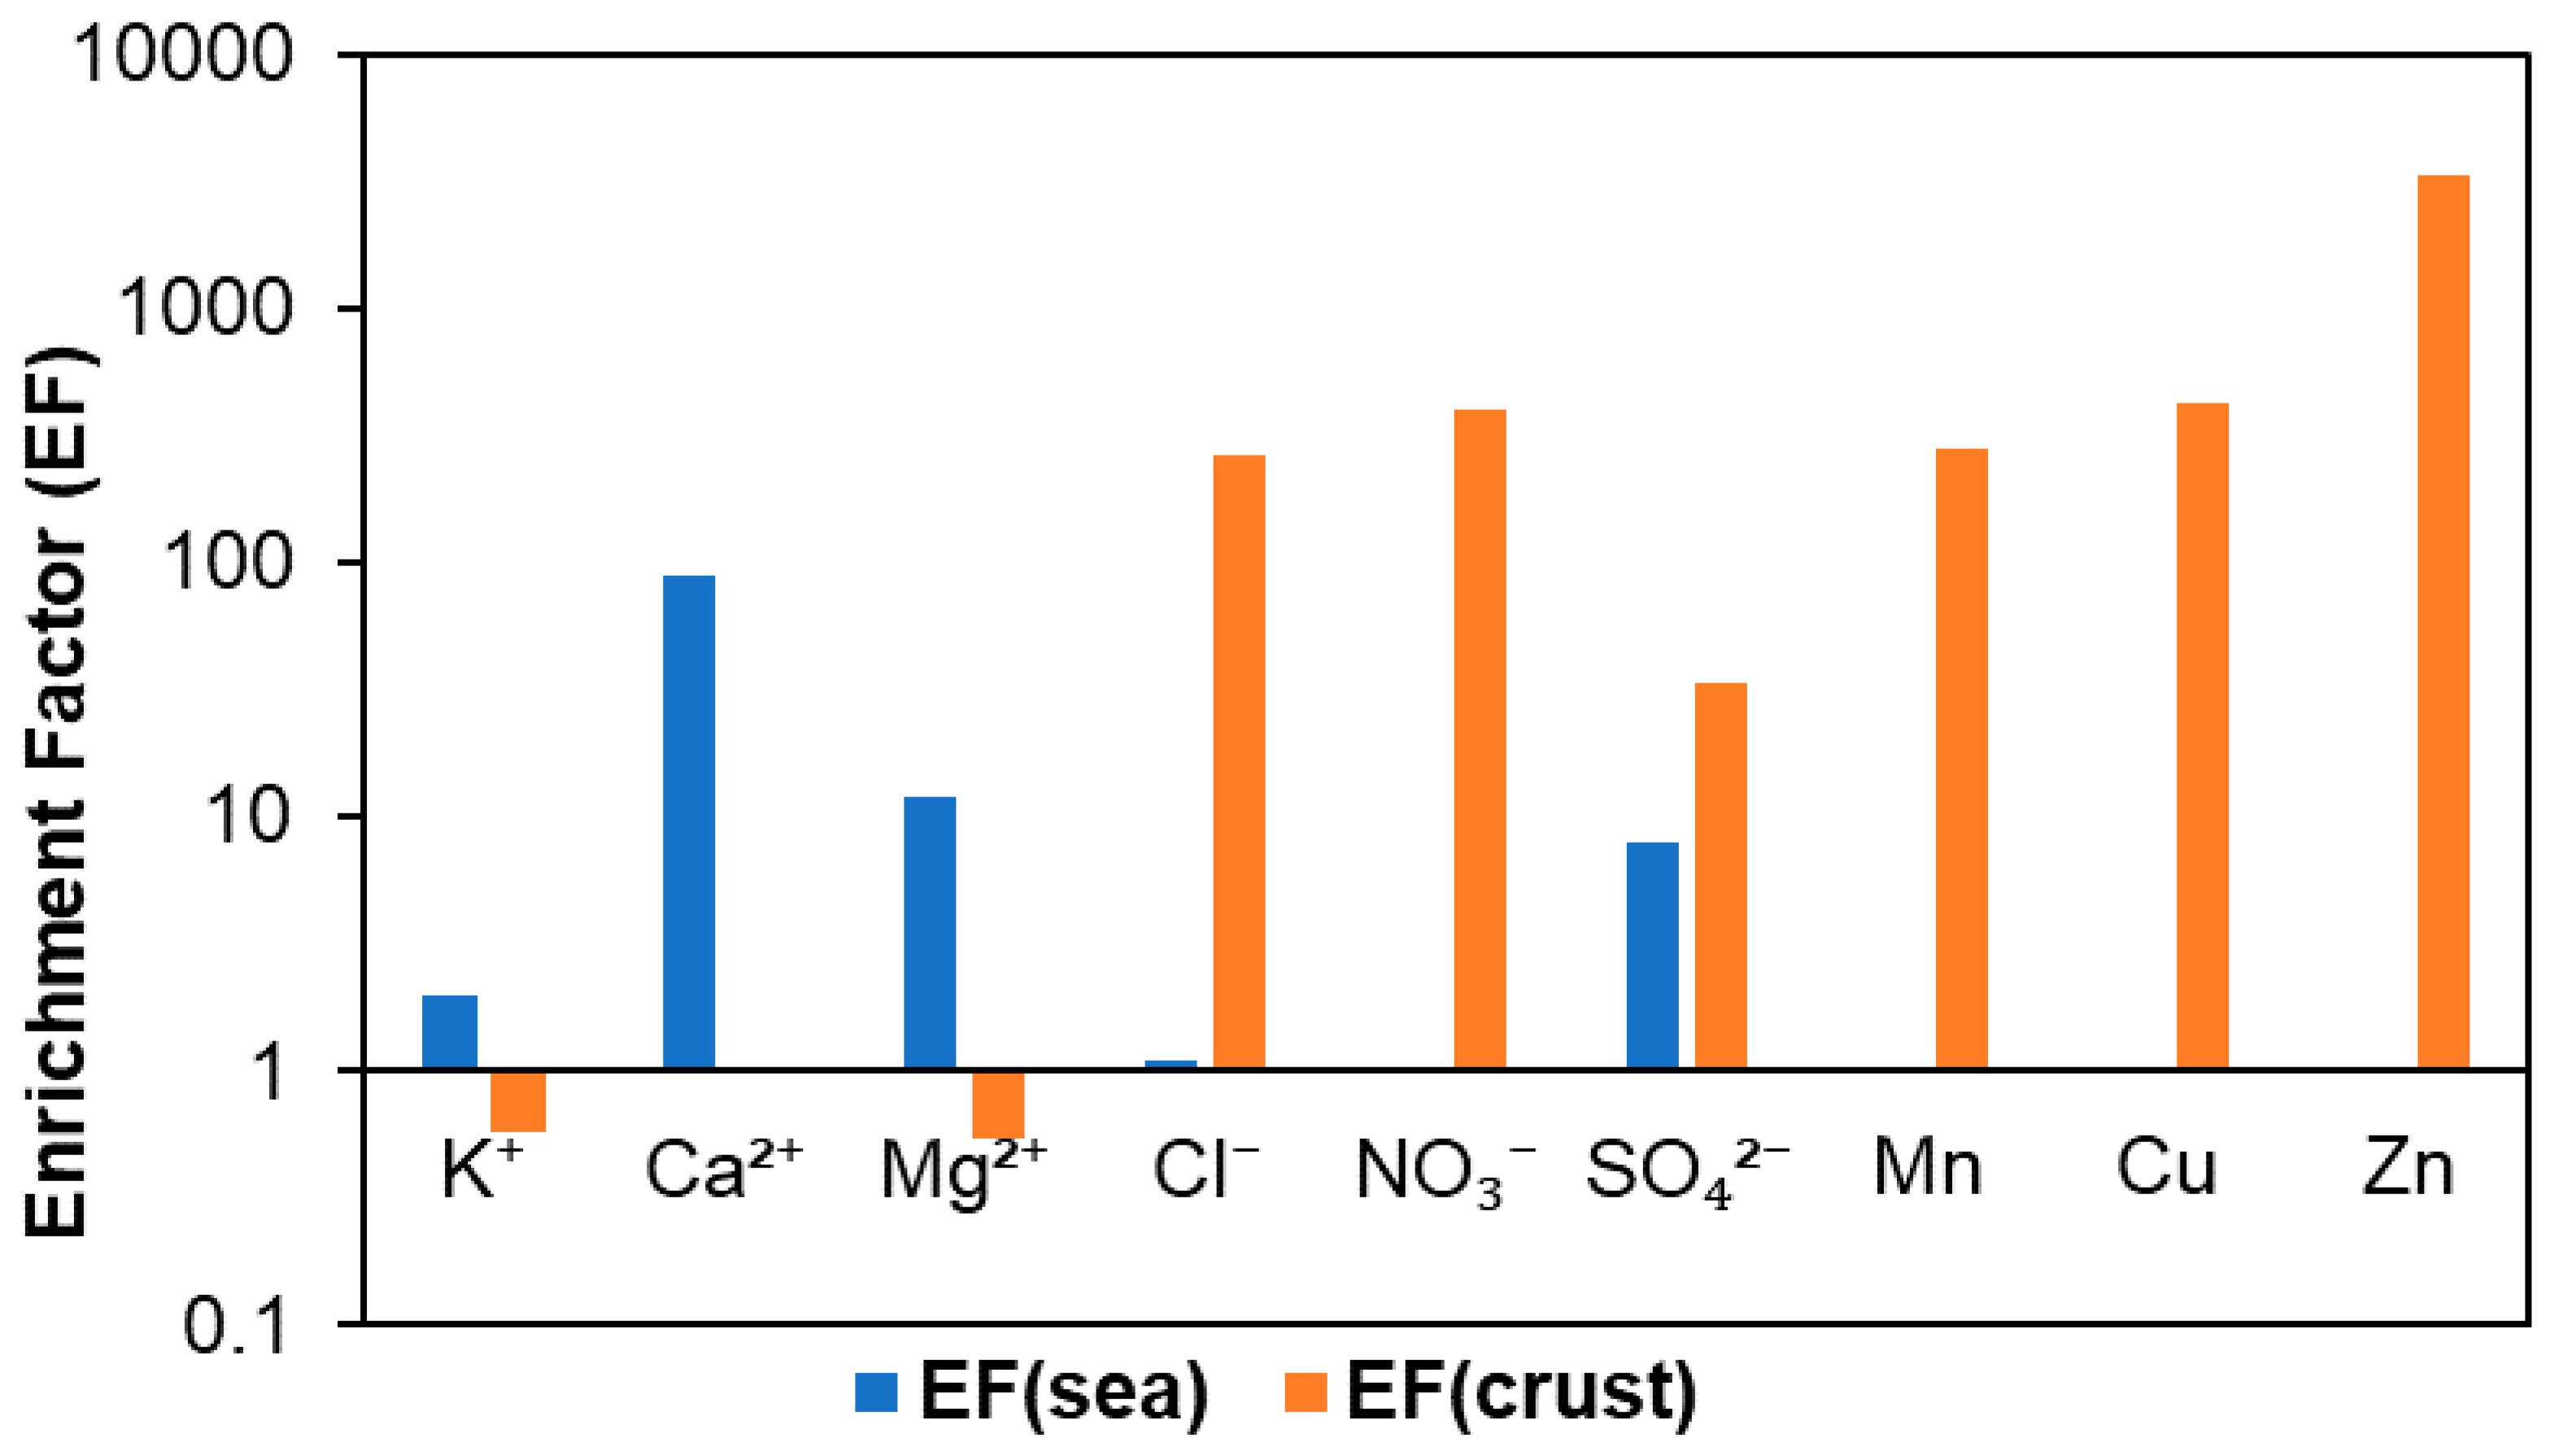
3.8. Enrichment Factor

The enrichment factor (EF) refers to the double ratio of the concentration of a measured ion or element to that of a reference element in the sample and the reference sources, e.g., seawater, earth crust [33]. Since it is believed to be of solely marine origin, Na was taken as the reference element for seawater [34]. As a lithospheric element, Ca was used as a reference element for the earth’s crust [35,36].
EFsea = (X/Na)fog/(X/Na)sea
EFcrust = (X/Ca)fog/(X/Ca)crust
Here, X is the concentration of the concerned element. (X/Na)the sea is the ratio from seawater composition, and (X/Ca)crust is the crustal composition ratio [12]. An EF value much less than or much higher than 1 indicates that the interest element is either diluted or enriched with respect to the reference source [37].
Seawater was the probable primary source of Cl, which is evident from its EF values, as presented in Figure 8 (EFsea = 1.09, EFcrust = 263.5). However, the Cl/Na+ ratio in fog water (1.27) was slightly higher than that in seawater (1.16). So, there might be other sources of Cl as well. The EF values of K+ and Mg2+ indicated that they mainly originated from the crustal sources with only a meagre contribution from marine sources. SO42− and NO3, with much higher EF values, indicated anthropogenic influence on fog water composition. The enrichment factor of trace metals in fog water was calculated using Equation (13), taking Fe as the reference material [38]:
EF = (X/Fe) fog/(X/Fe) crust
where X is the concentration of the species of interest; the value of (X/Fe)crust for all trace metals was taken from Salam et al. 2003. Considering the enrichment factor of trace elements, the element of interest may be unenriched (EF = 1 to 10), moderately enriched (EF = 10 to 100), or highly enriched (EF > 100) [39]. An EF value of <10 suggests that the metal has a crustal source. An EF value of >10 indicates a non-crustal source for that element [40]. As the EF values of Cu, Mn and Zn were much greater than 100, these elements were highly enriched in Bhola fog water. For the same reason, it can be concluded that these elements were derived primarily from anthropogenic sources.

3.9. Source Contribution

The chemical species in fog derived mostly from anthropogenic sources, sea salt, and terrestrial dust from wind erosion since volcanic eruption and other natural source contributions were insignificant. To estimate the source contribution of water-soluble inorganic ions to Bhola fog water, their marine, crustal, and anthropogenic contributions were considered.

3.10. Marine Contribution

Sea salt fraction (SSF) and non-sea salt fraction (NSSF) were obtained using Equations (14) and (15) to evaluate the marine contribution to fog water [34]:
%SSF = 100 (X/Na) sea/(X/Na) fog
%NSSF = 100 − (%SSF)
where X is the concentration of the species of interest; Na was considered the reference element.
From Figure 9, it can be inferred that marine contribution was the highest for Cl (91.33%), followed by K+ (48.29%), SO42− (13.01%), and Mg2+ (8.30%) and Ca2+ (1.11%). Sea salt spray was their main source, as Bhola is a coastal island. Higher %NSSF values of NO3 (99.99%), Ca2+ (98.89%), Mg2+ (91.70%), SO42− (86.99%) and K+ (51.71%) indicated that a fraction of these species originated from non-marine, e.g., crustal and anthropogenic, sources.

3.11. Anthropogenic and Crustal Contribution

The crustal fraction (%CF) and anthropogenic fraction (%AF) of different species present in fog water were calculated to estimate their crustal and anthropogenic contribution, respectively, using the following equations [28]:
%CF = 100 (X/Ca)soil/(X/Ca)fog
%AF = 100 − SSF(%) − CF(%)
where X is the concentration of the concerned element; Ca was used as a reference element while calculating crustal contribution.
Mg2+, with the highest %CF value (95%), had a significant crustal origin, followed by K+ (87%). The soil was considered the major source of NSSF K+ in Bhola fog water as the %AF value of K+ was negligible. A trivial crustal contribution was found for SO42− (2.97%), Cl (0.37%) and NO3 (0.25%).
However, anthropogenic sources were responsible for SO42− and NO3 in fog water, which was evident from their respective %AF values of 84.02% and 99.74%. A small fraction of Cl (%AF = 8.30%) might have a human-made origin. Figure 10 shows the source contribution for various species graphically. The high anthropogenic contribution of SO42− and NO3 in fog water indicates the release of their precursor gasses SOx and NOx into the atmosphere from various sources, such as biomass combustion, coal combustion, industrial and vehicle pollution, transboundary impacts, etc. [13,28,41]. Biomass burning is common in Bhola as biomass is used for cooking and agriculture firing. NSSF Cl in fog water might have originated from anthropogenic HCl gas absorption by airborne liquid droplets, followed by deposition and soil-derived chloride salts [42]. Hydrogen chloride was possibly deposited via smoke from coal-fired domestic stoves, where fuel and household refuse, such as plastic, paper, wood sticks, crop residue, cow dung cakes, are burnt [42]. People in Bhola mostly use domestic cooking stoves, and burning crop residue is a widespread scenario during the winter season.

3.12. Air Mass Back Trajectories Analysis

Archived meteorological data is widely used to conduct air mass backward trajectories analysis to identify the origin of regional air and investigate the probable source regions of air pollutants [1,43]. 24-h backward air mass trajectories were determined at 500, 1500, and 2500 m AGL (above ground level) for Bhola fog samples during winter using the NOAA HYSPLIT model (hybrid single-particle Lagrangian integrated trajectory model) (http://www.arl.noaa.gov, 15 February 2018). Table 2 represents a summary of the air mass back trajectories analysis which is presented in Figure 11. According to these assessments, air masses mostly formed in the Indo-Gangetic plain (IGP) during the winter season (December-January) and migrated over the northwestern area of Bangladesh to reach Bhola. As Bhola is a remote coastal area without any industry, the anthropogenic contribution is attributed to biomass burning for cooking and agriculture firing. Hence, transboundary airflow and regional urban air pollution might have influenced Bhola fog water’s chemical composition, as per trajectory analysis.

4. Conclusions

An investigation of the chemistry of fog water was carried out in the winter (from December to January) at Bhola, Bangladesh, in order to characterize the composition of the fog. An average pH of 7.03 of fog water indicated an ideal balance between acidifying and acid-neutralizing components. The dominant ions in fog water were Ca2+, NO3, Cl, Na+, and SO42−, accounting for 19%, 17%, 16%, 12%, and 12% contribution, respectively, among all the measured inorganic ions. Ca2+ and NH4+ were found to be significant acid-neutralizing species. Enrichment factor analysis and calculation of percentage source contribution revealed that SO42− and NO3 mostly originated from anthropogenic sources. Backward air mass trajectories analysis showed a transboundary influence on the fog water chemical composition of coastal Bhola Island. This research aids in determining pollutant sources, anthropogenic contributions, and in estimating the transboundary effect on fog composition in order to assess local air quality. The findings will offer information to policymakers in order to help them reduce pollution of the atmosphere in this area.

Author Contributions

K.N.: execution of the experimental investigations, drafting of the manuscript; S.N.: execution of part of the experimental investigations; F.J.: editing, review and supervision; M.S.I.: drafting manuscript, editing, review, and supervision; M.S.R.: execution of part of the experimental investigations; T.R.C.: execution of part of the experimental investigations; K.J.F.: execution of part of the experimental investigations; A.S.: conceptual development, editing, review and supervision. All authors have read and agreed to the published version of the manuscript.

Funding

Department of Chemistry, University of Dhaka.

Institutional Review Board Statement

Not applicable.

Informed Consent Statement

Not applicable.

Data Availability Statement

Not applicable.

Acknowledgments

The authors express their gratitude to the University of Dhaka for providing financial assistance in order to publish the work in the atmospheric journal. The authors also gratefully acknowledge the financial support given for constructing the Bhola Observatory by Naval Research Global (ONRG), USA. Special thanks to the Chemistry Division of the Atomic Energy Commission, Dhaka, for support with necessary chemical analysis.

Conflicts of Interest

The authors declare no conflict of interest.

References

  1. Yang, J.Y.; Xie, C.E.; Shi, C.E.; Liu, D.Y.; Niu, S.J.; Li, Z.H. Ion Composition of fog water and its relation to air pollutants during winter fog events in Nanjing, China. Pure Appl. Geophys. 2012, 169, 1037–1052. [Google Scholar] [CrossRef]
  2. Nair, V.S.; Moorthy, K.K.; Alappattu, D.P.; Kunhikrishnan, P.K.; George, S.; Nair, P.R.; Babu, S.S.; Abish, B.; Satheesh, S.K.; Tripathi, S.N.; et al. Wintertime aerosol characteristics over the Indo-Gangetic Plain (IGP): Impacts of local boundary layer processes and long-range transport. J. Geophys. Res. Atmos. 2007, 112, D13205. [Google Scholar] [CrossRef]
  3. Munger, J.W.; Waldman, D.J.; Hoffman, M.R. Fog water chemistry in an urban atmosphere. J. Geophys. Res. 1983, 88, 5109–5123. [Google Scholar] [CrossRef]
  4. Jacob, D.J.; Munger, J.W.; Waldman, J.M.; Hoffmann, M.R. H2SO4–HNO3–NH3 System at high humidities and in fogs, part 1, spatial and temporal patterns in the san Joaquin valley of California. J. Geophys. Res. 1986, 91, 1073–1088. [Google Scholar] [CrossRef]
  5. Pandis, S.N.; Seinfeld, J.H. Mathematical modelling of acid deposition due to radiation fog. J. Geophys. Res. 1989, 94, 12911–12923. [Google Scholar] [CrossRef] [Green Version]
  6. Pandis, S.N.; Seinfeld, J.H.; Pilinis, C. Chemical composition differences in fog and cloud droplets of different sizes. Atmos. Environ. 1990, 24A, 1957–1969. [Google Scholar] [CrossRef]
  7. Polkowsk, Ż.; Błaś, M.; Klimaszewska, K.; Sobik, M.; Małek, S.; Namieśnik, J. Chemical characterization of dew water collected in different geographic regions of Poland. Sensors 2008, 8, 4006–4032. [Google Scholar] [CrossRef] [Green Version]
  8. Rubio, M.A.; Lissi, E.; Villena, G. Nitrite in rain and dew in Santiago city, Chile. Its possible impact on the early morning start of the photochemical smog. Atmos. Environ. 2002, 36, 293–297. [Google Scholar] [CrossRef]
  9. Lynam, M.M.; Dvonch, J.T.; Hall, N.L.; Morishita, M.; Barres, J.A. Trace elements and major ions in atmospheric wet and dry deposition across central Illinois, USA. Air Qual. Atmos. Health 2015, 8, 135–147. [Google Scholar] [CrossRef]
  10. Lekouch, I.; Mileta, M.; Muselli, M.; Milimouk-Melnytchouk, I.; Šojat, V.; Kabbachi, B.; Beysens, D. Comparative chemical analysis of fog and rainwater. Atmos. Res. 2000, 95, 224–234. [Google Scholar] [CrossRef]
  11. Beysens, D.; Ohayon, C.; Muselli, M.; Clus, O. Chemical and biological characteristics of dew and rainwater in an urban coastal area (Bordeaux, France). Atmos. Environ. 2006, 40, 3710–3723. [Google Scholar] [CrossRef]
  12. Jiries, A. Chemical composition of fog in Amman, Jordan. Atmos. Res. 2001, 57, 261–268. [Google Scholar] [CrossRef]
  13. Kidron, G.J.; Starinsky, A. Chemical composition of fog and rain in an extreme desert (Negev): Cobbles serve as sink for nutrients. J. Hydrol. 2012, 420, 284–291. [Google Scholar] [CrossRef]
  14. Li, P.; Li, X.; Yang, C.; Wang, X.; Chen, J.; Collett, J.L. Fog water chemistry in Shanghai. Atmos. Environ. 2011, 45, 4034–4041. [Google Scholar] [CrossRef]
  15. Ervens, B.; Turpin, B.J.; Weber, R.J. Secondary organic aerosol formation in cloud droplets and aqueous particles (aqSOA): A review of laboratory, field and model studies. Atmos. Chem. Phys. 2011, 11, 11069–11102. [Google Scholar] [CrossRef] [Green Version]
  16. Nieberding, F.; Breuer, B.; Braeckevelt, E.; Klemm, O.; Song, Q.; Zhang, Y. Fog water chemical composition on Ailaoshan mountain, Yunnan province, SW China. Aerosol Air Qual. Res. 2018, 18, 37–48. [Google Scholar] [CrossRef]
  17. Gautam, R.; Hsu, N.C.; Kafatos, M.; Tsay, S.C. Influences of winter haze on fog/low cloud over the Indo-Gangetic plains. J. Geophys. Res. 2007, 112, D05207. [Google Scholar] [CrossRef] [Green Version]
  18. Kar, J.; Deeter, M.N.; Fishman, J.; Liu, Z.; Omar, A.; Creilson, J.K.; Trepte, C.R.; Vaughan, M.A.; Winker, D.M. Wintertime pollution over the Eastern Indo-Gangetic Plains as observed from MOPITT, CALIPSO and tropospheric ozone residual data. Atmos. Chem. Phys. 2010, 10, 12273–12283. [Google Scholar] [CrossRef] [Green Version]
  19. Rengarajan, R.; Sarin, M.M.; Sudheer, A.K. Carbonaceous and inorganic species in atmospheric aerosols during wintertime over urban and high-altitude sites in North India. J. Geophys. Res. 2007, 112, D21307. [Google Scholar] [CrossRef]
  20. Niranjan, K.; Sreekanth, V.; Madhavan, B.L.; Krishna, M.K. Wintertime aerosol characteristics at a north Indian site Kharagpur in the Indo-Gangetic plains located at the outflow region into Bay of Bengal. J. Geophy. Res. 2006, 111, D24209. [Google Scholar] [CrossRef] [Green Version]
  21. Salam, A.; Hossain, T.; Siddique, M.N.A.; Alam, A.S. Characteristics of atmospheric trace gases, particulate matter, and heavy metal pollution in Dhaka, Bangladesh. Air Qual. Atmos. Health 2008, 1, 101–109. [Google Scholar] [CrossRef] [Green Version]
  22. Ahmed, M.; Hossain, A.; Akther, T.; Shohel, M.; Salam, A. Chemical composition and source identification of fog water at an Indo-Gangetic plain (IGP) outflow location (coastal Bhola Island). Bangladesh. J. Environ. Pollut. Manag. 2018, 1, 1–9. [Google Scholar]
  23. Shohel, M.; Simol, H.A.; Reid, R.; Reid, J.S.; Salam, A. Dew water chemical composition and source characterization in the IGP outflow location (costal Bhola, Bangladesh). Air Qual. Atmos. Health 2017, 10, 981–990. [Google Scholar] [CrossRef]
  24. Islam, M.A.; Karim, M.R.; Higuchi, T.; Sakakibara, H.; Sekine, M. Comparison of the trace metal concentration of drinking water supply options in southwest coastal areas of Bangladesh. Appl. Water Sci. 2014, 4, 183–191. [Google Scholar] [CrossRef] [Green Version]
  25. Takeuchi, M.; Okochi, H.; Igawa, M. Deposition of coarse soil particles and ambient gaseous components dominating dew water chemistry. J. Geophys. Res. 2003, 108, D10. [Google Scholar] [CrossRef]
  26. Izhar, S.; Gupta, T.; Minz, A.P.; Senapati, S.; Panday, A.K. Influence of regional and long range transport air masses on fog water composition, contribution and toxicological response at Indo Gangetic Plain. Atmos. Environ. 2019, 214, 116888. [Google Scholar] [CrossRef]
  27. Allan, M.A. Manual for the GAW Precipitation Chemistry Programme. Guidelines, Data Quality Objectives and Standard Operating Procedures; World Meteorological Organization: Geneva, Switzerland, 2004; 160p. [Google Scholar]
  28. Yadav, S.; Kumar, P. Pollutant scavenging in dew water collected from an urban environment and related implications. Air Qual. Atmos. Health 2014, 7, 559–566. [Google Scholar] [CrossRef]
  29. Safai, P.D.; Budhavant, K.B.; Rao, P.S.P.; Ali, K.; Sinha, A. Source characterization for aerosol constituents and changing roles of calcium and ammonium aerosols in the neutralization of aerosol acidity at a semi-urban site in SW India. Atmos. Res. 2010, 98, 78–88. [Google Scholar] [CrossRef]
  30. Błaś, M.; Polkowska, Ż.; Sobik, M.; Klimaszewska, K.; Nowiński, K.; Namieśnik, J. Fog water chemical composition in different geographic regions of Poland. Atmos. Res. 2010, 95, 455–469. [Google Scholar] [CrossRef]
  31. Watanabe, K.; Takebe, Y.; Sode, N.; Igarashi, Y.; Takahashi, H.; Dokiya, Y. Fog and rain water chemistry at Mt. Fuji: A case study during the September 2002 campaign. Atmos. Res. 2006, 82, 652–662. [Google Scholar] [CrossRef]
  32. Lu, X.; Li, L.Y.; Li, N.; Yang, G.; Lu, D.; Chen, J. Chemical characteristics of spring rainwater of Xi’an city, NW China. Atmos. Environ. 2011, 45, 5058–5063. [Google Scholar] [CrossRef]
  33. Puxbaum, H. Luftchemie. Schriftenreihe “Modern Analytical Chemie”; Band Institut für Analytical Chemie, Technische Universät Wien: Vienna, Austria, 1993. [Google Scholar]
  34. Kulshrestha, U.C.; Kulshrestha, M.J.; Sekar, R.; Sastry, G.S.R.; Vairamani, M. Chemical characteristics of rainwater at an urban site of south-central India. Atmos. Environ. 2003, 37, 3019–3026. [Google Scholar] [CrossRef]
  35. Cao, Y.Z.; Wang, S.; Zhang, G.; Luo, J.; Lu, S. Chemical characteristics of wet precipitation at an urban site of Guangzhou, South China. Atmos. Res. 2009, 94, 462–469. [Google Scholar] [CrossRef]
  36. Zhang, M.; Wang, S.; Wu, F.; Yuan, X.; Zhang, Y. Chemical compositions of wet precipitation and anthropogenic influences at a developing urban site in southeastern China. Atmos. Res. 2007, 84, 311–322. [Google Scholar] [CrossRef]
  37. Safai, P.D.; Rao, P.S.P.; Momin, G.A.; Ali, K.; Chate, D.M.; Praveen, P.S. Chemical composition of precipitation during 1984–2002 at Pune, India. Atmos. Environ. 2004, 38, 1705–1714. [Google Scholar] [CrossRef]
  38. Tripathee, L.; Kang, S.; Huang, J.; Sillanpää, M.; Sharma, C.M.; Lüthi, Z.L.; Guo, J.; Paudyal, R. Ionic composition of wet precipitation over the southern slope of central Himalayas, Nepal. Environ. Sci. Pollutt. Res. 2014, 12, 2677–2687. [Google Scholar] [CrossRef]
  39. Al-Momani, I.F. Trace elements in atmospheric precipitation at Northern Jordan measured by ICP-MS: Acidity and possible sources. Atmos. Environ. 2003, 37, 4507–4515. [Google Scholar] [CrossRef]
  40. Chester, R.; Nimmo, M.; Preston, M.R. Te trace metal chemistry of atmospheric dry deposition samples collected at cap ferrat: A coastal site in the western mediterranean. Mar. Chem. 1999, 68, 15–30. [Google Scholar] [CrossRef]
  41. Xu, Y.; Zhu, H.; Tang, J.; Lin, Y. Chemical compositions of fog and scavenging of particles in changchun, China. Adv. Meteorol. 2015, 2015, 104048. [Google Scholar] [CrossRef]
  42. Lakhani, A.; Parmar, R.S.; Prakash, S. Chemical composition of dew resulting from radiative cooling at a semi-arid site in Agra, India. Pure Appl. Geophys. 2012, 169, 859–871. [Google Scholar] [CrossRef]
  43. Stein, A.F.; Draxler, R.R.; Rolph, G.D.; Stunder, B.J.; Cohen, M.D.; Ngan, F. NOAA’s HYSPLIT atmospheric transport and dispersion modeling system. Bull. Am. Meteorol. Soc. 2015, 96, 2059–2077. [Google Scholar] [CrossRef]
Figure 1. Sampling location (left picture) of coastal Bhola island on the map of Bangladesh (Source: Google Maps) and a fog collector (right picture) adopted from Ahmed et al. (2018).
Atmosphere 13 00497 g001
Figure 2. Variation of electrical conductivity (EC) and total dissolved solids (TDS) in fog samples during sampling days.
Atmosphere 13 00497 g002
Figure 3. Distribution of total organic carbon (TOC) in fog samples for different sampling days.
Atmosphere 13 00497 g003
Figure 4. Concentration of major water-soluble inorganic ions in fog samples.
Atmosphere 13 00497 g004
Figure 5. Percent distribution of water-soluble inorganic ions in fog water.
Atmosphere 13 00497 g005
Figure 6. Average concentration of trace metals in Bhola fog water.
Atmosphere 13 00497 g006
Figure 7. Variation of [Ca2+ + Na+ + NH4+ + Mg2+] with [SO42− + NO3 + Cl] in Bhola fog water.
Atmosphere 13 00497 g007
Figure 8. Enrichment factor of measured ions and trace elements in Bhola fog water.
Atmosphere 13 00497 g008
Figure 9. Marine contribution of various species found in Bhola fog water.
Atmosphere 13 00497 g009
Figure 10. Source contribution of water-soluble inorganic ions present in Bhola fog water.
Atmosphere 13 00497 g010
Figure 11. Presentation of air mass trajectories when: (a) (SO42− + NO3) and trace metals were the lowest; (b) (SO42− + NO3) was lower than the average value; (c) (SO42− + NO3) was higher than the average value; (d) (SO42− + NO3) was the highest; and, (e) trace metals were the highest.
Atmosphere 13 00497 g011aAtmosphere 13 00497 g011b
Table 1. Correlation among measured chemical species in Bhola fog water.
Na+K+Mg2+NH4+Ca2+SO42−NO3ClFeCuMnZn
Na+1
K+0.081
Mg2+0.790.481
NH4+−0.120.210.321
Ca2+0.610.650.620.681
SO42−0.090.470.500.59 *0.931
NO30.300.340.320.090.280.791
Cl0.950.030.76−0.070.380.280.431
Fe0.050.19−0.01−0.210.040.270.570.191
Cu0.48−0.120.43−0.370.04−0.040.230.770.391
Mn0.220.170.530.200.61 *0.820.620.370.020.131
Zn−0.080.030.260.600.65 *0.840.160.110.18−0.030.901
Bold: significant at p < 0.01, *: significant at p < 0.03.
Table 2. 24-h backward air mass trajectory analysis for Bhola fog samples during December 2017–January 2018.
FeaturesFigure 11aFigure 11bFigure 11cFigure 11dFigure 11e
The concentration of (SO42− + NO3) in a specific sample3.30 times lower than average 1.5 times lower than average1.55 times higher than average2.05 times higher than average-
The total concentration of trace metals in a specific sample5.80 times lower than average---2.32 times higher than average
Pathway of air of 2500 MAGLFrom the Bay of Bengal to BholaFrom the northwestern direction (probably IGP region)From West Bengal region of India passing over RajshahiFrom West Bengal to BholaFrom West Bengal to Bhola
Pathway of air of 1500 MAGLFrom the Bay of Bengal to BholaFrom the Bay of Bengal to BholaFrom Dhaka From Rajshahi to BholaPassing directly
over Dhaka
Pathway of air of 500 MAGLFrom Dhaka to BholaFrom north- eastern directionFrom DhakaFrom Dhaka to BholaPassing directly over Dhaka
pHHighest (7.25)Lower than average (6.9)Lowest (6.85)Higher than average (7.10) Higher than average (7.09)
ECLowest (275 µScm−1)Lower than average
(371 µScm−1)
Highest (489 µScm−1)Higher than average (388 µScm−1)Higher than average (380 µScm−1)
RemarksCleaner air from the seashore with less SOx, NOx, and trace metal speciesAir flowing from IGP region might have carried pollutantsAir from IGP region probably carried a high concentration of precursor gases, which is evident from the low pHAlkaline constituents dominated in fog composition, indicating neutralization of acidic components Alkaline constituents dominated in fog composition, indicating neutralization of acidic components
Publisher’s Note: MDPI stays neutral with regard to jurisdictional claims in published maps and institutional affiliations.

