Article

Meteorological Analysis of the 2021 Extreme Wildfires in Greece: Lessons Learned and Implications for Early Warning of the Potential for Pyroconvection

by
Theodore M. Giannaros
1,*,
Georgios Papavasileiou
1,
Konstantinos Lagouvardos
1,
Vassiliki Kotroni
1,
Stavros Dafis
1,2,
Athanasios Karagiannidis
1 and
Eleni Dragozi
1
1
National Observatory of Athens, Institute for Environmental Research and Sustainable Development, Lofos Koufou, 15236 Penteli, Greece
2
Data4Risk, 75015 Paris, France
*
Author to whom correspondence should be addressed.
Atmosphere 2022, 13(3), 475; https://doi.org/10.3390/atmos13030475
Submission received: 22 February 2022 / Revised: 8 March 2022 / Accepted: 12 March 2022 / Published: 14 March 2022

Abstract

:
The 2021 fire season in Greece was the worst of the past 13 years, resulting in more than 130,000 ha of burnt area, with about 70% consumed by five wildfires that ignited and spread in early August. Common to these wildfires was the occurrence of violent pyroconvection. This work presents a meteorological analysis of this outbreak of extreme pyroconvective wildfires. Our analysis shows that dry and warm antecedent weather preconditioned fuels in the fire-affected areas, creating a fire environment that alone could effectively support intense wildfire activity. Analysis of surface conditions revealed that the ignition and the most active spread of all wildfires coincided with the most adverse fire weather since the beginning of the fire season. Further, the atmospheric environment was conducive to violent pyroconvection, as atmospheric instability gradually increased amid the breakdown of an upper-air ridge ahead of an approaching long-wave trough. In summary, we highlight that the severity and extent of the 2021 Greek wildfires were not surprising considering the fire weather potential for the period when they ignited. Continuous monitoring of the large- and local-scale conditions that promote extreme fire behavior is imperative for improving Greece’s capacity for managing extreme wildfires.

1. Introduction

The wildfires that burnt across Greece in early August 2021 were unprecedented in extent, intensity, and impacts. They broke out in the regions of Attica, Euboea, Elis, Messenia, and Laconia (Figure 1) on 3 and 4 August 2021 and kept burning for several days. According to the European Forest Fire Information System (EFFIS; https://effis.jrc.ec.europa.eu, accessed on 20 February 2022), the five wildfires collectively burnt nearly 94,000 ha, a surface that accounts for more than 70% of the 2021 total burnt area and equals almost three times the 2008–2021 annual average burnt area. Observational evidence indicates that all wildfires showed extreme fire behavior, characterized by erratic fire spread, massive spotting, and the occurrence of pyroconvection (Figure 1).
Rare and large wildfires have historically characterized fire regimes around the globe (e.g., the 1910s in Northern Rockies, USA; 1939 Black Friday bushfires in Victoria, Australia; the 1949 wildfire in Landes, France). However, recent catastrophic events like the 2021 Greek wildfires (e.g., 2017 in Chile and Portugal; 2018 in California, USA; 2020 in Australia; 2021 in British Columbia, Canada) suggest the emergence of novel fire regimes, characterized by the occurrence of extreme wildfires [1]. Researchers argue that recent extreme events are becoming the “new normal” since they are associated with increasing frequency, size, intensity, and severity [2].
Pyroconvection is perhaps the most common behavior observed in extreme wildfires. It is as much an atmospheric phenomenon as a wildfire process, resulting from the vertical development of a wildfire’s convection column into the middle and upper troposphere [3]. Typically, pyroconvection manifests as flammagenitus clouds that form above smoke plumes [4]. These clouds, which are more commonly known as pyrocumulus (pyroCus) and pyrocumulonimbus (pyroCbs), develop by convection forced by the wildfire itself; the hot gases and ash particles (smoke) released by the fire rise in the air that ends up condensing water vapor and forming clouds [5]. PyroCu and pyroCb events significantly influence fire behavior. They are associated with strong convective updrafts and downdrafts that result in unpredictable changes in surface winds [6], pyrogenic lightning [7], and rapid fire growth due to increased ember generation and long-range spotting [8]. Besides their impact on fire behavior, pyroCus/Cbs can significantly affect the vertical transport of smoke, atmospheric chemistry, and cloud microphysics. For instance, intense pyroCbs can inject large quantities of aerosols into the upper troposphere and lower stratosphere [9,10,11]. Further, the extreme aerosol loading of pyroCbs results in significantly higher concentrations of ice particles compared to clouds forming in smoke-free air, which, in turn, significantly modify the radiative properties of the clouds [12,13,14].
While several environmental factors may affect the occurrence of pyroconvection, including surface fire weather and the type, structure, and condition of fuels [1], the concept of atmospheric stability appears to be of most importance [5,6,15]. According to the conceptual model of Peterson et al. [16], three key processes, all related to the vertical structure of the atmosphere, govern the development of pyroconvective clouds. First, the near-surface atmospheric layer needs to be hot and dry to maintain intense burning and, hence, the buoyancy of the plume. Second, the lower layer of the troposphere should be relatively deep, dry, and unstable with minimal wind shear. Last, the atmosphere needs to be significantly moist at higher altitudes, where the condensation takes place, to maintain the buoyancy of the plume. The upper-level advection of moist air above a dry, unstable mixed layer appears to be the key factor for the onset of pyroCu/Cb formation, as also noted by Lareau and Clements [5], Luderer et al. [17,18], and Peterson et al. [19].
In a broader context, extreme wildfires, including pyroconvective events, develop via processes occurring across multiple spatial and temporal scales, whereby consecutive thresholds are exceeded [20,21]. Following Bradstock [22] and Boer et al. [23], four principal environmental constraints, or “switches”, control the occurrence of major wildfires. These switches include (a) the accumulation of fuels to a level that supports fire propagation, (b) the dry-out of fuels that allows for ignition and maintaining combustion, (c) a source of ignition (e.g., lightning, arson), and (d) fire weather conditions that facilitate fire spread.
Therefore, the factors that contributed to the recent extreme wildfires in Greece shall be sought in the combination of (1) antecedent meteorological conditions that allowed for the accumulation and extreme dry-out of fuels and (2) concurrent adverse fire weather that enabled ignited wildfires to couple with the atmosphere and evolve into extreme pyroconvective events. These topics serve as the motivation of the current study, which presents an analysis of the environmental conditions that led to the pyroconvection outbreak of early August 2021 in Greece. Using both observational and large-scale meteorological analysis data, we examine the environmental conditions before and during the events. We demonstrate that the recent extreme wildfires resulted from a sequence of events that essentially increased the potential for the occurrence of extreme pyroconvection. In that regard, this study highlights the urgent need for better monitoring and early warning of the potential for extreme wildfires. This is a particularly important issue for countries that, like Greece, lack an open science-based early warning system of wildfire danger.

2. Data and Methods

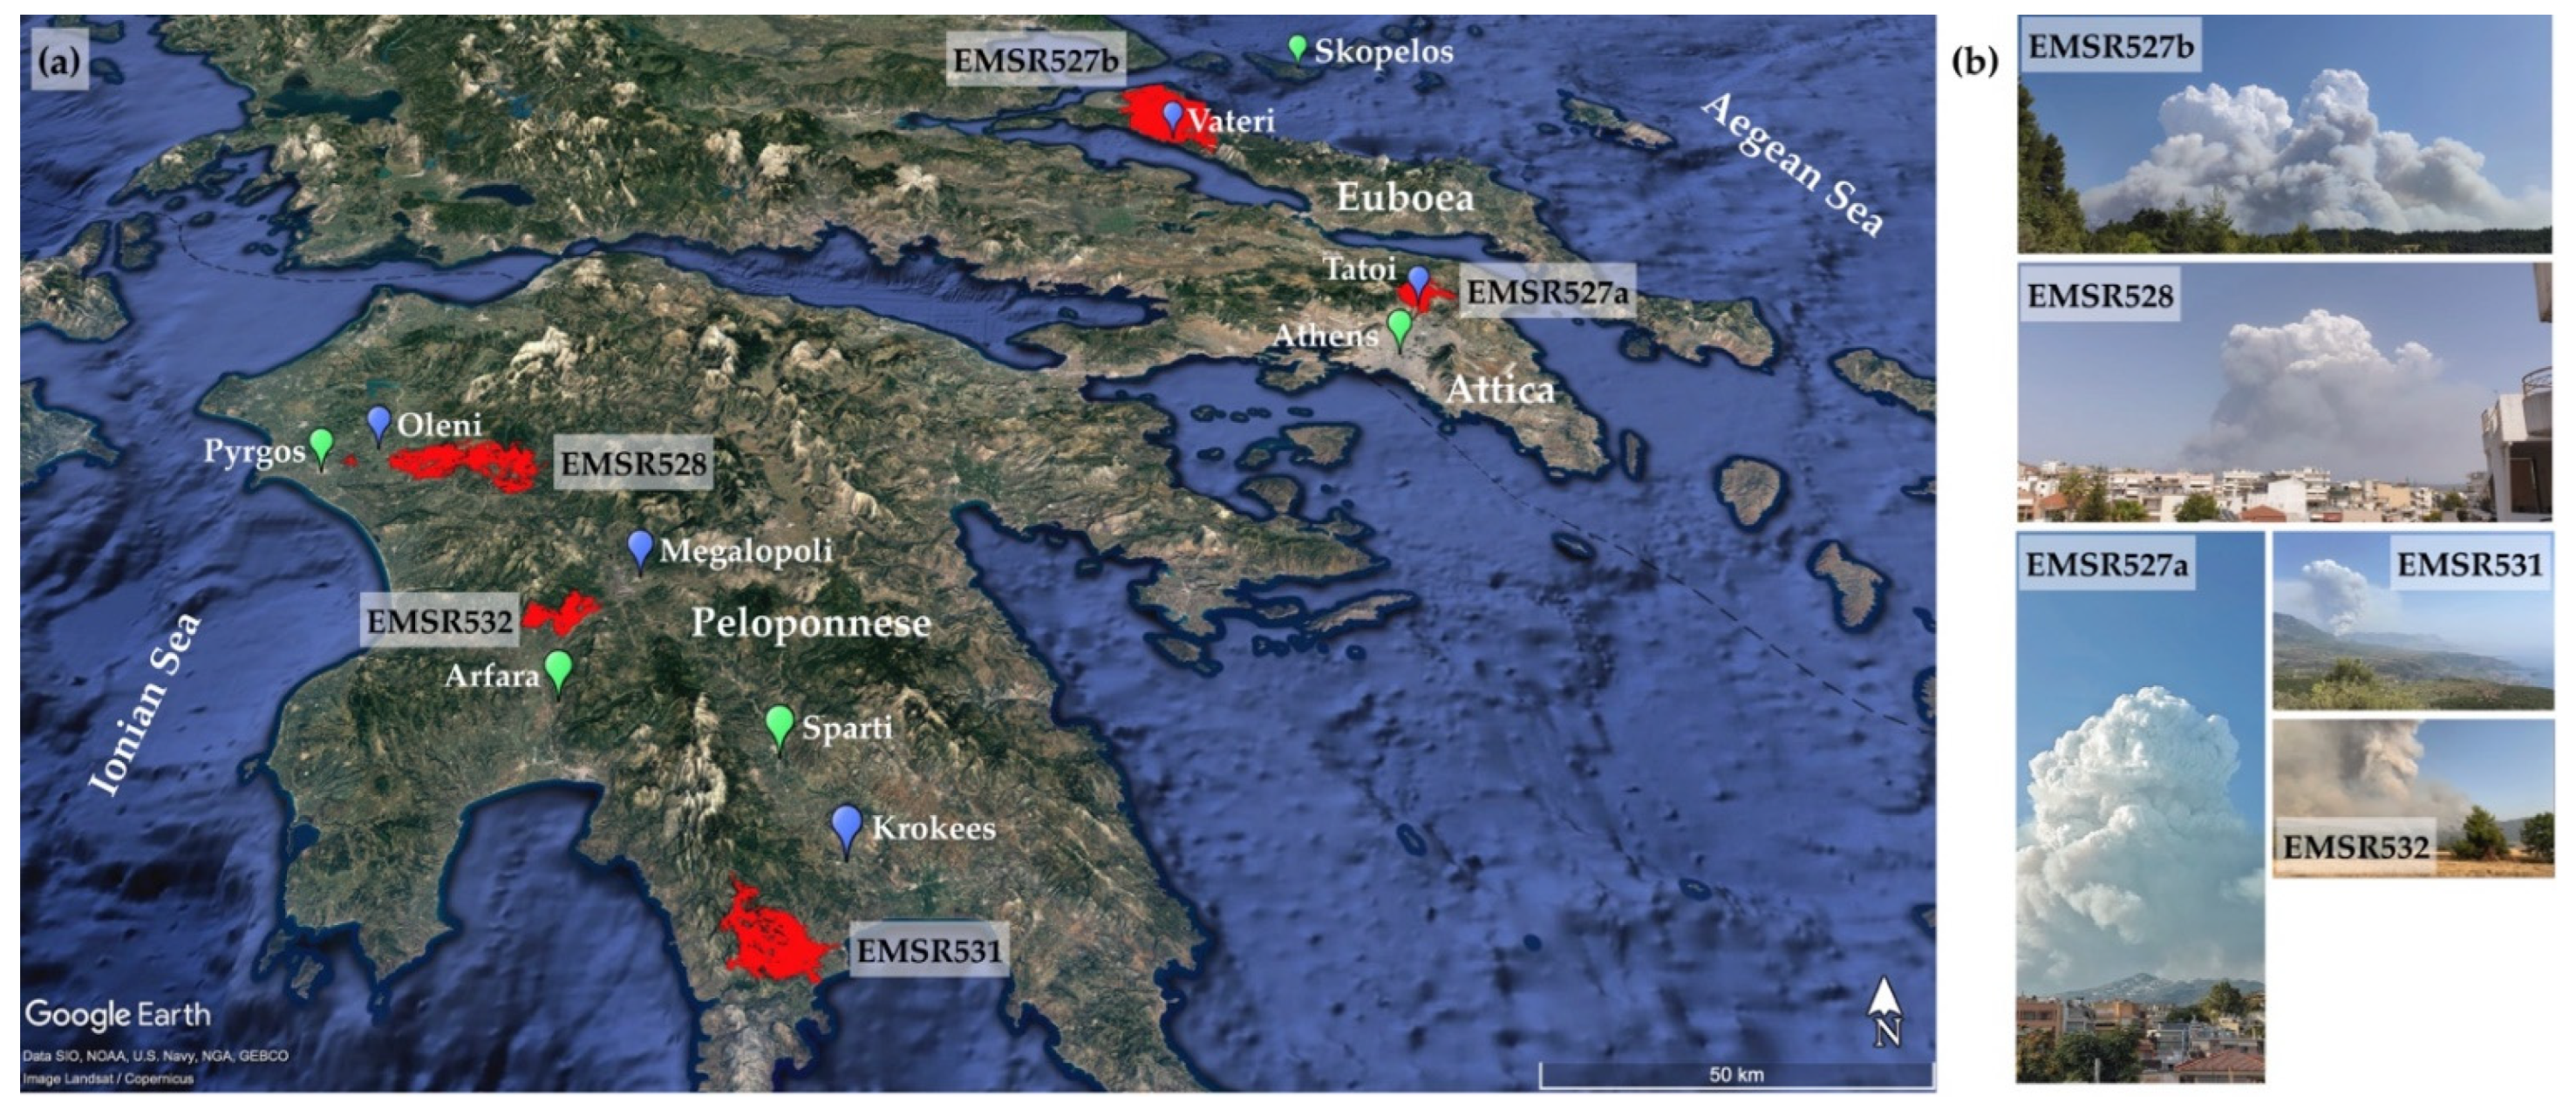
2.1. Study Area and Examined Wildfires

The present study focuses on five pyroconvective wildfires that affected southern Greece (Figure 1) between 3 and 10 August 2021. Table 1 summarizes basic information concerning the examined events. The areas affected by the wildfires have a hot and dry climate and elevation that ranges from 200 to 800 m above sea level. Based on the fuel map produced by Giannaros et al. [24], the dominant vegetation types damaged by the wildfires include coniferous and broadleaf forests, sclerophyllous shrublands, and agroforestry land. The EMSR527b event was by far the most significant, having burnt more than 50,000 ha, followed by EMSR528 and EMSR531, which burned more than 10,000 ha. All wildfires, except EMSR532, broke out in the noon and early afternoon hours. Examination of satellite imagery data indicates that all events developed pyroconvection, with the first occurrence of pyroCus formation recorded during noon hours (Table 1). According to observational evidence and satellite imagery data, the date with the most active and widespread pyroconvection was 5 August 2021.
Table 1. Summary of the pyroconvective wildfires examined in the present study. Wildfire IDs are derived from the Copernicus Emergency Management Service [25]. Date and time of ignition provided by the Hellenic Fire Corps (HFC). Burnt area data derived from EFFIS. Pyroconvection date and time refer to the first observation of pyroCu formation as derived from satellite imagery data.
IDRegionIgnition Date
& Time (UTC)
Ignition Location
(°N, °E)
Burnt Area
(ha)
Pyroconvection Date & Time (UTC)
EMSR527aAttica3 August 2021
10:22
38.1317,
23.8044
84543 August 2021
12:10
EMSR527bEuboea3 August 2021
14:09
38.7940,
23.3242
51,2453 August 2021
15:05
EMSR528Elis4 August 2021
10:03
37.7016,
21.5747
18,4004 August 2021
13:00
EMSR531Laconia3 August 2021
10:30
36.8472,
22.3885
11,2095 August 2021
12:30
EMSR532Messenia4 August 2021
16:51
37.3251,
21.9410
46885 August 2021
11:35

2.2. Observational Data

To assess environmental conditions before and during the examined wildfires, we retrieved in situ meteorological observations from the network of automatic weather stations (AWSs) operated by the National Observatory of Athens (NOA) in Greece since 2007 [26]. The AWSs employed in this analysis were selected based on their proximity to the fire-affected regions (Figure 1), representativeness, and availability of data. The selected AWSs are divided into two groups (Table 2). The first group comprises the AWSs with at least 10 years of data availability that are closest to the fire-affected regions. These were exploited for evaluating antecedent conditions. The second group comprises the AWSs that are nearest to the ignition locations and show the most complete data record. These were used for investigating conditions during the wildfires.
Hourly measurements of air temperature and relative humidity, wind speed and direction, and accumulated precipitation were extracted from all available AWSs (Table 2). To evaluate antecedent conditions, we first calculated the December–July long-term averages (reference period 2010–2019) of monthly accumulated precipitation and monthly mean of daily maximum temperature at the locations of the AWSs of the first group. Monthly accumulated precipitation and monthly means of daily maximum temperature for the year 2020/2021 were then compared against the long-term averages. The data retrieved from the AWSs of the second group were exploited for computing the components of the Canadian Forest Fire Weather Index System (CFFWIS) [27] that are relevant to fire behavior and spread. These include the Initial Spread Index (ISI) and the Fire Weather Index (FWI), which are numeric ratings of the expected rate of spread and fire intensity, respectively. The calculation of both indices was carried out using weather data valid at 12:00 UTC. Further, air temperature and relative humidity observations were exploited for estimating the fuel moisture content of dead fine fuels (DFMC), a reliable measure of landscape flammability [23]. For this, we followed the approach described in detail in Dragozi et al. [28].
Table 2. Description of the AWSs used in the present study.
Wildfire IDAWS NameAWS Location (°N, °E)AWS Elevation (m)Data Record
AWS Group 1
EMSR527aAthens37.97841, 23.71545 5023 July 2008-today
EMSR527bSkopelos39.12172, 23.726516026 November 2007-today
EMSR528Pyrgos37.66944, 21.43806224 May 2007-today
EMSR531Sparti37.05358, 22.4376320418 January 2009-today
EMSR532Megalopoli37.40182, 22.1415943213 May 2009-today
AWS Group 2
EMSR527aTatoi38.12116, 23.794942825 November 2014-today
EMSR527bVateri38.77408, 23.3133413012 October 2016-today
EMSR528Oleni37.72500, 21.537006116 January 2008-today
EMSR531Krokees36.88361, 22.5605624127 January 2020-today
EMSR532Arfara37.15589, 22.045579625 October 2012-today
In addition to surface weather observations, satellite remote sensing data were employed for investigating fire evolution. Specifically, we retrieved estimates of fire radiative power (FRP) from the Land Surface Analysis Satellite Applications Facility (LSA SAF) [29]. The ~5 × 5 km spatial resolution and 15 min temporal resolution FRP data are produced by processing satellite imagery provided by the Spinning Enhanced Visible and Infrared Imager (SEVIRI) onboard the Meteosat Second Generation (MSG) series of geostationary meteorological satellites [30]. FRP is commonly used as a surrogate for monitoring fire intensity since it provides information relevant to the radiant heat output of detected fires e.g., refs. [19,31,32,33]. To derive a consistent and representative time series of FRP, the original data were aggregated hourly for each wildfire and the resulting total instantaneous FRP was divided by the number of available detections per hour.

2.3. Model Data

The 0.25° × 0.25° spatial resolution and hourly temporal resolution, surface and upper-air ERA5 reanalyses data of the European Centre for Medium-range Weather Forecasts (ECMWF) were used for examining synoptic weather patterns during the 2021 extreme wildfires in Greece. The specific variables analyzed include 500 hPa geopotential heights, relative humidity, and wind.

3. Results

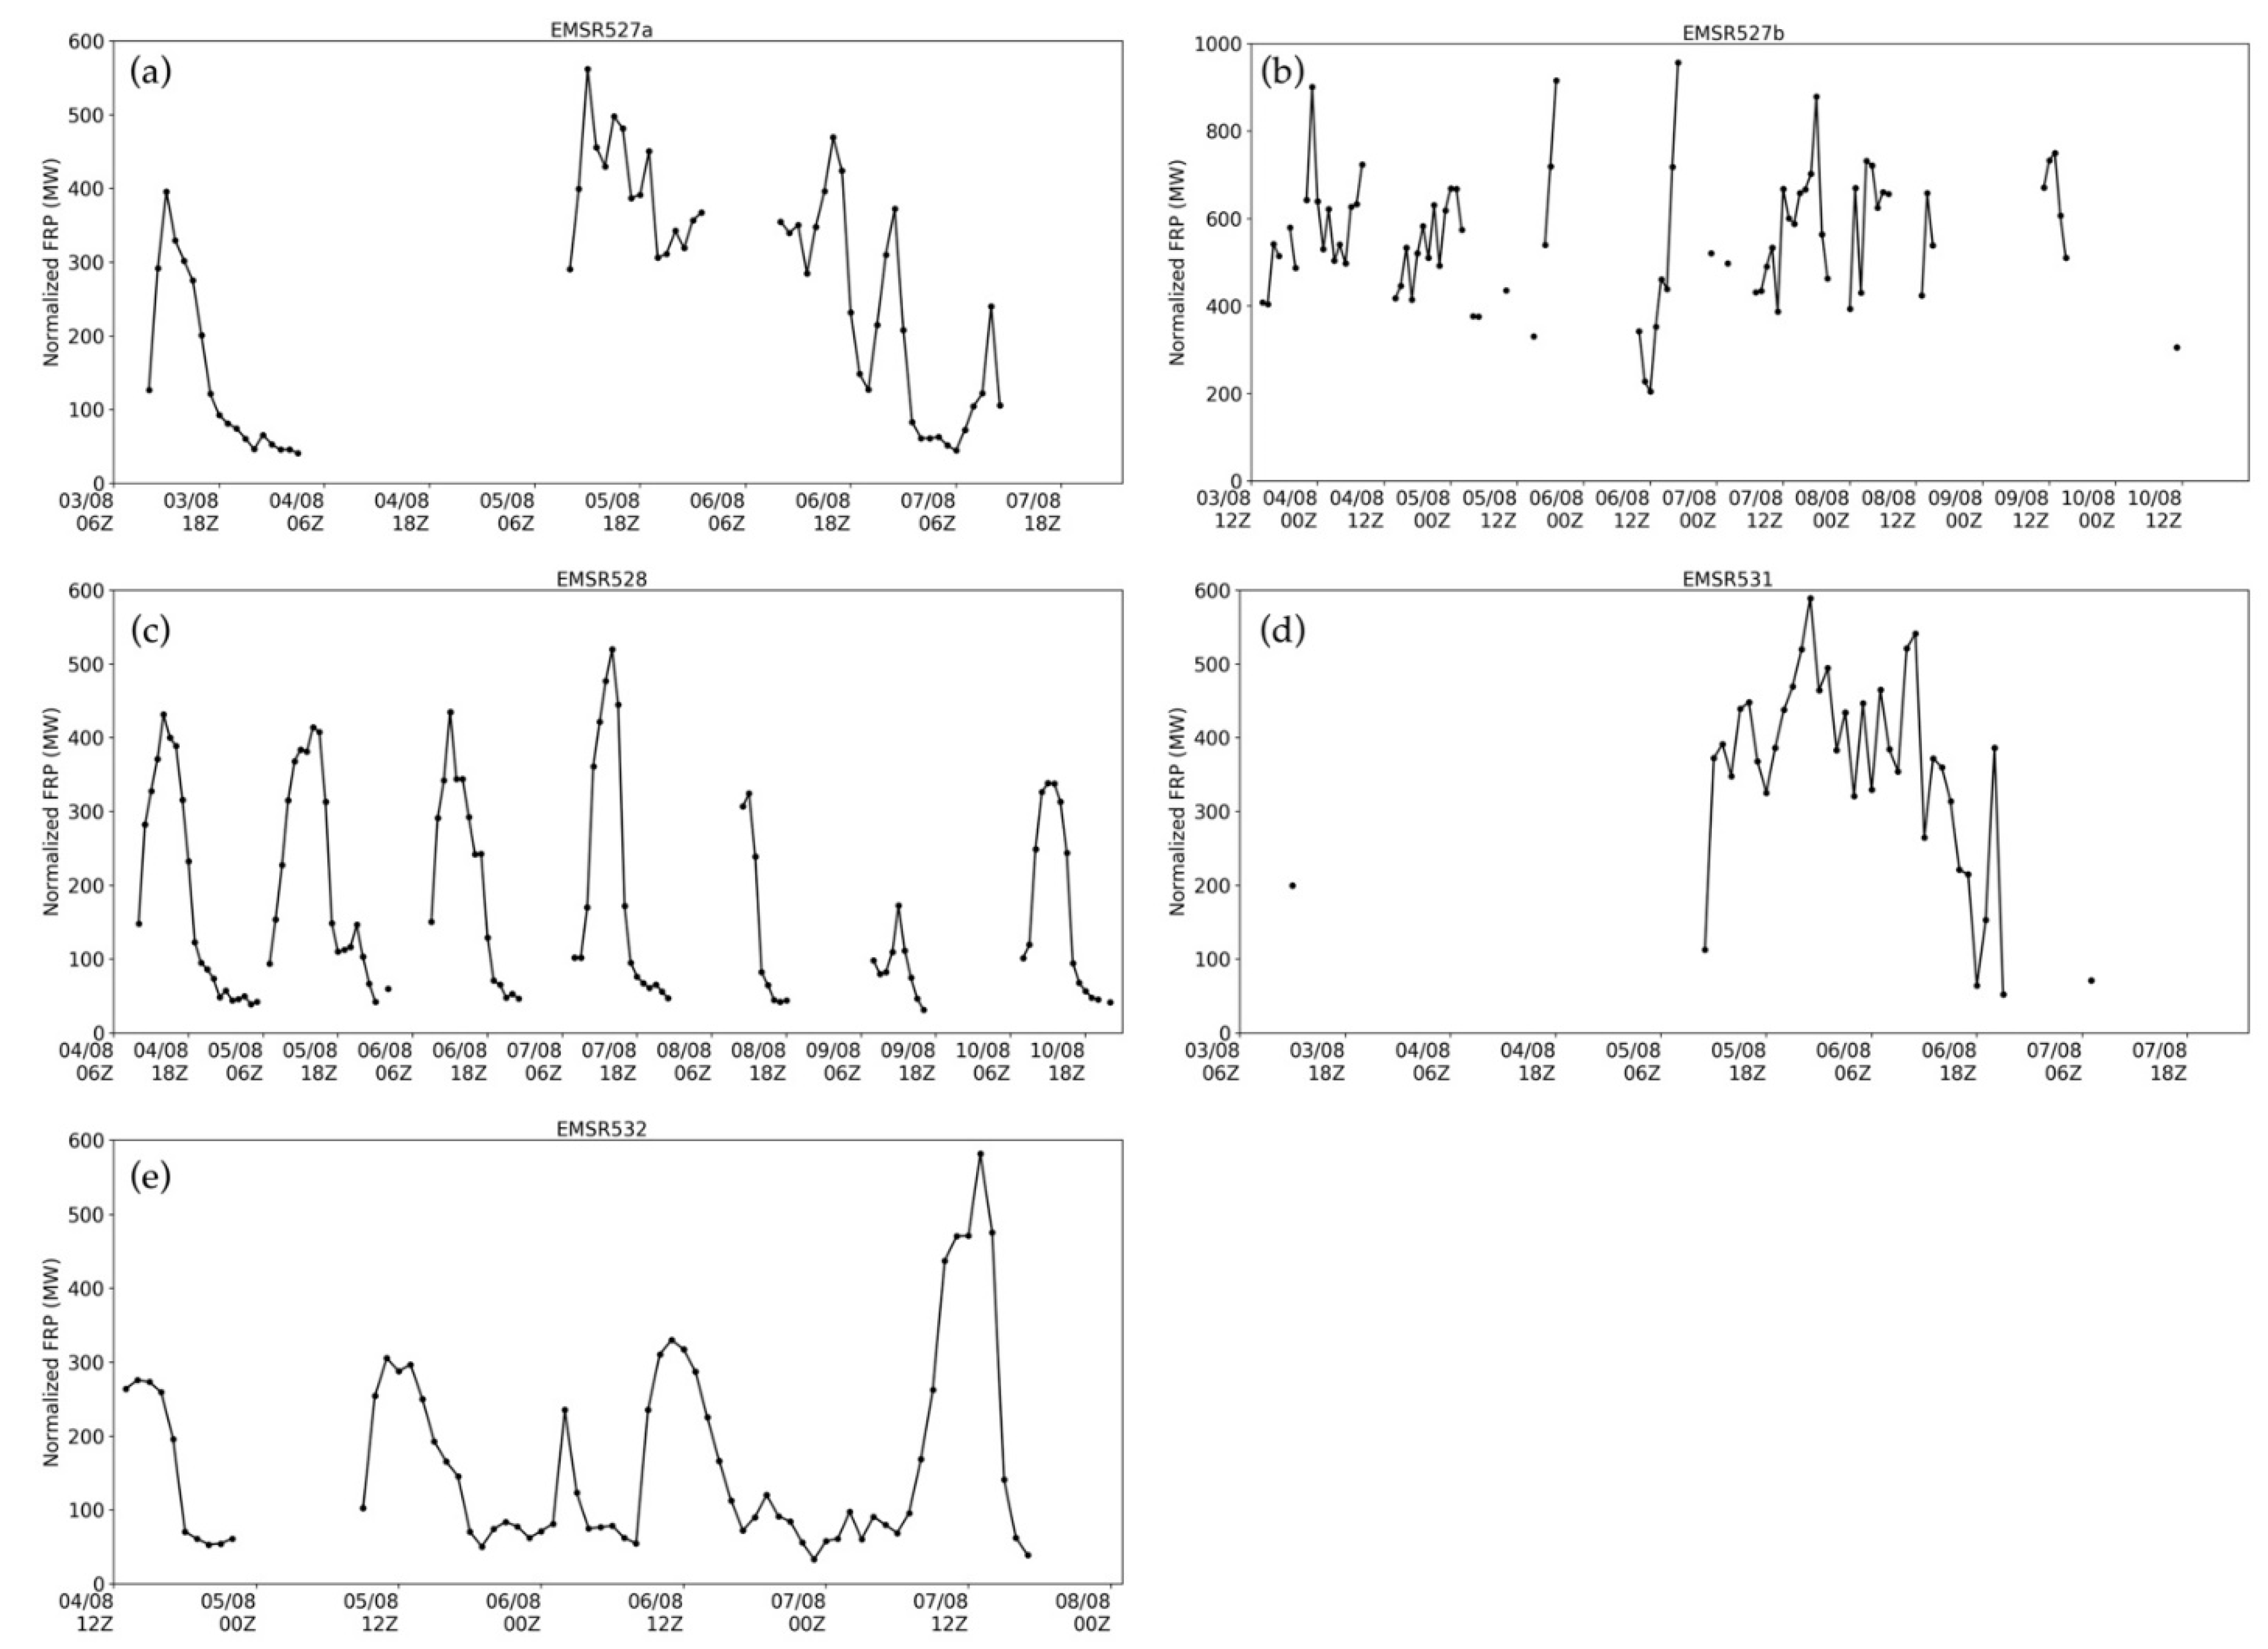
3.1. Evolution of Events from Satellite Observations

The hourly normalized FRP time series, shown in Figure 2, indicate a characteristic, weather-driven diurnal cycle of FRP that fluctuates between maxima in the late afternoon and evening, and minima in the late morning. It is worth noting that cloud cover can severely compromise the satellite-derived FRP data. For instance, intermittent convection over the region of the EMSR531 event on 3 and 4 August resulted in a large data gap in the respective FRP time series (Figure 2d). Large data gaps are also evident in the FRP time series for the EMSR527b event, attributed to the presence of thick smoke and high clouds (cirrus, altostratus), particularly between 5 and 6 August (Figure 2b). For the EMSR527a event, the absence of FRP data on 4 August is due to the wildfire being inactive (Figure 2a); the wildfire was partially contained early in the morning of 4 August and resurged in the noon of 5 August. In contrast, clear-sky conditions prevailed during the EMSR528 and EMSR532 events, resulting in only minor data gaps in the corresponding FRP time series (Figure 2c,d, respectively).
Previous studies have associated FRP variations with the intensity of burning, suggesting that the largest FRP values should point to periods of most intense burning e.g., refs. [19,34]. In turn, this implies that FRP peaks could be linked to the development of pyroconvection since for the latter to be triggered, intense surface heating is required. Examination of Figure 2 along with satellite imagery confirms this assumption, as pyroclouds were found to cooccur with the maxima of FRP. For instance, the three maxima of FRP seen in the time series for the EMSR527b wildfire, on 3, 5, and 6 August (Figure 2b), coincide with the occurrence of the most intense pyroconvection. In addition, the absolute maximum of FRP for the EMSR527a wildfire, on 5 August (Figure 2a), was found to coincide with the formation of a large pyroCb (Figure 1b).

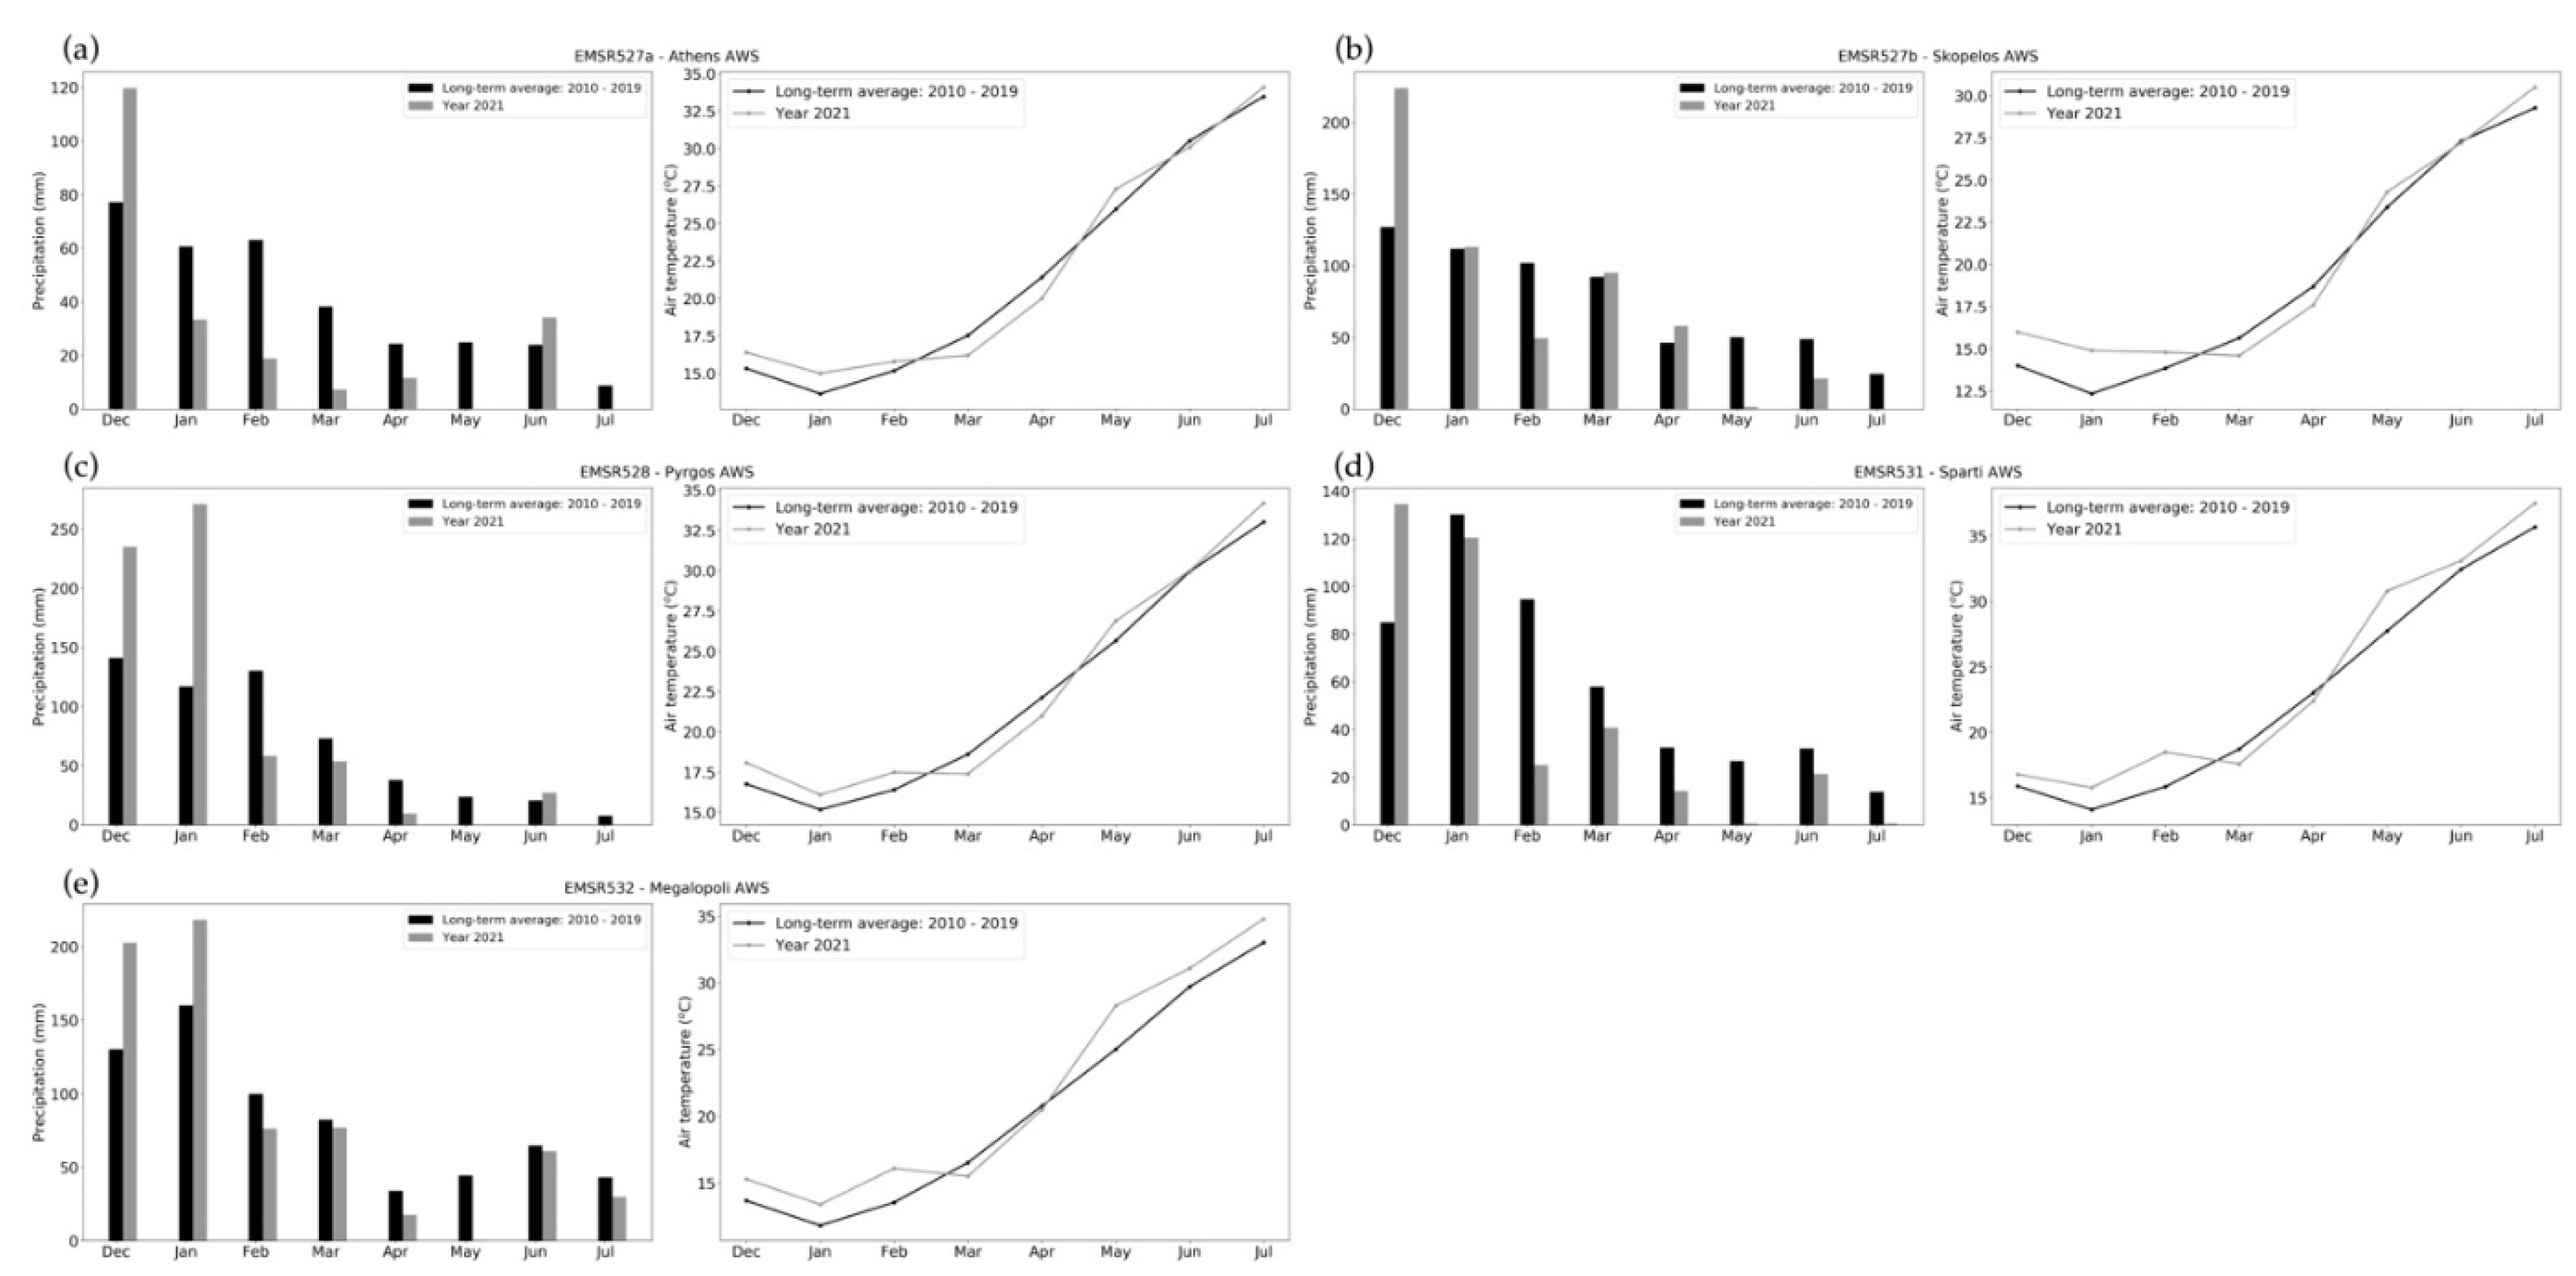
3.2. Antecedent Conditions and Fuels

The temperate forests of southern Greece are mainly composed of species adapted to hot and dry environments, such as Pinus halepensis, Pinus brutia, and most of the evergreen broadleaves [35]. In general, plant biomass is abundant enough to sustain fire spread, mainly due to the unbalanced policy adopted by the Greek state, which heavily promotes fire suppression over sustainable forest management [36]. Therefore, the main factor limiting the extent and severity of wildfires is the moisture content of available fuels.
Figure 3 shows the time series of the December–July monthly accumulated precipitation and monthly mean of daily maximum air temperature compared against the corresponding long-term means (Table 2). Except for December and January, which proved to be wetter than average in most AWSs, the recorded late winter (February) and springtime precipitation were in general below normal. Precipitation deficits were found to be maximum in February, ranging from −72.1 mm (EMSR528; Figure 3c) to −23.4 mm (EMSR532; Figure 3d). Focusing on the fire season months (May–July), it is worth noticing that May and July were marked by the absence of any significant precipitation in almost all fire-affected regions, while June was locally wetter than average due to convective activity that took place during the first half of the month. In terms of temperatures, the fire-affected regions were characterized by warmer than average conditions throughout the December–July period, except for March and April, which showed negative temperature departures. Altogether, the warm and dry conditions that prevailed during the months preceding August 2021 should have contributed to preconditioning fuels by promoting drying, thereby supporting wildfire activity.
The influence of antecedent meteorological conditions (Figure 3) on the state of fuels is evident in Figure 4. The lack of precipitation and the warmer than average temperatures, particularly in spring, enabled the efficient drying of fine fuels in all fire-affected regions. Examination of the DFMC times series (Figure 4) reveals that fine fuels were already considerably dry (DFMC ~10%) since the beginning of the fire season (1 May). In particular, the nearly absent precipitation and the significantly above-average temperatures in May (Figure 3) resulted in the abrupt decrease of DFMC in all fire-affected regions, from about 15–20% in April to 8–10% thereafter. The little convective precipitation that fell during the first half of June moistened fine fuels and allowed DFMC to slightly recover by the mid of the month. Henceforth, the build-up of excess heat and the occurrence of two prolonged (>10 days) heatwaves (Figure 4) enhanced the efficiency of the drying of fine fuels, eventually leading to extremely low DFMC values of about 6–7% since the mid of July and until the time of ignitions. In sum, landscape conditions in the fire-affected regions were critically flammable and hence, highly supportive of severe wildfires.

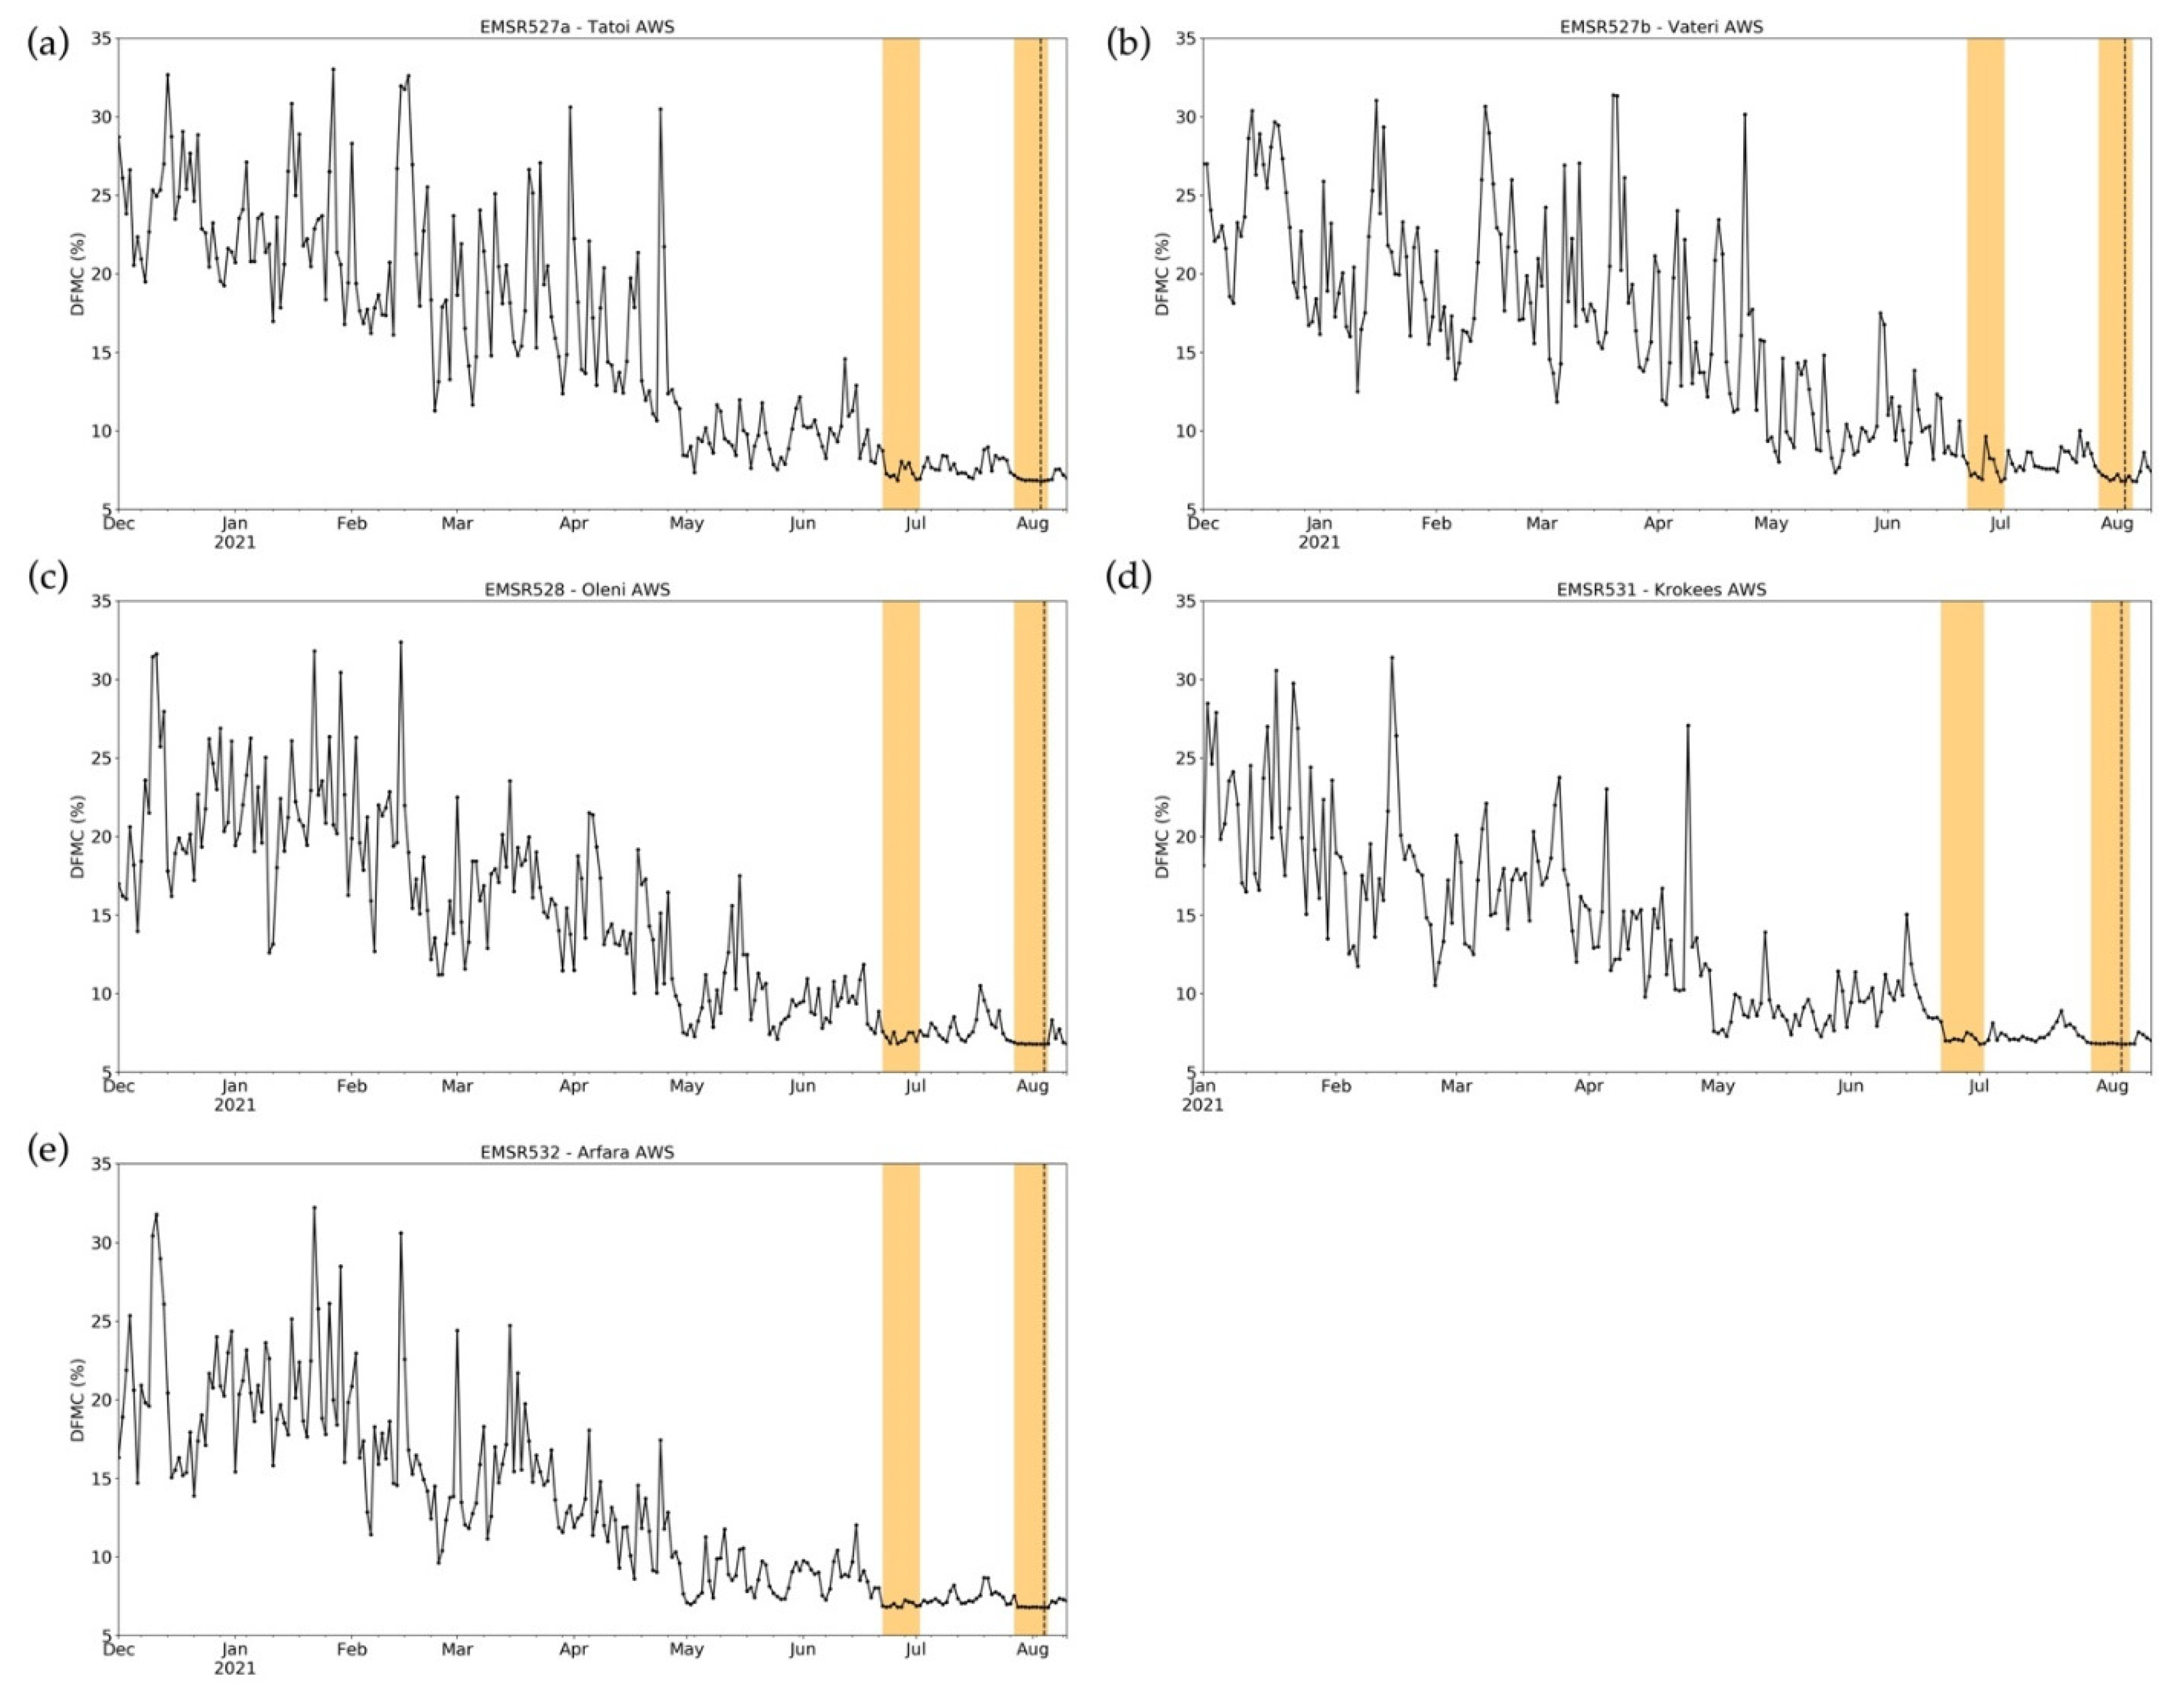
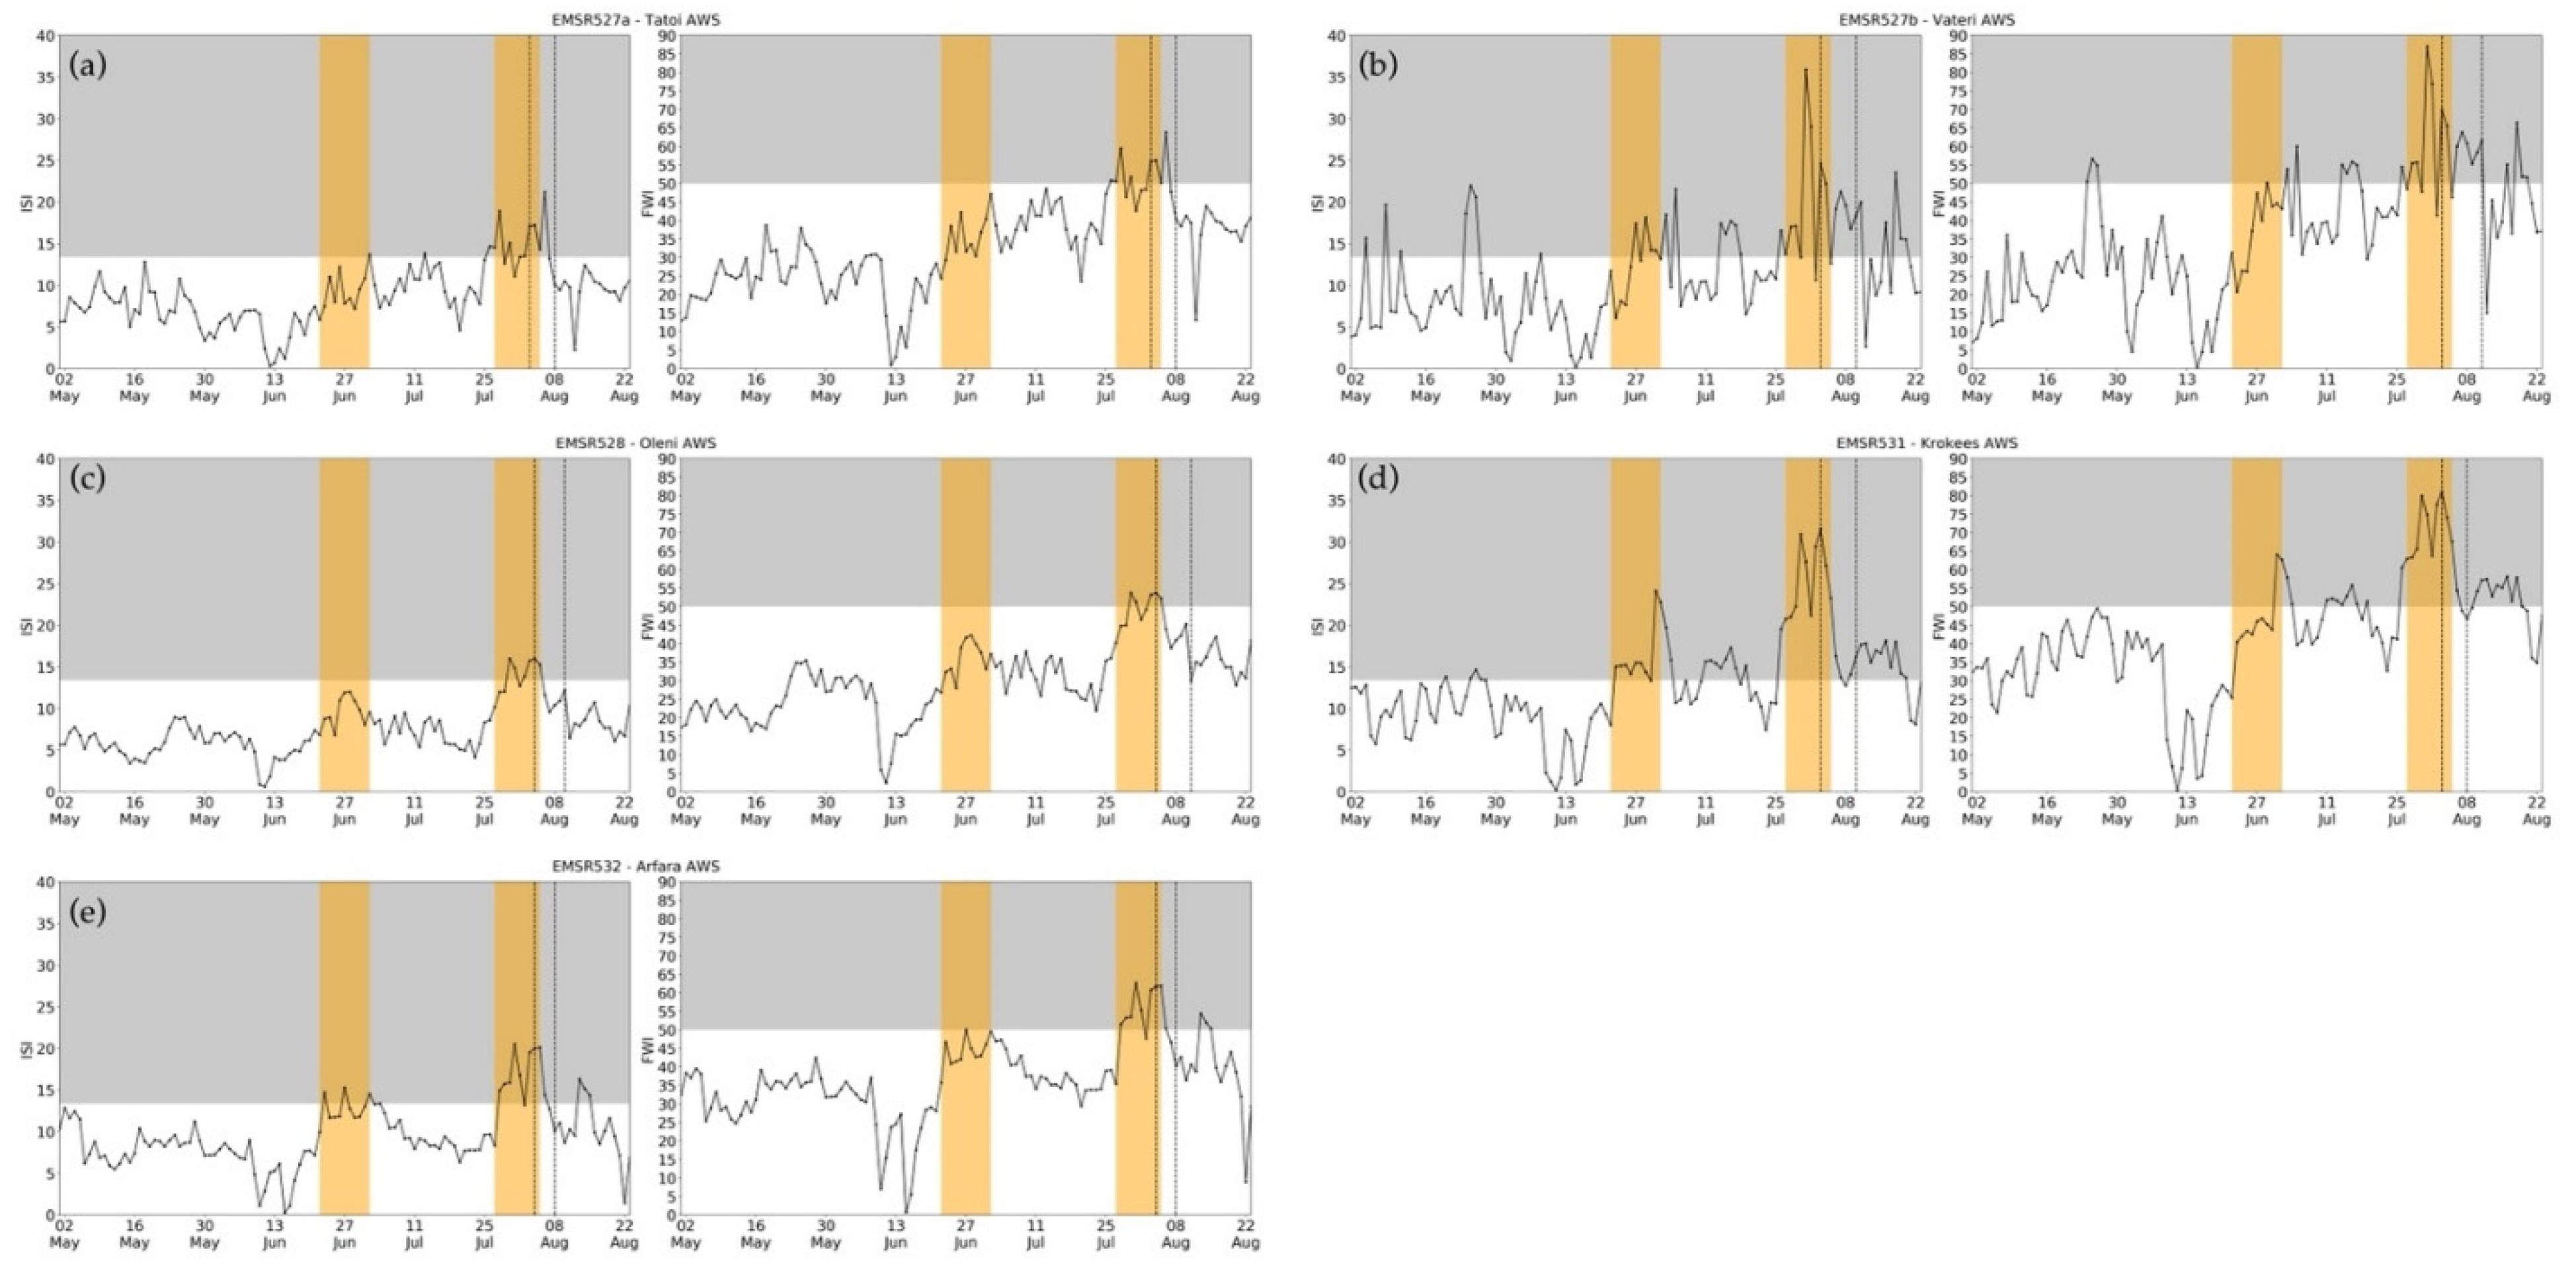
3.3. Surface Fire Weather Evolution

Not surprisingly, the early August 2021 wildfire ignitions coincided with the most adverse fire weather conditions since the beginning of the fire season (1 May). As shown in Figure 5, ISI and FWI peaked at values corresponding to “very high” (>13.4) and “extreme” (>50) fire danger, respectively, at the time of ignitions. In other words, meteorological conditions were extremely conducive to the rapid spread of intense wildfires. It is of interest to note that fire danger was escalating since mid-June in all fire-affected regions. Examination of surface weather conditions (Supplementary Materials; Figures S1–S5; reveals that the main driver of the observed increase in ISI and FWI values must have been the build-up of excess heat since mid-June. The latter has been marked by two prolonged heat waves that resulted in temperatures reaching up to 35–40 °C by the end of June, peaking to 40–45 °C by the end of July (Supplementary Materials; Figures S1–S5, panel a). Further, excess heat was accompanied by extremely dry atmospheric conditions. This was most pronounced during the late July heat wave that contributed to suppressing relative humidity levels to below 20% in all fire-affected regions (Supplementary Materials; Figures S1–S5, panel b).

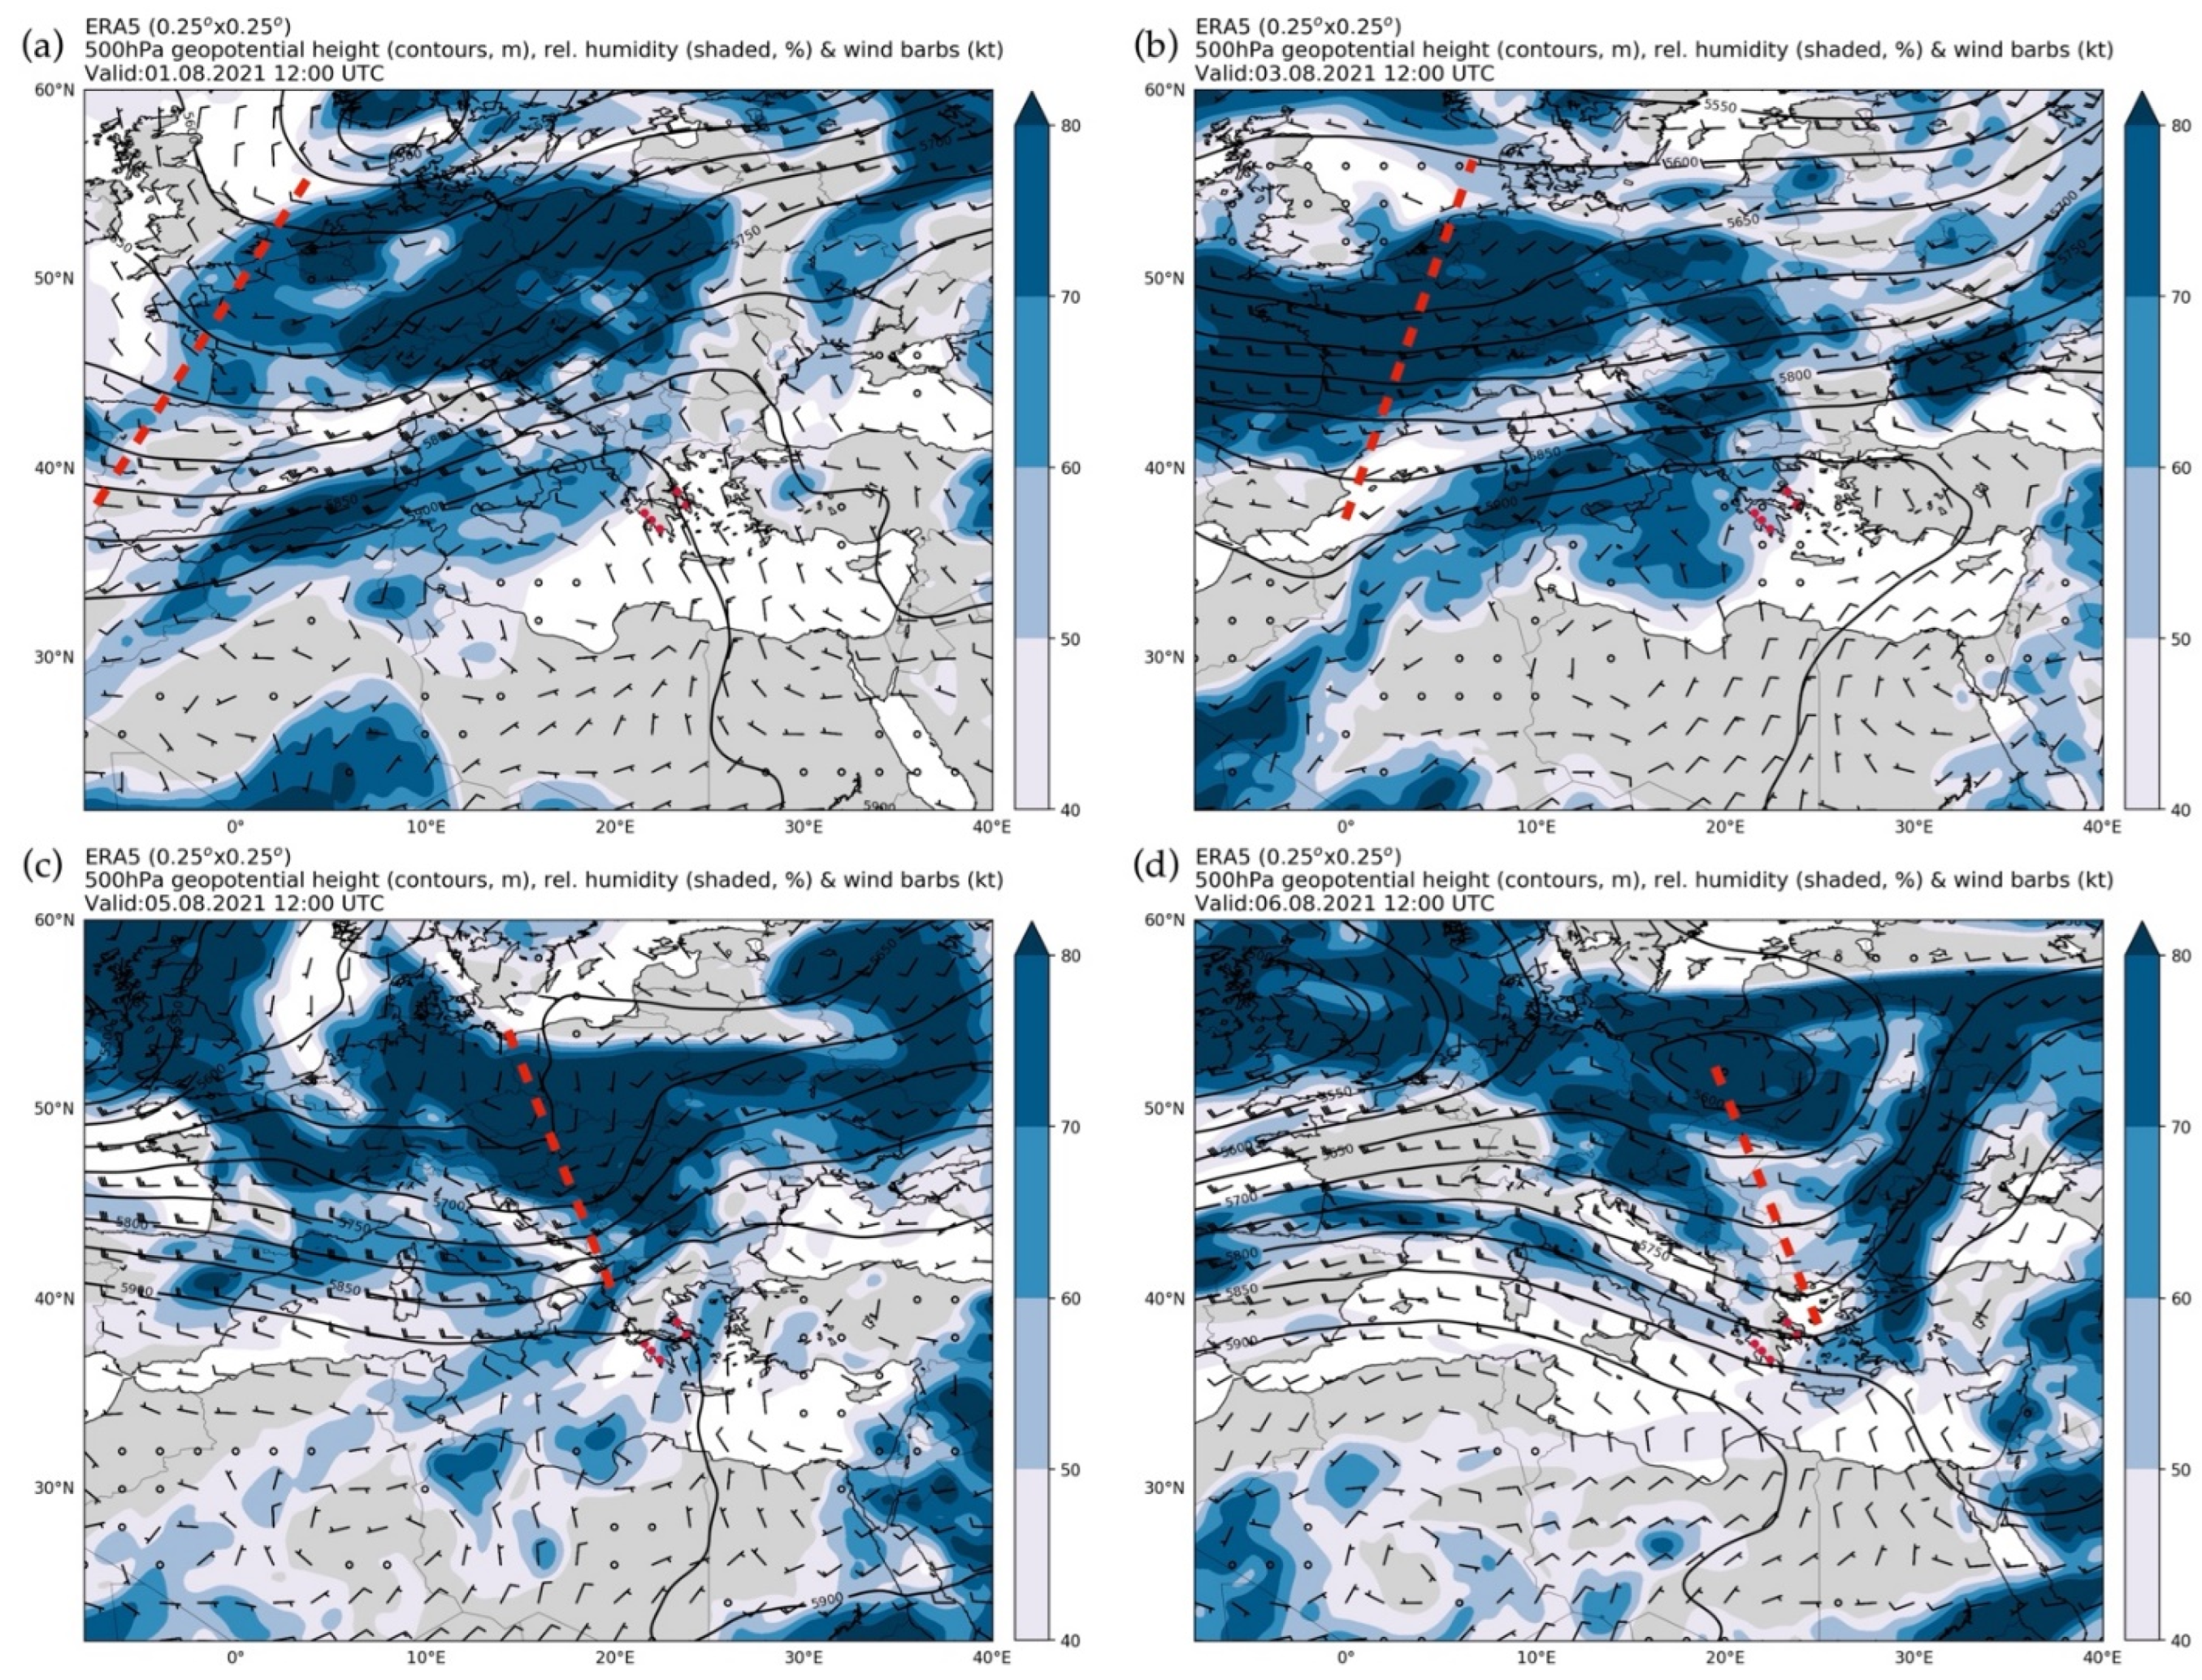
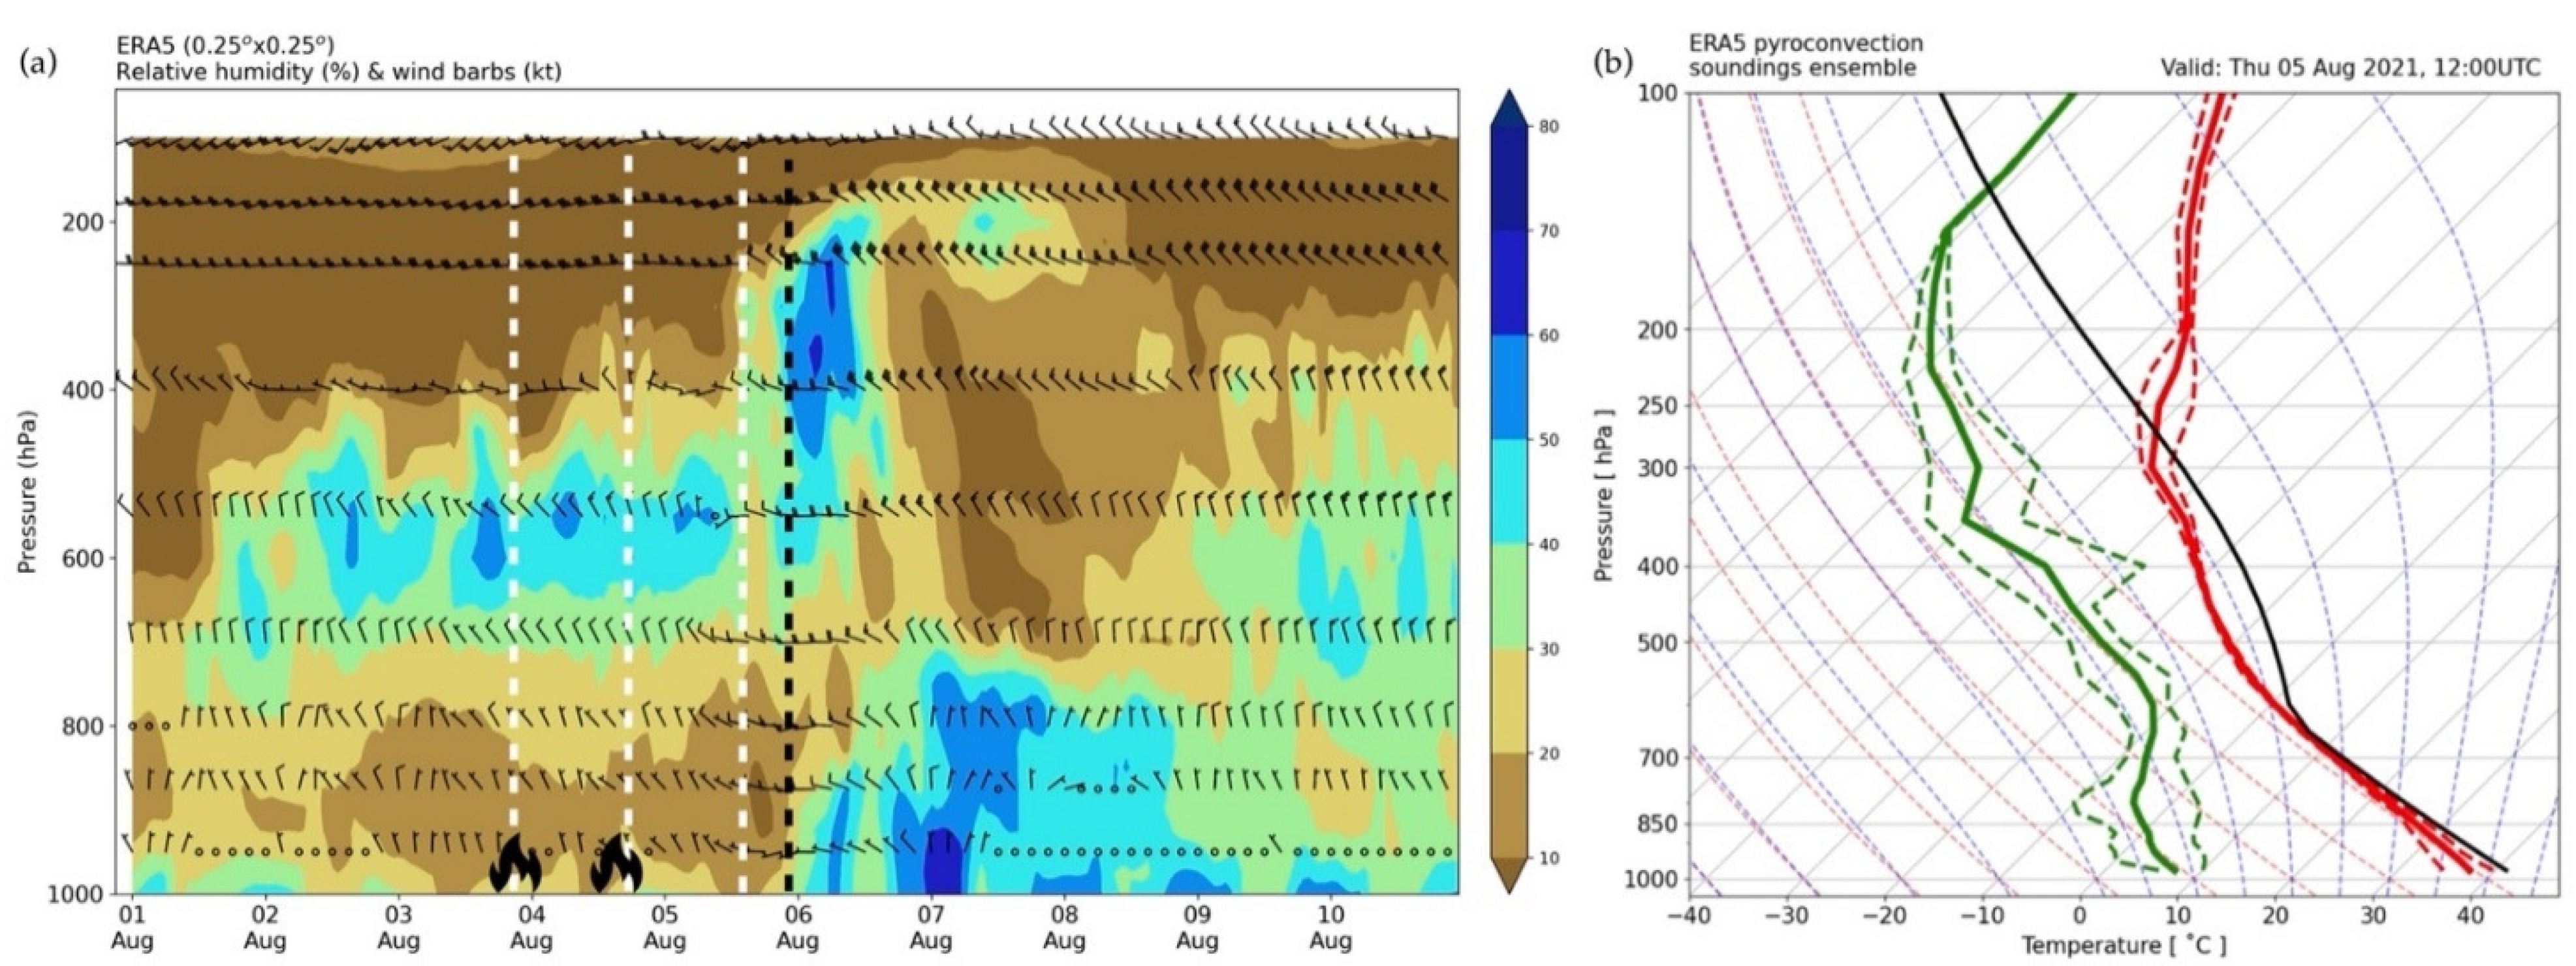
3.4. Synoptic Conditions during the Extreme Wildfires

Figure 6 presents the surface and upper-air (500 hPa) synoptic evolution during the period encompassing the ignition of the examined wildfires and the development of persistent pyroconvection. During the days preceding the wildfires’ outbreak, Greece was under the influence of a strong upper-level ridge, developing downstream of a positively tilted long-wave trough located over western Europe (Figure 6a). The upper-level ridge was associated with an intense heatwave over the southeastern Mediterranean (Section 3.3.; Supplementary Materials; Figures S1–S5), driven by the advection of warm air masses from northern Africa and the adiabatic heating caused by downward motions. The ERA5 reanalysis shows that the ignition of the wildfires (Table 1) coincided with the initiation of the gradual breakdown of the upper-level ridge as the long-wave trough moved further eastwards on 3 August (Figure 6b). The eastward progression of the upper-level trough resulted in the weakening of the anticyclonic circulation above Greece, as highlighted by the decreasing geopotential heights on 5 August (Figure 6c). This synoptic configuration indicates that cooler and moister air was advected over the southeast Mediterranean and Greece during the passage of the upper-level trough and its associated cold front (Figure 6d).
The breakdown of the ridge ahead of the arriving upper-level trough contributed to escalating the potential for extreme fire behavior and the development of pyroconvection by increasing atmospheric instability. This can be seen in Figure 7a, which clearly shows the advection of mid-level (650–450 hPa) moist air (relative humidity exceeding 40%) above the considerably dry (relative humidity lower than 20%) lower troposphere (1000–800 hPa) of the fire-affected regions. As a result, the vertical structure of the atmosphere on 5 August, when intense pyroconvection was observed in all wildfires, shows a characteristic “inverted V” profile with elevated instability (Figure 7b). This points to a thermodynamic environment conducive to the onset of pyroCus/Cbs, as also noted in previous studies e.g., refs. [5,19].

4. Discussion and Conclusions

The catastrophic wildfires that affected southern Greece in early August 2021 were associated with the breakdown of a strong upper-level ridge that occurred as an upper-air long-wave trough moved into the southeast Mediterranean. As a result, moist mid-level air was advected over the very dry lower troposphere of the fire-affected regions. This synoptic pattern allowed for creating a mesoscale environment that is favorable for elevated convection, characterized by a distinct “inverted V” thermodynamic profile in the lower troposphere and minimal wind shear. As shown in previous studies [5,6,16,17,18,19], such meteorological conditions are conducive to the development of pyroconvection.
The onset of every pyroconvective event takes place near the surface and requires the presence of a fire that is intense enough to develop a deep convective column of smoke [16]. Intense burning can be sustained under hot and dry conditions that correspond to high-risk fire weather. Our analysis showed that the ignition of all wildfires coincided with the period of most adverse fire weather conditions since the beginning of the 2021 fire season in Greece. According to the computed ISI and FWI components of the CFFWIS, conditions at the time of ignitions were highly conducive to rapid fire growth and high burning intensity. This fire weather setup began emerging in late June (~1 month before ignitions) as excess heat had been building up over the country. Conditions deteriorated further, and ISI and FWI reached peak values, as a persistent heatwave, associated with the strong upper-level ridge, affected Greece in late July and until the outbreak of the wildfires. In addition, antecedent meteorological conditions, characterized by the significant lack of precipitation and the higher than average temperatures, contributed to bringing the landscape in a condition that could efficiently support the intense burning of the available fuels. Our results indicate that the DFMC maintained values lower than 10% since mid-June (~1.5 months before ignitions). Essentially, the landscape was in an “armed” state for a prolonged period before the outbreak of the wildfires and any ignition could sustain a spreading fire. By the time of ignitions, the DFMC was estimated to be around 6–7%, pointing to a very large potential for intense burning wildfires.
The wildfires that spread across the landscape of Greece in early August 2021 are among the most disastrous events of the past 13 years, having consumed a total area that equals nearly three times the 2008–2020 annual average burnt area of the country. These events represent cases of extreme fire behavior, mostly characterized by the occurrence of intense and persistent pyroconvection. The outbreak of the examined events is associated with meteorological conditions that, on the one hand, contributed to bringing fuels to a critically flammable condition that could support intense burning, and, on the other hand, created a mesoscale environment conducive to the development of pyroconvection. Our study clearly demonstrates that the extent and severity of these wildfires were not surprising given the fire weather potential for the period when they broke out. In that regard, we argue that continuous monitoring of the conditions that promote extreme fire behavior is imperative to improve Greece’s capacity for coping with extreme wildfires.

Supplementary Materials

The following are available online at https://www.mdpi.com/article/10.3390/atmos13030475/s1, Figure S1: Time series of daily 12 UTC (a) air temperature, (b) relative humidity, (c) wind speed, and (d) accumulated precipitation over preceding 12 h at the Tatoi AWS (EMSR527a). The yellow-shaded areas delineate heatwave periods. Figure S2: Same as Figure S1 but for the Vateri AWS (EMSR527b). Figure S3: Same as Figure S1 but for the Oleni AWS (EMSR528). Figure S4: Same as Figure S1 but for the Krokees AWS (EMSR531). Figure S5: Same as Figure S1 but for the Arfara AWS (EMSR532).

Author Contributions

Conceptualization, T.M.G. and G.P.; methodology, T.M.G., G.P., K.L. and S.D.; software, T.M.G. and G.P.; validation, T.M.G.; formal analysis, T.M.G. and G.P.; investigation, T.M.G., G.P., K.L., S.D. and A.K.; resources, T.M.G.; data curation, G.P., V.K., A.K. and E.D.; writing—original draft preparation, T.M.G. and G.P.; writing—review and editing, G.P., K.L., V.K., S.D., A.K. and E.D.; visualization, T.M.G. and G.P.; supervision, T.M.G.; project administration, T.M.G.; funding acquisition, T.M.G. All authors have read and agreed to the published version of the manuscript.

Funding

This research was funded by the Hellenic Foundation for Research and Innovation (H.F.R.I.) under the “2nd Call for H.F.R.I. Research Projects to support Post-Doctoral Researchers” (Project Number: 00559). The APC was funded by the Hellenic Foundation for Research and Innovation (H.F.R.I.) under the “2nd Call for H.F.R.I. Research Projects to support Post-Doctoral Researchers” (Project Number: 00559).

Data Availability Statement

All data are available upon request to the lead author of this paper.

Acknowledgments

The presented work was conducted in the frame of the FLAME research project, supported by the Hellenic Foundation for Research and Innovation (H.F.R.I.) under the “2nd Call for H.F.R.I. Research Projects to support Post-Doctoral Researchers” (Project Number: 00559).

Conflicts of Interest

The authors declare no conflict of interest. The funders had no role in the design of the study; in the collection, analyses, or interpretation of data; in the writing of the manuscript; or in the decision to publish the results.

References

  1. Duane, A.; Castellnou, M.; Brotons, L. Towards a comprehensive look at global drivers of novel extreme wildfires. Clim. Chang. 2021, 165, 43. [Google Scholar] [CrossRef]
  2. Bowman, D.M.J.S.; Williamson, G.J.; Abatzoglou, J.T.; Kolden, C.A.; Cochrane, M.A.; Smith, A.M.S. Human exposure and sensitivity to globally extreme wildfire events. Nat. Ecol. Evol. 2017, 1, 0058. [Google Scholar] [CrossRef] [PubMed]
  3. Finney, M.; McAllister, S.; Grumstrup, T.; Forhofer, J. Wildland Fire Behavior—Dynamics, Principles, and Processes, 1st ed.; CSIRO Publishing: Melbourne, Australia, 2021; pp. 461–462. [Google Scholar]
  4. International Cloud Atlas. Available online: https://cloudatlas.wmo.int/en/flammagenitus.html (accessed on 18 November 2021).
  5. Lareau, N.P.; Clements, C.B. Environmental controls on pyrocumulus and pyrocumulonimbus initiation and development. Atmos. Chem. Phys. 2016, 16, 4005–4022. [Google Scholar] [CrossRef] [Green Version]
  6. Potter, B.E. Atmospheric interactions with wildland fire behavior—II. Plume and vortex dynamics. Int. J. Wildland Fire 2012, 21, 802–817. [Google Scholar] [CrossRef]
  7. Dowdy, A.J.; Fromm, M.D.; McCarthy, N. Pyrocumulonimbus lightning and fire ignition on Black Saturday in southeast Australia. J. Geophys. Res.-Atmos. 2017, 122, 7342–7354. [Google Scholar] [CrossRef]
  8. Thurston, W.; Keppert, J.D.; Tory, K.J.; Fawcett, R.J.B. The contribution of turbulent plume dynamics to long-range spotting. Int. J. Wildland Fire 2017, 26, 317–330. [Google Scholar] [CrossRef]
  9. Fromm, M.; Bevilacqua, R.; Servranckx, R.; Josen, J.; Thayer, J.P.; Herman, J.; Larko, D. Pyro-cumulonimbus injection of smoke to the stratosphere: Observations and impact of a super blowup in northwestern Canada on 3–4 August 1998. J. Geophys. Res.-Atmos. 2005, 110, D08205. [Google Scholar]
  10. Fromm, M.; Torres, A.; Diner, D.; Lindsey, D.; Vant Hull, B.; Servranckx, R.; Shettle, E.P.; Li, Z. Stratospheric impact of the Chisholm pyrocumulonimbus eruption: 1. Earth-viewing satellite perspective. J. Geophys. Res.-Atmos. 2008, 113, D08202. [Google Scholar] [CrossRef] [Green Version]
  11. Fromm, M.; Shettle, E.P.; Fricke, K.H.; Ritter, C.; Trickl, T.; Giehl, H.; Gerding, M.; Barnes, J.E.; O’Neill, M.; Massie, S.T.; et al. Stratospheric impact of the Chisholm pyrocumulonimbus eruption: 2. Vertical profile perspective. J. Geophys. Res.-Atmos. 2008, 113, D08203. [Google Scholar] [CrossRef] [Green Version]
  12. Rosenfeld, D.; Fromm, M.; Trentmann, J.; Luderer, G.; Andreae, M.O.; Servranckx, R. The Chisholm firestorm: Observed microstructure, precipitation, and lightning activity of a pyro-cumulonimbus. Atmos. Chem. Phys. 2007, 7, 645–659. [Google Scholar] [CrossRef] [Green Version]
  13. Lang, T.J.; Rutledge, S.A. Cloud-to-ground lightning downwind of the 2002 Hayman forest fire in Colorado. Geophys. Res. Lett. 2006, 33, L03803. [Google Scholar] [CrossRef] [Green Version]
  14. Lang, T.J.; Rutledge, S.A.; Dolan, B.; Krehbiel, P.; Rison, W.; Lindsey, D.T. Lightning in wildfire smoke plumes observed in Colorado during summer 2002. Mon. Weather Rev. 2014, 142, 489–507. [Google Scholar] [CrossRef] [Green Version]
  15. Bakhshaii, A.; Johnson, E.A.; Nayebi, K. Wildfire pyroconvection and CAPE: Buoyancy’s drying and atmospheric intensification—Fort McMurray. Atmosphere 2020, 11, 763. [Google Scholar] [CrossRef]
  16. Peterson, D.A.; Hyer, E.J.; Campbell, J.R. A conceptual model for development of intense pyrocumulonimbus in western North America. Mon. Weather Rev. 2017, 145, 2235–2255. [Google Scholar] [CrossRef]
  17. Luderer, G.; Trentmann, J.; Winterrath, T.; Textor, C.; Herzog, M.; Graf, H.F.; Andreae, M.O. Modeling of biomass smoke injection into the lower stratosphere by a large forest fire (Part II): Sensitivity studies. Atmos. Chem. Phys. 2006, 6, 5261–5277. [Google Scholar] [CrossRef] [Green Version]
  18. Luderer, G.; Trentmann, J.; Andreae, M.O. A new look at the role of fire-released moisture on the dynamics of atmospheric pyroconvection. Int. J. Wildland Fire 2009, 18, 554–562. [Google Scholar] [CrossRef]
  19. Peterson, D.A.; Hyer, E.J.; Campbell, J.R.; Fromm, M.D.; Hair, J.W.; Butler, C.F.; Fenn, M.A. The 2013 Rim fire—Implications for predicting extreme fire spread, pyroconvection, and smoke emissions. Bull. Am. Meteorol. Soc. 2015, 96, 229–247. [Google Scholar] [CrossRef]
  20. San-Miguel-Ayanz, J.; Moreno, J.M.; Camia, A. Analysis of large fires in European Mediterranean landscapes: Lessons learned and perspectives. For. Ecol. Manag. 2013, 294, 11–22. [Google Scholar] [CrossRef]
  21. Fernandes, P.M.; Barros, A.M.G.; Pinto, A.; Santos, J.A. Characteristics and controls of extremely large wildfires in the western Mediterranean basin. J. Geophys. Res.-Biogeo. 2016, 121, 2141–2157. [Google Scholar] [CrossRef]
  22. Bradstock, R.A. A biogeographic model of fire regimes in Australia: Current and future implications. Glob. Ecol. Biogeogr. 2010, 19, 145–158. [Google Scholar] [CrossRef]
  23. Boer, M.M.; Nolan, R.H.; Resco De Dios, V.; Clarke, H.; Price, O.F.; Bradstock, R.A. Changing weather extremes call for early warning of potential for catastrophic fire. Earth’s Future 2017, 5, 1196–1202. [Google Scholar] [CrossRef]
  24. Giannaros, T.M.; Kotroni, V.; Lagouvardos, K. IRIS—Rapid response fire spread forecasting system: Development, calibration, and evaluation. Agric. For. Meteorol. 2019, 279, 107745. [Google Scholar] [CrossRef]
  25. Copernicus Emergency Management Service. Available online: https://emergency.copernicus.eu/mapping/list-of-activations-rapid (accessed on 27 November 2021).
  26. Lagouvardos, K.; Kotroni, V.; Bezes, A.; Koletsis, I.; Kopania, T.; Lykoudis, S.; Mazarakis, N.; Papagiannaki, K.; Vougioukas, S. The automatic weather stations NOANN network of the National Observatory of Athens: Operation and database. Geosci. Data J. 2017, 4, 4–16. [Google Scholar] [CrossRef]
  27. Van Wagner, C.E. Development and structure of the Canadian Forest Fire Weather Index System. In Forestry Technical Report; Canadian Forestry Service Headquarters: Ottawa, ON, Canada, 1987. [Google Scholar]
  28. Dragozi, E.; Giannaros, T.M.; Kotroni, V.; Lagouvardos, K.; Koletsis, I. Dead fuel moisture content (DFMC) estimation using MODIS and meteorological data: The case of Greece. Remote Sens. 2021, 13, 4224. [Google Scholar] [CrossRef]
  29. Land Surface Analysis Satellite Applications Facility (LSA SAF). Available online: https://www.eumetsat.int/lsa-saf (accessed on 30 November 2021).
  30. Roberts, G.; Wooster, M.J.; Xu, W.; Freeborn, P.H.; Morcrette, J.-J.; Jones, L.; Benedetti, A.; Jianping, H.; Fisher, D.; Kaiser, J.W. LSA SAF Meteosat FRP products—Part 2: Evaluation and demonstration for use in the Copernicus Atmosphere Monitoring System (CAMS). Atmos. Chem. Phys. 2015, 15, 13241–13267. [Google Scholar] [CrossRef] [Green Version]
  31. Wooster, M.J.; Zhukov, B.; Oertel, D. Fire radiative energy for quantitative study of biomass burning: Derivation from the BIRD experimental satellite and comparison to MODIS fire products. Remote Sens. Environ. 2003, 86, 83–107. [Google Scholar] [CrossRef]
  32. Roberts, G.; Wooster, M.J.; Perry, G.L.W.; Drake, N.; Rebelo, L.M.; Dipotso, F. Retrieval of biomass combustion rates and totals from fire radiative power observations: Application to southern Africa using geostationary SEVIRI imagery. J. Geophys. Res.-Atmos. 2005, 110, D21111. [Google Scholar] [CrossRef] [Green Version]
  33. Ichoku, C.; Giglio, L.; Wooster, M.J.; Remer, L.A. Global characterization of biomass-burning patterns using satellite measurements of fire radiative energy. Remote Sens. Environ. 2008, 112, 2950–2962. [Google Scholar] [CrossRef]
  34. Heward, H.; Smith, A.M.S.; Roy, D.P.; Tinkham, W.T.; Hoffman, C.M.; Morgan, P.; Lannom, K.O. Is burn severity related to fire intensity? Observations from landscape scale remote sensing. Int. J. Wildland Fire 2013, 22, 910–918. [Google Scholar] [CrossRef]
  35. Spanos, K.A.; Skouteri, A.; Gaitanis, D.; Petrakis, P.V.; Meliadis, I.; Michopoulos, P.; Solomou, A.; Koulelis, P.; Avramidou, E.V. Forests of Greece, their multiple functions and uses, sustainable management and biodiversity conservation in the face of climate change. Open J. Ecol. 2021, 11, 374–406. [Google Scholar] [CrossRef]
  36. Palaiologou, P.; Kalabokidis, K.; Ager, A.A.; Galatsidas, S.; Papalampros, L.; Day, M.A. Spatial optimization and tradeoffs of alternative forest management scenarios in Macedonia, Greece. Forests 2021, 12, 697. [Google Scholar] [CrossRef]
Figure 1. (a) Locations of the examined wildfires (Table 1) in the study area. Red shades denote the burnt areas according to the Copernicus Emergency Management Service. Blue and green balloons point to the locations of the surface weather stations used in this analysis (Table 2). (b) Photographic evidence of pyroconvection and extreme fire behavior (Photographs of Niki Glynou [EMSR527a], Elliot Kefalas [EMSR527b], Thodoris Kondylis [EMSR528], Ertnews.gr [EMSR531], and Messenialive.gr [EMSR532]).
Atmosphere 13 00475 g001
Figure 2. Time series of hourly normalized FRP from SEVIRI/METEOSAT: (a) EMSR527a, (b) EMSR527b, (c) EMSR528, (d) EMSR531, and (e) EMSR532. Note the differences in the vertical and horizontal axes’ scales.
Atmosphere 13 00475 g002
Figure 3. Mean monthly values of precipitation (bars) and daily maximum air temperature (lines) for the period December–July: (a) Athens AWS-EMSR527a, (b) Skopelos AWS-EMSR527b, (c) Pyrgos AWS-EMSR528, (d) Sparti AWS-EMSR531, and (e) Megalopoli AWS-EMSR532. Black bars (lines) denote the climatological means computed based on the record span of each AWS (Table 2). Grey bars (lines) denote the 2020/2021 recorded values.
Atmosphere 13 00475 g003
Figure 4. Time series of the daily DFMC for the period December–August: (a) Tatoi AWS-EMSR527a, (b) Vateri AWS-EMSR527b, (c) Oleni AWS-EMSR528, (d) Krokees AWS-EMSR531, and (e) Arfara AWS-EMSR532. The yellow-shaded areas delineate heatwave periods.
Atmosphere 13 00475 g004
Figure 5. Time series of ISI and FWI during the fire season (May–August) of 2021: (a) Tatoi AWS-EMSR527a, (b) Vateri AWS-EMSR527b, (c) Oleni AWS-EMSR528, (d) Krokees AWS-EMSR531, and (e) Arfara AWS-EMSR532. The yellow-shaded areas delineate heatwave periods. The grey-shaded areas denote ISI and FWI values corresponding to “Very high” and “Extreme” fire danger according to EFFIS.
Atmosphere 13 00475 g005
Figure 6. ERA5 500 hPa geopotential height (contours) and wind (barbs), and 650–450 hPa maximum relative humidity at 12:00 UTC on (a) 1 August, (b) 3 August, (c) 5 August, and (d) 6 August 2021. The red dashed lines denote the axis of the upper-level trough. The red dots denote the ignition locations of the examined wildfires.
Atmosphere 13 00475 g006
Figure 7. (a) Time-pressure plot of ERA5 relative humidity (shaded) and horizontal wind (barbs) averaged over the examined wildfires. The ignitions of the wildfires are denoted with black flame icons. The black dashed line indicates the approximate arrival time of the upper-level trough. The white dashed lines denote approximately the occurrence of the most widespread and active pyroconvection in multiple locations. (b) Vertical profile of temperature (red) and dew point (green) averaged over the ERA5 grid points closest to each ignition location. Dashed lines indicate maximum and minimum values across the five wildfires. The solid black line corresponds to the most unstable air parcel profile.
Atmosphere 13 00475 g007
Publisher’s Note: MDPI stays neutral with regard to jurisdictional claims in published maps and institutional affiliations.

