Article

Variation and Driving Factor of Aerosol Optical Depth over the South China Sea from 1980 to 2020

1
Shanghai Ecological Forecasting and Remote Sensing Center, Shanghai Meteorological Service, Shanghai 200030, China
2
Key Laboratory of South China Sea Meteorological Disaster Prevention and Mitigation of Hainan Province, Haikou 570203, China
3
Key Laboratory for Aerosol-Cloud-Precipitation of China Meteorological Administration, Nanjing University of Information Science and Technology, Nanjing 210044, China
*
Author to whom correspondence should be addressed.
Atmosphere 2022, 13(3), 372; https://doi.org/10.3390/atmos13030372
Submission received: 20 January 2022 / Revised: 18 February 2022 / Accepted: 21 February 2022 / Published: 23 February 2022
(This article belongs to the Special Issue Air Pollution in China)

Abstract

:
Spatial and temporal variation of aerosol optical depth (AOD) and optical depth of different aerosol types derived from the second Modern-Era Retrospective analysis for Research and Applications (MERRA-2) over the South China Sea (SCS) between 1980 and 2020 were studied. AOD distribution showed different characteristics throughout the entire SCS. Sulfate Aerosol Optical Depth (SO4AOD) and Sea Salt Aerosol Optical Depth (SSAOD) mainly contributed to the spatial and temporal variation of AOD over the SCS. A significant increasing trend followed by a decreasing trend of AOD could be observed in the north of the SCS from 1980 to 2020. Mean MERRA-2 AOD between 1980 and 2020 showed that AOD was high in the north and low in the south and that AOD gradually decreased from north to south over the SCS. AOD after 2000 was obviously higher than that of the 1980s and 1990s. Higher AOD appeared in the spring and winter, and low AOD appeared in the summer. The spatial distribution of scattering aerosol optical depth (SAOD) was similar to AOD distribution over the SCS. SO4AOD and SSAOD were obviously higher than black carbon aerosol optical depth (BCAOD), organic carbon aerosol optical depth (OCAOD), and dust aerosol optical depth (DUAOD) over the SCS. SO4AOD accounted for over 50% of total AOD (TAOD) over the north of the SCS, while BCAOD and DUAOD accounted for less than 10% of TAOD over the entire SCS. An obvious annual mean TAOD increase between 1980 and 2007 could be observed over the northern part of the SCS (NSCS), while a TAOD decrease happened from 2008 to 2020 in this region. The correlation coefficient between TAOD and SO4AOD over NSCS from 1980 to 2020 was about 0.93, indicating SO4AOD was the driving factor of TAOD variation in this area. Different AOD variation trends over the different areas of the SCS could be observed during the two periods including 1980–2007 and 2008–2020. AOD increase appeared over most of the SCS during the period from 1980 to 2007, while AOD decrease could be observed over most of the SCS from 2008 to 2020.

1. Introduction

Aerosol is an important constituent of the atmosphere, and plays a key role in the radiation balance, regional and global climate change, and human health [1,2,3,4,5,6,7,8,9,10,11]. Aerosol is released to the atmosphere through both natural and anthropogenic processes. To have a better understanding of aerosol, a large number of studies about aerosol have been conducted by researchers around the world [12,13,14,15,16,17,18,19,20,21,22,23,24,25]. However, at present, aerosol optical property is still one of the largest sources of uncertainty in estimating climate change. AOD represents extinction of light over the vertical column of atmosphere. As an important measure of aerosol loading, AOD is a crucial metric in assessment of global climate change and the impact of aerosol on precipitation, radiation, and clouds [26]. Ground-based measurement with high accuracy is an effective method to obtain AOD, and is always used to validate satellite and reanalysis data.
Ground-based observation networks mainly include AERONET, China Aerosol Remote Sensing Network (CARSNET), and Sky Radiometer Network (SKYNET). AERONET could provide consistent measurements of aerosol optical properties, and was known as a global sun-photometer network [27,28,29,30,31]. Established by the China Meteorological Administration (CMA) in 2002, CARSNET is an independent aerosol monitoring network with the same type of sun-photometer as AERONET [32,33,34,35]. SKYNET equipped with pyranometer and sun/sky photometer is a radiation network [36]. Ground-based observation has high accuracy, but it offers limited temporal and spatial coverage. Compared with sparse ground-based observation, satellite remote sensing can provide measurements covering large areas. For example, the Moderate Resolution Imaging Spectroradiometer (MODIS) aerosol products are usually used in aerosol analysis. Although MODIS data can cover a large area, the study period is only about 20 years. In addition, there are limitations under cloudy conditions for satellite data. Reanalysis product plays an important role in the areas which lack measurements or only have short-term observations. MERRA-2 aerosol products not only can cover large areas, but also provide long-term aerosol data from 1980 to present. Moreover, MERRA-2 also can offer aerosol data under cloudy conditions.
Due to rapid industrial development, air pollution has become a serious problem in the regions where people live. A lot of researchers have carried out studies about aerosol characteristics over land. Yu et al. [37] did research about aerosol optical properties in Beijing with AERONET measurements between 2002 and 2007, finding an obvious seasonal variation with higher AOD values in spring and summer. Kang et al. [38] conducted research about aerosol optical property in Nanjing through ground-based measurements from September 2007 to August 2008, and arrived at the conclusion that aerosol over Nanjing mainly contained the mixed type, urban-industrial type, and biomass burning type. Che et al. [39] studied aerosol pollution in eastern China with ground-based measurements between 2011 and 2015 from seven observation sites, pointing out that—different from northern China—AOD in the Yangtze River Delta during July and August is lower than in January and February because of particle dispersion. Due to air mass transport, natural and anthropogenic aerosol can spread through the atmosphere over a large spatial scale. The transport of atmospheric aerosol from continental areas to oceans leads to the spatiotemporal heterogeneity of the atmospheric aerosol characteristics over oceans, which can influence the regional climate [40]. Therefore, aerosol study over the oceans is also important.
As a low-latitude sea, the South China Sea (SCS) is located in the south of China and is adjacent to several Asian countries. The SCS is a major sea route which connects the Pacific Ocean and the Indian Ocean. With abundant marine resources, the SCS is the largest marginal sea of China. Large amounts of atmospheric aerosols from these surrounding regions transport to the SCS [41]. The deposition of aerosol over sea has an important impact on the seawater. In order to comprehensively understand the significant role of aerosol in climate change and the biogeochemical cycle, variation of aerosol properties over sea needs to be studied. At present, much attention has been given to the SCS. Sun et al. [42] conducted research about variability of AOD in the SCS and concluded that AOD had an obvious dependence on the wind speed. Zhang et al. [43] investigated the aerosol properties over the SCS with ground-based observations in two sites, including Taiping and Dongsha. The study found that AOD in Taiping is less than 0.2 and that AOD in Dongsha was between 0 and 0.6. Li et al. [44] studied the aerosol properties over the northern area of the SCS between 9 August and 7 September 2016 with a shipborne micro-pulse lidar, finding that AOD was lower over the southwest side than the northeast side of the cruise region.
Although investigations about aerosol properties over the SCS have been conducted, the study period of most studies is not long enough. It is essential to conduct investigation on the long-term variation of aerosol loadings over the SCS. In this study, variations of MERRA-2 AOD, BCAOD, OCAOD, SO4AOD, DUAOD, and SSAOD from 1980 to 2020 were analyzed to offer a better understanding of aerosol property over the SCS.

2. Materials and Methods

MERRA-2 is a NASA reanalysis product from 1980 onward. With a 0.625° × 0.5° longitude-by-latitude grid, MERRA-2 offers data collections including AOD products, radiation diagnostics, and so on. The resolution of MERRA-2 is approximately 50 × 50 km. In this study, monthly MERRA-2 AOD, BCAOD, OCAOD, SO4AOD, DUAOD, and SSAOD were used to study the long-term variation of aerosol over the SCS. Three regions of interest over the SCS were chosen for a better analysis of the aerosol variation. In addition, linear regression method was used to calculate the MERRA-2 AOD variation trend over the SCS in two periods, including 1980–2007 and 2008–2020.
Figure 1 showed the map of the SCS and the locations of the northern part of the South China Sea (NSCS), the middle part of the South China Sea (MSCS), and the southern part of the South China Sea (SSCS).

3. Results and Discussion

3.1. Accuracy of MERRA-2 AOD

As AOD are retrieved and assimilated from AERONET, MISR, MODIS, and AVHRR, MERRA-2 AOD agreed well with the ground-based measurements [45]. The correlation coefficients between AERONET and MERRA-2 AOD were 0.84, 0.88, and 0.90 in Xianghe, Beijing, and the Yangtze River Basin [46]. MERRA-2 AOD was compared with ground-based AOD from 29 CARSNET stations throughout China during 2002–2014, and good agreement was also obtained [47]. The good agreement between MERRA-2 and ground-based AOD offered an important theoretical basis for the following study of temporal and spatial distributions of MERRA-2 AOD over the SCS from 1980 to 2020.

3.2. Spatial Distribution and Temporal Variation of MERRA-2 AOD

There are 41 years from 1980 to 2020, totalling 492 months. With the monthly MERRA-2 AOD data, we obtained the mean value of MERRA-2 AOD during the period between 1980 and 2020. In Figure 2, the four-decade-long mean MERRA-2 AOD over the SCS was obviously high in the north and low in the south, and gradually decreased from the north to south. More obvious AOD variation could be seen in the north of the SCS. The highest AOD between 0.35 and 0.40 is over China’s offshore region. This is due to the aerosol transport from land with higher AOD (over 0.40) to the ocean. The aerosol over the offshore region can be easily affected by the aerosol over land because of the short distance. The lowest AOD appeared in the southern part of the SCS where AOD was less than 0.15. In the middle of the SCS, AOD value was between 0.15 and 0.20. The mean MERRA-2 AOD value over Dongsha was between 0.275 and 0.30, while the AOD value over Taiping was between 0.15 and 0.175. AOD over Dongsha was higher than AOD over Taiping, which was consistent with the conclusion by Zhang et al. [43].
As shown in Figure 3, the spatial distributions of mean MERRA-2 AOD over the SCS in eight 5-year periods showed similar distribution from 1980 to 2020. High AOD appeared in the north of the SCS, and low AOD appeared in the south of the SCS in the eight 5-year periods. In the period of 1980–1985, AOD in the north of the SCS was between 0.20 and 0.30, and AOD in the majority of the southern region of the SCS was between 0.15 and 0.20. In the period of 1986–1990, AOD in the south of the SCS was only between 0.10 and 0.15, which was obviously lower than that in 1980–1985. This could be due to the eruption of the El Chichon volcano in 1982 [48], which caused relatively higher AOD in 1980–1985. Because of the eruption of Pinatubo volcano in 1991 in the Philippines [49], AOD rose obviously in the period of 1991–1995, and was higher than that in 1986–1990 over the entire SCS. With the gradual deposition of volcanic pollutants, an obvious AOD decrease could be observed in 1996–2000. During 1996–2000, AOD was again below 0.15 in the south of the SCS. After 2000, rapid industrial development of China and the aerosol transport from the land to ocean contributed to the AOD increase over the SCS. AOD over the offshore region of China in the north of the SCS after 2000 was obviously higher than that before 2000. Affected by the high AOD over land, AOD over the offshore region of China could exceed 0.35 after 2000. The sea area to the west of Hainan Island, whose location could be seen in Figure 2, is about 0.40 in the period of 2001–2005. The AOD of this sea area exceeded 0.50 in 2006–2010 and 2011–2015, and then decreased to about 0.40 in 2016–2020.
Figure 4 illustrated the mean AOD in each month over the SCS between 1980 and 2020. In most months, similar spatial distribution could be observed. High AOD appeared in the north and low AOD occurred in the south. In addition, high AOD could be observed in spring and winter, while low AOD occurred in summer. In March and April, AOD over the north of the SCS exceeded 0.50, while in June and July AOD over the north of the SCS was only about 0.20. In September, higher AOD could be observed in the south than in the middle of the SCS. These could be explained by the following facts. With a monsoon climate, the SCS has a northeast monsoon in winter and spring, and a southwest monsoon in summer and autumn. In winter and spring, dust and pollution transported from mainland China and Japan in the northeast, while during summer and autumn, the SCS received biomass burning pollutants from Malaysia and Indonesia from the southwest [41].

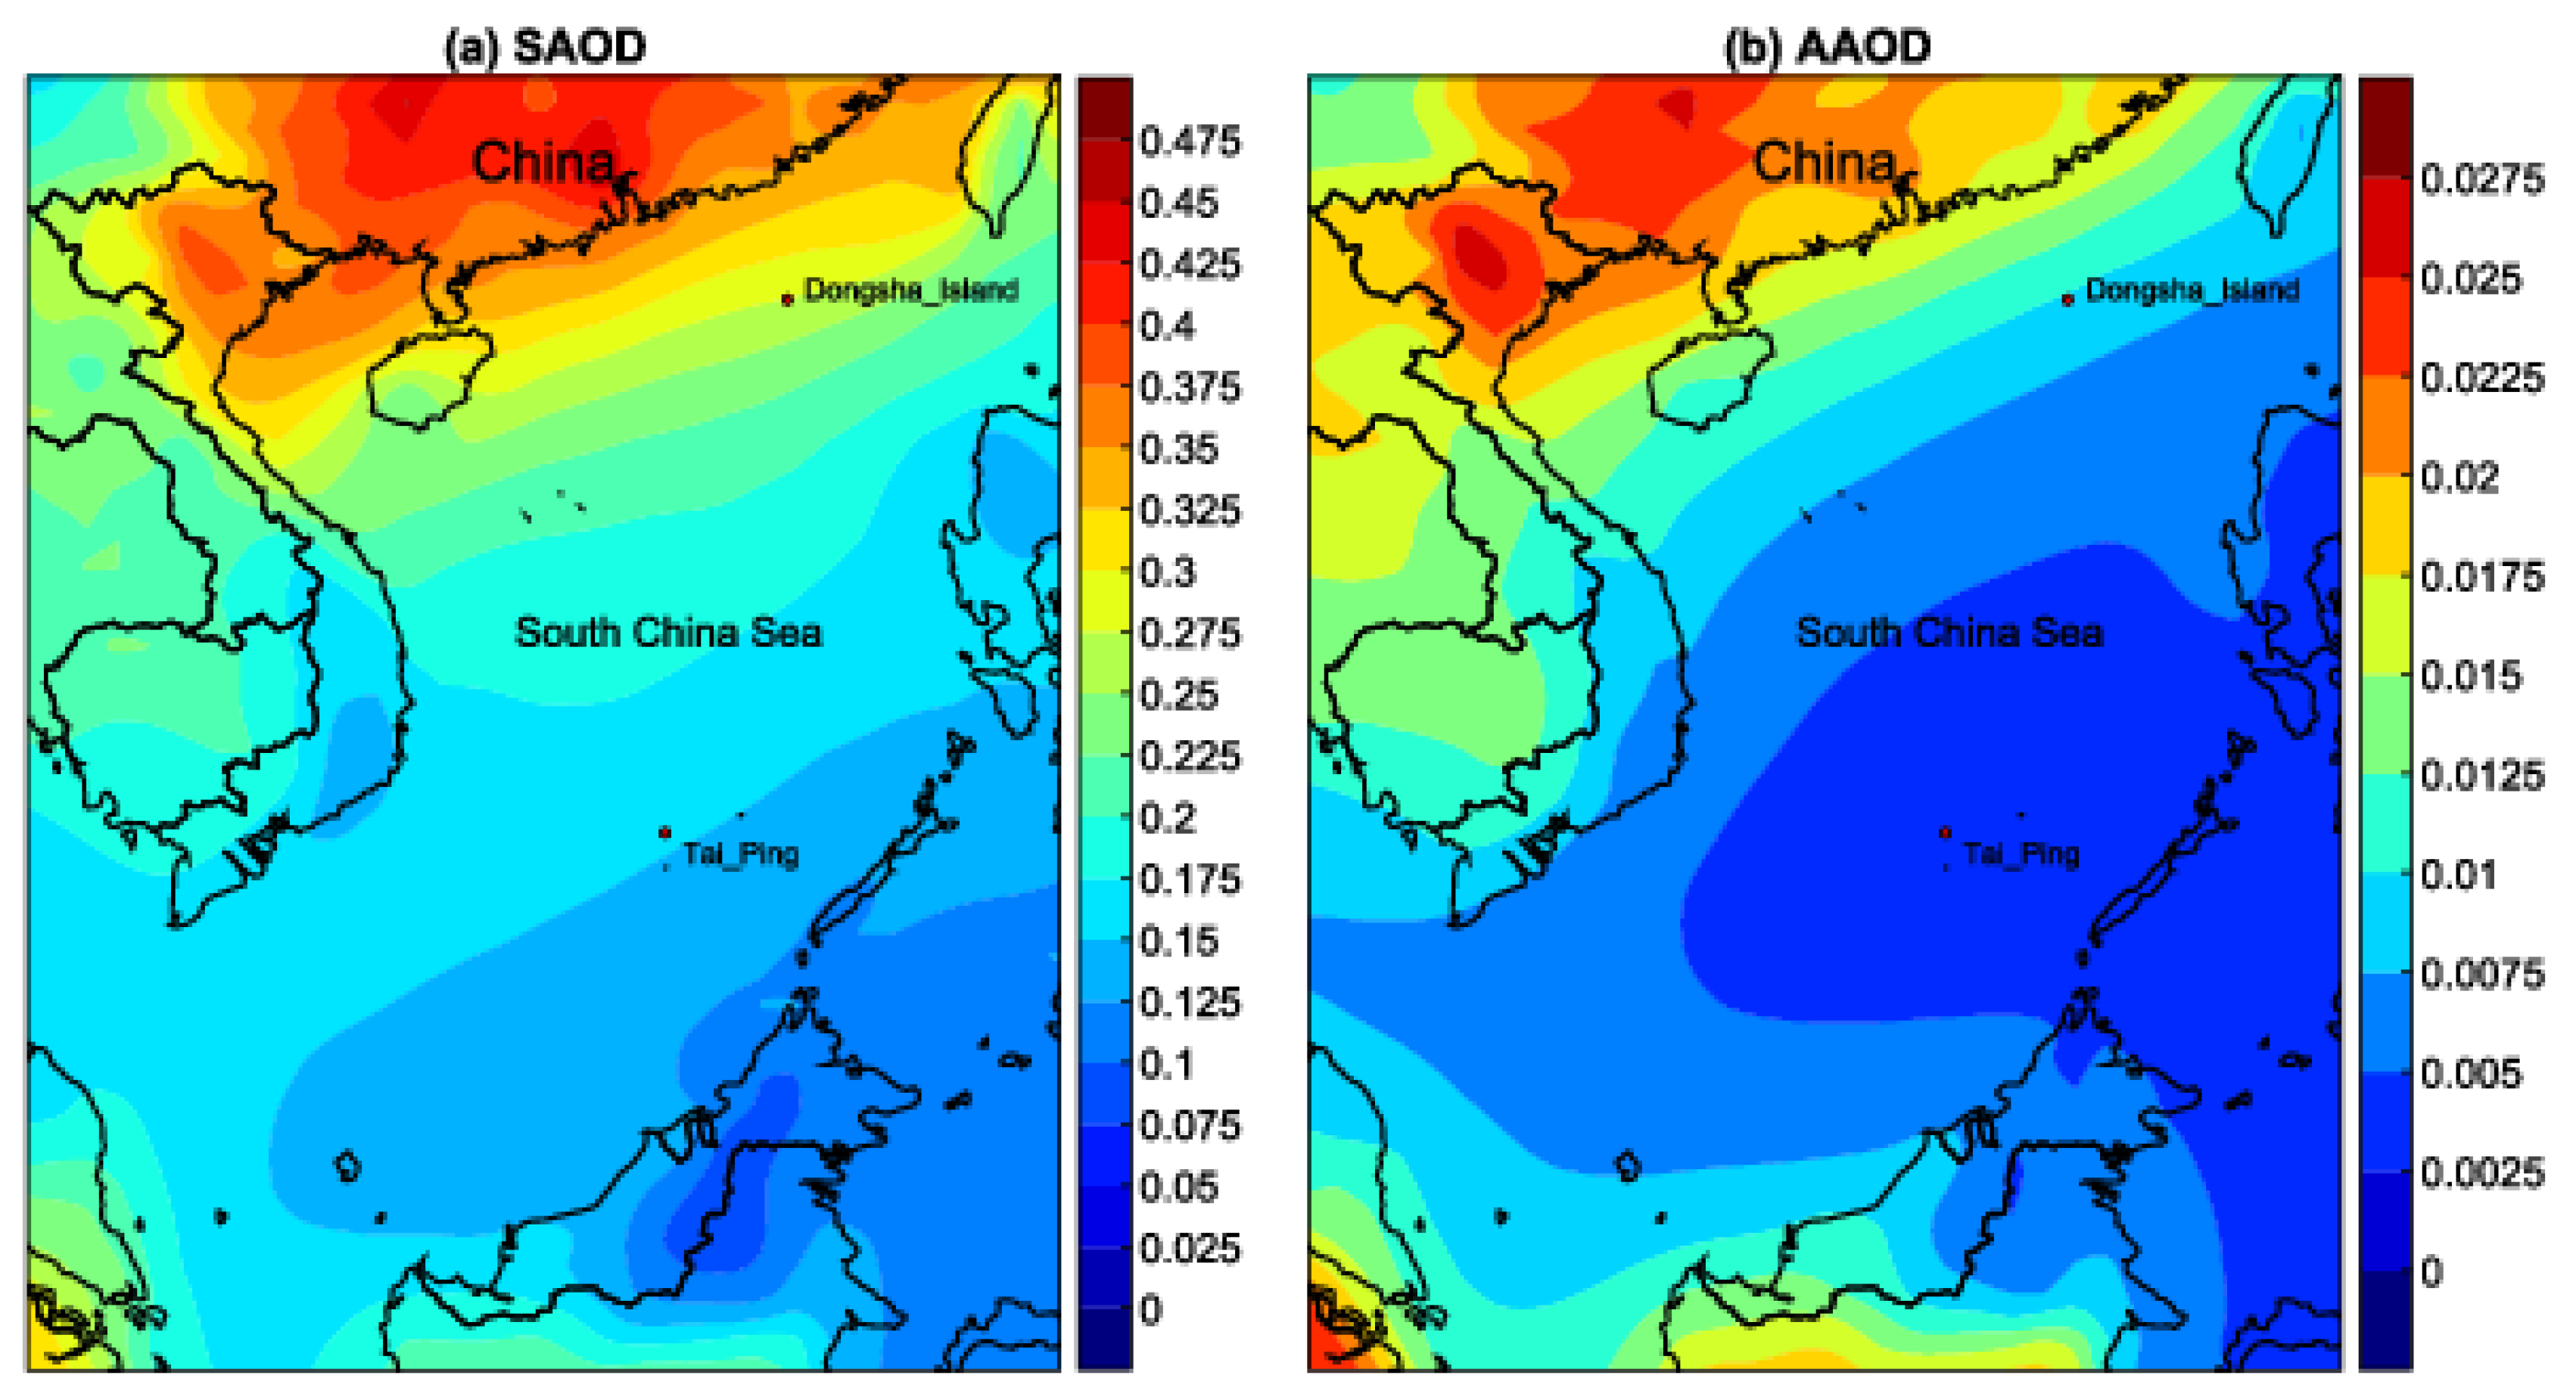
3.3. Spatial Distribution of MERRA-2 SAOD and AAOD

Scattering aerosol optical depth (SAOD) could be obtained by subtracting absorption aerosol optical depth (AAOD) from the total aerosol optical depth (TAOD) [50]. Mean values of MERRA-2 SAOD and AAOD between 1980 and 2020 over the SCS were shown in Figure 5. In Figure 5a, the spatial distribution of SAOD was similar to AOD distribution in Figure 2. SAOD was high in the north and low in the south, and gradually decreased from the north to south over the SCS. On the whole, SAOD was a little lower than AOD over the SCS. The north of the SCS showed more obvious SAOD variation. The highest SAOD between 0.325 and 0.375 occurred in the offshore area of China, while the lowest SAOD between 0.125 and 0.15 could be observed in the south of the SCS. In the middle of the SCS, SAOD was between 0.15 and 0.175. As shown in Figure 5b, high AAOD (0.015–0.0175) appeared in the north and low AAOD (0.0025–0.005) was in the south of the SCS. AAOD gradually decreased from the north to the south. More obvious AAOD variation could be observed in the north of the SCS. In the middle of the SCS, AAOD was between 0.005 and 0.0075. Over the entire SCS, AAOD was much lower than SAOD, indicating scattering extinction played a major role in this area.

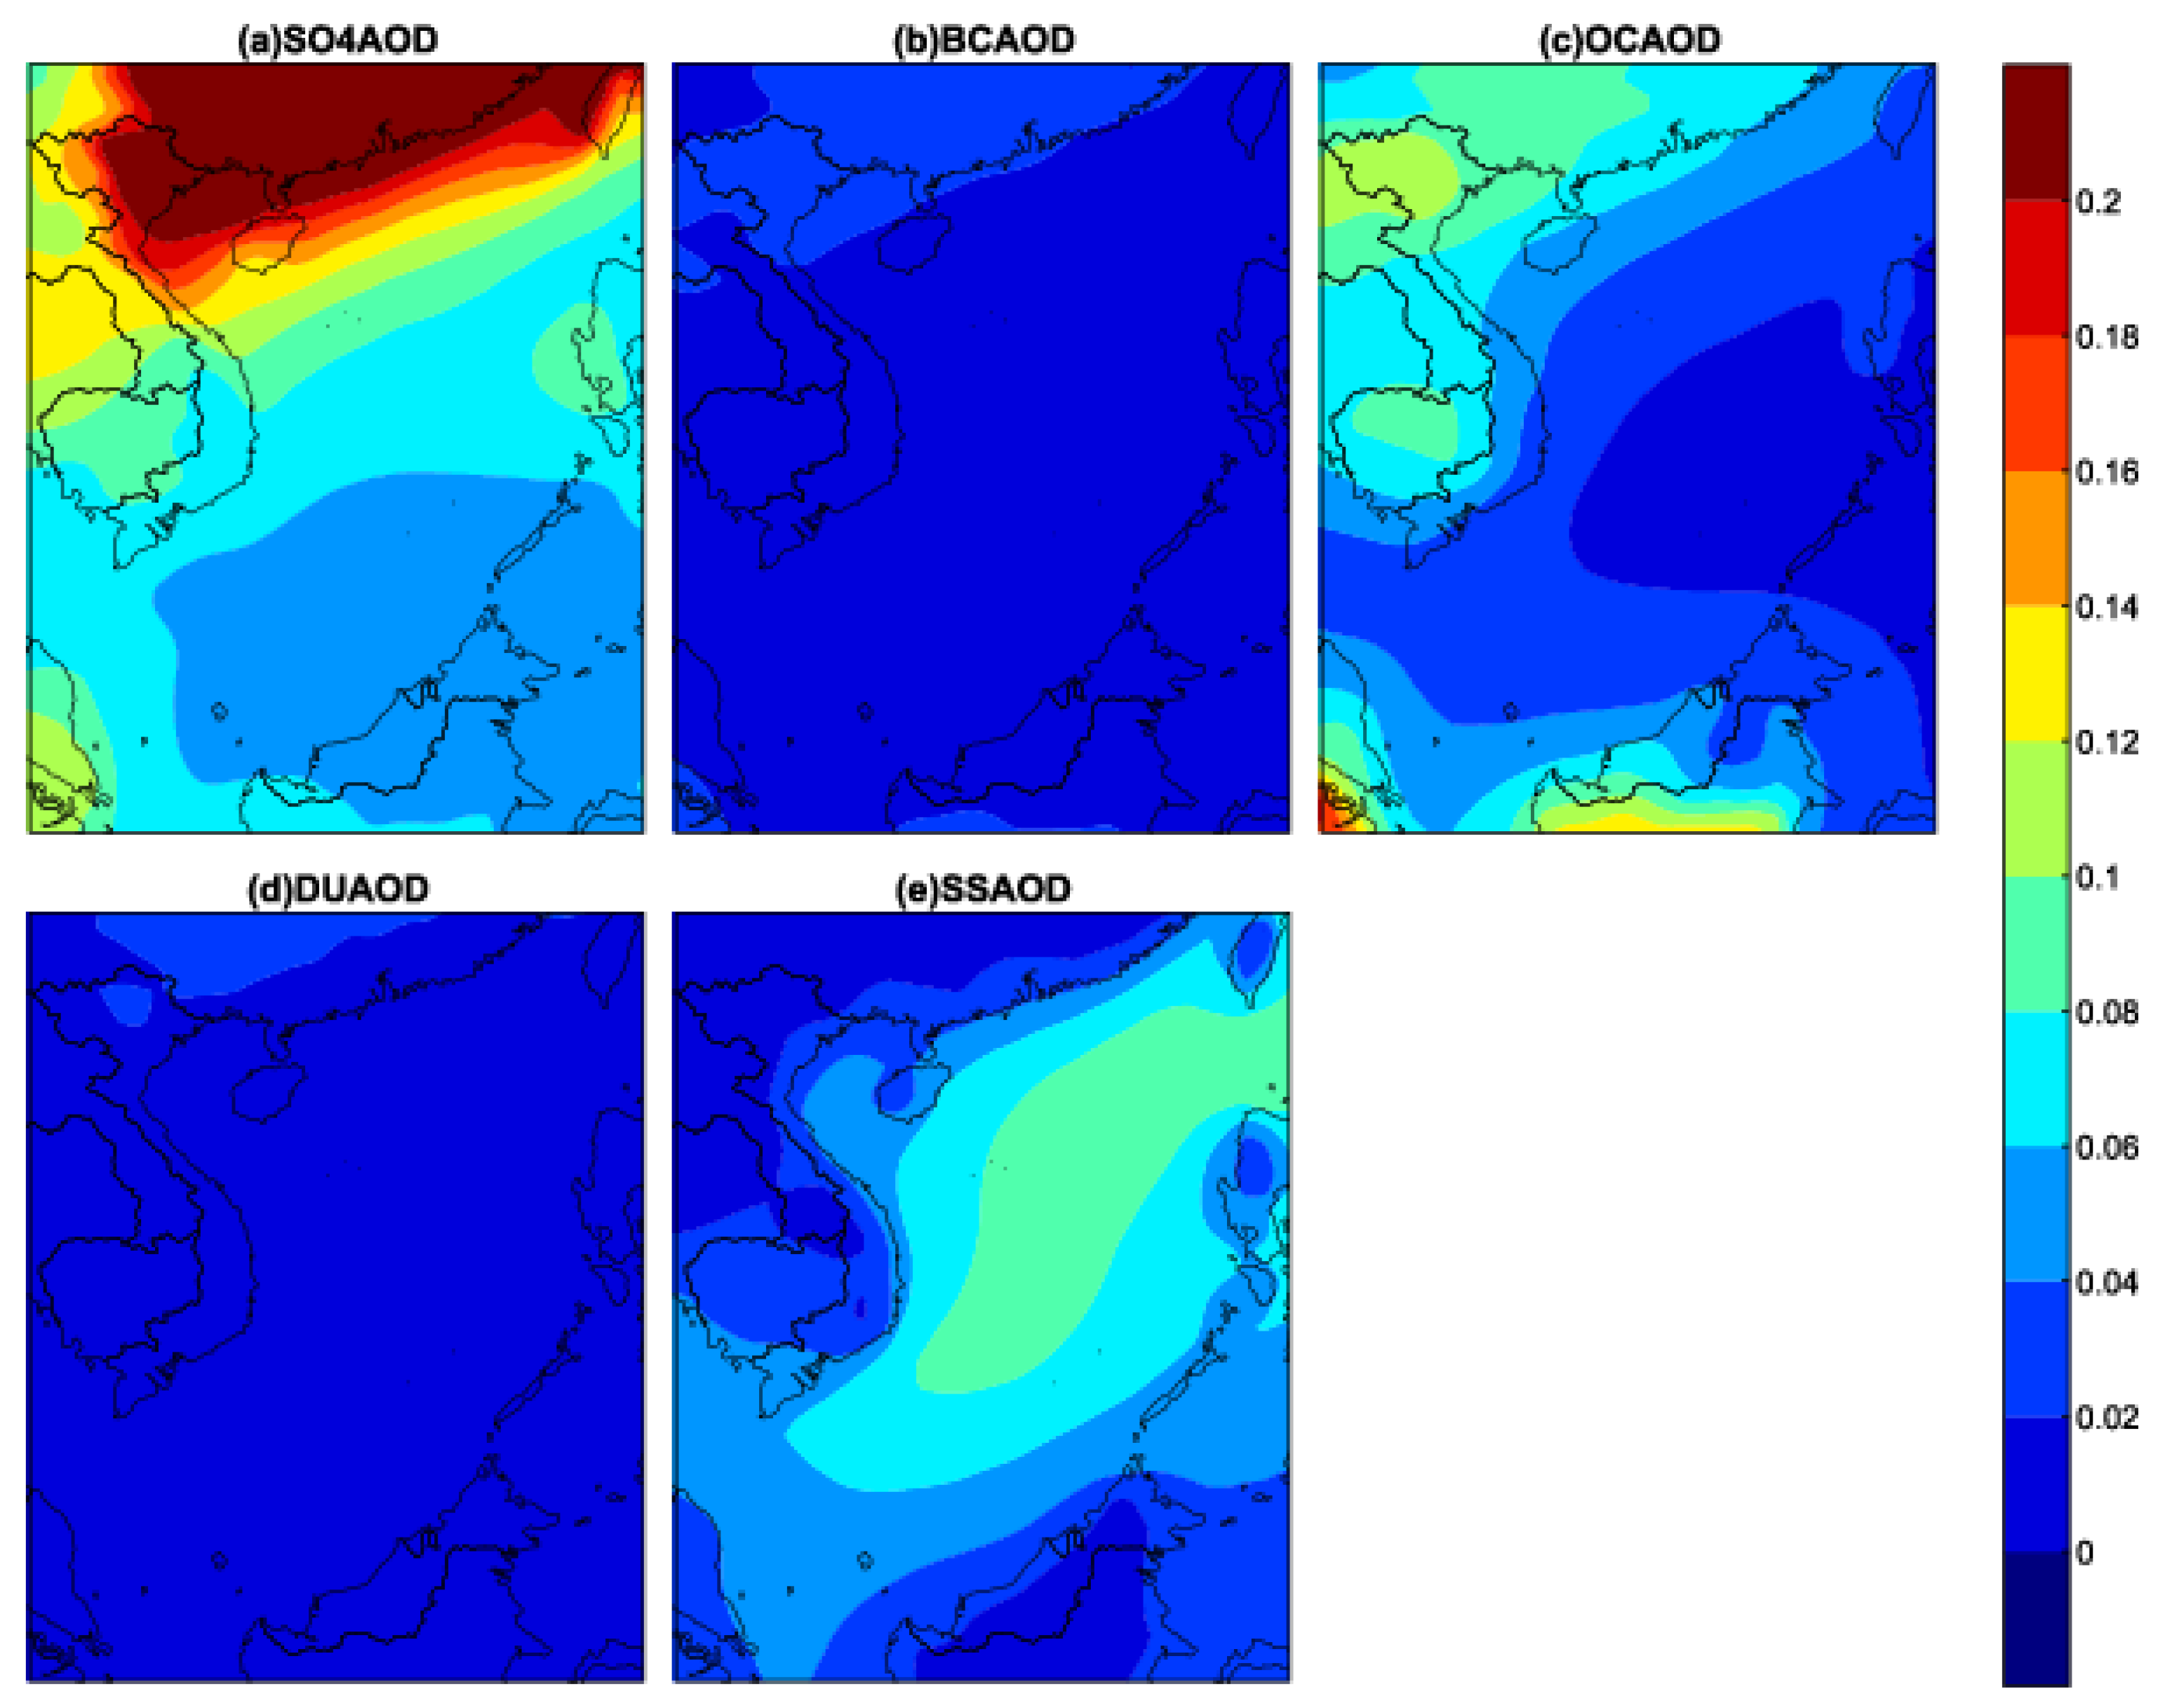
3.4. Spatial Distribution and Temporal Variation of MERRA-2 AOD of Different Aerosol Compositions

Black carbon, organic carbon, dust, sulfate, and sea salt aerosol are the main components in the aerosol. MERRA-2 AOD is the sum of SO4AOD, BCAOD, OCAOD, DUAOD, and SSAOD. As shown in Figure 6, the mean BCAOD, OCAOD, DUAOD, SO4AOD, and SSAOD during 1980 and 2020 showed different characteristics over the SCS. SO4AOD and SSAOD had higher values than BCAOD, OCAOD, and DUAOD. BCAOD and DUAOD had the lowest values which were less than 0.02 over the entire SCS. OCAOD was also low, and was under 0.04 over most part of the SCS. Only in the north of the SCS, OCAOD exceeded 0.04. SO4AOD showed similar spatial distribution to the total AOD mentioned above, while the spatial distribution of BCAOD and DUAOD was completely different from that of total AOD. The spatial distribution of BCAOD over the SCS showed almost no difference, and so did DUAOD. The spatial distribution with most obvious difference over the SCS was SO4AOD. SO4AOD was high in the north and relatively low in the south, and gradually decreased from the north to south over the SCS. More obvious SO4AOD variation appeared in the north of the SCS. The highest SO4AOD (over 0.20) appeared in the north of the SCS, and the lowest SO4AOD (under 0.06) occurred in the south of the SCS. SO4AOD in the middle of the SCS was mainly between 0.06 and 0.08. The SSAOD was between 0.06 and 0.10 over most part of the SCS, and the highest SSAOD values were mainly between 0.08 and 0.10. Total AOD over SCS was mainly affected by SO4AOD and SSAOD.
The contribution of SO4AOD, BCAOD, OCAOD, DUAOD, and SSAOD to AOD was obtained through the equations
SO4AOD Percent = SO4AOD/AOD
BCAOD Percent = BCAOD/AOD
OCAOD Percent = OCAOD/AOD
DUAOD Percent = DUAOD/AOD
SSAOD Percent = SSAOD/AOD
Figure 7 showed the contributions of SO4AOD, BCAOD, OCAOD, DUAOD, and SSAOD to the total AOD over the SCS, respectively. SO4AOD Percent and SSAOD Percent were obviously higher than BCAOD Percent, OCAOD Percent, and DUAOD Percent. BCAOD Percent and DUAOD Percent had the lowest values which were less than 10% over the entire SCS. OCAOD Percent was mainly between 10% and 20%, and only a small part in the middle of the SCS was under 10%. SO4AOD Percent decreased from north to the south over the SCS. The highest values of SO4AOD Percent appeared in the north of the SCS, which were between 50% and 60%. Relatively lower values of SO4AOD Percent, between 30% and 40%, occurred in the middle and south of the SCS. Different from SO4AOD Percent, SSAOD Percent was low in the north, and higher in the middle and south of the SCS. In the north of the SCS, SSAOD Percent was between 10% and 20%, which was the lowest over the SCS. Most SSAOD Percent values over the SCS were between 30% and 50%. The highest SSAOD Percent values (between 50% and 60%) appeared in a small part in the middle of the SCS.
As shown in Figure 8a, an obvious annual mean TAOD increase followed by a decrease could be observed over NSCS during the period of 1980–2020, and the same was for SO4AOD which was higher than BCAOD, OCAOD, DUAOD, and SSAOD in this region. The TAOD maxima at the beginning of the 1980s and 1990s was due to the El Chichon eruption in Mexico in 1982 [48] and the Pinatubo eruption in the Philippines in 1991 [49]. With the deposition of the pollutants, TAOD gradually decreased after 1982 and 1991, respectively. He et al. [51] studied the MODIS AOD over the entire area of mainland China between 2002 and 2015, and found an upward tendency pre-2008 due to booming economy and a downward tendency post-2008 as a result of the Chinese government’s environmental protection policy which lead to emission reduction. In this study, the increase of TAOD (SO4AOD) during the period of 1980–2007 was 0.0029 (0.0013) per year, while the decrease of TAOD (SO4AOD) from 2008 to 2020 was −0.0033 (−0.0029) per year over NSCS. The mean value of SO4AOD during the period of 1980–2020 accounted for 47.9% of TAOD over NSCS. The R between TAOD and SO4AOD from 1980 to 2020 was about 0.93, indicating that the variation of TAOD was mainly due to the variation of SO4AOD in this area. In Figure 8b,c, no significant variation trend of TAOD and SO4AOD could be observed from 1980 to 2020. This could be due to the far distance of MSCS and SSCS from mainland China. SSAOD was higher than SO4AOD in MSCS and SSCS. SSAOD accounted for 46.5% and 41.7%, while SO4AOD accounted for 37.9% and 35.6% in MSCS and SSCS, respectively.

3.5. Variation Trend of MERRA-2 AOD

In Figure 9a, an AOD increase could be observed over most part of the SCS from 1980 to 2007. In this period, highest AOD increase (between 0.005 and 0.01 per year) could be seen in the north of the SCS, and the AOD increase (between 0 and 0.005 per year) occurred in the north and middle of the SCS. p-values of less than 0.05 mainly appeared in the north of the SCS. Hse et al. [52] studied the global trends of AOD over ocean with SeaWiFS data, and also found annual AOD increase trend over ocean from 1998 to 2010. In Figure 9b, AOD decreased over most of the SCS. AOD decrease (between −0.01 and −0.005 per year) appeared over the north of the SCS, and AOD decrease (between −0.005 and 0 per year) was over the north and middle of the SCS. p-values of less than 0.05 mainly occurred in the north of the SCS and a small part in the middle of the SCS. The AOD increase or decrease was more significant over the coastal region of mainland China due to the aerosol transport from land to ocean.

4. Conclusions

We analyzed spatial and temporal variation of AOD and optical depth of different aerosol types during the period of 1980–2020 with MERRA-2 dataset, and the difference of spatial and temporal distribution of AOD was obtained. SO4AOD and SSAOD dominated the variation of AOD over the SCS. An AOD upward trend followed by a downward trend occurred in the north of the SCS in this period. Mean MERRA-2 AOD from 1980 to 2020 was high in the north and low in the south over the SCS, and gradually decreased from the north to the south in this region. Due to rapid economic development, AOD after 2000 reached a higher value than that in 1980s and 1990s. Mean AOD in each month from 1980 to 2020 was analyzed. Higher AOD was in spring and winter, and low AOD appeared in summer. Similar spatial distribution could be observed between SAOD and AOD over the SCS, and AAOD was much lower than SAOD in this region. SO4AOD and SSAOD had higher values than BCAOD, OCAOD, and DUAOD over the SCS. Over the north of the SCS, SO4AOD accounted for more than 50% of TAOD, while BCAOD and DUAOD accounted for only less than 10% of TAOD all over the SCS. TAOD over NSCS showed an upward trend from 1980 to 2007 and a downward trend from 2008 to 2020. Similar annual variation between TAOD and SO4AOD over NSCS from 1980 to 2020 could be observed, and the R between them reached 0.93. This indicated that variation of the SO4AOD was the driving force of the variation of TAOD over NSCS from 1980 to 2020. The spatial distribution of AOD variation trend over the SCS in two periods was also analyzed. Different AOD variation trends over the different areas of the SCS appeared during the two periods including 1980–2007 and 2008–2020. AOD increase could be observed over most of the SCS between 1980 and 2007, while AOD decrease was observed over most of the SCS from 2008 to 2020.

Author Contributions

Conceptualization, E.S.; Software, E.S., W.Y. and C.F.; Methodology, C.F. and C.L.; Writing—original draft, E.S.; Investigation, W.Y. and Y.X.; Supervision, Y.L.; Writing—reviewing and editing, C.L. All authors have read and agreed to the published version of the manuscript.

Funding

This research was supported by the Key Laboratory of South China Sea Meteorological Disaster Prevention and Mitigation of Hainan Province (SCSF202010).

Institutional Review Board Statement

Not applicable.

Informed Consent Statement

Not applicable.

Data Availability Statement

MERRA-2 aerosol optical property data used in this study is from https://goldsmr4.gesdisc.eosdis.nasa.gov/data/MERRA2_MONTHLY/M2TMNXAER.5.12.4/2020/, accessed on 19 January 2022.

Acknowledgments

We thank NASA for making the MERRA-2 aerosol reanalysis publicly accessible. Thanks are also extended to the anonymous reviewers for their useful comments and suggestions.

Conflicts of Interest

The authors declare no conflict of interest.

References

  1. Filip, L.; Stefan, S. Study of the correlation between the near-ground PM10 mass concentration and the aerosol optical depth. J. Atmos. Sol. Terr. Phys. 2011, 73, 1883–1889. [Google Scholar] [CrossRef]
  2. Charlson, R.J.; Schwartz, S.E.; Hales, J.M.; Cess, R.D.; Coakley, J.A.; Hansen, J.E.; Hofmann, D.J. Climate forcing by anthropogenic aerosols. Science 1992, 255, 423–430. [Google Scholar] [CrossRef] [PubMed]
  3. Deng, X.; Shi, C.; Wu, B.; Chen, Z.; Nie, S.; He, D.; Zhang, H. Analysis of aerosol characteristics and their relationships with meteorological parameters over Anhui province in China. Atmos. Res. 2012, 109–110, 52–63. [Google Scholar] [CrossRef]
  4. Zhao, H.; Che, H.; Zhang, X.; Ma, Y.; Wang, Y.; Wang, X.; Liu, C.; Hou, B.; Che, H. Aerosol optical properties over urban and industrial region of Northeast China by using ground-based sun-photometer measurement. Atmos. Environ. 2013, 75, 270–278. [Google Scholar] [CrossRef]
  5. Liu, X.; Chen, Q.; Che, H.; Zhang, R.; Gui, K.; Zhang, H.; Zhao, T. Spatial distribution and temporal variation of aerosol optical depth in the Sichuan basin, China, the recent ten years. Atmos. Environ. 2016, 147, 434–445. [Google Scholar] [CrossRef]
  6. Gopal, K.; Reddy, K.; Balakrishnaiah, G.; Arafath, S.; Reddy, N.; Rao, T.; Reddy, T.; Reddy, R. Regional trends of aerosol optical depth and their impact on cloud properties over southern India using MODIS data. J. Atmos. Sol. Terr. Phys. 2016, 146, 38–48. [Google Scholar] [CrossRef]
  7. Gui, K.; Che, H.; Wang, Y.; Wang, H.; Zhang, L.; Zhao, H.; Zheng, Y.; Sun, T.; Zhang, X. Satellite-derived PM2.5 concentration trends over Eastern China from 1998 to 2016: Relationships to emissions and meteorological parameters. Environ. Pollut. 2019, 247, 1125–1133. [Google Scholar] [CrossRef]
  8. Jin, Q.; Crippa, P.; Pryor, S. Spatial characteristics and temporal evolution of the relationship between PM2.5 and aerosol optical depth over the eastern USA during 2003–2017. Atmos. Environ. 2020, 239, 117718. [Google Scholar] [CrossRef]
  9. Yao, W.; Che, H.; Gui, K.; Wang, Y.; Zhang, X. Can MERRA-2 Reanalysis Data Reproduce the Three-Dimensional Evolution Characteristics of a Typical Dust Process in East Asia? A Case Study of the Dust Event in May 2017. Remote Sens. 2020, 12, 902. [Google Scholar] [CrossRef] [Green Version]
  10. Yousefi, R.; Wang, F.; Ge, Q.; Lelieveld, J.; Shaheen, A. Aerosol Trends during the Dusty Season over Iran. Remote Sens. 2021, 13, 1045. [Google Scholar] [CrossRef]
  11. Jin, Y.; Hao, Z.; Chen, J.; He, D.; Tian, Q.; Mao, Z.; Pan, D. Retrieval of Urban Aerosol Optical Depth from Landsat 8 OLI in Nanjing, China. Remote Sens. 2021, 13, 415. [Google Scholar] [CrossRef]
  12. Chaubey, J.; Moorthy, K.; Babu, S.; Gogoi, M. Spatio-temporal variations in aerosol properties over the oceanic regions between coastal India and Antarctica. J. Atmos. Sol. Terr. Phys. 2013, 104, 18–28. [Google Scholar] [CrossRef]
  13. Grandey, B.; Stier, P.; Wagner, T. Investigating relationships between aerosol optical depth and cloud fraction using satellite, aerosol reanalysis and general circulation model data. Atmos. Chem. Phys. 2013, 13, 3177–3184. [Google Scholar] [CrossRef] [Green Version]
  14. Che, H.; Zhang, X.; Xia, X.; Goloub, P.; Holben, B.; Zhao, H.; Wang, Y.; Zhang, X.; Wang, H.; Blarel, L.; et al. Ground-based aerosol climatology of China: Aerosol optical depths from the China Aerosol Remote Sensing Network (CARSNET) 2002–2013. Atmos. Chem. Phys. 2015, 15, 7619–7652. [Google Scholar] [CrossRef] [Green Version]
  15. He, Q.; Zhang, M.; Huang, B.; Tong, X. MODIS 3 km and 10 km aerosol optical depth for China: Evaluation and comparison. Atmos. Environ. 2017, 153, 150–162. [Google Scholar] [CrossRef]
  16. Zhang, M.; Wang, Y.; Ma, Y.; Wang, L.; Gong, W.; Liu, B. Spatial distribution and temporal variation of aerosol optical depth and radiative effect in South China and its adjacent area. Atmos. Environ. 2018, 188, 120–128. [Google Scholar] [CrossRef]
  17. Ali, G.; Bao, Y.; Boiyo, R.; Tang, W.; Lu, Q.; Min, J. Evaluating MODIS and MISR Aerosol Optical Depth Retrievals over Environmentally Distinct Sites in Pakistan. J. Atmos. Sol. Terr. Phys. 2019, 183, 19–35. [Google Scholar] [CrossRef]
  18. Liu, D.; Zhao, T.; Boiyo, R.; Chen, S.; Lu, Z.; Wu, Y.; Zhao, Y. Vertical Structures of Dust Aerosols over East Asia Based on CALIPSO Retrievals. Remote Sens. 2019, 11, 701. [Google Scholar] [CrossRef] [Green Version]
  19. Yang, Q.; Yuan, Q.; Yue, L.; Li, T.; Shen, H.; Zhang, L. The relationships between PM2.5 and aerosol optical depth (AOD) in mainland China: About and behind the spatio-temporal variations. Environ. Pollut. 2019, 248, 526–535. [Google Scholar] [CrossRef]
  20. Luo, H.; Han, Y.; Lu, C.; Yang, J.; Wu, Y. Characteristics of Surface Solar Radiation under Different Air Pollution Conditions over Nanjing, China: Observation and Simulation. Adv. Atmos. Sci. 2019, 36, 1047–1059. [Google Scholar] [CrossRef]
  21. Gupta, P.; Remer, L.; Patadia, F.; Levy, R.; Christopher, S. High-Resolution Gridded Level 3 Aerosol Optical Depth Data from MODIS. Remote Sens. 2020, 12, 2847. [Google Scholar] [CrossRef]
  22. Liu, Q.; Cheng, N.; He, Q.; Chen, Y.; Liu, T.; Liu, X.; Zhang, H.; Li, J.; Zhan, Q. Meteorological conditions and their effects on the relationship between aerosol optical depth and macro-physical properties of warm clouds over Shanghai based on MODIS. Atmos. Pollut. Res. 2020, 11, 1637–1644. [Google Scholar] [CrossRef]
  23. Bali, K.; Dey, S.; Ganguly, D. Diurnal patterns in ambient PM2.5 exposure over India using MERRA-2 reanalysis data. Atmos. Environ. 2021, 248, 118180. [Google Scholar] [CrossRef]
  24. Luo, H.; Han, Y.; Cheng, X.; Lu, C.; Wu, Y. Spatiotemporal Variations in Particulate Matter and Air Quality over China: National, Regional and Urban Scales. Atmosphere 2021, 12, 43. [Google Scholar] [CrossRef]
  25. Huang, J.; Arnott, W.; Barnard, J.; Holmes, H. Theoretical Uncertainty Analysis of Satellite Retrieved Aerosol Optical Depth Associated with Surface Albedo and Aerosol Optical Properties. Remote Sens. 2021, 13, 344. [Google Scholar] [CrossRef]
  26. Zhao, B.; Jiang, J.; Diner, D.; Su, H.; Gu, Y.; Liou, K.; Jiang, Z.; Huang, L.; Takano, Y.; Fan, X.; et al. Intra-annual variations of regional aerosol optical depth, vertical distribution, and particle types from multiple satellite and ground-based observational datasets. Atmos. Chem. Phys. 2018, 18, 11247–11260. [Google Scholar] [CrossRef] [Green Version]
  27. Li, J.; Carlson, B.; Dubovik, O.; Lacis, A. Recent trends in aerosol optical properties derived from AERONET measurements. Atmos. Chem. Phys. 2014, 14, 12271–12289. [Google Scholar] [CrossRef] [Green Version]
  28. Almazroui, M. A comparison study between AOD data from MODIS deep blue collections 51 and 06 and from AERONET over Saudi Arabia. Atmos. Environ. 2019, 225, 88–95. [Google Scholar] [CrossRef]
  29. McPhetres, A.; Aggarwal, S. An Evaluation of MODIS-Retrieved Aerosol Optical Depth over AERONET Sites in Alaska. Remote Sens. 2018, 10, 1384. [Google Scholar] [CrossRef] [Green Version]
  30. Fan, A.; Chen, W.; Liang, L.; Sun, W.; Lin, Y.; Che, H.; Zhao, X. Evaluation and Comparison of Long-Term MODISC5.1 and C6 Products against AERONET Observations over China. Remote Sens. 2017, 9, 1269. [Google Scholar] [CrossRef] [Green Version]
  31. Merino, C.; Mateos, D.; Toledano, C.; Prospero, J.; Molinie, J.; Clotilde, L.; Gonzalez, R.; Cachorro, V.E.; Calle, A.; de Frutos, A.M. Impact of long-range transport over the Atlantic Ocean on Saharan dust optical and microphysical properties based on AERONET data. Atmos. Chem. Phys. 2018, 18, 9411–9424. [Google Scholar] [CrossRef] [Green Version]
  32. Xie, Y.; Zhang, Y.; Xiong, X.; Qu, J.J.; Che, H. Validation of MODIS aerosol optical depth product over China using CARSNET measurements. Atmos. Environ. 2011, 45, 5970–5978. [Google Scholar] [CrossRef]
  33. Gui, K.; Che, H.; Chen, Q.; Yu, J.; Zheng, Y.; Lu, S.; Wang, H.; Wang, Y.; Zhang, X.; Shi, G. Analysis of the Error in Retrievals of Aerosol Optical Properties from Sun photometer Measurements of CARSNET Due to a Variety of Objective Factors. Atmosphere 2016, 7, 9. [Google Scholar] [CrossRef] [Green Version]
  34. Che, H.; Zhao, H.; Wu, Y.; Xia, X.; Zhu, J.; Dubovik, O.; Estelles, V.; Ma, Y.; Wang, Y.; Wang, H.; et al. Application of aerosol optical properties to estimate aerosol type from ground-based remote sensing observation at urban area of northeastern China. J. Atmos. Sol. Terr. Phys. 2015, 132, 37–47. [Google Scholar] [CrossRef]
  35. Che, H.; Yang, L.; Liu, C.; Xia, X.; Wang, Y.; Wang, H.; Wang, H.; Lu, X.; Zhang, X. Long-term validation of MODIS C6 and C6.1 Dark Target aerosol products over China using CARSNET and AERONET. Chemosphere 2019, 236, 124268. [Google Scholar] [CrossRef]
  36. Nakajima, T.; Uno, I.; Higurashi, A.; Sohn, B.J.; Oh, S.; Ohta, S.; Takamura, T.; Sekiguchi, M.; Takemura, T.; Kim, H.; et al. Significance of direct and indirect radiative forcings of aerosols in the East China Sea region. J. Geophys. Res. 2003, 108, 8658. [Google Scholar] [CrossRef]
  37. Yu, X.; Zhu, B.; Zhang, M. Seasonal variability of aerosol optical properties over Beijing. Atmos. Environ. 2009, 43, 4095–4101. [Google Scholar] [CrossRef]
  38. Kang, N.; Kumar, K.; Yu, X.; Yin, Y. Column-integrated aerosol optical properties and direct radiative forcing over the urban-industrial megacity Nanjing in the Yangtze River Delta, China. Environ. Sci. Pollut. Res. 2016, 23, 17532–17552. [Google Scholar] [CrossRef]
  39. Che, H.; Qi, B.; Zhao, H.; Xia, X.; Eck, T.F.; Goloub, P.; Dubovik, O.; Estelles, V.; Cuevas-Agulló, E.; Blarel, L.; et al. Aerosol optical properties and direct radiative forcing based on measurements from the China Aerosol Remote Sensing Network (CARSNET) in eastern China. Atmos. Chem. Phys. 2018, 18, 405–425. [Google Scholar] [CrossRef] [Green Version]
  40. Pani, S.; Wang, S.; Lin, N.; Tsay, S.; Lolli, S.; Chuang, M.; Lee, C.; Chantara, S.; Yu, J. Assessment of aerosol optical property and radiative effect for the layer decoupling cases over the northern South China Sea during the7-SEAS/Dongsha Experiment. J. Geophys. Res. Atmos. 2016, 121, 4894–4906. [Google Scholar] [CrossRef]
  41. Xiao, H.; Xiao, H.; Luo, L.; Shen, C.; Long, A.; Chen, L.; Long, Z.; Li, D. Atmospheric aerosol compositions over the South China Sea: Temporal variability and source apportionment. Atmos. Chem. Phys. 2017, 17, 3199–3214. [Google Scholar] [CrossRef] [Green Version]
  42. Sun, Q.; Tang, D.; Levy, G.; Shi, P. Variability of aerosol optical thickness in the tropical Indian Ocean and South China Sea during spring inter monsoon season. Int. J. Remote Sens. 2018, 39, 4531–4549. [Google Scholar] [CrossRef]
  43. Zhang, C.; Xu, H.; Li, Z.; Xie, Y.; Li, D. Maritime Aerosol Optical and Microphysical Properties in the South China Sea Under Multi-source Infuence. Sci. Rep. 2019, 9, 17796. [Google Scholar] [CrossRef]
  44. Li, Y.; Wang, B.; Lee, S.; Zhang, Z.; Wang, Y.; Dong, W. Micro-Pulse Lidar Cruising Measurements in Northern South China Sea. Remote Sens. 2020, 12, 1695. [Google Scholar] [CrossRef]
  45. Randles, C.; Silva, A.; Buchard, V.; Colarco, P.; Darmenov, A.; Govindaraju, R.; Smirnov, A.; Ferrare, R.; Hair, J.; Shinozuka, Y.; et al. The MERRA-2 Aerosol Reanalysis, 1980-onward, Part I: System Description and Data Assimilation Evaluation. J. Clim. 2017, 30, 6823–6850. [Google Scholar] [CrossRef] [PubMed]
  46. He, L.; Wang, L.; Huang, B.; Wei, J.; Zhou, Z.; Zhong, Y. Anthropogenic and meteorological drivers of 1980–2016 trend in aerosol optical and radiative properties over the Yangtze River Basin. Atmos. Environ. 2020, 223, 117188. [Google Scholar] [CrossRef]
  47. Qin, W.; Liu, Y.; Wang, L.; Lin, A.; Xia, X.; Che, H.; Bilal, M.; Zhang, M. Characteristic and Driving Factors of Aerosol Optical Depth over Mainland China during 1980–2017. Remote Sens. 2018, 10, 1064. [Google Scholar] [CrossRef] [Green Version]
  48. Hirono, M.; Shibata, T. Enormous increase of stratospheric aerosols over Fukuoka due to volcanic eruption of El Chichon in 1982. Geophys. Res. Lett. 1983, 10, 152–154. [Google Scholar] [CrossRef]
  49. Tupper, A.; Oswalt, J.S.; Rosenfeld, D. Satellite and radar analysis of the volcanic-cumulonimbi at Mount Pinatubo, Philippines, 1991. J. Geophys. Res. 2005, 110, D09204. [Google Scholar] [CrossRef]
  50. Prijith, S.; Rao, P.; Mohan, M.; Sai, M.; Ramana, M. Trends of absorption, scattering and total aerosol optical depths over India and surrounding oceanic regions from satellite observations: Role of local production, transport and atmospheric dynamics. Environ. Sci. Pollut. Res. 2018, 25, 18147–18160. [Google Scholar] [CrossRef]
  51. He, Q.; Zhang, M.; Huang, B. Spatio-temporal variation and impact factors analysis of satellite-based aerosol optical depth over China from 2002 to 2015. Atmos. Environ. 2016, 129, 79–90. [Google Scholar] [CrossRef]
  52. Hsu, N.; Gautam, R.; Sayer, A.; Bettenhausen, C.; Li, C.; Jeong, M.; Tsay, S.; Holben, B. Global and regional trends of aerosol optical depth over land and ocean using SeaWiFS measurements from 1997 to 2010. Atmos. Chem. Phys. 2012, 12, 8037–8053. [Google Scholar] [CrossRef] [Green Version]
Figure 1. Map of the South China Sea (SCS). The black boxes represent the three selected regions of interest: the northern part of the South China Sea (NSCS), the middle part of the South China Sea (MSCS), and the southern part of the South China Sea (SSCS).
Atmosphere 13 00372 g001
Figure 2. Spatial distribution of mean values of the 550 nm MERRA-2 AOD over the SCS in the period of 1980–2020.
Atmosphere 13 00372 g002
Figure 3. Variation of MERRA-2 AOD in 5-year intervals in the period of 1980–2020.
Atmosphere 13 00372 g003
Figure 4. Spatial distribution of mean MERRA-2 AOD in each month in the period of 1980–2020.
Atmosphere 13 00372 g004
Figure 5. Spatial distribution of mean values of (a) scattering aerosol optical depth (SAOD) and (b) absorption aerosol optical depth (AAOD) over the SCS in the period of 1980–2020.
Atmosphere 13 00372 g005
Figure 6. Spatial distribution of mean MERRA-2 values of (a) SO4AOD, (b) BCAOD, (c) OCAOD, (d) DUAOD, and (e) SSAOD over the SCS during the period of 1980–2020.
Atmosphere 13 00372 g006
Figure 7. Spatial distribution of (a) SO4AOD Percent, (b) BCAOD Percent, (c) OCAOD Percent, (d) DUAOD Percent, and (e) SSAOD Percent over the SCS during the period of 1980–2020.
Atmosphere 13 00372 g007
Figure 8. Variation of annual mean values of TAOD, BCAOD, OCAOD, DUAOD, SO4AOD, and SSAOD over (a) NSCS, (b) MSCS, and (c) SSCS during the period of 1980–2020.
Atmosphere 13 00372 g008
Figure 9. Variation trend of MERRA−2 AOD over the SCS during the period (a) 1980−2007 and (b) 2008−2020 (the small black dot represents p < 0.05).
Atmosphere 13 00372 g009
Publisher’s Note: MDPI stays neutral with regard to jurisdictional claims in published maps and institutional affiliations.

