1. Introduction
With the rapid development of the economy in China over the last 40 years, environmental problems caused by the massive consumption of energy have occurred [
1,
2]. Among these issues, the problem of atmospheric compound pollution characterized by particulate matter (PM) has attracted much attention from the government and public [
3,
4,
5]. To alleviate air pollution problems, the government has adopted a series of air pollution prevention and control policies [
6], including formulating ultralow emission standards for coal-fired power plants, reducing outdated production capacity, strengthening industrial emission standards, phasing out small-scale high-emission factories, installing volatile organic compound (VOC) emission control facilities, eliminating small coal-fired industrial boilers, applying electricity and natural gas to replace domestic coal burning, raising motor vehicle emission standards, and discontinuing old motor vehicles. With the continuous implementation of these measures, the air pollutants emitted by power plants, industrial sources, and road mobile sources have plummeted. However, the emissions of non-road mobile machinery have increasingly become prominent.
The “Technical Guidelines for the Compilation of Non-road Mobile Source Emission Inventories” defined non-road mobile machinery as mainly construction and agricultural machinery [
7]. In recent years, with the continuous acceleration of the agricultural mechanization process in China, the total diesel power of agricultural machinery increased from 867 million kW in 2014 to 797 million kW in 2019. The China Mobile Source Environmental Management Annual Report (2021) demonstrated that non-road mobile sources had similar PM and NOx emissions to motor vehicles [
8]. The impact of emissions originating from non-road mobile sources on the air quality cannot be ignored. Non-road mobile sources emit 163,000 tons of sulfur dioxide (SO
2), 425,000 tons of hydrocarbons (HCs), 4,782,000 tons of NO
x, and 237,000 tons of PM. The NO
x and PM emissions of non-road mobile machinery account for approximately 70% of the emissions of non-road mobile sources; among these emissions, the PM emissions of agricultural machinery account for 34.9% of the total emissions of non-road mobile sources, which verifies that agricultural machinery has become one of the main pollution sources of PM and NO
x.
Therefore, non-road mobile machinery emission characteristic analysis, pollutant concentration contribution analysis, etc., are urgently needed to provide scientific advice for the next step in the formulation of non-road machinery emission control measures.
At present, scholars have performed research work on the emissions of non-road mobile machinery. Lang et al. applied emission factor methods based on the fuel consumption to estimate the emissions of agricultural machinery in China [
9]. Desouza et al. studied non-road mobile machinery emissions in London [
10]. Guo et al. calculated pollutant emissions originating from agricultural and construction machinery in Beijing–Tianjin–Hebei based on the fuel consumption [
11]. Zheng et al. established emissions stemming from construction machinery in Tianjin [
12]. Hou et al. determined emissions of typical agricultural machinery in Beijing [
13], and scholars have compiled emission inventories for non-road mobile machinery in Guangdong Province with the emission factor method based on the production power [
14,
15]. Li and Wang et al., established 2012 and 2013 Chinese non-road mobile source emission inventories, respectively, covering emissions of non-road mobile machinery [
16,
17], while non-road mobile source emission inventories for Chengdu, Mianyang, Northeast China, and Tianjin, including emissions originating from non-road mobile machinery, were also established [
18,
19,
20]. Due to the limitation of data acquisition, many of the abovementioned studies relied on a relatively approximate fuel consumption-based method to estimate the emissions of non-road mobile machinery while ignoring differences in the holdings, working hours and production power levels between different types of machinery.
In addition, a series of non-road mobile source emission calculation models has been developed. These models can be employed to calculate the pollutant emissions of different non-road mobile machinery, such as the Non-road Engine Emissions Model (NONROAD) recommended by the U.S. Environmental Protection Agency [
21], the California Air Resources Board recommended OFFROAD model [
22], and the European Monitoring and Evaluation Programme (EMEP)/Core Inventory of Air Emissions (CORINAIR) model recommended by the European Environmental Protection Agency [
23]. Lewis et al. estimated the HC, CO, PM, and NO
x emissions of non-road vehicles based on existing data of the NONROAD model published by the U.S. Environmental Protection Agency and data collected with an on-board emission test system [
24].
To control the pollutant emission of non-road mobile machinery and further improve the air quality, the United States, European Union and Japan have all formulated non-road machinery emission regulations. In 1998, the United States formally promulgated first-phase (Tier 1) emission standards for non-road machinery, which clearly stipulated the emission limits of CO, HC, NO
x and PM. Subsequently, more stringent regulations were issued from 2000–2008, i.e., second-stage (Tier 2) and third-stage (Tier 3) emission standards. After 2008, fourth-stage (Tier 4) emission standards were promulgated to further reduce the emission limits of NO
x and PM and sulfur content in diesel [
25,
26]. The EU’s first non-road machinery emission regulation was passed in the form of legislation in 1998. This regulation was divided into two stages according to non-road machinery engines. Subsequently, the EU formulated third- and fourth-phase emission standards and stipulated that the third phase should be implemented from 2006–2013 and the fourth phase should be implemented after 2014 [
27,
28]. Japan implemented non-road machinery emission regulations in 2006 and subsequently introduced corresponding emission limits four times from 2006–2008 based on the output power [
29]. In 2007, China issued the “Emission Limits and Measurement Methods for Diesel Engine Exhaust Pollutants for Non-road Mobile Machinery (China Phase I and Phase II)” and implemented this standard in the same year [
30]. The first phase of emission standards stipulated different ratings of the CO, HC, NO
x and PM emission limits under power, while the second phase supplemented PM emission limits within the range from 0–18 kW. Subsequently, the Emission Limits and Measurement Methods for Exhaust Pollutants of Non-road Mobile Machinery with Diesel Engines (China Phase III and IV) was released and implemented in 2014 [
31]. These third- and fourth-phase emission standards enhanced the control requirements for non-road mobile machinery above 560 kW. The Emission Control Technical Requirements for Non-road Diesel Mobile Machinery was released in 2020 and is a supplement to the China Phase IV standards, further tightening the emission limits of various pollutants [
8,
32]. The standards at each stage clearly stipulated the CO, HC, NO
x and PM emission limits for non-road mobile machinery under different power distributions. In September 2018, China promulgated and implemented the Limits and Measurement Methods for Exhaust Smoke from Non-road Mobile Machinery Equipped with a Diesel Engine [
33], which provided a legal basis for regulatory authorities to strengthen the supervision of non-road mobile machinery emissions.
To satisfy the fourth-stage emission limit requirements, non-road machinery emission control technology can be divided into two categories: reduction in the original engine emissions and aftertreatment technology [
34,
35]. Reducing the original engine emissions refers to the reduction in NO
x and PM emissions through diesel optimization design, advanced fuel injection, exhaust gas recirculation (EGR), and the use of high-quality fuel oil and other in-engine exhaust purification technologies [
36]. Currently, the commonly adopted non-road mechanical diesel engine exhaust gas aftertreatment technologies include diesel oxidation catalyst (DOC), diesel particulate filter (DPF), selective catalytic reduction (SCR) and other aftertreatment control technologies to reduce PM and NO
x in exhaust gas at the fourth stage [
32,
37].
With the continuous tightening of non-road machinery emission regulations, it is difficult to achieve the above emission standards by employing a certain aftertreatment technology alone. Therefore, a reasonable combination of aftertreatment technologies is the current mainstream approach. DOC+DPF imposes a significant effect on NO
x and PM reduction [
38]. Zhang et al. installed DOC and particle oxidation catalytic converter (POC) devices in non-road diesel engines to satisfy China IV emission standards, and the PM value was greatly reduced, as determined in experimental research [
39]. Guan et al. compared smoke and gaseous pollutant (NO
x, HC, and CO) data before and after the installation of DOC+POC technology and found that the PM and smoke emissions of non-road diesel engines after DOC+POC device installation could be reduced by 34~69% and 37~68%, respectively, and DOC+POC aftertreatment device installation fully satisfied the fourth-stage emission standards for non-road machinery within the 19~56 kW power range [
40].
At present, most particulate filters installed in the non-road machinery are transplanted from traditional automotive particulate filters, and the material and installation costs are relatively high for non-road machinery, especially the agricultural machinery. Traditional automotive DPF exhibit a large filtering area and great pressure drop, which are unsuitable for non-road machinery with a low horsepower level. Currently, particulate filters that are especially designed for non-road machinery are really rare.
Aiming at the emission problem of non-road machinery, an optimized muffler with particle filtration was specifically designed for the single-cylinder diesel engine R180 of non-road machinery. Stainless steel fibers were employed as the filtration medium due to their low cost and easy access, which are suitable for small diesel engine, and the performance was experimentally verified. Moreover, noise reduction design was conducted. Finally, the filtrating and muffling function of the optimized muffler were verified through experiments and simulations.
2. Materials and Methods
In this section, an experimental bench of the R180 diesel engine is established, the exhaust temperature, fuel consumption rate, and HC, CO, NOx and CO2 volume fractions in the exhaust under different working conditions are measured to verify the influence of the stainless steel fiber PM filter on the working performance, and the extinction coefficient of the exhaust is measured to verify the filtration performance. Then, based on the filtration effect of stainless steel fibers on PM emissions, the original muffler in the R180 diesel engine is structurally improved, and an integrated PM filtration and noise elimination device is designed that can be quickly disassembled, which increases the device compactness while enhancing the noise reduction and filtration effects.
2.1. Setup for the Validation of the Filtration Performance of Stainless Steel Fiber
Schematic diagrams of the test bench are shown in
Figure 1 and
Figure 2. The bench comprises a dynamometer, diesel engine, particulate filter, electronic balance, temperature measuring instrument, gas analyzer and smoke meter. The diesel engine (Changchai R180, Changchai Co., Ltd., Changzhou, China shown in
Table 1) is connected to the dynamometer. The dynamometer (CW50, CAMA Electromechanic Co., Ltd., Luoyang, China) is employed to measure the speed and torque of the diesel engine under different operating conditions. The electronic balance (LT500B, Tianliang Instrument Co., Ltd., Changshu, China) is employed to measure the fuel consumption. The gas analyzer (FGA-4100, Foshan Analytical Instrument Co., Ltd., Foshan, China) measures the HC, CO, NO, and CO
2 volume percentages in the exhaust gas. The temperature measuring instrument applies a K-type thermocouple to measure the exhaust temperature, and a stainless steel fiber particle filter is implemented to collect PM. The smoke meter (AVL DiSmoke 4000, AVL List GmbH, Graz, Austria) is employed to detect the PM content.
Table 2 lists the eight settings of the diesel engine at different speeds in the experiment.
In the experiment, stainless steel fibers were applied as the filter medium, and the cross section of the selected stainless steel fibers was 0.45 mm × 3.56 mm. The volume was 30 mL, as measured by a syringe with a diameter of 36 mm under a pressure of 0.5 MPa, the weight was 19.5 g, the density of the stainless steel fiber reached 7.8 g/cm
3, and the porosity was calculated as 91.7%. To ensure the filtration efficiency, in the stainless steel fiber particulate filter, four stainless steel fiber balls were connected in series with iron wires, the series-connected stainless steel fiber balls were contained in a thin-walled aluminum tube, and the stainless steel fiber balls were tightened with iron wires. The stainless steel fiber balls were compressed to the minimum porosity under the tightening force of the iron wires, and the minimum porosity could be maintained to ensure the filtration efficiency. Moreover, the setup could be modularized to facilitate rapid disassembly of the stainless steel fiber particulate filter, as shown in
Figure 3.
2.2. Experimental Results of the Stainless Steel Fiber Filter
Variations in the diesel engine exhaust temperature at the different speeds and loads are shown in
Figure 4. The figure reveals the following:
(1) The exhaust gas temperatures before and after the stainless steel fiber particulate filter installed under a low load do not greatly differ, however a change is observed before and after the installation of the stainless steel fiber particulate filter under a 75% load at a high speed;
(2) When the speed remains constant, the exhaust temperature changes with the load. However, the temperature change is not obvious with the low-load range. The fuel consumption increases at high speeds and heavy loads, and the exhaust temperature is high. Incompletely burned fuel continues to burn in the exhaust pipe, resulting in a further increase in the exhaust temperature.
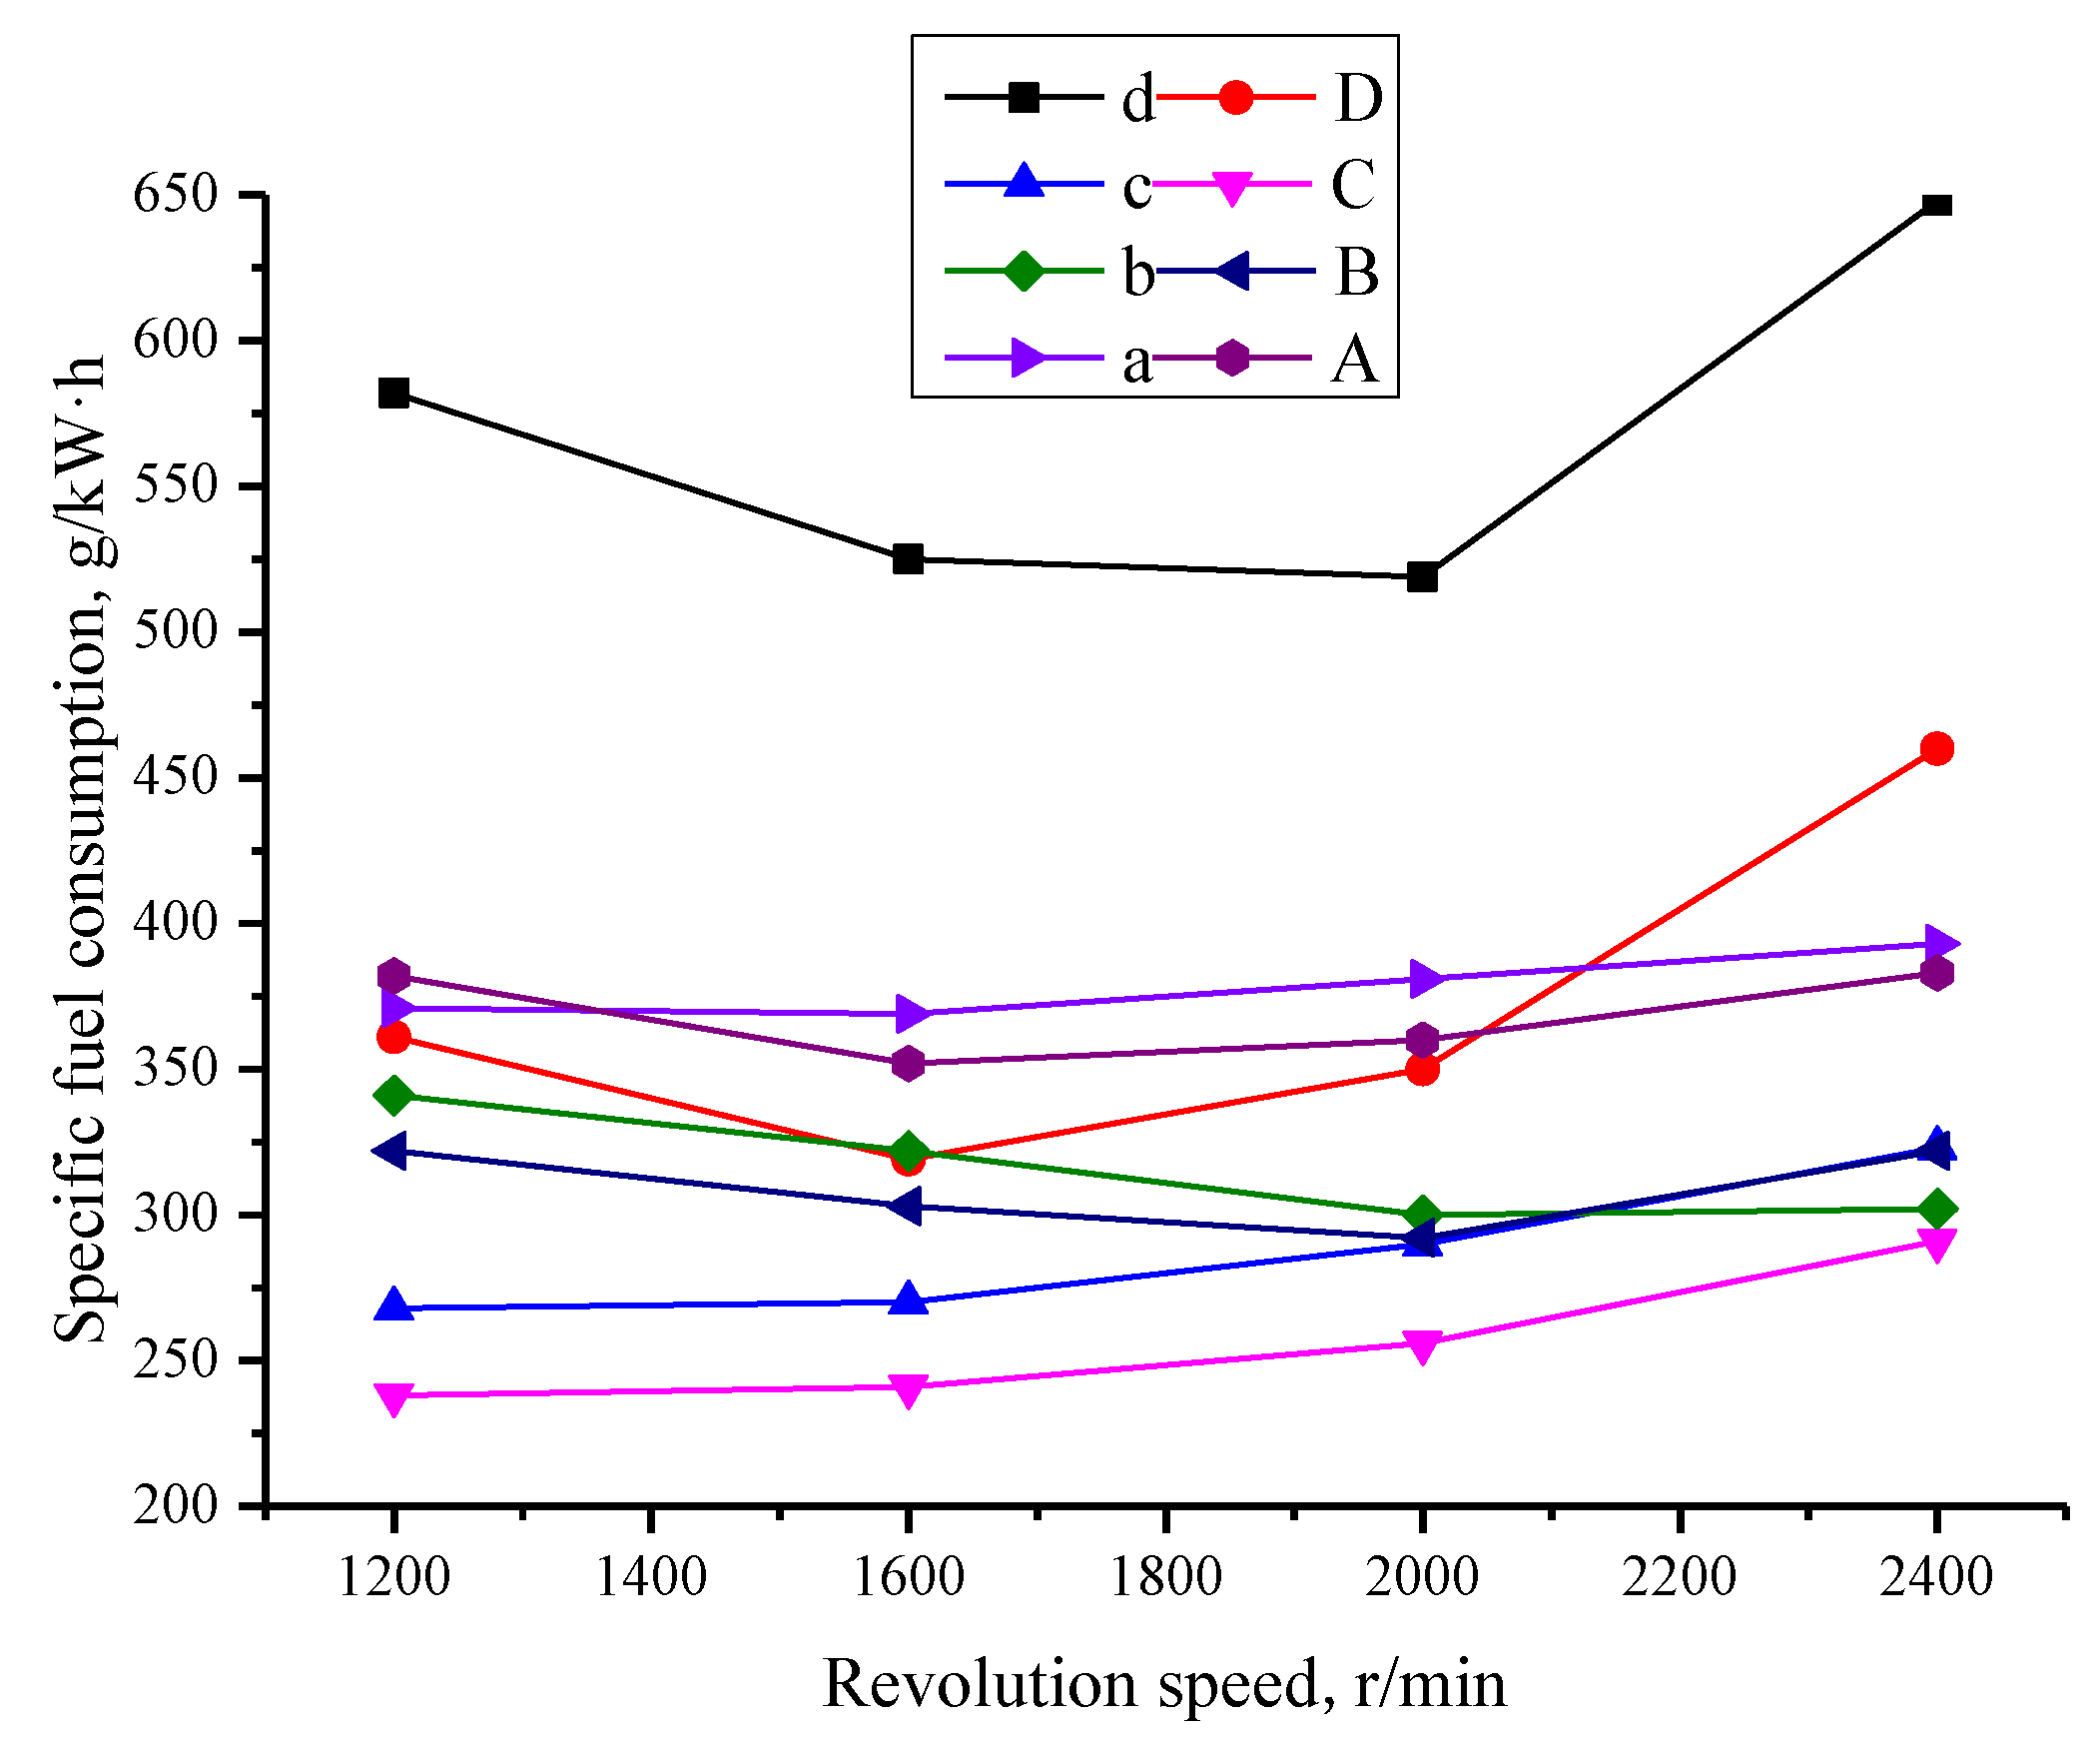
Figure 5 shows the changes in the diesel engine fuel consumption rate at the different speeds and loads. The fuel consumption rate of the diesel engine under a high load changes substantially after the installation of the stainless steel fiber particulate filter. After filter installation, the exhaust pressure increases, resulting in a decrease in the engine performance. The highest fuel consumption rates are found under 25% and 100% loads and should be avoided during actual operation. The diesel engine attains the lowest fuel consumption rate under a 75% load, which indicates an economically feasible consumption rate. The fuel consumption rate after filter installation is approximately 10% higher. Under low-load conditions, although the fuel consumption is relatively high, the generated PM amount is small, and the exhaust flow rate is low. Hence, the exhaust resistance does not change much. Therefore, the fuel consumption rate does not change notably after installation of the stainless steel fiber particulate filter.
Figure 6 shows the change in HC content at different speeds and loads. When the filter is installed, the HC content in the exhaust gas increases. This occurs as filter installation increases both the back pressure and fuel consumption rate, which in turn leads to an increase in the HC content in the exhaust gas.
The figure shows that under loads of 25%, 50%, and 75%, the HC content decreases with increasing speed, the HC content increases with increasing load, and the HC content is very high under full-load conditions. After filter installation, under the 100% load, the HC content exhibits a large difference except at 1600 r/min. This occurs as the fuel consumption rate significantly increases after filter installation, however the power does not change, and more fuel is thus incompletely burned. These incomplete combustion products crack in the high-temperature exhaust pipe and produce more HC compounds. In the same manner, the HC content difference at 2400 r/min under the 50% load can be explained.
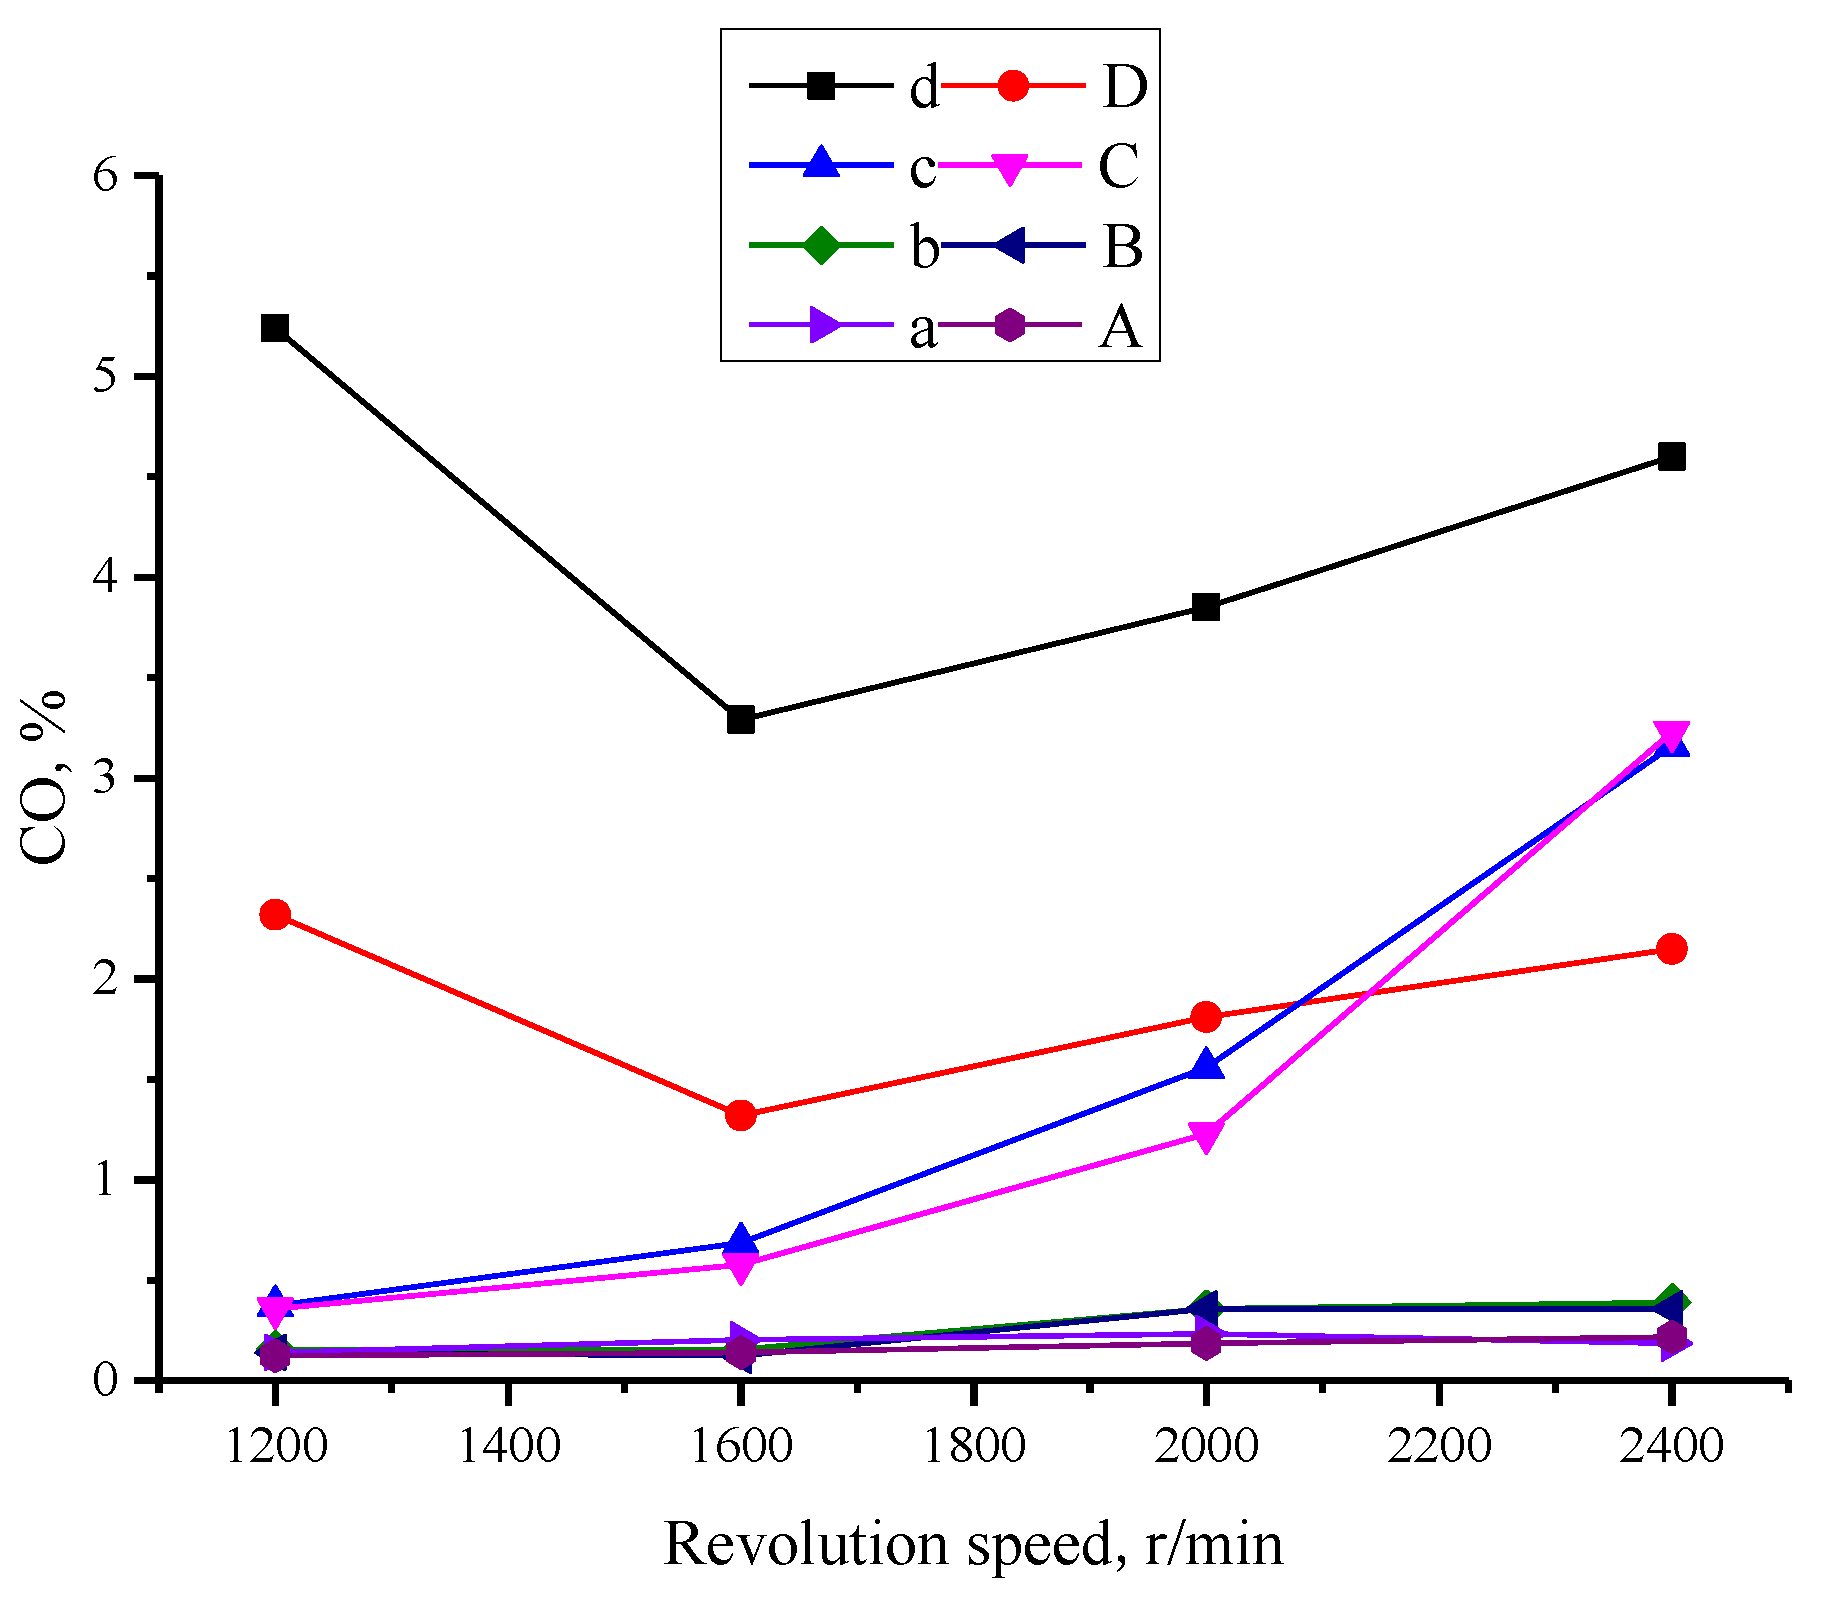
Figure 7 shows the change in CO content in exhaust gas with speed and load.
Under medium and low loads, the CO content is extremely low. With increasing speed or load, the CO content also increases. Under the 100% load conditions, the CO content considerably changes after filter installation. This occurs as the fuel consumption rate notably increases after installation, and more incomplete combustion products react with oxides (NOx, O2, etc.) in the high-temperature exhaust pipe, which produces more CO. The CO content decreases at 1600 r/min, which is related to the low fuel consumption under this load. Hence, the CO content in the emissions is also reduced. Compared to the other low-load conditions, the 75% load yields a considerable increase in the CO content. The CO content under the 75% load and lower does not differ much after filter installation. This occurs as under the 75% operating conditions, less PM is generated, imposing little effect on the back pressure of the diesel engine, thus ensuring that the engine operating parameters do not greatly vary.
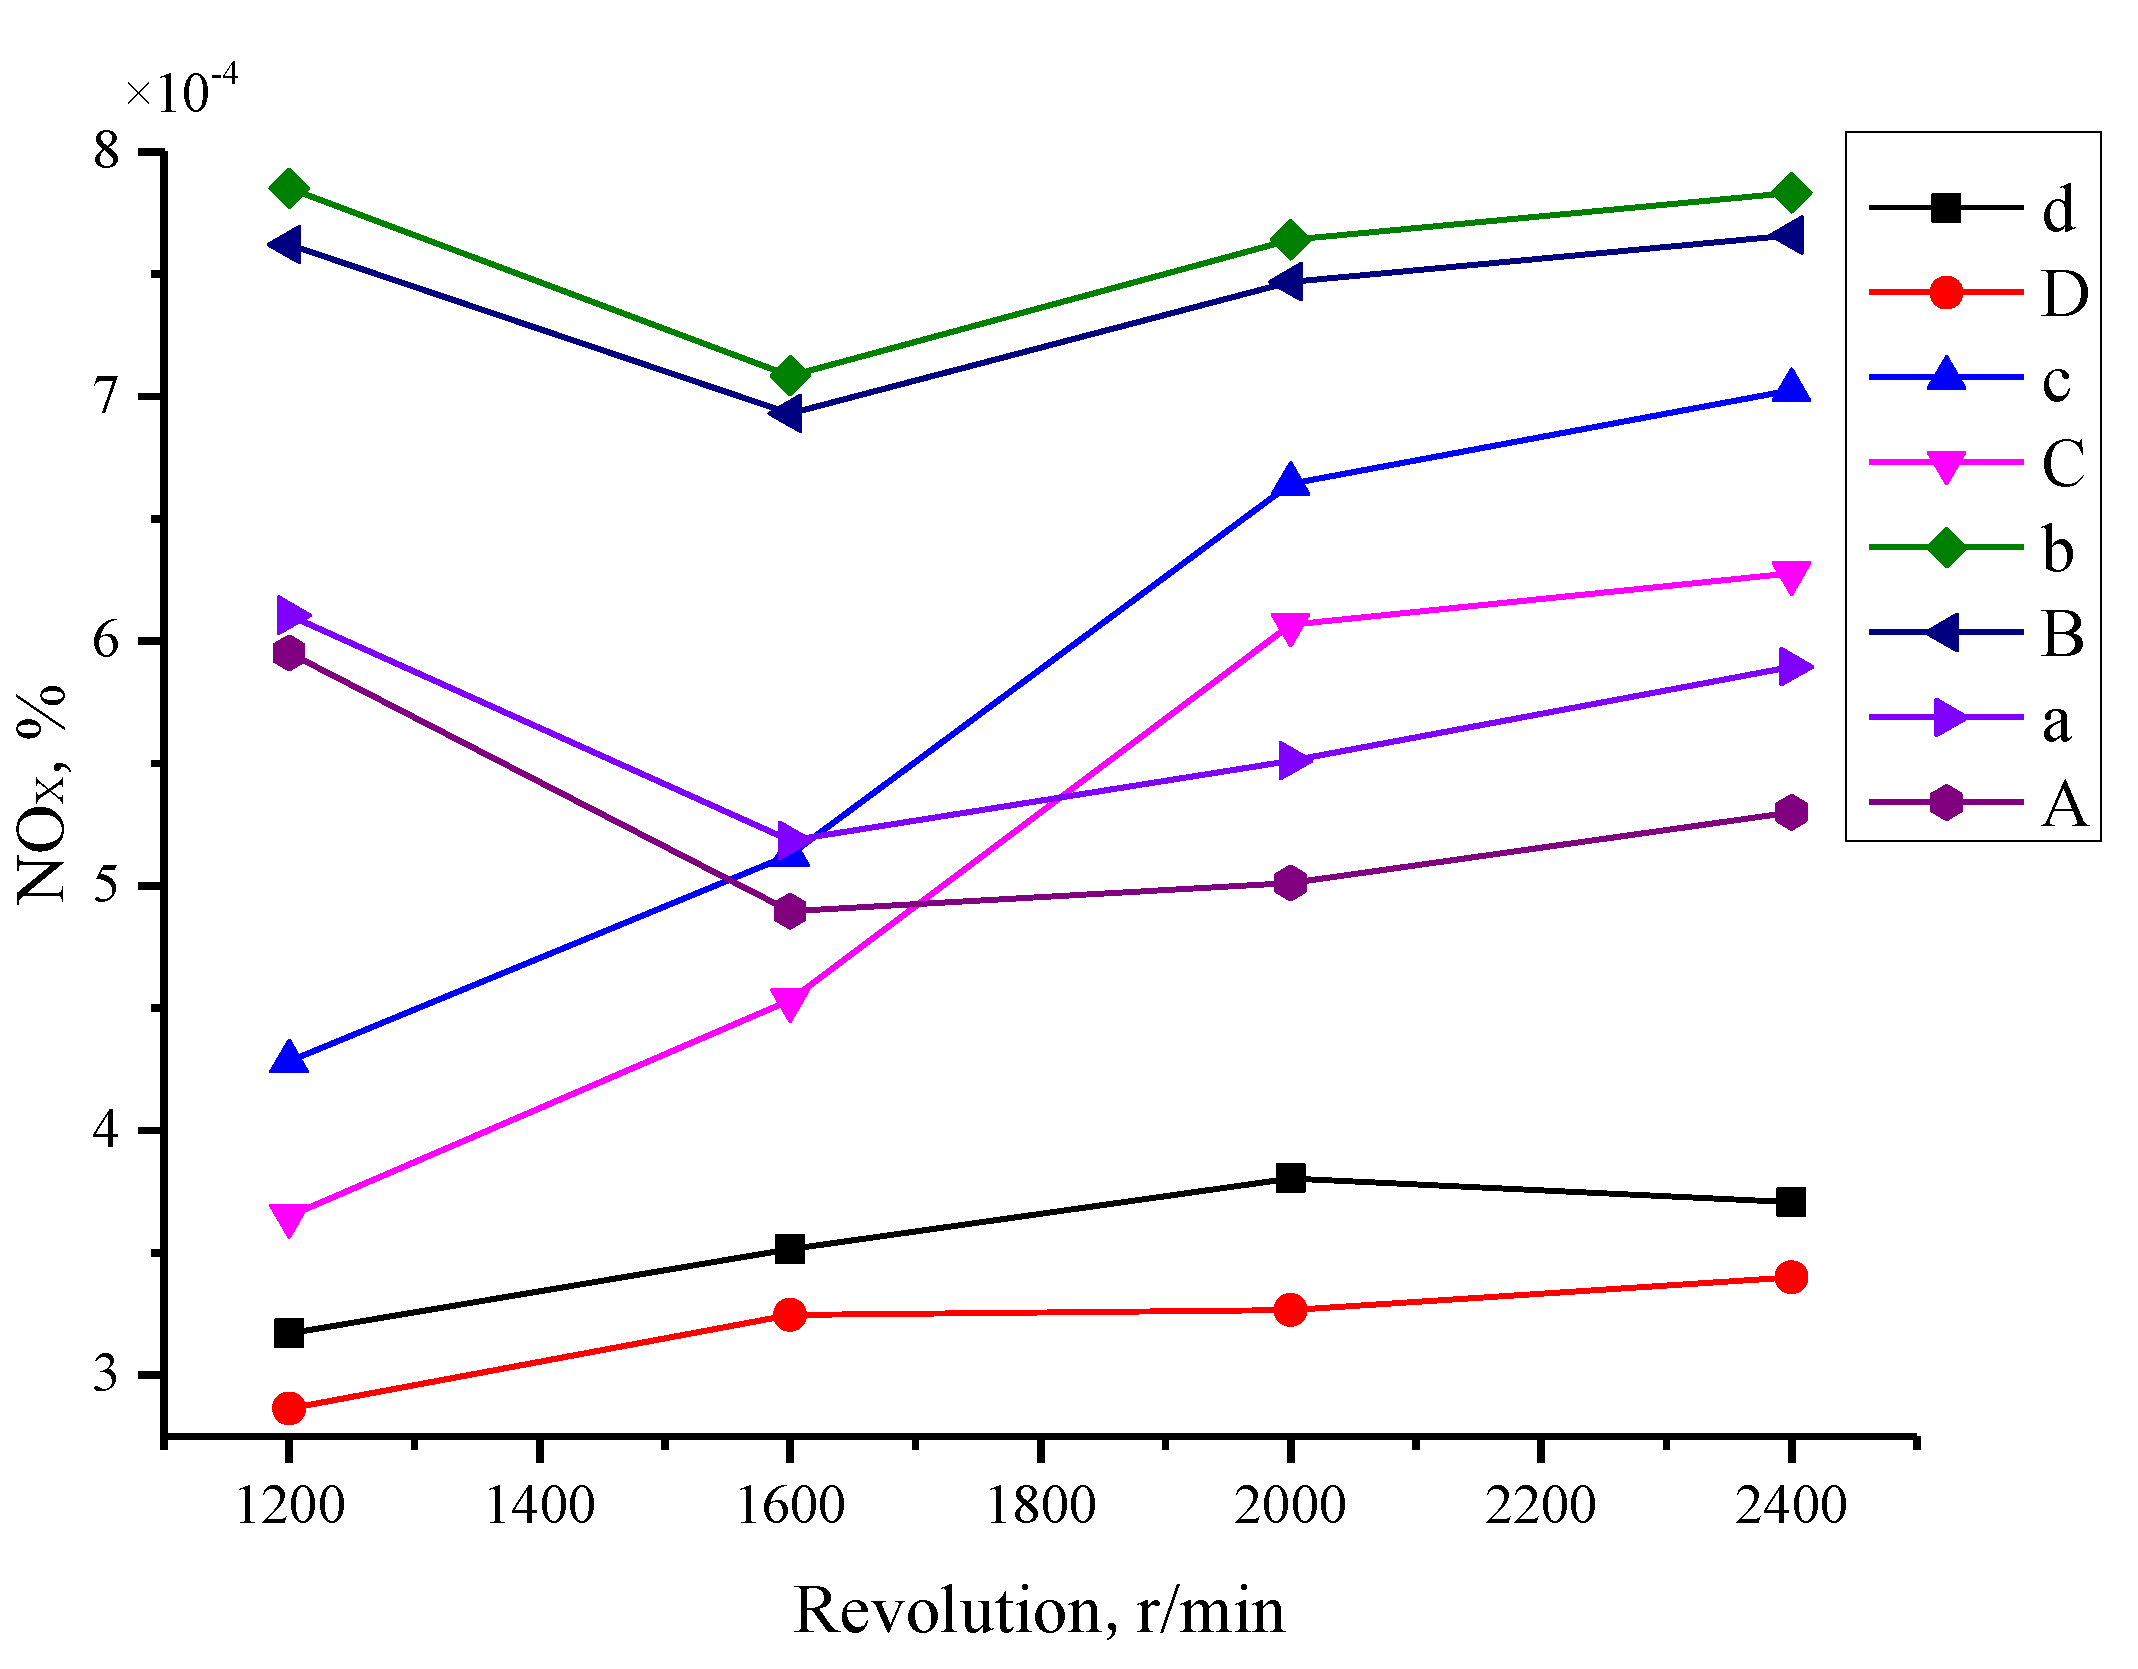
Figure 8 shows the change in the NO
x content at different speeds and loads. At a speed of 1200 r/min, the load increases from 25% to 50%, and the generated NO
x amount increases. When the load reaches a certain value, the generated NO
x amount begins to decrease. Based on the obtained data, the NO
x content decreases from the 75% to the 100% load conditions. Under full-load conditions, the minimum NO
x content is reached.
The operating conditions for NOx are high temperature and high pressure with a sufficient reaction time. At low speeds, the NOx reaction time is relatively sufficient, and the generated NOx amount is thus relatively large. With increasing speed, the temperature also increases, and the temperature better facilitates NOx generation than the reaction time does. Under a high load, the exhaust gas temperature is high, however the PM content is also high, which contributes to NOx reduction. From the perspective of the 75% load, the NOx content increases considerably with increasing speed, which coincides with the emission temperature comparison chart, indicating that the temperature exhibits a close relationship with NOx and achieves a positive correlation. Overall, the impact of speed on NOx emissions is smaller than that of the load. NOx generation after filter installation under the various working conditions increases, however the increase is not obvious.
Figure 9 shows the change in the CO
2 content at the different speeds and loads. The CO
2 generation amount slightly decreases with increasing speed under the load conditions of 25%, 50%, and 75%, and the overall change remains relatively consistent. Under loads of 25%, 50%, and 75%, the CO
2 content does not change notably after filter installation, and the CO
2 content change after installation under the 100% load does not differ much. This occurs as the CO
2 volume fraction has nearly reached its limit value under all operating conditions (the highest CO
2 volume fraction measured in the engine test is 17.6%), so the value does not change much.
The exhaust smoke content is expressed by the extinction coefficient k of the exhaust.
Figure 10 shows a comparison of the exhaust smoke content before and after filter installation under eight working conditions (running 10 min). Overall, the extinction coefficient k without filter installation exhibits an exponential increase with increasing speed, which is basically consistent with the fuel consumption trend. After installation, the extinction coefficient k can be reduced to a certain extent. The extinction coefficient k does not fluctuate much under the 25% and 50% loads, yet still exhibits exponential growth, as shown in
Figure 10. High load means the exhaust gas flow in the filter remains at a high level. The increase in the flow velocity will produce more turbulence in the porous filter element (steel fiber) to a certain extent, so that more particles colliding with the fibers will be captured.
At a rotation speed of 1200 r/min, the extinction coefficient k value is very small. This is attributed to the low rotation speed, long residence time of the emitted PM in the combustion chamber, and sufficient supplementary combustion. Consequently, less PM is emitted. With increasing speed, the emitted PM concentration increases, and the k value correspondingly increases.
2.3. Design of the Optimized Muffler
The optimized muffler is a structural improvement of the existing muffler products for R180 diesel engines. It integrates muffling and filtering functionalities. The filter element is easy to disassemble, which is more consistent with the needs of small horsepower non-road diesel engines.
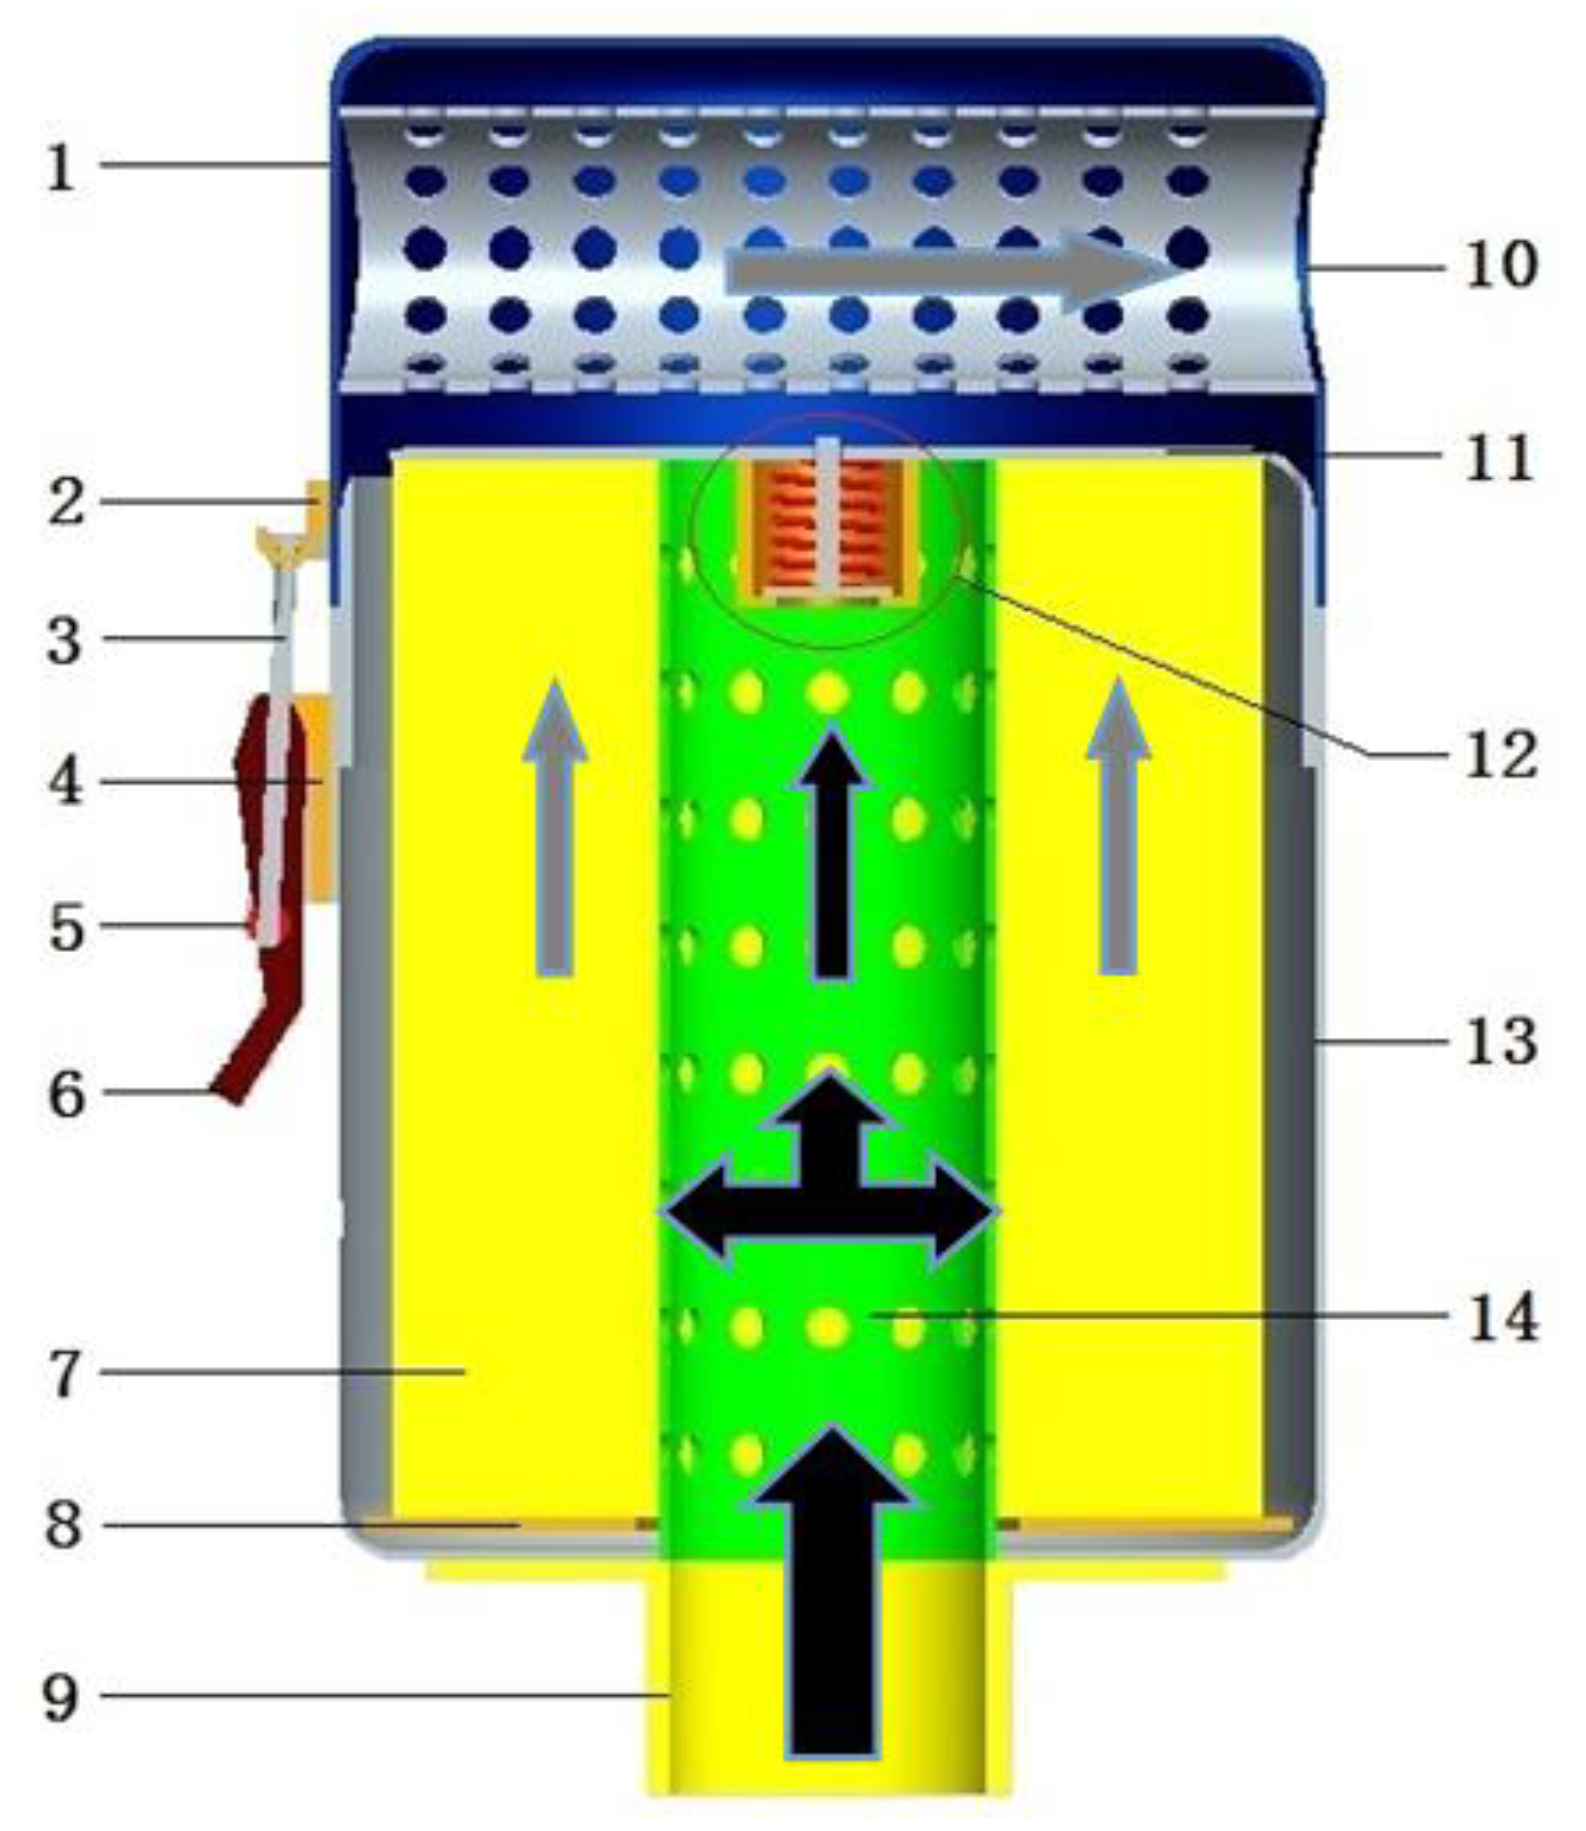
The structure of the original muffler is shown in
Figure 11. The upper housing 1 of the original muffler is welded to a transverse perforated pipe 7, and the orifice of the transverse perforated pipe 7 coincides with the exhaust port 6 in the upper housing. The support plate is welded to a longitudinal silencing pipe 8, and all other parts are welded to one another. The entire structure is non-detachable and belongs to a reactive muffler. When the muffler is working, the gas enters the longitudinal perforated pipe from the engine exhaust pipe. At this time, the gas is shunted, and part of the gas continues to flow forward along the original direction and enters the transverse perforated pipe through the small hole on the support plate and the transverse perforated pipe; part of the gas flows to the expansion chamber (composed of longitudinal perforated pipe and lower housing) through the small hole on the perforated pipe. The gas in the expansion chamber passes through the small hole on the support plate, enters the transverse perforated pipe and is discharged together with the previous air flow.
The optimized muffler is shown in
Figure 12 and, functions as a resistance composite muffler. The diameter of the inlet and exhaust pipe is 30 mm, the length of the perforated pipe is 100 mm, the diameter of the perforated hole is 4 mm, the inner diameter of the upper and lower shells is 92 mm, and the outer diameter of the filter element is 83 mm. Considering the material selection of the support plate, 1 mm steel plate is used for spinning press, as shown in
Figure 13. The stainless steel fibers employed as the filter medium are also good sound-absorbing materials (
Figure 13), which plays a role in resistive noise elimination. The pores ensure a certain collection efficiency, and simultaneously, the pores are connected to ensure gas circulation smoothness. When exhaust gas passes through the device, PM is retained in the filter medium. The gas enters longitudinal perforated pipe 14 from exhaust pipe 9 and enters filter element 7 through the small holes in the longitudinal perforated pipe, then the airflow direction changes. At this time, the filter element (stainless steel fibers) can filter a large proportion of the emitted PM.
When the optimized muffler is operated for a certain period of time, the PM accumulated in the filter element can seriously hinder the discharge of gas, which can cause a pressure difference between the exhaust pipe and the upper side of support plate 11 (
Figure 14). At this time, the pressure difference can overcome the resistance of spring 5, force one-way valve element 4 to open, and make gas flow out of pressure relief hole 3. Untreated exhaust exhibits a strong odor and contains smoke, and a preliminary assessment can be made on whether the filter element should be replaced.
2.4. Simulation
2.4.1. Evaluation Index of Acoustic Performance
There are two main types of indicators of the optimized muffler performance evaluation: acoustic and dynamic performance indicators. The acoustic performance evaluation index mainly includes insertion and transmission losses, and the aerodynamic index mainly includes the pressure loss and power loss ratio.
The transmission loss
refers to the difference in sound power at the inlet and outlet of the muffler, and the calculation equation is:
In Equation (1), the sound power level at the inlet of the muffler denoted as , the sound power level at the outlet denoted as (in dB), the sound power at the inlet denoted as , and the sound power at the outlet denoted as (in W).
The transmission loss reflects only the acoustic characteristics of the muffler itself, which is only directly related to the structural form and unaffected by external factors.
Insertion loss
is the difference in sound power level or sound pressure level at the exit position of the optimized muffler before and after installation and is expressed as follows:
In Equation (2), the sound power level of a certain measuring point before the installation of the muffler is , the sound power level after installation is , and the unit is dB; the sound power of a certain measuring point before installation is , the sound power after installation is , and its unit is W.
There is a relatively simple method to measure the insertion loss, which does not have very high requirements for the measurement environment, so it is easy to implement. The measurement result can reflect the noise reduction performance of the muffler itself, and the external comprehensive acoustic performance.
The pressure loss
is the average total pressure difference between the inlet and the outlet when a certain amount of smooth air flow passes through. As the optimized muffler in this study has equal cross-sectional area at both ends, the static air pressure difference can be considered as the pressure loss.
In Equation (3), is the exhaust pressure at the inlet; is the exhaust pressure at the inlet.
The power loss ratio
is the percentage of the difference in power before and after the optimized muffler is installed when the engine is under the calibrated operating conditions, i.e.,
In Equation (4), and are the engine power before and after the optimized muffler is installed, respectively, and the unit is kW.
The power loss ratio reflects the impact of resistance loss on the engine performance. When measuring the power loss ratio, the engine state and test environment should not change, and generally control ≤ 5%.
Based on the requirements of the problem, this paper uses the transmission loss and pressure loss as the acoustic performance and aerodynamic evaluation indicators of the simulation analysis, respectively.
2.4.2. Simulation Model
Assuming that the gas flow in the optimized muffler is axisymmetric, a two-dimensional mesh model is generated by choosing half of the model. The model in this paper does not consider the effects of heat and mass transfer in the optimized muffler and assumes that the gas velocity distribution is uniform when gas enters the optimized muffler. Then, a two-dimensional axisymmetric steady-state incompressible flow model is established. The governing equations of the flow and the turbulence model have been verified in previous research [
41,
42,
43,
44].
4. Conclusions
A test bench for the R180 diesel engine commonly applied in agriculture was built, and stainless steel fibers were employed as a filter medium to trap emitted diesel-related PM. The engine working conditions included various speeds (1200, 1600, 2000 and 2400 r/min) and loads (25%, 50%, 75%, and 100%), the HC, CO, NOx, and CO2 volume fractions in the exhaust were measured during the test, and the exhaust temperature, fuel consumption rate and extinction coefficient were also determined. A comparison of the test results with and without stainless steel fibers was conducted. Through comparison, it was found that the installation of steel fibers could increase the exhaust temperature and fuel consumption under the same working conditions. The installation of steel fibers could increase the HC, CO, NOx, and CO2 volume fractions to different degrees, however the increase remained limited. However, steel fibers could reduce the extinction coefficient to a large extent, which verified the notable function of steel fibers in PM capture.
An improved muffler integrated with the functions of PM filtration and noise reduction was designed, by using the steel fibers as the filtration medium. The simulation results for the optimized muffler verified the filtering and muffling performance. The optimized muffler performance is as follows: under a full load, the extinction coefficient K could be reduced by approximately 60%, and the noise level could be reduced by approximately 15%.
The whole optimized muffler is a mechanical structure with good reliability, and the use and maintenance costs are very low, which can satisfy the requirements of agricultural machinery with a low power level.


