Brief Report

SARS-CoV-2 RNA Recovery from Air Sampled on Quartz Fiber Filters: A Matter of Sample Preservation?

1
Department of Chemical and Pharmaceutical Sciences, University of Trieste, Via L. Giorgieri 1, 34127 Trieste, Italy
2
Institute for Maternal and Child Health, IRCCS Burlo Garofolo, Via Dell’Istria 65/1, 34137 Trieste, Italy
3
Department of Life Sciences, University of Trieste, Via L. Giorgieri 8, 34127 Trieste, Italy
4
INSTM National Interuniversity Consortium of Materials Science and Technology, Via G. Giusti, 950121 Firenze, Italy
5
Ospedale San Polo, Azienda Sanitaria Universitaria Giuliano Isontina, Via Luigi Galvani 1, 34074 Monfalcone, Italy
6
Department of Biological and Environmental Sciences, College of Arts and Sciences, University of Qatar, Doha 2713, Qatar
7
Ospedale Maggiore, Azienda Sanitaria Universitaria Giuliano Isontina, Piazza dell’Ospitale 1, 34129 Trieste, Italy
8
Department of Biology, University of Bari “Aldo Moro”, Via Via E. Orabona 4, 70124 Bari, Italy
9
Euro Mediterranean Scientific Biomedical Institute, 1040 Bruxelles, Belgium
*
Author to whom correspondence should be addressed.
Atmosphere 2022, 13(2), 340; https://doi.org/10.3390/atmos13020340
Submission received: 17 December 2021 / Revised: 11 February 2022 / Accepted: 14 February 2022 / Published: 17 February 2022

Abstract

:
The airborne route of transmission of SARS-CoV-2 was confirmed by the World Health Organization in April 2021. There is an urge to establish standardized protocols for assessing the concentration of SARS-CoV-2 RNA in air samples to support risk assessment, especially in indoor environments. Debates on the airborne transmission route of SARS-CoV-2 have been complicated because, among the studies testing the presence of the virus in the air, the percentage of positive samples has often been very low. In the present study, we report preliminary results on a study for the evaluation of parameters that can influence SARS-CoV-2 RNA recovery from quartz fiber filters spotted either by standard single-stranded SARS-CoV-2 RNA or by inactivated SARS-CoV-2 virions. The analytes were spiked on filters and underwent an active or passive sampling; then, they were preserved at −80 °C for different numbers of days (0 to 54) before extraction and analysis. We found a mean recovery of 2.43%, except for the sample not preserved (0 days) that showed a recovery of 13.51%. We found a relationship between the number of days and the recovery percentage. The results presented show a possible issue that relates to the quartz matrix and SARS-CoV-2 RNA recovery. The results are in accordance with the already published studies that described similar methods for SARS-CoV-2 RNA field sampling and that reported non-detectable concentrations of RNA. These outcomes could be false negatives due to sample preservation conditions. Thus, until further investigation, we suggest, as possible alternatives, to keep the filters: (i) in a sealed container for preservation at 4 °C; and (ii) in a viral transport medium for preservation at a temperature below 0 °C.

1. Introduction

The airborne route of transmission of SARS-CoV-2 was confirmed by the World Health Organization in April 2021 [1], after several publications on the topic, both theoretical and experimental [2,3]. The numbers of papers concerning the air sampling of SARS-CoV-2 for assessing the presence and possible infectivity in indoor and outdoor environments are growing continuously. Different sample collection methods can be used, such as solid impactors, liquid impactors, and filters [4].
The relationship between COVID-19 spread due to SARS-CoV-2 infection and air pollution has been considered [5,6], and the collection of particulate matter aiming to identify the pollutants therein is widely conducted both indoors and outdoors, using sampling pumps connected to a filtering system. The most used filtering materials are polytetrafluoroethylene (PTFE), glass fiber, and quartz fiber. Thus, several researchers have adapted this method for finding SARS-CoV-2 RNA in the collected particulate matter and, in some cases, for assessing infectivity [7].
There is an urgent need to establish standardized protocols for assessing the concentration of SARS-CoV-2 RNA in air samples (viral copies/m3) for supporting risk assessments; one of the focuses is on the recovery capability of the methods. Gaining information about the loss of analytes during the different phases of sampling and analyses will support the assessment of the original concentration of RNA in the air sample. Furthermore, this concentration can be related to possible residual infectivity to establish a concentration threshold or interval pointing at significant infection risks [8].
Debates on the airborne transmission route of SARS-CoV-2 have been complicated because among the studies testing the presence of the virus in the air and/or on surfaces, the percentage of positive samples collected on surfaces was considerably higher than the air samples [4,7].
Table 1 illustrates information from a selection of papers that report results concerning air samples collected on filters (glass fiber, quartz fiber, PTFE) by samplers usually utilized for aerosol sampling for pollution assessment, and not explicitly dedicated to bioaerosol collection.
It is worth noting that none of the studies reported the number of days of preservation before the analysis, except for some studies, which reported that the analysis was carried out right after the sampling.
Robotto et al. [17] recently published a validated sampling and analytical method based on the use of surrogate HCoV-OC43 for highlighting the influence of the filter material, temperature of conservation, sampling time, type of extraction medium, technique of RNA recovery, and residual infectivity. Then, they tested the method for indoor sampling in real conditions to recover SARS-CoV-2 RNA from air samples collected in a private house with isolated COVID-19-positive persons, finding 13/14 positive samples. (Table 1).
In the present study, we report preliminary results evaluating the parameters that can influence SARS-CoV-2 RNA recovery from quartz fiber filters spotted either with standard single-stranded SARS-CoV-2 RNA or inactivated SARS-CoV-2 virions. These results are part of a study on the recovery of SARS-CoV-2 RNA from filters of different materials spotted with standard RNA, inactivated SARS-CoV-2, and the viable one. The parameters taken into account are sampling conditions (temperature and relative humidity) and sampling flow. The duration and temperature of sample preservation have been considered as well.

2. Materials and Methods

In brief, quartz fiber filters were spiked with the analyte (standard single-stranded SARS-CoV-2 RNA or inactivated SARS-CoV-2 virions), subjected to air sampling, stored, and finally, the RNA was extracted from samples, purified, and analyzed. The workflow detail and the considered options for each step are reported in Figure 1.

2.1. Standard SARS-CoV-2 RNA and Inactivated SARS-CoV-2

Fifteen quartz fiber filters (FILTER-LAB® MFQ 47 mm-Filtros Anoia, S.A., Barcellona, Spain) were heated at 400 °C in a muffle furnace for 3 h before use to eliminate possible organic residues. After cooling, the filters were placed in a sterile Petri dish.
Two different types of spiking substances were employed to assess the recovery of SARS-CoV-2 RNA from filters:
(a) Single-stranded RNA fragments of SARS-CoV-2 EURM-019 (European Commission Joint Research Centre, Brussels, Belgium);
(b) Whole SARS-CoV-2 virions, previously isolated in the BLS3 facility of San Polo hospital (ASUGI, Monfalcone, Italy) and inactivated with ethanol 75% (Sigma-Aldrich Corporation, St. Louis, MO, USA) for 30 min.
The genome copies of SARS-CoV-2 present in both solutions were determined by real-time PCR before spotting on the filters.
Seven filters were spotted with solution “a”, and eight with solution “b”.
Two regions of the same filter were identified marking the diameter. Then, 10 µL of the same standard solution was spotted on each half of the filter (Figure 2). All the operations were carried out in a biosafety cabinet with the use of gloves and handling the filters with sterilized tweezers to avoid environmental contamination of the filters before sampling.

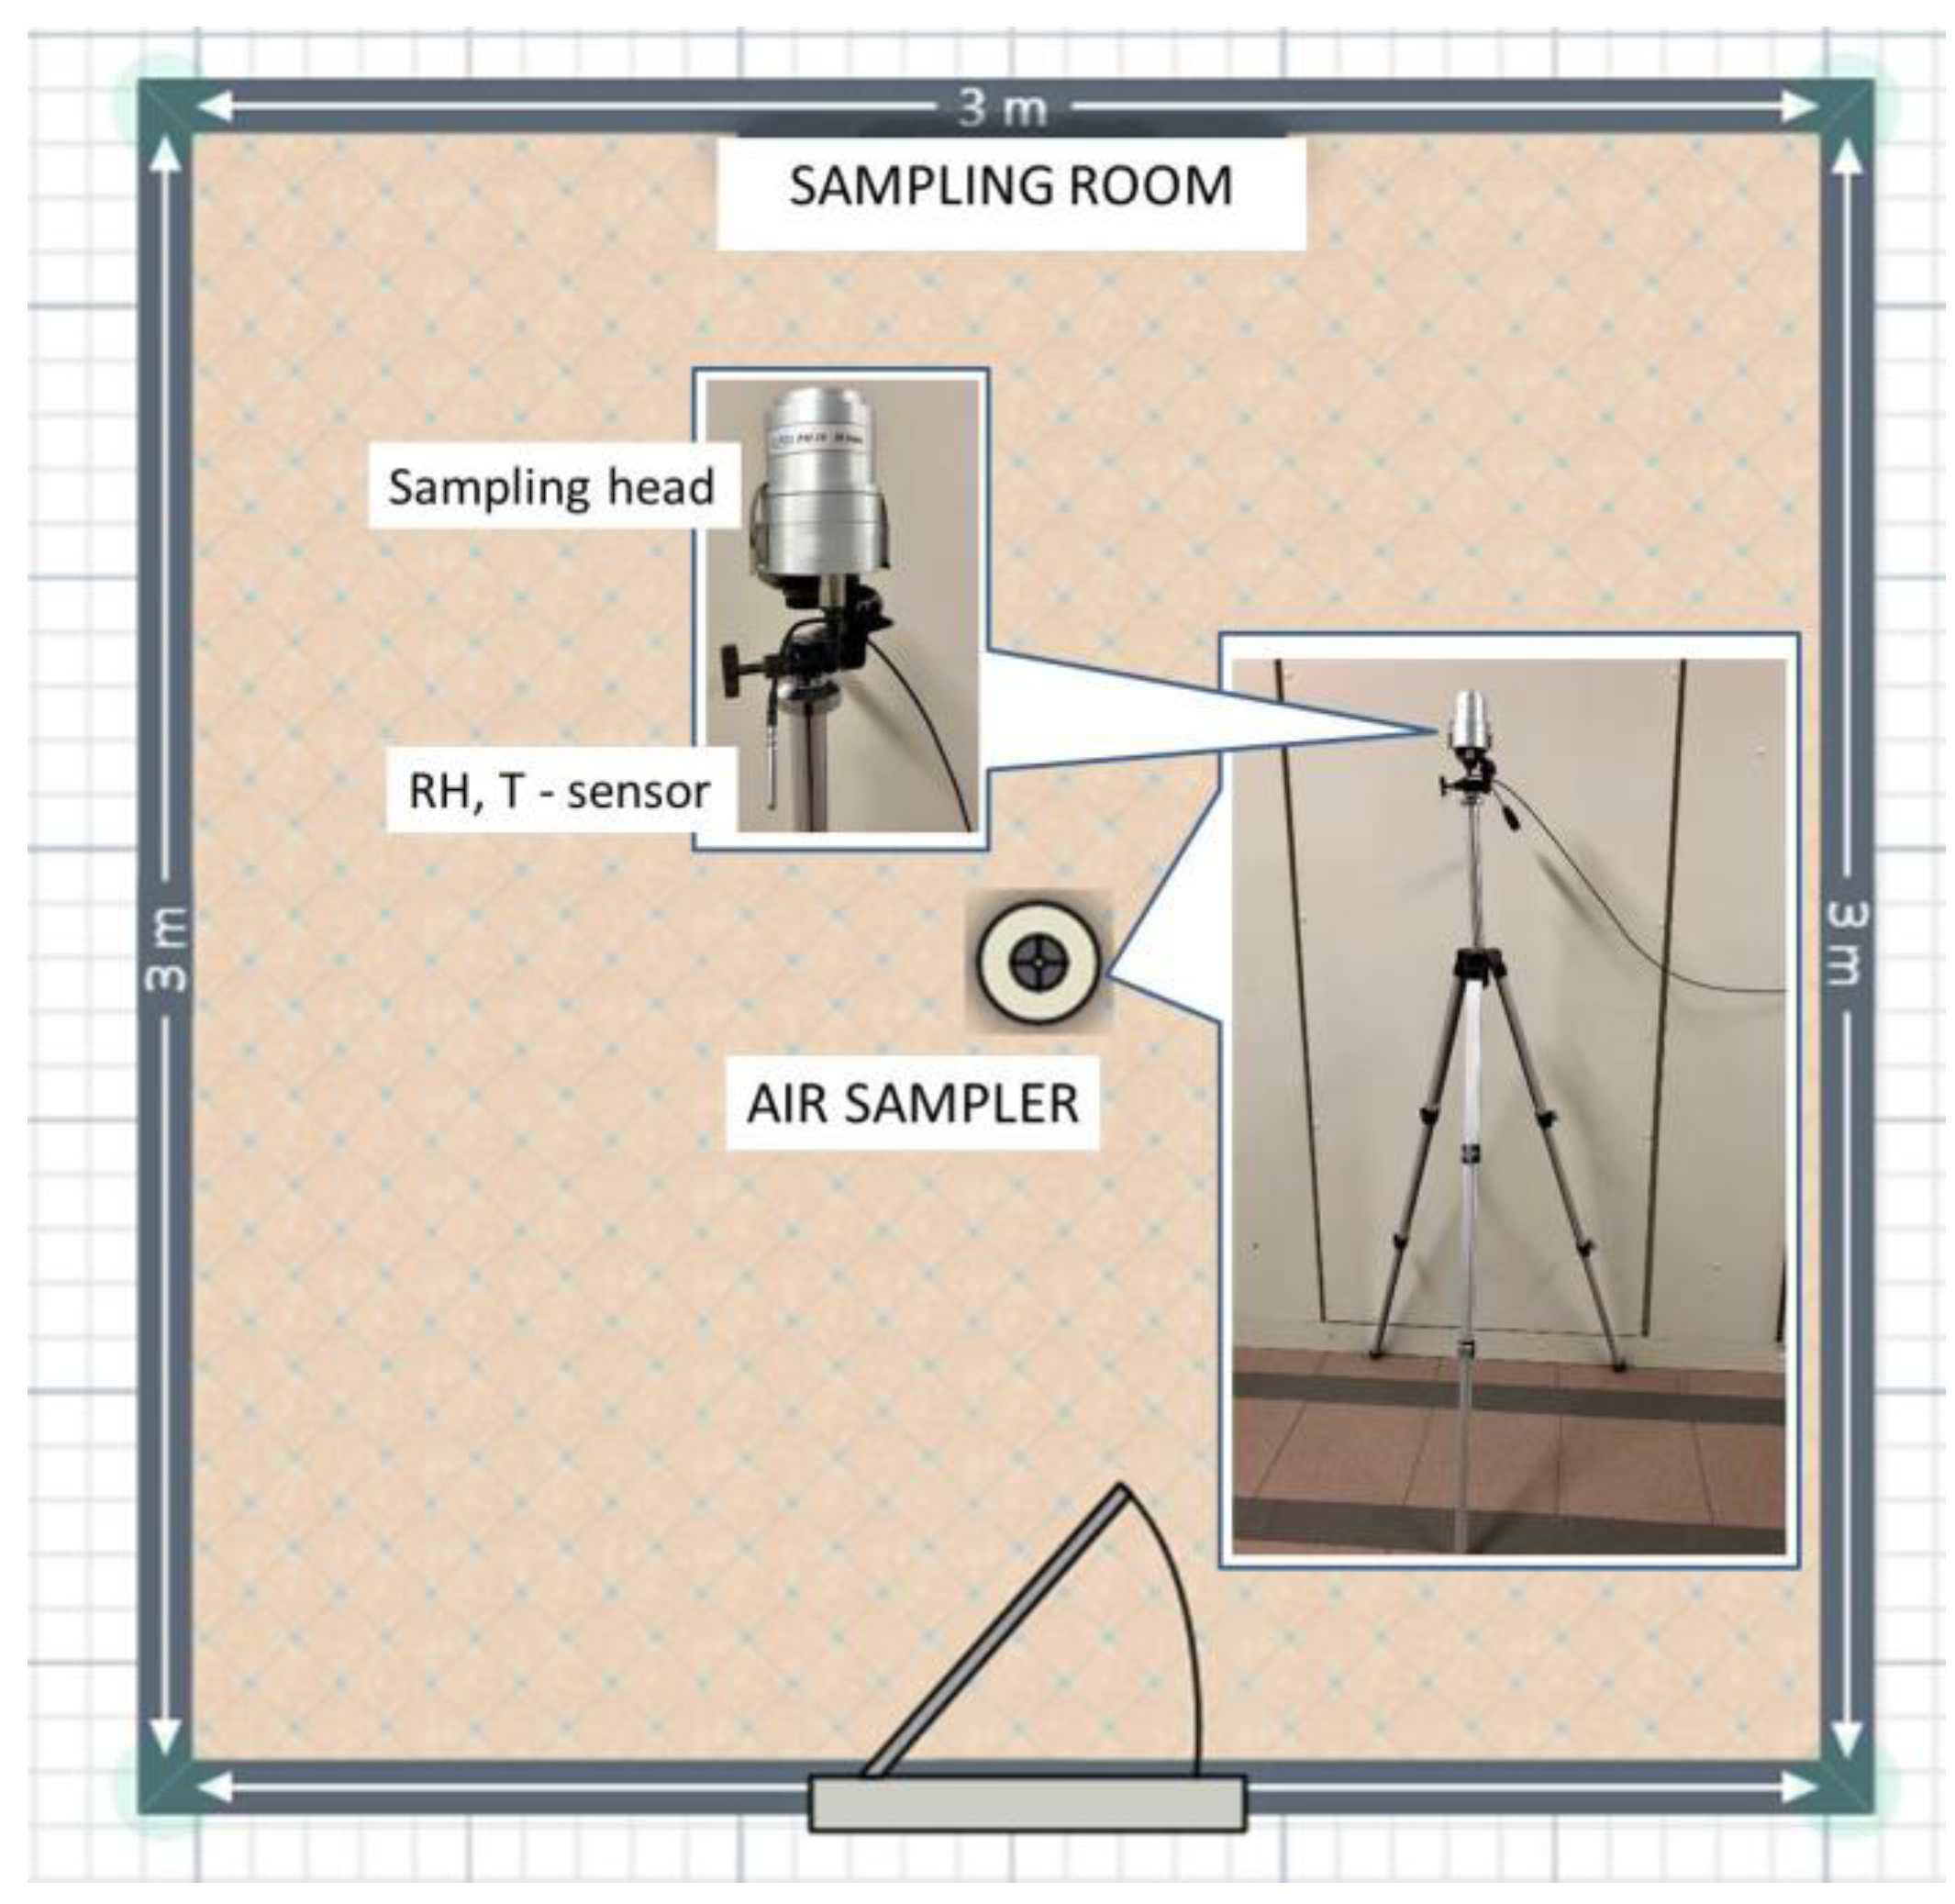
2.2. Sampling Procedure

Five filters were preserved as blanks and not subjected to any sampling procedure. They were immediately stored in a closed, sterilized Petri dish after the spotting procedure. For details on the storage, see Section 2.3 The other filters were not preserved before sampling; they were used immediately after the spotting procedure. Six filters were placed in a PM10 sampling device (SILENT Air Sampler, FAI, Rome, Italy) with a nominal flow of 10 l/min for 24 h (active sampling). Four filters were left in an open Petri dish close to the sampling apparatus for the same time period (passive sampling). The active and passive sampling procedures were carried out in a 3 × 3 m room, as shown in Figure 3, in the absence of people. The room was isolated from the general air conditioning system of the academic department hosting the experimentation.

2.3. Sample Storage

Fourteen of the fifteen spotted filters were stored at −80 °C in a sealed Petri dish in an ultra-freezer NEXUS H (110-370-550 L) (Angelantoni Life Science, Massa Martana (PG), Italy). Indications of virus stability at temperatures lower than −70 °C are reported in [21] or [22]. A temperature of −80 °C was indicated as the “ideal one” by Robotto et al. [23] for RNA preservation in air samples.
The duration of preservation (number of days) before extraction and analysis has been recorded. One filter was not frozen; the extraction procedure was carried out immediately after gene spotting.

2.4. Extraction and Purification Procedure

Each filter was cut along the diameter in two halves (Figure 2) that were separately extracted and purified using a ZymoBIOMICS RNA Miniprep Kit (Zymoresearch, Irvine, CA, USA), modified as reported by Setti et al. (2020). The RNA obtained from the samples was eluted from the column Zymo-Spin IIIGC (provided in the extraction kit) with 50 µL of RNase-free water (Fisher BioReagents™-Fisher Scientific International, Hampton, NJ, USA).

2.5. Reverse Transcription–Quantitative Polymerase Chain Reaction (RT-qPCR)

The eluate obtained after the extraction and purification of RNA from each half of the filter was analyzed in duplicate through RT-qPCR CFX96 (Bio-Rad Laboratories, Hercules (CA), USA). The SARS-CoV-2 N gene (the analysis target) was amplified with the use of the 2019-nCoV_N1-CDC-RT-PCR-Assay (Centers for Disease Control and Prevention, Atlanta, GA, USA). The sequence of primers and probes are reported in the Supplementary Material.
For the reverse transcriptase reaction and cDNA qScript XLT 1-Step RT-qPCR, ToughMix (QuantaBio, Beverly, MA, USA) was used as a reagent.
Two aliquots of 6.5 µL were taken from the eluate. Each aliquot was loaded in the RT-qPCR plate with 7.5 µL of qScript XLT 1-Step RT-qPCR ToughMix solution and 1 µL of 2019-nCoV_N1-CDC-RT-PCR-Assay solution (final primer concentration: 500 nM, final probe concentration: 125 nM). Two controls were loaded in each plate: (A) a positive control (containing the reagents for RT-q-PCR and EURM-019 Single-Stranded RNA fragments of SARS-CoV-2); and a (B) negative control (containing the reagents for RT-q-PCR and RNase-free water).
After incubation at 50 °C for 20 min and 95 °C for 3 min to activate/inactivate the reverse transcription reaction, 50 cycles of 95 °C for 3 s and 55 °C for 30 s were set to carry out amplification of the target gene.
The instrument automatically determined the cycle threshold values (Ct) for every reaction. A quantification curve was determined using EURM-019 Single-Stranded RNA fragments of SARS-CoV-2 at five different concentrations, which were analyzed in duplicate. The lowest concentration (corresponding to 45 copies of the N1 SARS-CoV-2 gene and 30.85 Ct) was considered the applicability limit of the curve. The samples with Ct > 30.85 are reported in the text as NQ (not quantifiable).

2.6. Statistical Analysis

The means, standard deviations, and 95% confidence intervals of the RT-qPCR results were evaluated for each duplicated sample (two halves of the filter). R software [24] was used for both the statistical analysis and graphical representation of the results.

3. Results

In Table 2, the SARS-CoV-2 RNA recovery results are reported, as well as the sampling conditions (temperature and relative humidity) and the number of days of sample preservation at −80 °C before analysis.
All standard RNA-spotted samples were not quantifiable by RT-qPCR. The percentage recovery of spotted copies was negligible, except for a filter that was analyzed immediately after preparation, which showed the highest percentage of recovery among all samples.
Among the inactivated SARS-CoV-2-spotted samples, the mean recovery percentage was 2.43% (recovered copies 104:106).
Considering these data, we decided to explore a possible correlation between the recovery percentage and preservation duration at −80 °C.
In Figure 4, all results are presented in a graph. It can be observed that the behavior mimics an exponential decay of the percentage of recovery versus the number of days of preservation.
In Figure 5, the log of the ratio between recovered copies and spotted copies concerning the inactivated SARS-CoV-2-spotted samples is reported. The trend shows a negative linear correlation and there are no significant differences between the active and passive sampling.

4. Discussion

This is the first study presented in the scientific literature that employs, as standard, either single-stranded SARS-CoV-2 RNA or inactivated SARS-CoV-2 virions to assess the percentage of recovery from quartz fiber filters.
The preliminary results show a possible issue that relates to the quartz matrix and SARS-CoV-2 RNA recovery. A possible explanation is that, during the defrosting process, the local pH variations in the quartz filter surface rich in acidic silanol groups [25] can lead to a pH lower than 7–8, which is ideal for virus preservation [21].
We have already explored published papers that used quartz, glass, and PTFE filters for collecting particulate matter for identifying SARS-CoV-2 RNA; summarized in Table 1. It can be observed that all studies which collected the samples on quartz or glass filters and preserved them at temperatures below−25 °C found no RNA, whereas the studies that used quartz or glass filters and preserved them at 4°C, or at lower temperatures but immersed in a medium, found positive samples. All studies that used PTFE filters found positive samples.
Robotto et al. [17], using the surrogate virus HCoV-OC43, tested the recovery at different temperatures of preservation of the sample and found no significant difference in the recovery of infective particles, except for a virus spiked on glass fiber filters and left at room temperature for 24 h. Nevertheless, the RNA recovery for the latter was comparable with the other samples. It is worth noting that the protocol by Robotto et al. [17] included the immersion of the sampled filters in a medium (elution buffer) before preservation at −80 °C.
The preliminary results obtained from our study, together with the results already present in published papers focused on air sampling of SARS-CoV-2 on quartz and glass filters, show that the time of preservation of the filters, if not immersed in a medium, is a crucial factor for the reliable evaluation of the concentration of SARS-CoV-2 RNA present in the air.

5. Conclusions

In the absence of a standardized method, different instrumentation and protocols for sampling air/aerosols for determining the presence of SARS-CoV-2 have been proposed, merging standard atmospheric particulate monitoring and virus preservation procedures. We considered the until-now unclarified issue of viral RNA recovery from quartz (or glass) filters that have been used in some published papers. Procedures implementing the storage of sampled dry filters at ultra-low temperatures appear to introduce a bias, implying low RNA recovery. Studies conducted with such procedures are thus prone to false negative results and unfit for quantitative air/environmental viral copy assessments. Quartz (or glass) filters available for standard PM monitoring could be used for checking RNA presence with the precaution of storing them in a proper way after sampling. We suggest, as possible alternatives, to keep the filters:
In a sealed container for preservation at 4 °C;
In a viral transport medium for preservation at a temperature below 0 °C (e.g., −20 °C or −80 °C).
The results presented are further evidence of the urgent need to optimize and standardize environmental sampling, storage, and quantitative analysis of airborne viruses for better understanding of the spread and transmission processes, as well as for assessing the efficacy of air quality management strategies. Moreover, the PM composition and its interactions with RNA can play an important role in the detection capability of the method employed, and there is a need for further investigation in the field, as shown in [26,27,28].

Supplementary Materials

The following are available online at https://www.mdpi.com/article/10.3390/atmos13020340/s1, Figure S1: Sequence of primers and probes.

Author Contributions

Conceptualization, S.L., L.Z., P.B., and A.P.; methodology, S.L., L.Z., P.B., and A.P.; formal analysis, S.L. and L.M.; investigation, L.Z., V.T., S.S., L.M., and A.L.G.; resources, S.L., P.B., A.P., J.P., A.D.G., P.P., F.F., and M.R.; writing—original draft preparation, S.L. and L.Z.; writing—review and editing, S.L., L.Z., L.M., P.B., A.P., E.G., S.S., S.C.; visualization, S.L. and L.M.; supervision, S.L., L.Z., P.B., and A.P.; project administration, S.L., L.Z., P.B., and A.P.; funding acquisition, S.L., P.B., A.P., L.Z., F.F., and M.R. All authors have read and agreed to the published version of the manuscript.

Funding

This research was funded by University of Trieste Atheneum Fund for scientific research (2021) and IRCCS Burlo Garofolo (RC47/20).

Institutional Review Board Statement

Not applicable.

Informed Consent Statement

Not applicable.

Data Availability Statement

Data available on request.

Acknowledgments

The authors gratefully thank TCR-Tecora S.R.L. for providing some of the instrumentation used to perform this study.

Conflicts of Interest

The authors declare no conflict of interest.

References

  1. WHO. Transmission of SARS-CoV-2: Implications for Infection Prevention Precautions. Available online: https://www.who.int/publications/i/item/modes-of-transmission-of-virus-causing-covid-19-implications-for-ipc-precaution-recommendations (accessed on 27 August 2021).
  2. Morawska, L.; Milton, D.K. It Is Time to Address Airborne Transmission of Coronavirus Disease 2019 (COVID-19). Clin. Infect. Dis. 2020, 71, 2311–2313. [Google Scholar] [CrossRef] [PubMed]
  3. Morawska, L.; Cao, J. Airborne transmission of SARS-CoV-2: The world should face the reality. Environ. Int. 2020, 139, 105730. [Google Scholar] [CrossRef] [PubMed]
  4. Borges, J.T.; Nakada, L.Y.K.; Maniero, M.G.; Guimarães, J.R. SARS-CoV-2: A systematic review of indoor air sampling for virus detection. Environ. Sci. Pollut. Res. 2021, 28, 40460–40473. [Google Scholar] [CrossRef] [PubMed]
  5. Setti, L.; Passarini, F.; De Gennaro, G.; Barbieri, P.; Licen, S.; Perrone, M.G.; Piazzalunga, A.; Borelli, M.; Palmisani, J.; DI Gilio, A.; et al. Potential role of particulate matter in the spreading of COVID-19 in Northern Italy: First observational study based on initial epidemic diffusion. BMJ Open 2020, 10, e039338. [Google Scholar] [CrossRef] [PubMed]
  6. Conticini, E.; Frediani, B.; Caro, D. Can atmospheric pollution be considered a co-factor in extremely high level of SARS-CoV-2 lethality in Northern Italy? Environ. Pollut. 2020, 261, 114465. [Google Scholar] [CrossRef] [PubMed]
  7. Dinoi, A.; Feltracco, M.; Chirizzi, D.; Trabucco, S.; Conte, M.; Gregoris, E.; Barbaro, E.; La Bella, G.; Ciccarese, G.; Belosi, F.; et al. A review on measurements of SARS-CoV-2 genetic material in air in outdoor and indoor environments: Implication for airborne transmission. Sci. Total Environ. 2021, 809, 151137. [Google Scholar] [CrossRef]
  8. Barbieri, P.; Zupin, L.; Licen, S.; Torboli, V.; Semeraro, S.; Cozzutto, S.; Palmisani, J.; Di Gilio, A.; de Gennaro, G.; Fontana, F.; et al. Molecular detection of SARS-CoV-2 from indoor air samples in environmental monitoring needs adequate temporal coverage and infectivity assessment. Environ. Res. 2021, 198, 111200. [Google Scholar] [CrossRef]
  9. Chirizzi, D.; Conte, M.; Feltracco, M.; Dinoi, A.; Gregoris, E.; Barbaro, E.; La Bella, G.; Ciccarese, G.; La Salandra, G.; Gambaro, A.; et al. SARS-CoV-2 concentrations and virus-laden aerosol size distributions in outdoor air in north and south of Italy. Environ. Int. 2021, 146, 106255. [Google Scholar] [CrossRef]
  10. Conte, M.; Feltracco, M.; Chirizzi, D.; Trabucco, S.; Dinoi, A.; Gregoris, E.; Barbaro, E.; La Bella, G.; Ciccarese, G.; Belosi, F.; et al. Airborne concentrations of SARS-CoV-2 in indoor community environments in Italy. Environ. Sci. Pollut. Res. 2022, 29, 13905–13916. [Google Scholar] [CrossRef]
  11. Linillos-Pradillo, B.; Rancan, L.; Ramiro, E.D.; Vara, E.; Artíñano, B.; Arias, J. Determination of SARS-CoV-2 RNA in different particulate matter size fractions of outdoor air samples in Madrid during the lockdown. Environ. Res. 2021, 195, 110863. [Google Scholar] [CrossRef]
  12. Pivato, A.; Amoruso, I.; Formenton, G.; Di Maria, F.; Bonato, T.; Vanin, S.; Marion, A.; Baldovin, T. Evaluating the presence of SARS-CoV-2 RNA in the particulate matters during the peak of COVID-19 in Padua, northern Italy. Sci. Total Environ. 2021, 784, 147129. [Google Scholar] [CrossRef] [PubMed]
  13. Setti, L.; Passarini, F.; De Gennaro, G.; Barbieri, P.; Perrone, M.G.; Borelli, M.; Palmisani, J.; Di Gilio, A.; Torboli, V.; Fontana, F.; et al. SARS-CoV-2 RNA found on particulate matter of Bergamo in Northern Italy: First evidence. Environ. Res. 2020, 188, 109754. [Google Scholar] [CrossRef] [PubMed]
  14. Stern, R.A.; Al-Hemoud, A.; Alahmad, B.; Koutrakis, P. Levels and particle size distribution of airborne SARS-CoV-2 at a healthcare facility in Kuwait. Sci. Total Environ. 2021, 782, 146799. [Google Scholar] [CrossRef]
  15. Hadei, M.; Mohebbi, S.R.; Hopke, P.K.; Shahsavani, A.; Bazzazpour, S.; Alipour, M.; Jafari, A.J.; Bandpey, A.M.; Zali, A.; Yarahmadi, M.; et al. Presence of SARS-CoV-2 in the air of public places and transportation. Atmos. Pollut. Res. 2021, 12, 302–306. [Google Scholar] [CrossRef] [PubMed]
  16. Kayalar, Ö.; Arı, A.; Babuççu, G.; Konyalılar, N.; Doğan, Ö.; Can, F.; Şahin, Ü.A.; Gaga, E.O.; Levent Kuzu, S.; Arı, P.E.; et al. Existence of SARS-CoV-2 RNA on ambient particulate matter samples: A nationwide study in Turkey. Sci. Total Environ. 2021, 789, 147976. [Google Scholar] [CrossRef] [PubMed]
  17. Robotto, A.; Civra, A.; Quaglino, P.; Polato, D.; Brizio, E.; Lembo, D. SARS-CoV-2 airborne transmission: A validated sampling and analytical method. Environ. Res. 2021, 200, 111783. [Google Scholar] [CrossRef]
  18. Bazzazpour, S.; Rahmatinia, M.; Mohebbi, S.R.; Hadei, M.; Shahsavani, A.; Hopke, P.K.; Houshmand, B.; Raeisi, A.; Jafari, A.J.; Yarahmadi, M.; et al. The detection of SARS-CoV-2 RNA in indoor air of dental clinics during the COVID-19 pandemic. Environ. Sci. Pollut. Res. 2021, 3, 1–9. [Google Scholar] [CrossRef]
  19. Ghaffari, H.R.; Farshidi, H.; Alipour, V.; Dindarloo, K.; Azad, M.H.; Jamalidoust, M.; Madani, A.; Aghamolaei, T.; Hashemi, Y.; Fazlzadeh, M.; et al. Detection of SARS-CoV-2 in the indoor air of intensive care unit (ICU) for severe COVID-19 patients and its surroundings: Considering the role of environmental conditions. Environ. Sci. Pollut. Res. 2021, 28, 1–7. [Google Scholar] [CrossRef]
  20. Grimalt, J.O.; Vílchez, H.; Fraile-Ribot, P.A.; Marco, E.; Campins, A.; Orfila, J.; van Drooge, B.L.; Fanjul, F. Spread of SARS-CoV-2 in hospital areas. Environ. Res. 2022, 204, 112074. [Google Scholar] [CrossRef] [PubMed]
  21. Tedeschi, R.; De Paoli, P. Collection and Preservation of Frozen Microorganisms. Methods Mol. Biol. 2011, 675, 313–326. [Google Scholar] [CrossRef]
  22. Gould, E.A. Methods for long-term virus preservation. Mol. Biotechnol. 1999, 13, 57–66. [Google Scholar] [CrossRef]
  23. Robotto, A.; Quaglino, P.; Lembo, D.; Morello, M.; Brizio, E.; Bardi, L.; Civra, A. SARS-CoV-2 and indoor/outdoor air samples: A methodological approach to have consistent and comparable results. Environ. Res. 2021, 195, 110847. [Google Scholar] [CrossRef] [PubMed]
  24. Hornik, K. The Comprehensive R Archive Network. Wiley Interdiscip. Rev. Comput. Stat. 2012, 4, 394–398. [Google Scholar] [CrossRef]
  25. Sulpizi, M.; Gaigeot, M.P.; Sprik, M. The silica-water interface: How the silanols determine the surface acidity and modulate the water properties. J. Chem. Theory Comput. 2012, 8, 1037–1047. [Google Scholar] [CrossRef]
  26. Hsiao, T.C.; Cheng, P.C.; Chi, K.H.; Wang, H.Y.; Pan, S.Y.; Kao, C.; Lee, Y.L.; Kuo, H.P.; Chung, K.F.; Chuang, H.C. Interactions of chemical components in ambient PM2.5 with influenza viruses. J. Hazard. Mater. 2022, 423, 127243. [Google Scholar] [CrossRef]
  27. Santarpia, J.L.; Ratnesar-Shumate, S.; Haddrell, A. Laboratory study of bioaerosols: Traditional test systems, modern approaches, and environmental control. Aerosol Sci. Technol. 2020, 54, 585–600. [Google Scholar] [CrossRef]
  28. Pan, Y.L.; Kalume, A.; Wang, C.; Santarpia, J. Atmospheric aging processes of bioaerosols under laboratory-controlled conditions: A review. J. Aerosol Sci. 2021, 155, 105767. [Google Scholar] [CrossRef]
Figure 1. Factors determining the recovery (Workflow) and considered options for each factor (Choices).
Atmosphere 13 00340 g001
Figure 2. Filter spotting procedure and filter cutting before analysis.
Atmosphere 13 00340 g002
Figure 3. Sampling room and sampling device positioning.
Atmosphere 13 00340 g003
Figure 4. Percentage of recovered copies of SARS-CoV-2 RNA in relation to the number of preservation days at −80 °C.
Atmosphere 13 00340 g004
Figure 5. Logarithm of the recovered copies and spotted copies ratio of SARS-CoV-2 RNA in relation to the number of preservation days at −80 °C.
Atmosphere 13 00340 g005
Table 1. Selection of papers that report results concerning air samples collected on filters.
ArticleSampling AreaSamplerFilter MaterialSample PreservationNo. of Samples% of Positive Samples 1
Barbieri et al., 2021 [8]Indoor air of a hospital in ItalyLow-volume samplerquartz fiberimmediately analyzed520% (Ct < 40)
Chirizzi et al., 2021 [9]Indoor environments in ItalyLow-volume and sequential samplersquartz fiber−25°C (in Petri dish)600%
(>0.8 copies/m3)
Conte et al., 2021 [10]Indoor environments in ItalyVarious high- and low-volume samplersquartz fibereither −25 °C or
−80 °C
690%
(>0.58 copies/μL)
Linillos-Pradillo et al., 2021 [11]Outdoors
in Spain
High-volume samplersquartz fiberliquid nitrogen (in Falcon tube)180% (Ct < 35)
Pivato et al., 2021 [12]Outdoors
in Italy
Low-volume samplerquartz fiber−20 °C (in Petri dish)440% (Ct < 40)
Setti et al., 2020 [13]Outdoors
in Italy
Low-volume samplerquartz fiber4 °C (in sealed container)3424% (Ct < 40)
Stern et al., 2021 [14] Indoor air in hospitals and temporary quarantine facilityLow-volume samplerglass fiber4 °C (in sealed container)988% (Ct < 39)
Hadei et al., 2021 [15]Indoor environments in IranMedium- and low-volume samplersPTFE;
glass fiber
4 °C (in sealed container)23;
5
65%;
60%
Kayalar et al., 2021 [16]Outdoors in TurkeyVarious high- and low-volume samplersPTFE;
glass fiber
−20 °C (in Petri dish)117;
76
13%;
7%
(>0.1 copies/m3)
Robotto et al., 2021 [17] Indoor air in private house of COVID-19 patients in ItalyLow- and high-volume samplersPTFE;
glass fiber
−80 °C (in medium)4;
10
75%;
100% (Ct < 40)
Bazzazpour et al., 2021 [18] Indoor air of dental clinics in IranHigh-volume samplerPTFE4 °C (in Petri dish)3636%
Ghaffari et al., 2021 [19] Indoor air of hospitals in IranLow-volume samplerPTFE−20 °C (in medium)1612.5%
Grimalt et al., 2022 [20] Indoor air of a hospital in SpainLow-volume samplerPTFEimmersed in medium and analyzed4768% (Ct < 44.25)
1 In parenthesis, the threshold above which the sample is considered positive is reported.
Table 2. Sample characteristics and extraction results.
SampleAnalyteSamplingTRH%Days at −80 °CSpotted CopiesExtracted
Copies
% of Recovered Copies
RNA1pRNApassive19.548.44261.46 × 106NQ-
RNA1aRNAactive19.2746.00261.46 × 106NQ-
RNA2aRNAactive20.2063.09191.46 × 106NQ-
RNA3aRNAactive20.4149.66211.46 × 106NQ-
SCV1pSARS-CoV-2passive21.6748.2269.30 × 1071.25 × 1061.34%
SCV1aSARS-CoV-2active21.6748.2269.30 × 1071.58 × 1061.70%
SCV2pSARS-CoV-2passive20.8651.3917.98 × 1074.95 × 1066.20%
SCV2aSARS-CoV-2active20.8651.3917.98 × 1074.66 × 1065.84%
SCV3pSARS-CoV-2passive22.0656.17282.51 × 1071.76 × 1050.70%
SCV3aSARS-CoV-2active22.0656.17282.51 × 1072.95 × 1051.17%
RNA1blankRNA---271.46 × 10⁶NQ-
RNA2blankRNA---271.46 × 10⁶NQ-
RNA3blankRNA---04.75 × 1086.42 × 10713.51%
SCV1blankSARS-CoV-2---549.30 × 1078.14 × 1040.09%
SCV2blankSARS-CoV-2---401.90 × 10⁷NQ-
NQ, not quantifiable.
Publisher’s Note: MDPI stays neutral with regard to jurisdictional claims in published maps and institutional affiliations.

