Article

Life Cycle Assessment of Battery Electric and Internal Combustion Engine Vehicles Considering the Impact of Electricity Generation Mix: A Case Study in China

1
School of Electrical and Electronic Engineering, Hubei University of Technology, Wuhan 430068, China
2
School of Electrical Engineering and Automation, Wuhan University, Wuhan 430072, China
3
State Grid Sichuan Electric Power Company, Chengdu 610041, China
*
Author to whom correspondence should be addressed.
Atmosphere 2022, 13(2), 252; https://doi.org/10.3390/atmos13020252
Submission received: 20 December 2021 / Revised: 19 January 2022 / Accepted: 29 January 2022 / Published: 1 February 2022
(This article belongs to the Special Issue Engine Emissions and Air Quality)

Abstract

:
Battery Electric Vehicles (BEVs) are considered to have higher energy efficiency and advantages to better control CO2 emissions compared to Internal Combustion Engine Vehicles (ICEVs). However, in the context that a large amount of thermal power is still used in developing countries, the CO2 emission reduction effectiveness of BEVs can be weakened or even counterproductive. To reveal the impact of the electricity generation mix on carbon emissions from vehicles, this paper compares the life cycle carbon emissions of BEVs with ICEVs considering the regional disparity of electricity generation mix in China. According to Life Cycle Assessment (LCA) analysis and regional electricity carbon intensity, this study demonstrates that BEVs in the region with high penetration of thermal power produce more CO2 emissions, while BEVs in the region with higher penetration of renewable energy have better environmental performance in carbon emission reduction. For instance, in the region with over 50% penetration of renewable energy, a BEV can reduce more CO2 (18.32 t) compared to an ICEV. Therefore, the regions with high carbon emissions from vehicles need to increase the proportion of renewable generation as a priority rather than promoting BEVs.

1. Introduction

As the negative impact of climate change on the living environment of the earth increasingly intensifies, global warming is currently one of the biggest challenges to human society. To reduce greenhouse gas (GHG) emissions caused by fossil fuels is a key to addressing the huge challenge as the living environment gets worse. Various countries set new carbon emission reduction goals for achieving GHG savings. China aims to reach the peak of carbon emission by 2030 and achieve carbon neutrality by 2060 [1]. Additionally, China announces the target of increasing the share of renewable energy to 25% by 2030 and reducing its carbon dioxide (CO2) emission to 65% below 2005 levels [2]. The USA declares that the renewable load will increase from 5% to 100% by 2045 [3], and the GHG emissions will fall by 26–28% in 2025 compared to 2005 [4]. New Zealand intends to reduce its GHGs to 30% by 2030 compared to 2005 and achieve carbon neutrality by 2050 [5]. Meanwhile, Australia aims to reduce carbon emission to 26–28% by 2030, compared to 2005 [6]. It shows that in order to realize emissions reduction and energy conservation, a massive drop in fossil fuel consumption and a significant surge in renewable energy consumption are the inevitable trend of global environmental governance. This means that clean energy consumption is constantly rising, thereby resulting in the gradual replacement of non-renewable resource consumption.
To achieve a reduction in carbon emissions, one of the primary targets is to promote clean energy use and limit pollutant emission in the transport sector [7,8]. In 2020, the transport sector accounted for 24% of total global CO2 emissions [9]. Light-duty vehicles (LDVs), which are the main transport for daily travel in human society, accounted for nearly half of the CO2 emission of the transport sector [9,10]. Compared with conventional Internal Combustion Engine Vehicles (ICEVs), the new energy vehicles have higher energy efficiency and advantages to better control COx, NOx, and particulate matter (PM) emissions as the alternative [11,12,13]. New technologies and propulsion systems for new energy vehicles have become potential strategies for sustainable vehicle development in the future [14]. Thus, as an important product of the energy industry chain, a new energy vehicle plays a crucial role in promoting low-carbon development. To decrease the CO2 emissions of the transport sector, all kinds of new energy vehicles need to be further promoted.
Due to the zero tailpipe emissions and high energy efficiency, Battery Electric Vehicle (BEV) is one of the most preferred new energy vehicles and is particularly beneficial for highly populated areas with poor air quality [15]. Comprehensive promotion and high penetration of BEVs can achieve low carbon emissions and high energy efficiency, and alleviate the energy shortage and air pollution caused by the transport sector [12,16,17]. U.S. Energy Information Administration (Washington DC, USA) states that EVs will grow from 0.7% of the total global LDVs in 2020 to 31% by 2050, reaching 672 million vehicles [9]. In addition, BEVs attract considerable attention from governments and vehicle OEMs (original equipment manufacturers) all over the world. Eighteen of the twenty largest OEMs declare that the offer and sales of their BEVs will increase dramatically [18]. As the increasing population of conventional ICEVs results in massive air pollutant emissions, China focuses great attention on the promotion of BEVs in order to improve the human living environment, provide energy security, reduce GHGs emissions and achieve energy conservation [19,20,21]. Furthermore, the implementation of research and development projects regarding advanced clean vehicle technologies have been encouraged by the government to build a reliable sustainability transportation system over 20 years [22]. Therefore, in a carbon-neutral context, the development of BEVs has a bright future in the transport sector.
Sufficient knowledge of the life cycle carbon emission of BEVs is necessary for the sake of evaluation of the CO2 emission reduction, and guideline of the BEVs market development and policy making. Life cycle assessment (LCA) is considered as a promising method widely used by a product or a system to identify the environmental burdens and potential impacts. This is an effective and efficient method in quantifying carbon emissions generated by vehicles. According to LCA, carbon emissions from vehicles and the practical effectiveness of promoting BEVs can be estimated more accurately. In [23], results of the LCA method show that EVs can dramatically decrease the global warming potential by 29% compared to ICEVs in Western Australia.
The evaluation of carbon emissions from BEVs based on LCA mainly involves two aspects, namely, the material cycle and the “Well to Wheel” (WTW) life cycle, which constitute the complete life cycle of vehicles considering both manufacturing and use phases [24]. The material cycle refers to the manufacturing phase from a cradle-to-grave perspective including the production of all single components and the processing of residual materials regarding vehicles. It should be noted that the extraction of raw materials, production, and even their residual materials at the end of the life cycle are needed to take into account in the assessment [25]. The WTW life cycle refers to the use phase including the production of electricity used for the charging of EVs.
Carbon emissions of the material cycle and the WTW cycle of BEVs are significantly affected by the electricity mix used for vehicle production and charging. The carbon emissions of EVs could be overestimated by up to 75% by neglecting the improvement of the electricity mix [26]. The carbon intensity of electricity generation depends on the electricity generation mix, which means a high proportion of thermal power leads to the high carbon intensity of electricity generation, and carbon emissions derived from the electricity consumption of BEVs thus largely depend on the electricity generation mix [27]. In various countries, especially in developing countries, thermal power units are still the main power supply [28]. As a result, carbon emissions per km of EVs are even higher than that of ICEVs under certain circumstances [29]. Sheng et al. [30] presented a comparative study of energy consumption and emissions produced by different new energy vehicles in Australia and New Zealand and the best emission per km performance is provided by BEVs in an energy structure with a high penetration of renewable energy resources. Rangaraju et al. [24] showed that carbon emissions of BEVs are lower than that of conventional vehicles based on LCA in the Belgian electricity mix context. However, Shafique et al. [17] manifested that EV is not an optimal choice and has an unsatisfied environmental performance in GHG emissions due to the low penetration of renewable energy in Hong Kong in 2019. Bauer et al. [31] pointed out that various powertrain technologies of vehicles produce different environmental impacts, and in terms of some environmental burdens, EVs may result in worse performance compared to ICEVs. Tagliaferri et al. [32] demonstrated that ICEVs indeed produce more GHG emissions than BEVs in the use phase, however, BEVs produce a double amount of GHG compared to ICEVs in the manufacturing phase. Sacchi et al. [33] showed that the premise for the battery to reduce GHG emissions is a dramatic reduction of the GHG intensity of the electricity used for charging. Therefore, the electricity generation mix and the electricity carbon intensity need to be considered when evaluating the carbon emissions of BEVs [34,35].
Existing studies have contributed to quantifying vehicle carbon emissions with the LCA method, focusing either on the manufacturing or use phase of vehicles. Nevertheless, the regional power generation disparity of a country is usually neglected in a long-term LCA of vehicles. Additionally, despite research efforts placed on the environmental impact of vehicles using LCA in various developed countries, few studies have been oriented from developing countries’ perspectives, whereas lack of the comparative study of common ICEVs and BEVs and electricity mix in developing countries may lead to a biased cognition of the practical global carbon emissions related to vehicles.
To fill the gap, given the regional power generation disparity, this paper calculates the distribution of power generation and the carbon intensity per unit of electricity in different regions (provinces and municipalities) of China. In addition, the electricity carbon emission produced by all materials of vehicles is considered in the study. Based on the results, the paper presents a comparative study of common ICEVs and BEVs in different regions of China on carbon emissions and energy consumption using the LCA method considering both the manufacturing and use phases.
The remainder of this paper is organized as follows. Section 2 describes the relevant energy data and supporting policies of EVs in China. Section 3 provides details of the method and the life cycle inventory of the vehicles. Section 4 presents the comparison of carbon emissions between BEVs and ICEVs. The results and discussion and the future policy recommendations are provided. Section 5 provides conclusions.

2. Relevant Data and Policy of EVs in China

Through a decade of rapid development, the global EVs exceeded 10 million units in 2020, which increased by 43% compared to 2019. Although the global new car registrations decreased by 16% in 2020 due to the COVID-19 pandemic, new car registrations in China only dropped about 9% because of an effective pandemic prevention system adopted by the Chinese government. China is the largest EV production country worldwide with 4.5 million EVs and it led with 1.2 million new EV registrations in 2020. The United States followed with 295,000 new BEV registrations. Overall EVs sales share increased by 70% and reached 4.6% of total car sales around the world in 2020 [14]. The rapid expansion of the EV market represents an inevitable trend of reduction in carbon emissions. However, the transport sector is still responsible for a large portion of global CO2 emissions, and China is the world’s largest emitter of CO2 emissions. Furthermore, the electricity generation mix and carbon intensity dramatically affect the carbon emission of vehicles. Therefore, in order to study the carbon emissions of EVs in China, this section further analyzes the related information of CO2 emissions in terms of data analysis and policy.

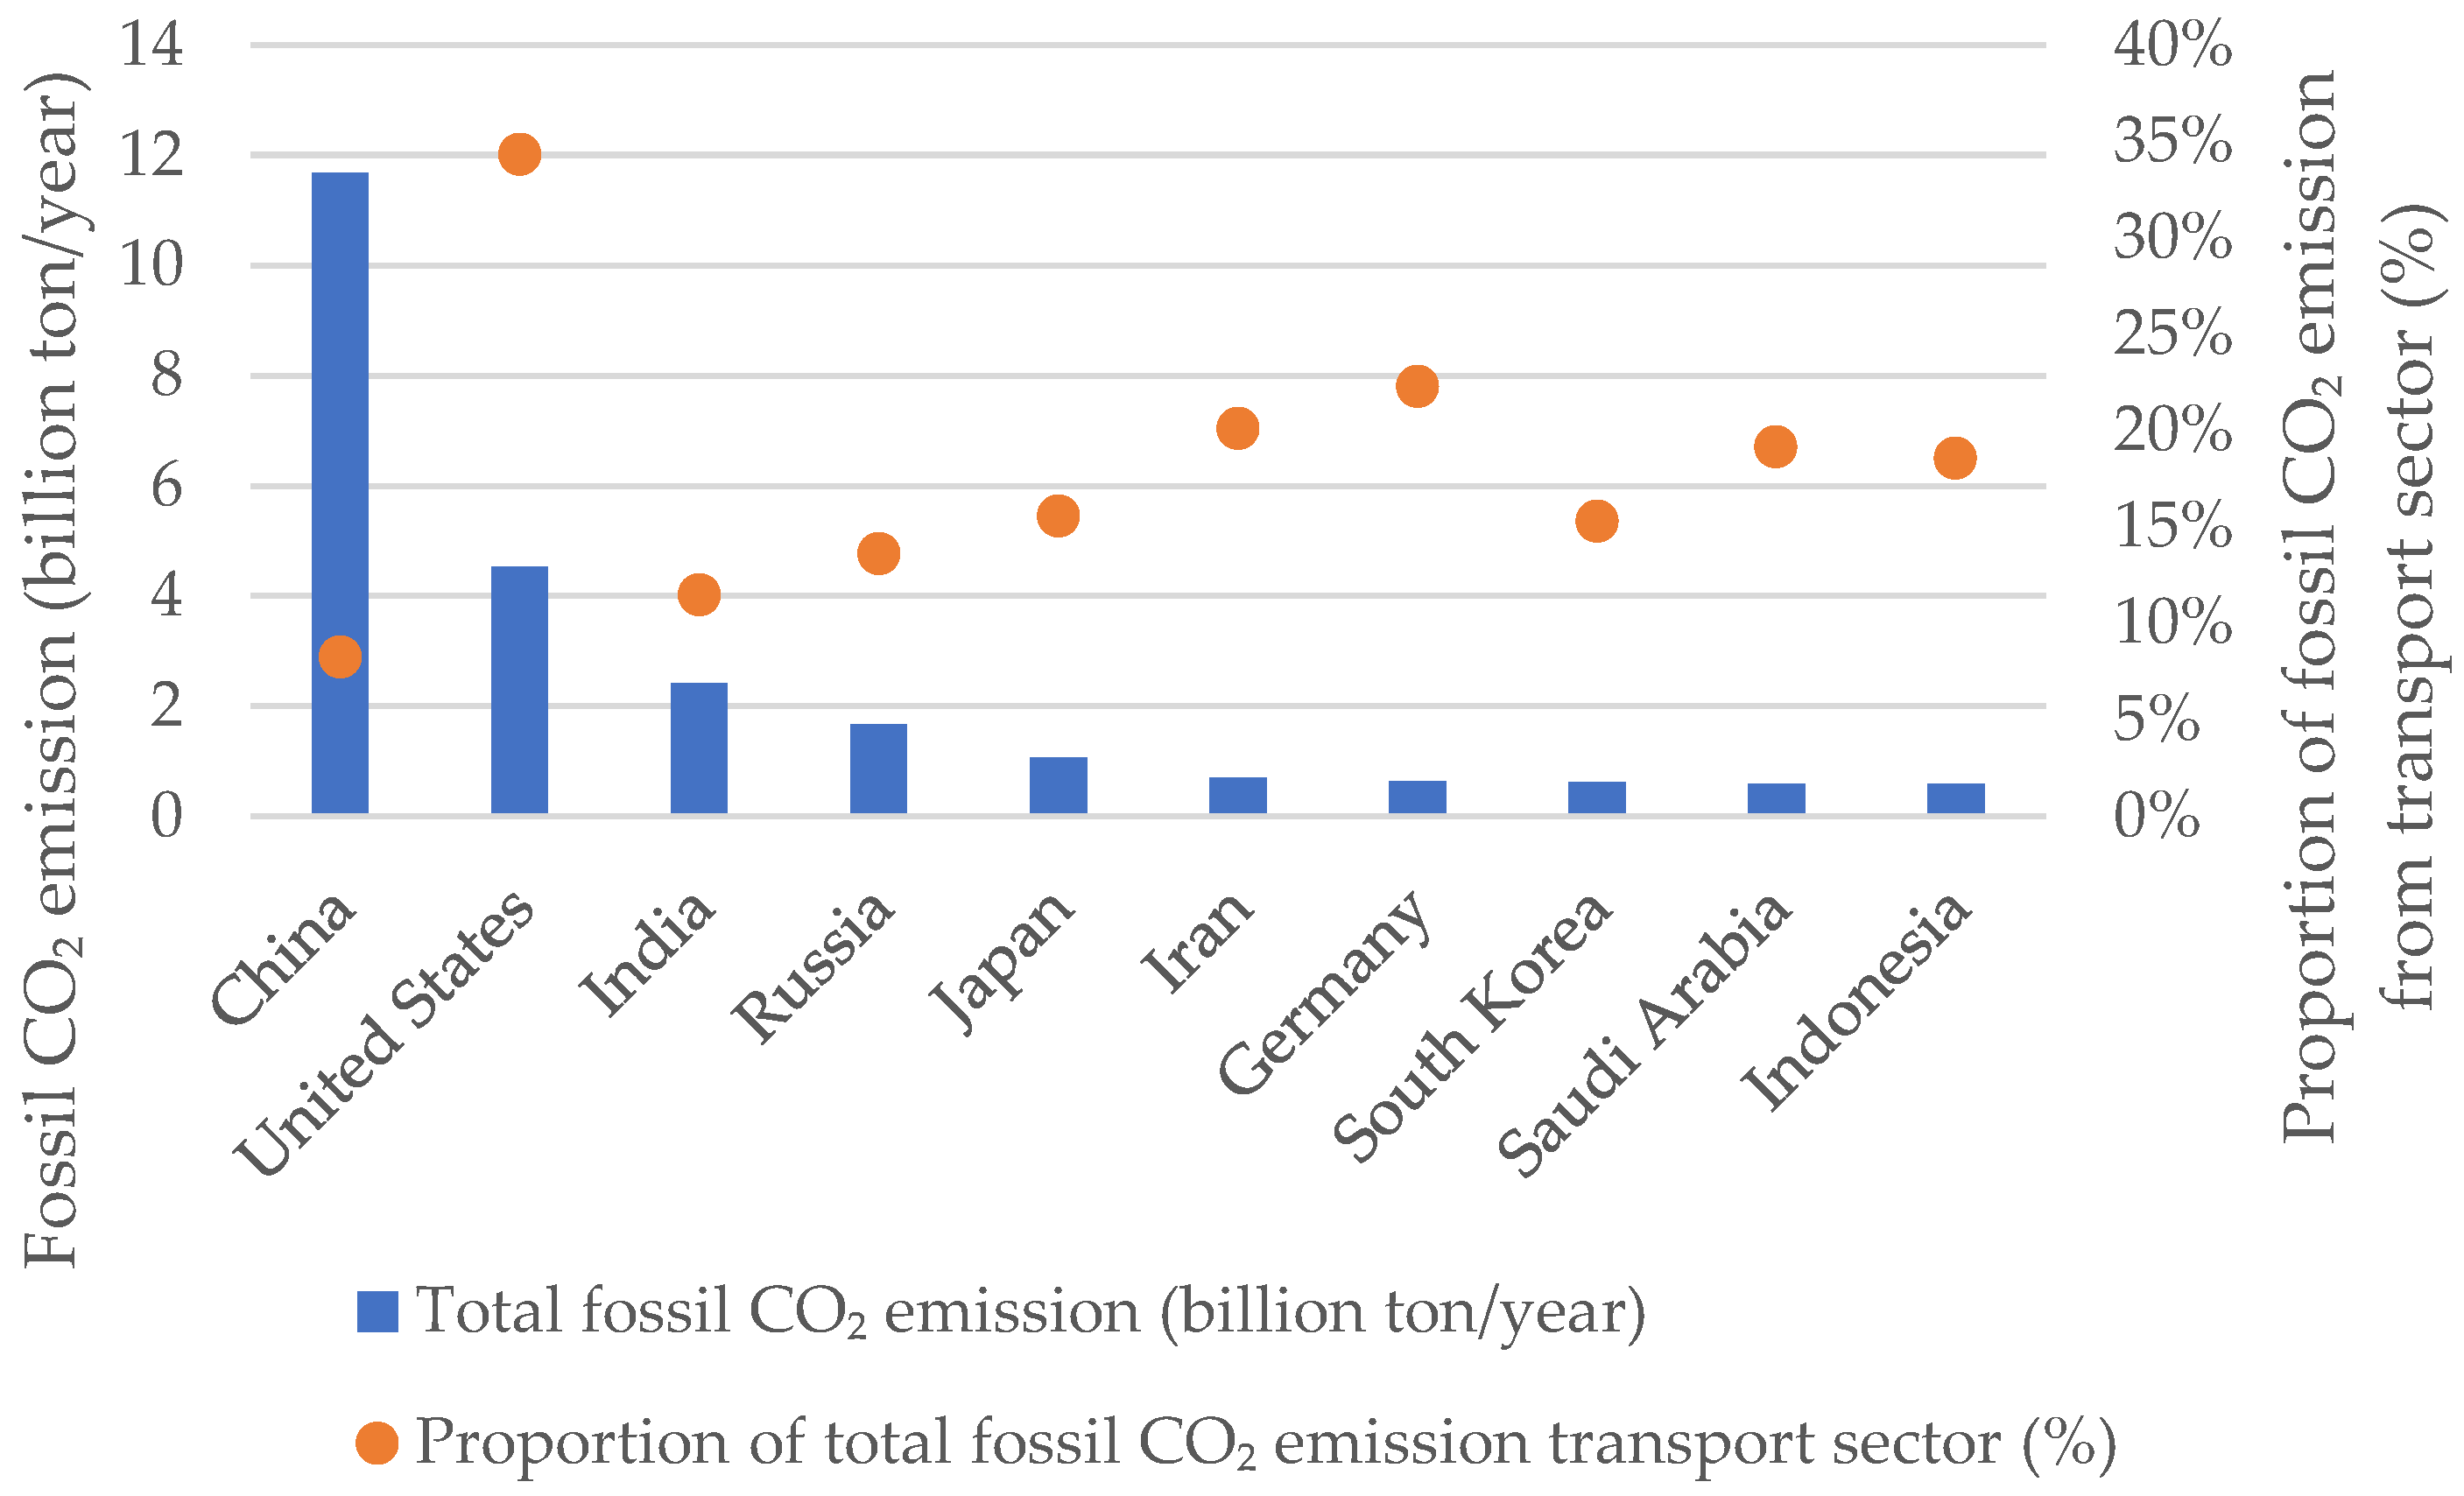
2.1. Urgent Demand for Energy Conversion in the Transport Sector

Although China is the country with the fastest EV growth, certain difficulties in achieving the goal of carbon emission reduction still exist. Figure 1 shows the total fossil CO2 emission of the largest 10 emitters worldwide in 2020. China produced nearly a triple amount of CO2 emission compared to the United States, which was the second-largest emitter. The CO2 emissions proportion of the transport sector in total CO2 emissions in China is less than that of the other largest 10 emitters, which means a huge potential for growth in CO2 emission from the transport sector in China. Therefore, CO2 emission from the transport sector is an increasingly serious problem in China. Figure 2 illustrates the growth trend in total CO2 emission and CO2 emission from the transport sector with a high growth rate in China. Under such a trend, the Chinese government focuses considerable attention on the sustainable and green development of the transport sector and has already released various relevant EV policies to realize the long-term target.

2.2. Latest EV Policies in China

For the purpose of promoting EVs, the Chinese government has implemented a series of supporting policies to accelerate EV development. In 2021, to achieve green transportation, the government has launched specific incentives, which aims to reduce the proportion of traditional ICEVs in the production and sales of new vehicles and promote the electric replacement of urban public service vehicles [1]. While in terms of supporting infrastructure for green transportation, the Chinese government has also issued supporting policies to strengthen the construction of green roads, railways, waterways, ports, airports, and charging facilities for new energy vehicles [36]. As early as 2012, the Chinese government announced that there would be more than 5 million cumulative Plug-in Hybrid Electric Vehicles (PHEVs) and BEVs by 2020 and launched an energy-saving and new energy vehicle industry development plan for 2012 to 2020 [37]. In 2020, the goals of the previous plan were completed, and a new development plan for the new energy automobile industry was released by the government, which aims to transform the automobile from a simple means of transportation to a mobile intelligent terminal energy storage unit and digital space and to drive the transformation and upgrading of energy transportation information and communication infrastructure [38]. In summary, as the EV industry rapidly develops, five types of EVs supporting policies have been recently released by the Chinese government, including promotion, fiscal support, infrastructure, charging price, technology support, and automobile score system aspects. Table 1 summarizes the policy classification and the corresponding policy interpretations.

3. Methods and Data

3.1. Goal and Scope Definition

The main goal of this study is to perform a comprehensive comparison of life cycle carbon emissions between BEVs and ICEVs considering the electricity generation mix in different regions of China.
The scope of this study covers four phases, as shown in Figure 3. (i) Material extraction and processing phase. This phase is to calculate the carbon emission from material production. (ii) Vehicle manufacturing phase. It refers to components processing and assembly. (iii) Vehicle use phase. During this phase, the energy consumption and the carbon emission between ICEVs and BEVs are quite different. (iv) Vehicle recycling phase. Dismantling vehicles is the same step for both ICEVs and BEVs and after that, battery recycling is a unique step for BEVs. This scope definition is used for calculating CO2 emissions of BEVs and ICEVs in different areas of China.

3.2. Vehicle Model

In this study, the BYD Qin-Series BEV and ICEV produced by BYD company (Shenzhen, China) are selected as the reference vehicles, which are light duty passenger vehicles (LDPVs). In 2020, the total vehicle stock was 242,910 million in China, and the LDPVs were 221.65 million, accounting for 91.25% of total vehicle stock [58]. Thus, this paper mainly focuses on the carbon emission of LDPV. Among various vehicle companies, BYD Company is one of the largest EV original equipment manufacturers in China. In 2021, the EV sales of BYD reached 584,020, becoming the top sales in China. In addition, the Qin-Series BEV ranked first in the sales of BYD EV [59], which reached 187,227. The Qin BEV is also a promotion and application EV model recommended by the Chinese government [60]. Therefore, this study adopts the parameters of this type of BEV and ICEV to provide the representative result.
The characteristics of the reference BEV and ICEV models is shown in Table 2 [60,61]. Based on the investigation of the Ministry of Industry and Information Technology (Beijing, China) [62], the fuel and electricity consumption of the Qin ICEV and BEV models are 6.2 L/100 km and 12.4 kWh/100 km, respectively. The battery type of the BEV is LiFePO4 (LFP) battery. The mainstream battery types used in EVs of China are NMC (Li(NiCoMn)O2) battery and LFP battery. According to China Automotive Battery Innovation Alliance [63], the total output of the LFP battery in 2021 of China was 125.4 GWh, accounting for 57.1% of the total battery output. While the total output of the NMC battery was 93.9 GWh, accounting for 42.7% of the total battery output. The sales of the LFP battery were 106 GWh in China in 2021, and the sales of the NMC battery were 79.6 GWh. Moreover, the loading capacity of the LFP battery was 79.8 GWh, with a 51.7% share of the total battery loading capacity, while the loading capacity of the NMC battery was 74.3 GWh, accounting for 48.1% of the total loading capacity. Therefore, the LFP battery is adopted as the representative. Considering that the cycle life of an LFP battery is more than 1000 cycles, there is no replacement of the battery by the end of the BEV life [64,65]. Additionally, the average charge and discharge efficiency of Li-ion batteries of EVs is around 85–95%, thus, the section chooses 90% as the charge and discharge efficiency [65].

3.3. Functional Unit

In an LCA study, the functional unit normalizes the database and enables the comparison of several objects [16,64]. Since the function of the vehicle is for passenger transportation, the functional unit adopted by this study is “1 passenger kilometer (pkm)” travelled by the vehicle [16]. According to some studies [17,65,66], the lifetime mileage of the passenger vehicle is generally considered to be 150,000 km. Therefore, the functional unit is based on the total driving distance of 150,000 pkm in this study. The life cycle carbon emission of BEVs and ICEVs are calculated based on the overall performance of vehicles during their lifetime.

3.4. Calculation Model

3.4.1. Electricity Carbon Intensity

The CO2 emission intensity of electricity in China has obvious regional disparity, which is mainly related to the energy structure of the region, the carbon emission factors of each power generation and the transmission efficiency. The regional electricity carbon intensity can be calculated as follows:
Cdj = βjαj/ηjT/D
ηjT/D = 1 − λjT/D
In Equations (1) and (2),
Cdj represents the electricity carbon intensity of region j,
βj = [β1 β2 β3 β4 β5] represents the electricity generation mix matrix of region j, where βi (i = 1,2,3,4,5) (%) represents the proportion of i in total power generation, and 1 denotes thermal power, 2 denotes hydropower, 3 denotes solar power, 4 denotes wind power, and 5 denotes nuclear, respectively,
αj = [α1 α2 α3 α4 α5 ]T represents the carbon emission factor matrix, where αi (i = 1,2,3,4,5) (CO2 kg/kWh) represents the carbon emission factor of power generation type i,
ηjT/D represents the transmission efficiency of the power grid,
λjT/D represents the line loss rate.

3.4.2. Life Cycle Carbon Emission of the Vehicle

Based on the research scope, the life cycle CO2 emissions of the vehicle can be calculated through Equations (3)–(14):
C V E = C M + C VA + C VU + C RE
where CVE represents the total life cycle carbon emission of the vehicle, CM represents the carbon emission of material extraction and processing, CVA represents the carbon emission of vehicle manufacturing, CVU represents the carbon emission of vehicle use, and CRE represents the carbon emission of vehicle recycling.
C M = x ( C x , f + C x , e )
where Cx,f and Cx,e represent the carbon emission from fuel consumption and electricity consumption of material x production, respectively.
C x , f = m x n [ E x , n k ( ω x , n , k α k ) ]
C x , e = m x n ( E x , n ω x , n , e 3600 C dj )
where mx (kg) is the mass of the material x, Ex,n (kJ/kg) is the energy consumption per unit x in the production process n, ωx,n,k is the proportion of fuel k consumption in Ex,n, ωx,n,e is the proportion of electricity consumption in Ex,n, and αk (CO2 kg/kJ) is the carbon emission factor of fuel k.
C VA = y ( C y , f + C y , e ) + E va 3600 C dj
where Cy,f and Cy,e represent the carbon emission from fuel consumption and electricity consumption of component y manufacturing, respectively, and Eva represents the electricity consumption of vehicle assembly.
C y , f = q [ E y , q k ( ω y , q , k α k ) ]
C y , e = q ( E y , q ω y , q , e 3600 C dj )
where Ey,q (kJ) is the energy consumption of component y in the manufacturing process q, ωy,q,k is the proportion of fuel consumption in Ey,q and ωy,q,e is the proportion of electricity consumption in Ey,q.
C VU , EV = dP E C dj 100 C E
where PE (kWh/km) is the electricity consumption per 100 km of BEV, CE is the charging efficiency, and d (km) is the total driving distance of the BEV.
C VU , ICEV = dF k 100 ( ρ k α k LHV k + C k )
where Fk (L) is the fuel consumption per 100 km of ICEV, ρk is the density of fuel k, LHVk (kJ/kg) is the lower heat value of the fuel, and Ck is the carbon emission per unit k in the fuel production.
C RE = C re , f + C re , e
where Cre,f and Cre,e represent the carbon emission from fuel consumption and electricity consumption in the vehicle recycling, respectively.
C re , f = x [ m x E re , x k ( ω re , x , k α k ) ]
C re , e = [ E vd 3600 + x ( m x E re , x ω re , x , e 3600 ) ] C dj
where Ere,x (kJ/kg) is the energy consumption per unit material x in the recycling phase, ωre,x,k is the proportion of fuel consumption in Ere,x, ωre,x,e is the proportion of electricity consumption in Ere,x, and Evd is the energy consumption of vehicle dismantling.

3.5. Life Cycle Inventory

Based on the research scope, this section presents the data inventory built for the BEV and ICEV. The data inventories are collected from various sources, including the Greenhouse Gases, Regulated Emissions, and Energy Use in Transportation (GREET) model [67], which provides a comprehensive database on the carbon emission of vehicles, the academic literature, the statistical yearbooks, the reports, and the investigations on the domestic enterprise. The data inventory mainly involves raw material production data, carbon emission factor, energy consumption data and regional electricity generation mix. The data sources are shown in Table 3.

3.5.1. Material Extraction and Processing

Material extraction and processing refers to the acquisition and processing of raw materials used in the construction of automobile components. The main components of the vehicle include the vehicle body, chassis, power system, and transmission system, each of which consists of multiple materials. Notably, the small mass material used in vehicle production is ignored in the calculation. Automobile materials mainly include steel, iron, aluminum, copper, and other metals, as well as glass and plastic. For BEVs, the key technology is around the battery that contains a large number of high-economic value rare earth elements and non-ferrous metals (i.e., cobalt, lithium, nickel, aluminum). The LFP battery consists of a cathode and anode, separator, electrolyte, packaging, and battery management system. The main material of the cathode is LiFePO4. Making one gram LiFePO4 needs 0.23 g LiCO3 and 3 kJ electricity consumption [69]. The anode production needs graphite coated on copper foil and binder. The separator is made of polypropylene and polyethylene. The electrolyte is mainly made of lithium hexafluorophosphate and dimethyl carbonate. The packaging is made of polypropylene and aluminum foil. The battery management system includes a wire, circuit board, and sensor. Based on the GREET model, the materials inventory of the vehicles is given in Table A1. Although the mass distribution data are imported from the GREET model, which is estimated through the reports, investigations, literature, and data in the USA, they can also be used for vehicles in China after modifying the total weight [65]. For the material extraction and processing phase, the material production process and transportation technologies of China are considered. Since only a small number of regions are engaged in ore mining in China, the regional disparity of carbon emissions in the material extraction and processing phase is not considered. According to existing literature [70,71] and the GREET model, the energy consumption and carbon emission factor of material production are given in Table A2. The carbon emission factors of different energy are shown in Table A3.

3.5.2. Vehicle Manufacturing

The vehicle manufacturing phase includes the manufacture of vehicle components and assembly. Based on the GREET model, the energy consumption inventory of the vehicle manufacturing (without battery) is shown in Table A4. For the battery, the manufacturing phase includes cell production and module assembly. The manufacturing energy consumption per kWh of the battery is shown in Table A5. Additionally, the energy consumption of battery assembly is proportional to the mass of the battery, which is 2.67 MJ/kg [74].

3.5.3. Vehicle Use

For the vehicle use phase of BEVs, the carbon emission is mainly from the electricity generation. Due to the significant regional characteristics of energy distribution in China, it is not feasible to adopt the national average value of energy structure to evaluate the electricity carbon intensity. According to the National Bureau of Statistics, the total electricity production was 7,486,600 GWh in China in 2019 [58], where thermal power contributes the major proportion (69.7%) of the total electricity production mix, followed by hydropower (17.4%), wind power (5.4%), nuclear (4.7%), and solar power (2.8%). Based on the localized data of China in 2019 [75], the regional electricity generation mix of 30 regions is obtained, as shown in Table 4.
The carbon emission factors of different power source are given in Table A6 and Table A7. For thermal power, different thermal power resources and technologies result in the difference in regional carbon emission factors of thermal power. For clean energy resources, all regions adopt the average value as the carbon intensity to provide general results. Although the absolute emission factors may fluctuate throughout various studies, the relative magnitude of carbon emissions between different power generation methods is consistent [79].
According to Table 2, the electricity consumption of the reference BEV and the fuel consumption of the reference ICEV are 20,500 kWh and 9300 L, respectively. In addition, the carbon emission produced by fuel production is calculated as 0.57 kg CO2/L per liter based on the common process and localized data in China.

3.5.4. Vehicle Recycling

In the recycling phase, the vehicles need to be dismantled firstly and then the metal and non-metallic materials of each component separated and purified. Some of the raw materials of the vehicle can be recycled after the previous step. Since the power battery of BEVs contains heavy metal electrolytes and other pollutants, quantification of energy consumption and carbon emission associated with the vehicle recycling phase is divided into non-battery recycling and battery recycling. For the non-battery parts, the metals are recycled, while the non-metallic materials such as plastic and glass are landfilled or burnt as waste based on the recycling method widely used in Chinese domestic dismantling enterprises [78]. For the LFP battery, the mainstream recycling technology in China is hydrometallurgical technology, which is used to recover lithium carbonate and iron phosphate [64]. The energy consumption of vehicle recycling phase is given in Table A8.

4. Results and Discussion

4.1. Regional Electricity Carbon Intensity

When evaluating regional electricity CO2 intensity, it is assumed that the electricity production meets the demand, and the electricity exchange among different regions is not considered. Combined with the regional electricity generation mix and using Equations (1) and (2), the regional electricity carbon intensity in 2019 is shown in Table 5 from high to low. In these regions, it can be seen that electricity carbon intensity varies from region to region due to the difference in the electricity generation mix and line loss rate.
Figure 4 indicates the regional disparity in electricity carbon intensity caused by the difference in the electricity generation mix in 2019. It divides electricity carbon intensity into 6 levels and shows the details of the electricity generation mix in 6 representative regions in these levels. According to the analysis of these regions with a relatively large amount of electricity generation, it shows a big difference in the electricity generation mix and the regional carbon intensity. For instance, Sichuan and Hubei have abundant hydropower resources, and their electricity carbon intensity are 0.1811 kgCO2/kWh and 0.4738 kgCO2/kWh, respectively. Guangdong has almost a quarter of its total electricity generation by nuclear power and its electricity carbon intensity is 0.6311 kgCO2/kWh. Based on the analysis and calculation of the electricity generation mix and the regional electricity carbon intensity, the study explores a comprehensive LCA method to evaluate the real energy consumption and carbon emission regarding vehicles.

4.2. Life Cycle Carbon Emission of Vehicles

Based on the goal and scopes, the life cycle CO2 emissions of a BEV and ICEV considering the electricity production mix in different regions of China are presented in Table 6.
The results reveal that the regional disparity of carbon emissions from vehicles is caused by the difference in electricity generation mix, thermal power generation technology, and electricity transmission efficiency. For instance, based on the LCA method, an BEV can reduce CO2 emission by 18.32 t compared to an ICEV in Yunnan, and increase CO2 emission by 3.48 t in Beijing. The results regarding the difference among these three aspects can be listed as follows.
Firstly, regions with higher penetration of thermal power produce more carbon emissions. The electricity carbon intensity of the regions with over 80% penetration of thermal power generation is higher than 0.7 kg CO2/kWh. As a result, the effectiveness of the carbon emission reduction through the promotion of EVs is weakened in the regions with high penetration of thermal power. The region with high penetration of renewable energy has a relatively lower electricity carbon intensity and a better environmental performance in carbon emission reduction. For instance, the electricity carbon intensity of regions with over 35% penetration of renewable generation is lower than 0.6 kg CO2/kWh, and the electricity carbon intensity of regions with over 50% penetration of renewables generation is lower than 0.2 kg CO2/kWh. It can be seen that the electricity carbon intensity in Yunnan is 0.1365 kg CO2/kWh due to the high penetration of renewable energy (90.5%). Specifically, Figure 5 presents the carbon emissions from BEVs and ICEVs, and the proportion of thermal power in the seven regions with high carbon emissions and in the seven regions with low carbon emissions, respectively. According to the comparison of carbon emissions from vehicles among these regions, the results demonstrate the influence of the proportion of thermal power on vehicle carbon emissions. BEVs produce fewer carbon emissions than ICEVs in the regions with a low proportion of thermal power but produce more carbon emissions in the regions with a high proportion of thermal power.
Secondly, the lack of thermal power generation technology results in an increase in carbon emissions. For instance, the penetration of thermal power in Liaoning (73.8%) is lower than that in Henan and Anhui (91.5% and 95.2%); however, due to the higher carbon intensity of thermal power in Liaoning (1.0826 kg CO2/kWh), the electricity carbon intensity in Liaoning (0.8456 kg CO2/kWh) is higher than that in Henan and Anhui. The reduction in carbon emission of a BEV in Liaoning (0.213 t) is lower than that in Henan and Anhui.
Finally, electricity transmission efficiency is an influential factor in carbon emissions. The electricity carbon emission varies due to the regional difference in line loss rates. For instance, the penetration of thermal power in Beijing (97.4%) is lower than that in Tianjin (98.4%); however, the carbon emission in Beijing is higher than that in Tianjin due to a higher line loss rate.
Figure 6 shows the detail of carbon emissions from BEVs and ICEVs in four phases of LCA in the 14 selected regions. In regions with a high proportion of thermal power, major carbon emissions from BEVs are produced in the vehicle use phase, which nearly accounts for 45% of total life cycle emissions. Thus, the optimization of the electricity generation mix is the top priority in these regions. Meanwhile, in regions with a low proportion of thermal power, major carbon emissions from BEVs are produced in the material extraction and processing phase, and the vehicle manufacturing phase, which accounts for around 50~75%. Therefore, the improvement of vehicle production technology is the top priority in these regions. Furthermore, carbon emissions in the vehicle use phase and the vehicle recycling phase from BEVs are lower than those from ICEVs (less 4.6 t~22.1 t). Nevertheless, due to the involvement of batteries in the material extraction and processing phase, and vehicle manufacturing phase, carbon emissions from BEVs are higher than those from ICEVs in the two phases, which weakens the effectiveness of promoting BEVs in the life cycle carbon emission.

4.3. Policy Recommendation

Although the Chinese government has launched various policies to promote EVs, a significant issue identified is the limited consideration of renewable energy use for the production and charging of EVs. Therefore, based on this study, we recommend that specific incentive policies for renewable energy use for EVs could be implemented. According to the policy classification in Section 2, we present the corresponding support policies for policymakers. (1) Promotion: the government encourages regions with high penetration of renewable energy to promote EVs and regions with low penetration of renewable energy to develop renewable energy rather than to promote EVs, and issues renewable energy traceability certificates for OEMs and vehicle owners. Therefore, optimization of energy structure and increase of renewable energy use by releasing energy-related policies in the transport sector is an effective means to reduce CO2 emission [8]. (2) Fiscal support: BEV owners in the regions with high penetration of renewable energy, who mainly use renewable energy for charging, enjoy a discount for the next EV purchase. (3) Infrastructure support: charging station in the regions with high penetration of renewable energy obtains a further tax subsidy or fiscal support from the central government. (4) Charging price: the BEVs charged by renewable energy enjoy a lower charging price. (5) Technology support: the technical breakthroughs of reducing line loss rate and energy consumption of battery production are required, and the technology of increasing the lifetime mileage and the development of vehicle lightweight technology are effective ways to enhance the carbon reduction effect of BEVs. (6) Vehicle score system: as the plan of green electricity trading promotion has been released by the Chinese government [80], the OEM, which uses renewable energy for the production of EVs, obtains more positive scores in the vehicle score system and carbon quota. These policies could further help to reduce the carbon emission from EVs.

5. Conclusions

This study has compared the energy consumption and the carbon emission of BEVs and ICEVs. It indicates that the promotion of BEVs helps to reduce carbon emissions in most regions in China except Beijing, Heilongjiang, Jilin, Tianjin, Shandong, Shanxi, and Hebei, which demonstrates that the development of BEVs contributes to achieving carbon neutrality. However, the effectiveness of the emission reduction dramatically varies in those regions in China due to the difference in electricity generation mix, thermal power generation technology, and electricity transmission efficiency. Therefore, specifically targeted promotion needs to be adopted in different regions. The regions with low carbon emissions from vehicles should strongly support the promotion of BEVs. While the regions with high carbon emissions from vehicles should increase the proportion of renewable generation as a priority, which can optimize their electricity generation mix. In addition, releasing supporting policies regarding the development of renewable generation and power exchange of different power grids by governments, and improving power generation technology and electricity transmission can reduce electricity carbon intensity. Considering the high carbon emission from batteries in material extraction and processing, and vehicle manufacturing phase, OEMs of BEVs need to improve their battery production technology and extend battery life to achieve the maximum reduction in carbon emission.

Author Contributions

Conceptualization and methodology, B.T. and Y.X.; analysis, B.T.; validation Y.X.; data curation, M.W.; writing—original draft preparation, Y.X.; writing—review and editing, B.T.; supervision, B.T., Y.X. and M.W. All authors have read and agreed to the published version of the manuscript.

Funding

This research received no external funding.

Institutional Review Board Statement

Not applicable.

Informed Consent Statement

Not applicable.

Data Availability Statement

Not applicable.

Acknowledgments

The authors would like to acknowledge and thank the State Grid Sichuan Electric Power Company in Chengdu, China for their support.

Conflicts of Interest

The authors declare no conflict of interest.

Appendix A

Table A1. Materials inventory of the vehicles (unit: kg).
MaterialsBEVICEV
Vehicle Body
Steel477.97459.11
Iron4.929.84
Aluminum4.927.87
Copper13.367.21
Glass45.6945.91
Plastic127.22104.94
Rubber3.517.21
Others25.3013.77
Chassis
Steel303.19353.45
Iron23.1828.50
Aluminum3.314.25
Copper8.469.36
Plastic12.147.66
Rubber15.4518.71
Others2.213.40
Transmission
Steel23.7625.47
Iron3.174.03
Aluminum12.6711.58
Motor
Steel22.39
Aliminum25.10
Copper10.55
Others6.31
Power electronics
Steel3.38
Aluminum31.73
Copper5.55
Plastic16.10
Rubber2.50
Others8.39
LFP Battery
LiFePO489.66
Graphite40.76
Steel4.08
Aluminum134.49
Copper36.68
Plastic28.53
Electrolyte40.76
Others32.60
Engine
Steel13.44
Iron12.97
Aluminum79.84
Copper1.53
Plastic3.77
Rubber3.77
Others2.59
Engine Accessory
Steel37.06
Iron10.60
Aluminum9.84
Copper0.68
Plastic22.39
Others4.24
Table A2. Energy consumption and carbon emission factor of material production.
MaterialEnergy Consumption (MJ/t)Carbon Emission Factor
(CO2 kg/kg)
CoalCrude OilNatural GasCokeElectricity
Steel21,0001125937811,11822342.148
Iron2961801421628718730.90
Aluminum57,40434296088031,9466.536
Copper37027378129455938812.20
Glass5270018,97207781.67
Plastic739379617,392022383.19
Rubber97913,66227,00206243.70
Others15,940360210,655184551752.70
Table A3. Carbon emission factor of different energy.
FuelLower Heat ValueCarbon Emission Factor (kg CO2/kJ)
Coal20.908 MJ/kg87.3
Coke28.435 MJ/kg95.7
Coke oven gas16.726 MJ/m337.3
Crude oil41.816 MJ/kg71.1
Gasoline43.070 MJ/kg67.5
Diesel42.652 MJ/kg72.6
Fuel oil41.816 MJ/kg75.5
Natural gas38.931 MJ/m354.3
Table A4. Energy consumption inventory in the vehicle manufacturing phase (without battery).
ComponentsBEVICEV
Electricity (kWh)Natural Gas (MJ)Diesel (kg)Electricity (kWh)Natural Gas (MJ)Diesel (kg)
Body and chassis9305.78809.5
Motor188.7147.430.47
Power electronics60
Engine429.2
Engine accessory 109.4
Transmission98.25162.960.09197.1423.30.21
Vehicle assembly3038.8 2671.7
Table A5. Energy consumption inventory of the battery.
ComponentEnergy Consumption (MJ/kWh)
ElectricityCoalCrude OilNatural Gas
Cathode0.020.140.020.44
Anode00.100.020.54
Separator00.0200.02
Electrolyte112.34000
Packaging2.423.40.5633.2
BMS5.74000
Battery package147000
Table A6. Carbon emission factors of thermal power in different regions.
Power Grid DivisionRegion (Province and City)Carbon Emission Factor of Thermal Power (kg CO2/kWh)
Western power gridBeijing, Tianjin, Hebei, Shanxi, Shandong, Inner Mongolia0.9419
Northeastern power gridLiaoning, Jilin, Heilongjiang1.0826
Eastern power gridShanghai, Jiangsu, Zhejiang, Anhui, Fujian0.7921
Central power gridHenan, Hubei, Hunan, Jiangxi, Sichuan, Chongqing0.8587
Northwestern power gridShaanxi, Gansu, Qinghai, Ningxia, Xinjiang0.8922
Southern power gridGuangdong, Guangxi, Yunnan, Guizhou, Hainan0.8042
Table A7. Carbon emission factors of clean energy resources.
Electricity Generation TypesCarbon Emission Factor (kg CO2/kWh)
Hydropower0.061
Solar power0.089
Wind power0.011
Nuclear0.078
Table A8. Energy consumption of the vehicle recycling phase.
PhasesBEVICEV
Electricity (kWh)Natural Gas (m3)Coal (kg)Electricity (kWh)Natural Gas (m3)Coal (kg)
Vehicle assembly627.3 618.08
Non-battery parts11149.139.791170.811.1920.64
LFP battery62.261.33

References

  1. State Council of China. Notice on Issuing the Action Plan of Achieving Carbon Emission to a Peak before 2030. Beijing, 2021. Available online: http://www.gov.cn/zhengce/content/2021-10/26/content_5644984.htm (accessed on 19 December 2021).
  2. State Council of China. Opinions on Fully, Accurately and Comprehensively Implementing the New Development Concept to Achieve Carbon Peak and Carbon Neutral Work. Beijing, 2021. Available online: http://www.gov.cn/gongbao/content/2021/content_5649728.htm (accessed on 19 December 2021).
  3. Young, D.; Bistline, J. The costs and value of renewable portfolio standards in meeting decarbonization goals. Energy Econ. 2018, 73, 337–351. [Google Scholar] [CrossRef]
  4. US EPA. Regulatory Impact Analysis for the Clean Power Plan Final Rule; U.S. Environmental Protection Agency, Office of Air and Radiation, Office of Air Quality Planning and Standards: Research Triangle Park, NC, USA, 2015.
  5. Ministry for the Environment. Greenhouse Gas Emissions Targets and Reporting. Wellington, New Zealand, 2021. Available online: https://environment.govt.nz/what-government-is-doing/areas-of-work/climate-change/emissions-reduction-targets/greenhouse-gas-emissions-targets-and-reporting/ (accessed on 19 December 2021).
  6. Department of the Prime Minister and Cabinet. Fact Sheet—Australia’s 2030 Climate Change Target. Canberra, Australia, 2015. Available online: https://pmc.gov.au/resource-centre/domestic-policy/fact-sheet-australia%E2%80%99s-2030-climate-change-target (accessed on 19 December 2021).
  7. Shafique, M.; Azam, A.; Rafiq, M.; Luo, X. Evaluating the Relationship between Freight Transport, Economic Prosperity, Urbanization, and CO2 Emissions: Evidence from Hong Kong, Singapore, and South Korea. Sustainability 2020, 12, 10664. [Google Scholar] [CrossRef]
  8. Shafique, M.; Azam, A.; Rafiq, M.; Luo, X. Investigating the nexus among transport, economic growth and environmental degradation: Evidence from panel ARDL approach. Transp. Policy 2021, 109, 61–71. [Google Scholar] [CrossRef]
  9. U.S. Energy Information Administration. International Energy Outlook 2021. Available online: https://www.eia.gov/outlooks/ieo/ (accessed on 19 December 2021).
  10. European Commission. Vehicle Categories 2020. Available online: https://ec.europa.eu/growth/sectors/automotive/vehicle-categories_en (accessed on 19 December 2021).
  11. Teixeira, A.C.R.; Sodre, J.R. Simulation of the impacts on carbon dioxide emissions from replacement of a conventional Brazilian taxi fleet by electric vehicles. Energy 2016, 115, 1617–1622. [Google Scholar] [CrossRef]
  12. Wang, H.; Zhang, X.; Ouyang, M. Energy consumption of electric vehicles based on real-world driving patterns: A case study of Beijing. Appl. Energy 2015, 157, 710–719. [Google Scholar] [CrossRef]
  13. Hooftman, N.; Messagie, M.; Mierlo, J.V.; Coosemans, T. A review of the European passenger car regulations—Real driving emissions vs local air quality. Renew. Sustain. Energy Rev. 2018, 86, 1–21. [Google Scholar] [CrossRef]
  14. Monninghoff, M.S.; Bey, N.; Nørregaard, P.U.; Niero, M. Integration of energy flow modelling in life cycle assessment of electric vehicle battery repurposing: Evaluation of multi-use cases and comparison of circular business models. Resour. Conserv. Recycl. 2021, 174, 105773. [Google Scholar] [CrossRef]
  15. Lajunen, A.; Lipman, T. Life cycle cost assessment and carbon dioxide emissions of diesel, natural gas, hybrid electric, fuel cell hybrid and electric transit buses. Energy 2016, 106, 329–342. [Google Scholar] [CrossRef]
  16. Shafique, M.; Luo, X. Environmental life cycle assessment of battery electric vehicles from the current and future energy mix perspective. J. Environ. Manag. 2022, 303, 114050. [Google Scholar] [CrossRef]
  17. Shafique, M.; Azam, A.; Rafiq, M.; Luo, X. Life cycle assessment of electric vehicles and internal combustion engine vehicles: A case study of Hong Kong. Res. Transp. Econ. 2021, 101112. Available online: https://www.sciencedirect.com/science/article/pii/S0739885921000846 (accessed on 19 December 2021).
  18. International Energy Agency. Global EV Outlook 2021. Available online: https://www.iea.org/reports/global-ev-outlook-2021 (accessed on 19 December 2021).
  19. Shi, S.; Zhang, H.; Yang, W.; Zhang, Q.; Wang, X. A life-cycle assessment of battery electric and internal combustion engine vehicles: A case in Hebei Province, China. J. Clean Prod. 2019, 228, 606–618. [Google Scholar] [CrossRef]
  20. Zhou, B.; Wu, Y.; Zhou, B.; Wang, R.; Ke, W.; Zhang, S.; Hao, J. Real-world performance of battery electric buses and their life-cycle benefits with respect to energy consumption and carbon dioxide emissions. Energy 2016, 96, 603–613. [Google Scholar] [CrossRef]
  21. Gong, H.; Zou, Y.; Yang, Q.; Fan, J.; Sun, F.; Goehlich, D. Generation of a driving cycle for battery electric vehicles: A case study of Beijing. Energy 2018, 150, 901–912. [Google Scholar] [CrossRef]
  22. Wang, H.; Ouyang, M. Transition strategy of the transportation energy and powertrain in China. Energy Policy 2007, 35, 2313–2319. [Google Scholar] [CrossRef]
  23. Hoque, N.; Biswas, W.; Mazhar, I.; Howard, I. Environmental Life Cycle Assessment of Alternative Fuels for Western Australia’s Transport Sector. Atmosphere 2019, 10, 398. [Google Scholar] [CrossRef] [Green Version]
  24. Rangaraju, S.; Vroey, L.D.; Messagie, M.; Mertens, J.; Mierlo, J.V. Impacts of electricity mix, charging profile, and driving behavior on the emissions performance of battery electric vehicles: A Belgian case study. Appl. Energy 2015, 148, 496–505. [Google Scholar] [CrossRef]
  25. Nematchoua, M.K.; Sevin, M.; Reiter, S. Towards Sustainable Neighborhoods in Europe: Mitigating 12 Environmental Impacts by Successively Applying 8 Scenarios. Atmosphere 2020, 11, 603. [Google Scholar] [CrossRef]
  26. Cox, B.; Mutel, C.L.; Bauer, C.; Beltran, A.M.; Vuuren, D.P. Uncertain Environmental Footprint of Current and Future Battery Electric Vehicles. Environ. Sci. Technol. 2018, 52, 4989–4995. [Google Scholar] [CrossRef]
  27. Zhao, E.; May, E.; Walker, P.D.; Surawski, N.C. Emissions life cycle assessment of charging infrastructures for electric buses. Sustain. Energy Technol. Assess. 2021, 48, 101605. [Google Scholar] [CrossRef]
  28. Zeng, J.; Liu, L.; Liang, X.; Chen, S.; Yuan, J. Evaluating fuel consumption factor for energy conservation and carbon neutral on an industrial thermal power unit. Energy 2021, 232, 120887. [Google Scholar] [CrossRef]
  29. Doucette, R.T.; Mcculloch, M.D. Modeling emissions from battery electric vehicles given the generation mixes of different countries. Energy Policy 2011, 39, 803–811. [Google Scholar] [CrossRef]
  30. Sheng, M.S.; Sreenivasan, A.V.; Sharp, B.; Du, B. Well-to-wheel analysis of greenhouse gas emissions and energy consumption for electric vehicles: A comparative study in Oceania. Energy Policy 2021, 158, 112552. [Google Scholar] [CrossRef]
  31. Bauer, C.; Hofer, J.; Althaus, H.; Duce, A.D.; Simons, A. The environmental performance of current and future passenger vehicles: Life cycle assessment based on a novel scenario analysis framework. Appl. Energy 2015, 157, 871–883. [Google Scholar] [CrossRef]
  32. Tagliaferri, C.; Evangelisti, S.; Acconcia, F.; Domenech, T.; Ekins, P.; Barletta, D.; Lettieri, P. Life cycle assessment of future electric and hybrid vehicles: A cradle-to-grave systems engineering approach. Chem. Eng. Res. Des. 2016, 112, 298–309. [Google Scholar] [CrossRef]
  33. Sacchi, R.; Bauer, C.; Cox, B.L. Does Size Matter? The Influence of Size, Load Factor, Range Autonomy, and Application Type on the Life Cycle Assessment of Current and Future Medium- and Heavy-Duty Vehicles. Environ. Sci. Technol. 2021, 55, 5224–5235. [Google Scholar] [CrossRef] [PubMed]
  34. Ang, B.W.; Su, B. Carbon emission intensity in electricity production: A global analysis. Energy Policy 2016, 94, 56–63. [Google Scholar] [CrossRef]
  35. Ocko, I.B.; Hamburg, S.P. Climate Impacts of Hydropower: Enormous Differences among Facilities and over Time. Environ. Sci. Technol. 2019, 53, 14070–14082. [Google Scholar] [CrossRef]
  36. State Council of China. Guiding Opinions on Accelerating the Establishment of an Economic System for Green, Low-Carbon and Circular Development. Available online: http://www.gov.cn/zhengce/content/2021-02/22/content_5588274.htm (accessed on 18 December 2021).
  37. State Council of China. Energy Saving and New Energy Vehicle Industry Development Plan (2012 to 2020). Beijing, 2012. Available online: http://www.nea.gov.cn/2012-07/10/c_131705726.htm (accessed on 18 December 2021).
  38. State Council of China. Notice on the Issuing of New Energy Vehicle Industry Development Plan (2021–2035). Beijing, 2020. Available online: http://www.gov.cn/zhengce/content/2020-11/02/content_5556716.htm (accessed on 18 December 2021).
  39. State Council of China. Three-Year Action Plan to Fight Air Pollution. Beijing, 2018. Available online: http://www.gov.cn/zhengce/content/2018-07/03/content_5303158.htm (accessed on 18 December 2021).
  40. Ministry of Public Security of China. Notice on Further Standardizing and Optimizing City Distribution Vehicle Traffic Management. Beijing, 2018. Available online: https://www.mps.gov.cn/ (accessed on 18 December 2021).
  41. Ministry of Finance of China; Ministry of Industry and Information Technology of China; Ministry of Transport of China; National Development and Reform Commission of China. Notice on Supporting the Promotion and Application of New Energy Buses. Beijing, 2019. Available online: http://www.gov.cn/xinwen/2019-05/09/content_5389902.htm (accessed on 18 December 2021).
  42. Ministry of Finance of China; Ministry of Science and Technology of China; Ministry of Industry and Information Technology of China; National Development and Reform Commission of China. Notice on Adjusting Fiscal Subsidy Policies for the Promotion and Application of New Energy Vehicles. Beijing, 2016. Available online: http://www.gov.cn/xinwen/2016-12/30/content_5154971.htm#allContent (accessed on 18 December 2021).
  43. Ministry of Finance of China; Ministry of Science and Technology of China; Ministry of Industry and Information Technology of China; National Development and Reform Commission of China. Notice on Adjusting and Improving Fiscal Subsidy Policies for the Promotion and Application of New Energy Vehicles. Beijing, 2018. Available online: http://jjs.mof.gov.cn/zhengcefagui/201802/t20180213_2815574.htm (accessed on 18 December 2021).
  44. Ministry of Finance of China; State Taxation Administration; Ministry of Industry and Information Technology of China; Ministry of Science and Technology of China. Announcement Vehicle Purchase Tax New Energy Automobiles. Beijing, 2017. Available online: http://www.chinatax.gov.cn/n810341/n810755/c2985330/content.html (accessed on 18 December 2021).
  45. Ministry of Finance of China; Ministry of Industry and Information Technology of China; Ministry of Science and Technology of China; National Development and Reform Commission of China. Notice on Further Improving Fiscal Subsidy Policies for Promotion and Application of New Energy Vehicles. Beijing, 2019. Available online: http://www.gov.cn/xinwen/2019-03/27/content_5377123.htm (accessed on 18 December 2021).
  46. Ministry of Finance of China; State Taxation Administration; Ministry of Industry and Information Technology of China; Ministry of Transport of China. Notice on the Preferential Policy of Vehicle Tax for New Energy Vehicles and Vessels Energy-Saving. Beijing, 2018. Available online: http://www.gov.cn/xinwen/2018-08/04/content_5311722.htm (accessed on 18 December 2021).
  47. Ministry of Finance of China; Ministry of Industry and Information Technology of China; Ministry of Science and Technology of China; National Development and Reform Commission of China. Notice on Improving Fiscal Subsidy Policies for the Promotion and Application of New Energy Vehicles. Beijing, 2020. Available online: http://www.gov.cn/zhengce/zhengceku/2020-04/23/content_5505502.htm (accessed on 18 December 2021).
  48. Ministry of Finance of China; Ministry of Industry and Information Technology of China; Ministry of Science and Technology of China; National Development and Reform Commission of China. Notice on Further Improving Fiscal Subsidy Policies for the Promotion and Application of New Energy Vehicles. Beijing, 2020. Available online: http://www.gov.cn/zhengce/zhengceku/2020-12/31/content_5575906.htm (accessed on 18 December 2021).
  49. National Development and Reform Commission of China; National Energy Administration; Ministry of Industry and Information Technology of China; Ministry of Housing and Urban-Rural Development of China. Guide on Electric Vehicle Charging Infrastructure Development (2015–2020). Beijing, 2015. Available online: http://www.gov.cn/zhengce/2015-10/09/content_5076250.htm (accessed on 18 December 2021).
  50. National Energy Administration. Notice on the Issuance of Guidelines on Energy Work in 2021. Beijing, 2021. Available online: http://www.nea.gov.cn/2021-04/22/c_139898478.htm (accessed on 18 December 2021).
  51. National Development and Reform Commission of China. Notice on Issues Related to Electricity Pricing Policy for Electric Vehicles. Beijing, 2014. Available online: http://www.gov.cn/xinwen/2014-07/30/content_2726804.htm (accessed on 18 December 2021).
  52. Ministry of Industry and Information Technology of China. New Energy Vehicle Production Enterprises and Products Access Management Regulations. Beijing, 2017. Available online: http://www.gov.cn/gongbao/content/2017/content_5216432.htm (accessed on 18 December 2021).
  53. Ministry of Industry and Information Technology of China. Decision on Amending the New Energy Vehicle Production Enterprises and Products Access Management Regulations. Beijing, 2020. Available online: http://www.gov.cn/gongbao/content/2020/content_5541490.htm (accessed on 18 December 2021).
  54. National Development and Reform Commission of China. Notice on the Issuance of Intelligent Vehicle Innovation and Development Strategy. Beijing, 2020. Available online: http://www.gov.cn/zhengce/zhengceku/2020-02/24/content_5482655.htm (accessed on 18 December 2021).
  55. Ministry of Industry and Information Technology of China. Key Points of Automobile Standardization Work in 2021. Beijing, 2021. Available online: https://www.miit.gov.cn/xwdt/gxdt/sjdt/art/2021/art_a4eea45dca0249438746b284bb91cf6b.html (accessed on 18 December 2021).
  56. Ministry of Industry and Information Technology of China. Parallel Management Method of Average Fuel Consumption and New Energy Vehicle Credits of Passenger Car Enterprises. Beijing, 2017. Available online: http://www.gov.cn/xinwen/2017-09/28/content_5228217.htm (accessed on 18 December 2021).
  57. Ministry of Industry and Information Technology of China. Decision on Amending the Parallel Management Method of Average Fuel Consumption and New Energy Vehicle Credits of Passenger Vehicle Enterprises. Beijing, 2020. Available online: http://www.gov.cn/zhengce/zhengceku/2020-06/22/content_5521144.htm (accessed on 18 December 2021).
  58. National Bureau of Statistics of China. China Statistical Yearbook 2021; China Statistics Press: Beijing, China, 2021. Available online: http://www--stats--gov--cn.proxy.www.stats.gov.cn/tjsj/ndsj/2021/indexch.htm (accessed on 19 December 2021).
  59. National Passenger Car Information Exchange Association of China. Retail Sales Ranking in December 2021. Shanghai, 2022. Available online: http://www.cpcaauto.com/newslist.php?types=csjd&id=2658 (accessed on 19 December 2021).
  60. Ministry of Industry and Information Technology of China. The Seventh Batch of Recommended Models for Promotion and Application of New Energy Vehicles. Beijing, 2020. Available online: https://www.miit.gov.cn/jgsj/zbys/gzdt/art/2020/art_f6623e4f324a475db55430111788e3f6.html (accessed on 17 December 2021).
  61. Official Website of BYD Auto. Byd Auto Model Overview. Available online: https://www.bydauto.com.cn/auto/AllVehicleModel/CarOverview.html (accessed on 17 December 2021).
  62. Ministry of Industry and Information Technology of China. China Automotive Energy Consumption Query Platform. Beijing, 2021. Available online: https://yhgscx.miit.gov.cn/fuel-consumption-web/mainPage (accessed on 19 December 2021).
  63. Automotive Battery Innovation Alliance of China. Monthly Power Battery Data for December 2021. Beijing, 2022. Available online: https://mp.weixin.qq.com/s/MVU_F-xFdyR-Ipt4yt1Ygg (accessed on 19 December 2021).
  64. Liu, W.; Liu, H.; Liu, W.; Cui, Z. Life Cycle Assessment of Power Batteries Used in Electric Bicycles in China. Renew. Sust. Energ. Rev. 2021, 139, 110596. [Google Scholar] [CrossRef]
  65. Qiao, Q.; Zhao, F.; Liu, Z.; He, X.; Hao, H. Life cycle greenhouse gas emissions of Electric Vehicles in China: Combining the vehicle cycle and fuel cycle. Energy 2019, 177, 222–233. [Google Scholar] [CrossRef]
  66. Yang, L.; Yu, B.; Yang, B.; Chen, H.; Malima, G.; Wei, Y. Life cycle environmental assessment of electric and internal combustion engine vehicles in China. J. Clean. Prod. 2021, 285, 124899. [Google Scholar] [CrossRef]
  67. Argonne National Laboratory (ANL). The Greenhouse Gases, Regulated Emissions, and Energy Use in Transportation Model; Argonne National Laboratory: Argonne, IL, USA, 2020.
  68. Qiao, Q.; Zhao, F.; Liu, Z.; Jiang, S.; Hao, H. Cradle-to-gate greenhouse gas emissions of battery electric and internal combustion engine vehicles in China. Appl. Energy 2017, 204, 1399–1411. [Google Scholar] [CrossRef]
  69. Zackrisson, M.; Avellán, L.; Orlenius, J. Life cycle assessment of lithium-ion batteries for plug-in hybrid electric vehicles—Critical issues. J. Clean Prod. 2010, 18, 1519–1529. [Google Scholar] [CrossRef]
  70. Hasanbeigia, A.; Arensb, M.; Cardenasa, J.C.R.; Pricea, L.; Triolo, R. Comparison of carbon dioxide emissions intensity of steel production in China, Germany, Mexico, and the United States. Resour. Conserv. Recycl. 2016, 113, 127–139. [Google Scholar] [CrossRef] [Green Version]
  71. Kuckshinrichs, W.; Zappa, P.; Poganietz, W.R. CO2 emissions of global metal-industries: The case of copper. Appl. Energy 2007, 84, 842–852. [Google Scholar] [CrossRef]
  72. National Bureau of Statistics of China. China Statistical Yearbook 2019; China Statistics Press: Beijing, China, 2020. Available online: http://www--stats--gov--cn.proxy.www.stats.gov.cn/tjsj/ndsj/2019/indexch.htm (accessed on 19 December 2021).
  73. Garg, A.; Pulles, T. 2006 IPCC Guidelines for National Greenhouse Gas Inventories; Volume 2 Energy; Eggleston, H.S., Buendia, L., Miwa, K., Ngara, T., Tanabe, K., Eds.; IGES: Kanagawa, Japan, 2006. [Google Scholar]
  74. Dunn, J.B.; Gaines, L.; Barnes, M.; Sullivan, J.; Wang, M. Material and Energy Flows in the Materials Production, Assembly, and End-of-Life Stages of the Automotive Lithium-Ion Battery Life Cycle; U.S. Department of Energy, Office of Scientific and Technical information: Oak Ridge, TN, USA, 2012.
  75. National Bureau of Statistics of China. Annual Output of Major Energy Products of Provinces, 2019. Beijing, 2020. Available online: http://data.stats.gov.cn/easyquery.htm (accessed on 18 December 2021).
  76. Ministry of Ecology and Environment of China. Grid Baseline Emission Factor of Emission Reduction Project in China in 2019. Beijing, 2020. Available online: https://www.mee.gov.cn/ywgz/ydqhbh/wsqtkz/202012/t20201229_815386.shtml (accessed on 18 December 2021).
  77. Jacobson, M.Z. Evaluation of Nuclear Power as a Proposed solution to global warming, air pollution and energy security. In 100% Clean, Renewable Energy and Storage for Everything; Cambridge University Press: New York, NY, USA, 2020; p. 427. [Google Scholar]
  78. Li, W.; Bai, H.; Yin, J.; Xu, H. Life cycle assessment of end-of-life vehicle recycling processes in China-take Corolla taxis for example. J. Clean. Prod. 2016, 117, 176–187. [Google Scholar] [CrossRef]
  79. World Nuclear Association. Comparison of Lifecycle Greenhouse Gas Emissions of Various Electricity Generation Sources, 2011. Available online: http://www.world-nuclear.org/our-association/publications/online-reports/lifecycle-ghg-emissions-of-electricity-generation.aspx/ (accessed on 19 December 2021).
  80. National Development and Reform Commission of China and National Energy Administration of China. Green Electricity Trading Pilot Work Plan. Beijing, 2021. Available online: https://www.ndrc.gov.cn/fggz/fgzy/xmtjd/202109/t20210927_1297840.html?code=&state=123 (accessed on 19 December 2021).
Figure 1. Total CO2 emission from the largest 10 emitters and the proportion of CO2 emission from the transport sector in 2020. Data source: EDGARv6.0 FT2020 fossil CO2 GHG booklet2021. https://edgar.jrc.ec.europa.eu/report_2021#emissions_table (accessed on 19 December 2021).
Atmosphere 13 00252 g001
Figure 2. The curve of the proportion of fossil CO2 emission from the transport sector and total fossil CO2 emission in China from 2011 to 2020. Data source: EDGARv6.0 FT2020 fossil CO2 GHG booklet2021. https://edgar.jrc.ec.europa.eu/report_2021#emissions_table (accessed on 19 December 2021).
Atmosphere 13 00252 g002
Figure 3. Framework of carbon emission comparison between ICEVs and BEVs in four phases of LCA.
Atmosphere 13 00252 g003
Figure 4. Regional disparity in electricity carbon intensity and electricity generation mix in representative regions.
Atmosphere 13 00252 g004
Figure 5. CO2 emissions from BEVs and ICEVs and the proportion of thermal power in 14 selected regions. (a) seven regions with a high proportion of thermal power. (b) seven regions with a low proportion of thermal power.
Atmosphere 13 00252 g005
Figure 6. CO2 emissions of ICEVs and BEVs in four phases of LCA in 14 selected regions (phase 1 stands for material extraction and processing, phase 2 stands for vehicle manufacturing, phase 3 stands for vehicle use, and phase 4 stands for vehicle recycling). (a) seven regions with a high proportion of thermal power. (b) seven regions with a low proportion of thermal power.
Atmosphere 13 00252 g006
Table 1. EVs supporting policy and interpretations.
Policy ClassificationDocumentPolicy Interpretation
Promotion[39,40,41]
  • Promote EV to reduce GHG emission
  • Optimize transport service in urban and realize green transport
  • Support new energy bus in public transport service
  • Establish a market-oriented, innovation-driven, coordinated, and open development transport sector
Fiscal support[42,43,44,45,46,47,48]
  • Establish reward and punishment mechanisms for new energy vehicles
  • Exempt from vehicle purchase tax for chartered new energy vehicles
  • Improve subsidy standard and liquidation system
  • Reduction or exemption of vehicle and vessel tax for chartered new energy vehicles
  • Extend subsidy period and optimize technical indicators
  • gradually implement subsidy cuts of new energy vehicles
Infrastructure support[49,50]
  • Improve the development of charging infrastructure systems
  • Strengthen the construction of supporting power grids
  • Accelerate standard establishment and technological innovation
  • Explore sustainable business models and encourage social capital involvement
Charging price[51]
  • Ensure that the operating cost of EVs is significantly lower than that of ICEVs
  • Make reasonable charging prices for EVs
  • Power grid company take responsibility for the cost of updating power grids
Technology support[52,53,54,55]
  • Standardize industrial access conditions for manufacturing enterprise and main technical parameters of EVs
  • Complete technological innovation, industrial ecological infrastructure, regulations and standards, and product supervision and network security system
  • Standardize battery specifications, charging interface, and interface of changing batteries
Vehicle score system[56,57]
  • Implement vehicle score system for manufacturing enterprise (positive score for new energy vehicles, negative score for ICEVs)
  • Stipulate details of score system and confirm calculation formula
Table 2. Characteristics of the reference BEV and ICEV models.
BEVICEV
Length (mm)47654675
Width (mm)18371770
Height (mm)15151480
Curb weight (kg)16501325
Electricity/Oil consumption per 100 km12.3 kWh6.2 L
Engine displacement (L)1.5
Tank capacity (L)50
Max. engine power (kW)80
Max. motor power (kW)100
Battery typeLFP
Battery capacity (kWh)57
Cruising range of battery (km)500
Charging efficiency90%
Table 3. Data sources of the life cycle inventory.
Life Cycle PhasesProcessData Sources
Material Extraction and ProcessingMaterial compositionGREET model [65]
Energy consumption of material productionGREET model [66,68,69]
Carbon emission factor of material productionGREET model [66,70,71]
Carbon emission factor of different types of energyGREET model [72,73]
Vehicle ManufacturingEnergy consumption for the non-battery partsGREET model
Energy consumption for the batteryGREET model, Gabi database [74]
Vehicle UseRegional electricity generation mix[58,75]
Carbon emission factor of different power sources[24,58,76,77]
Carbon emission factor of fuel productionGREET model
Vehicle RecyclingEnergy consumption for the non-battery partsGREET model, Gabi database
Energy consumption for the batteryGREET model, Gabi database [64,78]
Table 4. Regional electricity generation mix in China in 2019.
RegionThermal PowerHydropowerSolar PowerWind PowerNuclearElectricity Generation (GWh)Line Loss RateReference
Beijing97.5%2.3%0.2%0046,4097.10%National Bureau of Statistics [58,75]
Heilongjiang86.2%2%0.6%11.2%0111,1914.92%
Jilin82.5%5.7%1.3%10.5%094,6387.88%
Tianjin98.4%00.4%1.2%073,2982.73%
Shandong92.5%0.1%0.8%2.9%3.7%589,7225.27%
Shanxi90.5%1.7%2.0%5.8%0336,1673.68%
Hebei88.4%0.2%2.5%8.9%0329,7665.45%
Jiangxi88.2%6.5%2.7%2.6%013,7599.73%
Liaoning73.8%1.4%0.7%7.7%16.4%207,2943.72%
Inner Mongolia85.5%0.9%2.1%11.5%0549,5083.06%
Henan91.5%5.1%1.6%1.8%0288,8314.24%
Shaanxi87.8%6.5%2.4%3.3%021,9323.40%
Shanghai98.8%00.1%1.1%082,2133.58%
Anhui95.2%1.0%2.2%1.6%0288,6674.06%
Ningxia83.4%1.3%5.1%10.2%0176,5973.86%
Xinjiang79.2%7.0%2.8%11.0%0367,0492.89%
Jiangsu88.5%0.6%1.2%3.2%6.5%516,6432.92%
Chongqing72.5%26%0.4%1.1%081,1556.14%
Zhejiang74.4%4.8%1.2%0.8%18.8%353,7655.28%
Guangdong70.8%3.9%0.5%1.5%23.3%505,1026.43%
Hainan65.8%1.8%0.7%1.3%30.4%34,5687.76%
Guizhou63.6%32%0.8%3.6%0220,6554.54%
Hunan60%35.1%0.6%4.3%0155,9423.46%
Gansu53.1%25.5%6.1%15.3%016,3059.25%
Fujian58.4%12.3%0.1%3.3%25.9%257,7966.65%
Guangxi56.5%30.4%0.4%3.1%9.6%184,6273.52%
Hubei50.6%45.9%1.4%2.1%0295,7502.07%
Qinghai13.5%65.8%14.2%6.5%088,61410.82%
Sichuan13.7%83.8%0.5%2.0%0392,3886.45%
Yunnan9.5%82%1%7.5%0346,5636.17%
Table 5. Regional electricity carbon intensity of China in 2019.
RegionRegional Electricity Carbon Intensity
(kgCO2/kWh)
RegionRegional Electricity Carbon Intensity
(kgCO2/kWh)
RegionRegional Electricity Carbon Intensity
(kgCO2/kWh)
Beijing0.9902Henan0.8254Hainan0.6014
Heilongjiang0.9846Shaanxi0.8176Guizhou0.5574
Jilin0.9758Shanghai0.8119Hunan0.5569
Tianjin0.9533Anhui0.7888Gansu0.5470
Shandong0.9239Ningxia0.7806Fujian0.5257
Shanxi0.8886Xinjiang0.7359Guangxi0.4987
Hebei0.8842Jiangsu0.7292Hubei0.4738
Jiangxi0.8463Chongqing0.6807Qinghai0.1950
Liaoning0.8456Zhejiang0.6420Sichuan0.1811
Inner Mongolia0.8345Guangdong0.6311Yunnan0.1365
Table 6. Comprehensive comparison of life cycle CO2 emissions between a BEV and ICEV in different regions of China.
RegionCO2 Emission (t)
Material Extraction and ProcessingVehicle ManufacturingUsing PhaseRecyclingTotal
BEVICEVBEVICEVBEVICEVBEVICEVBEVICEV
Beijing6.2813.38017.30812.12120.29924.9031.8261.83345.71442.237
Heilongjiang17.21212.05220.1841.8161.82345.49342.158
Jilin17.06011.94520.0041.8001.80745.14542.035
Tianjin16.67311.67019.5431.7591.76744.25641.720
Shandong16.16611.31118.9401.7061.71443.09341.308
Shanxi15.55810.88018.2161.6431.65141.69840.814
Hebei15.48210.82618.1261.6351.64341.52440.752
Jiangxi14.82910.36317.3491.5661.57540.02540.221
Liaoning14.81710.35417.3351.5651.57439.99840.211
Inner Mongolia14.62510.21917.1071.5451.55439.55840.056
Henan14.46910.10716.9211.5291.53839.20039.928
Shaanxi14.33410.01216.7611.5151.52438.89139.819
Shanghai14.2369.94316.6441.5041.51438.66539.740
Anhui13.8389.66016.1701.4631.47237.75239.415
Ningxia13.6969.56016.0021.4481.45837.42739.301
Xinjiang12.9269.01415.0861.3671.37835.66038.675
Jiangsu12.8118.93214.9491.3551.36635.39638.581
Chongqing11.9758.34013.9541.2681.27933.47837.902
Zhejiang11.3087.86713.1611.1981.21031.94837.360
Guangdong11.1207.73412.9381.1781.19031.51737.207
Hainan10.6087.37112.3291.1251.13730.34336.791
Guizhou9.8506.83311.4271.0451.05828.60336.174
Hunan9.8426.82711.4161.0441.05828.58336.168
Gansu9.6716.70611.2141.0271.04028.19336.029
Fujian9.3046.44610.7770.9881.00227.35035.731
Guangxi8.8396.11610.2230.9390.95326.28235.352
Hubei8.4095.8129.7130.8950.90925.29835.004
Qinghai3.6052.4063.9980.3920.41014.27631.099
Sichuan3.3652.2363.7130.3670.38513.72630.904
Yunnan2.5971.6912.7980.2860.30611.96230.280
Publisher’s Note: MDPI stays neutral with regard to jurisdictional claims in published maps and institutional affiliations.

