Article

The Intraseasonal Variations of the Leading Mode of Summer Precipitation Anomalies in Meiyu Area of East Asia

1
College of Atmospheric Science, Lanzhou University, Lanzhou 730000, China
2
Laboratory for Climate Studies, National Climate Center, China Meteorological Administration, Beijing 100081, China
*
Author to whom correspondence should be addressed.
Atmosphere 2022, 13(2), 217; https://doi.org/10.3390/atmos13020217
Submission received: 29 December 2021 / Revised: 23 January 2022 / Accepted: 24 January 2022 / Published: 28 January 2022
(This article belongs to the Special Issue Hydrological Responses under Climate Changes)

Abstract

:
The intraseasonal variations of summer precipitation anomalies in the Meiyu area of East Asia are analyzed by applying a combined empirical orthogonal function (CEOF) of the latest meteorological reanalysis data ERA5 of European Center for Medium-Range Weather Forecasts for the period from 1991 to 2020, and the circulation structures and sources of variability of CEOF are also investigated. The first mode of the intraseasonal variations shows an in-phase pattern over the Meiyu area in June, July, and August, accounting for 22.2% of the total variance in the intraseasonal variations of summer precipitation anomalies. The positive (negative) CEOF1 is accompanied by the negative (positive) East Asia/Pacific pattern, including strong westerly wind anomalies in the upper troposphere and southwest monsoon in the lower troposphere, and the Western Pacific Subtropical High extending westward and its ridge line slightly south. The positive CEOF1 is preceded by decay of El Niño episodes, including the abnormal warm sea surface temperature anomalies (SSTAs) in the equatorial Central-Eastern Pacific in spring and warm SSTAs in the equatorial Indian Ocean in summer. The second mode shows an opposite precipitation anomaly in June and July, and the distribution in August is not significant. The corresponding geopotential height circulation of positive CEOF2 shows the large negative anomaly in the region north of 40° N and a positive anomaly over Japan in June, whereas the pattern reverses in July. At the same time, there is a radical reversion from abnormal eastly to westly wind in the upper troposphere. The structure of CEOF2 is somewhat induced by local SSTAs over the Northern Indian Ocean and South China Sea.

1. Introduction

The Meiyu area (MYA) is a concentrated area of East Asian subtropical summer rainfall, reflecting the characteristics of the East Asian summer monsoon (EASM) [1]. The most prominent feature of local precipitation is the Meiyu [2,3], which is also called Changma in Korea [4] and Baiu in Japan [5], a quasi-stationary rain belt from the lower reaches of the Yangtze River (LRYR) to southern Japan. It usually starts in mid-June and ends in mid-July, marking the beginning of the summer monsoon in the northern hemisphere subtropical regions and the beginning of the rainy season in East Asian temperate regions, respectively, showing its importance as a member of the EASM system [6]. The monsoon characteristics of summer precipitation, such as the start and end date of the Meiyu, the intensity of precipitation, and the appearance of the inverted Meiyu, can cause extreme meteorological disasters such as floods and droughts, which have huge socio-economic impact on the local area because of large population and intensive agricultural production in MYA [6]. For example, the Meiyu lasting 62 days in 2020 was the strongest summer precipitation in the Yangtze-Huaihe River basin (YHRB) of China since meteorological observations were recorded in 1961 [7,8], causing more than 140 dead or missing people and USD 11.75 billion of economic losses [9].
Due to the importance of summer precipitation and Meiyu in the local area, many scholars have conducted a lot of research on their variations. Multiple time scales are the characteristic for summer precipitation in MYA, including intraseasonal, interannual, interdecadal variations, and long-term trends [6]. On the intraseasonal time scale, the start and end of the Meiyu are mainly related to the northward jump of the Western Pacific Subtropical High (WPSH). The second northward jump of the WPSH represents the beginning of the Meiyu, and the third northward jump represents the end of the Meiyu season and the beginning of the rainy season in North China [1]. At the same time, Meiyu exhibits high-frequency oscillations of the periods about 10–20 d and 30–60 d, which are related to the quasi-biweekly oscillation (QBO) and the intraseasonal changes of the EASM [6,10]. On the interannual scale, precipitation in MYA and EASM both show a quasi-periodic variation of 2–9 a, of which the 3–4 a variation accounted for 53.4%. This period is similar to El Niño-Southern Oscillation (ENSO), the most important driving factor of the global climate interannual variability [6,11]. The precipitation in the subtropical region of East Asia is above ordinary in the summer following the peak of El Niño [12,13]. At the same time, the sea surface temperature (SST) of the Indian Ocean also plays an important role in the interannual variability of the ESAM [14]. Summer precipitation in East Asia, including Meiyu, experienced two interdecadal changes in the 1970s and 1990s that have been proven to be related to Pacific Decadal Oscillation (PDO) and Atlantic Multidecadal Oscillation (AMO) [15,16]. Studies on the long-term changes show that the Meiyu has an increasing trend in extreme heavy precipitation, but the duration of continuous precipitation decreases. This may be related to global warming, aerosol emissions, and urban effects [17,18,19,20]
Compared with other time scales, interannual variations of precipitation have direct impact on human society and are urgently required for accurate prediction. Sea surface temperature anomalies (SSTAs) are the largest interannual signals for the summer precipitation in East Asia, influencing different circulation systems in multiple latitudes and the lower-upper troposphere. The study of Xue [21] showed that in the year of La Niña, an abnormal cyclone occurred in the tropical West Pacific, accompanied by the northeastward drift of WPSH, and the circulation anomaly reached its peak in July, resulting in a zonal distribution of summer precipitation anomalies in East Asia. However, it had an asymmetrical meridional distribution for El Niño. At the same time, the relationship between ENSO and summer precipitation in East Asia is also modulated by PDO, AMO, and other long-term signals [22,23,24,25]. The warm SST over the equatorial Indian Ocean will also contribute to the wetter summer in YHRB of China by influencing the southwest jet stream and the tropical Western Pacific anticyclone [14,26]. A relatively new discovery is that the warm SST in the Arabian Sea in summer may lengthen Meiyu through the atmospheric bridge [27].
Previous studies have mostly focused on the interannual variation of Meiyu or total summer precipitation in MYA, but there have been relatively few studies in the middle and late summer. In the years of positive Meiyu anomalies, an obvious double-blocking high-pressure type is located to the east of Ural and to the east of Okhotsk Sea over midlatitudes, and the meridional circulation anomalies of “+ - +” from low latitudes to high latitudes are present. The SST is warmer in the North Indian Ocean and South China Sea [28,29]. Overall, 50% of the precipitation occurs in the non-Meiyu period in summer [30], which shows the importance of this residual precipitation in MYA. Meanwhile, the seasonal scale has a large span and the intensity of precipitation in different months is not always consistent with the total amount of summer. Nevertheless, studies about the intraseasonal distribution of the summer precipitation anomalies remain insufficient. For example, Yang’s study [31] shows that there is no significant consistency between the summer precipitation concentration and total summer precipitation in the eastern part of Northwest China. Chang and Zhang’s studies also show that the rainfall anomalies in LRYR and South China for different months in summer corresponding to the different circulation systems [32,33]. Thus, the present study aims to analyze the intraseasonal variation of the leading mode of summer precipitation anomalies in MYA, the corresponding circulation conditions, and SSTAs. Data and methods are in Section 2. The intraseasonal analysis of precipitation anomalies is in Section 3. Section 4 shows the circulation characteristics and SSTA signals. Finally, Section 5 includes the summary and discussion.

2. Data and Methods

2.1. Data

The main data in this study is the latest meteorological reanalysis data ERA5 of European Center for Medium-Range Weather Forecasts, including precipitation data, wind and geopotential data of multiple barometric layers, etc. The study of Tong [3] showed that ERA5 had similar climate mean, annual variance, and consistent interannual variation of precipitation to satellite data of the Tropical Rainfall Measuring Mission (TRMM) in Meiyu. It also solved the problem of lack of observation data at sea in MYA. On the other hand, the reanalysis data provide almost complete meteorological and climatic materials, which can better study the circulation field of precipitation variation. The spatial resolution of ERA5 is 0.25 × 0.25°. SST data is Extended Reconstructed Sea Surface Temperature V5 (ERsst V5) from National Oceanic and Atmospheric Administration (NOAA), with a spatial resolution of 2 × 2°.
In this study, we define the MYA as the region between 28° N–36° N and 110° E–140° E with heavy rainfall [3]. The monthly data of June, July, and August from 1991 to 2020 were used to analyze the intraseasonal variations of precipitation and circulation anomalies so that high-frequency oscillations could be removed as much as possible without losing the major characteristics of intraseasonal variations. Data were detrended and mean removed for each month, and 30-years mean from 1991–2020 was defined as the climatological mean.

2.2. Methods

2.2.1. Combined Empirical Orthogonal Function

Here is brief introduction to the main analysis method used in this article: combined empirical orthogonal function (CEOF). First, we spatially spliced the precipitation anomalies data in June, July, and August for each year and obtained precipitation anomaly data X 3 m × n , where m is the number of space points and n is in the number of years. Then we performed the traditional EOF calculation on X 3 m × n , and finally got the space matrix V and the time matrix Z . V j is the j th mode of CEOF, which not only contains the spatial mode of monthly precipitation anomalies, but also includes the intraseasonal variation characteristics of the above modes from June to August. Z j is the corresponding j   th time series (PCj) which demonstrates the interannual variation characteristics of V j . Equation (24) in North’s article [34] is used to identify if eigenvalues are significantly separated. CEOF also has some shortcomings, such as being greatly affected by the spatial grid and time length and easily affected by areas with large variations, so we have avoided these problems to the maximum extent through comprehensive analysis.

2.2.2. Regression Analysis

Y = a Z + b
Y and Z are the two elements of regression, a is the regression coefficient obtained by the least-squares method and b is the intercept.

2.2.3. Synthetic Difference Analysis

Synthetic difference analysis is the mean of selected positive anomalies ( X i ) minus the mean of selected negative anomalies ( X j ).
Y = 1 n 1 i = 1 n 1 X i 1 n 2 j = 1 n 2 X j
Regression analysis is mainly affected by the consistency of the plus or minus and the consistency of trend change, and it has defects in reflecting the extreme value. Conversely, synthetic difference analysis only reflects the characteristics of selected extreme years. Therefore, the combination of the two methods can better analyze the circulation and SST characteristics corresponding to the precipitation anomaly. Significance test adopts student’s t test with 90% confidence levels.

3. Characteristics of Precipitation in Summer

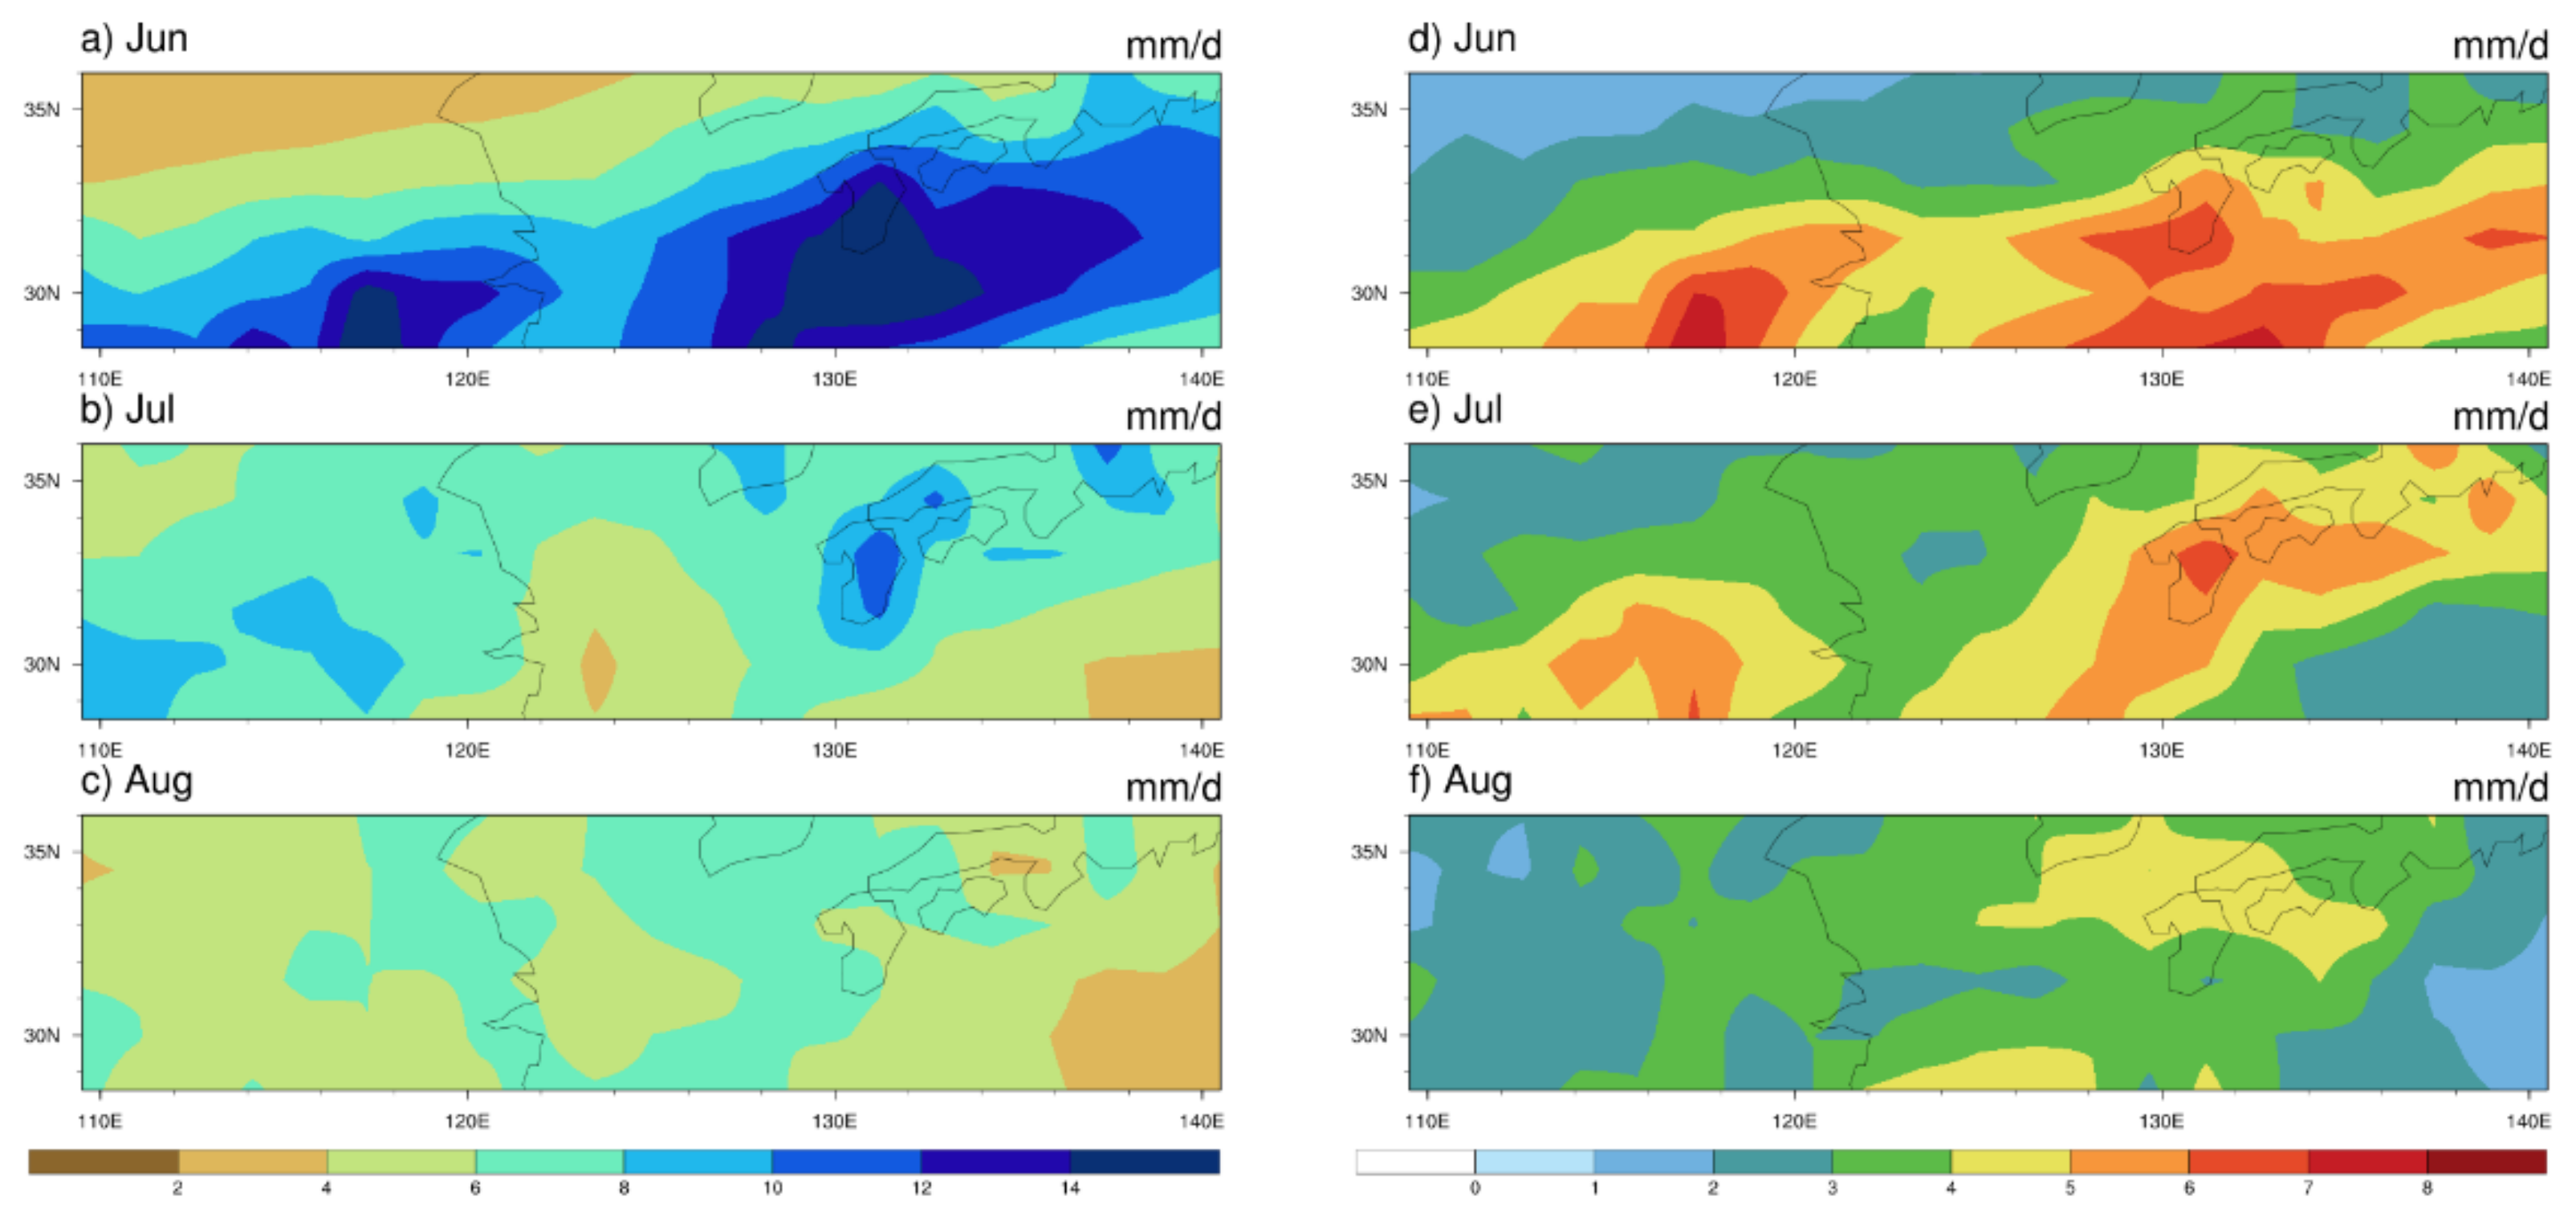
3.1. Mean and Standard Deviation of Precipitation

Figure 1a–c show that the peak of summer precipitation in MYA appeared in June, and the central areas were LRYR in China, the southern part of Japan and the ocean area, with the intensity of precipitation exceeding 12 mm/d. The intensity in Huaihe River basin (HRB) in China and the southern part of the Korean Peninsula were relatively low, about 2–4 mm/d. In July, the intensity of precipitation decreased, and the rain belt gradually disappeared and divided into two main areas: one was the YHRB of China and the other was the southern Japan-southern Korean, with an intensity of about 8–10 mm/d. In August, the precipitation weakened further, and the intensity in the whole region was 4–7 mm/d.
The standard deviation of precipitation also shows obvious intraseasonal variations (Figure 1d–f). In June, the standard deviation had two maximum regions, one was the LRYR in China and the other was in the south of Japan. In July, the range and the intensity of two large value regions decreased. The main variation areas in August were in the south of Japan and the south of the Korean, and the interannual variation of precipitation in August in China was weak.

3.2. The Intraseasonal Variations of Summer Precipitation Anomalies

There are two main intraseasonal modes by CEOF analysis of summer precipitation in MYA, both of which are significantly separated from others. Figure 2a–c show that the most striking feature of the first mode is the positive precipitation in the whole summer. In June, there was a zonal abnormal rain belt in the south of MYA. In July, the abnormal rain belt extended northward, reaching the south of Japan and south of Korea, which is consistent with the advance of Meiyu. Compared with July, the abnormal rain belt continued to move northward in August, but the intensity was weakened and anomalies on land area of China disappeared. The first mode accounts for 22.2% of total variance variations. Figure 3a shows that its time series (PC1) not only presents interannual variations, but also includes some interdecadal features. In the first decade of the study period, the positive phase was almost always present, then only one year had a weak positive phase from 2000 to 2011, and finally it changed to a strong positive phase in the last decade.
The second mode is very different from the first mode (Figure 2d–f). In June, the traditional high precipitation area was obviously weak, meanwhile some weak positive anomalies appeared from the HRB of China extending northeastward to southern Japan, presenting a south-north inversion pattern. The second mode is similar to the first mode with high precipitation regions in July, mainly located in the YHRB of China, southern Japan, and the offshore area. The precipitation in August was less again, and the negative value was mainly located in the HRB of China. The explained variance of the second mode is 11.5%, showing the “less, more, less” intraseasonal variation of summer precipitation anomalies, and its time series mainly presents the interannual variation (Figure 3b). It is worth noting that the most significant year of the second mode was 2020, and there was a sustained strong Meiyu event occurring in the YHRB of China in 2020, especially in Anhui and Jiangsu provinces, which is consistent with the characteristics of sustained heavy precipitation in the YHRB from June to July in the second mode.
In order to verify the authenticity of the modes calculated by CEOF, we selected five typical strong and weak years of two modes for synthetic difference analysis according to time series, respectively, and the pictures are shown in Figure 4. The difference patterns for typical years in PC1 (strong years: 1992, 1999, 2015, 2019, 2020; weak years: 2006, 2007, 2008, 2013, 2016) are very similar to the first mode, with more precipitation in the whole summer, and the positive center is consistent. The pattern correlation coefficient (PCC) of difference maps with the first mode for each month was 0.96, 0.99, 0.94, respectively, and the combined PCC of the whole summer was 0.97, showing the consistent spatial distribution of monthly precipitation anomalies and the intraseasonal variation of abnormal rain belt between the two methods. The difference for typical years in PC2 (strong years: 1991, 1993, 1996, 2007, 2020; weak years: 1992, 1994, 1995, 2012, 2017) and the second mode both show the consistent “negative, positive, negative” reversion, with spatial correlation coefficients of 0.98, 0.98 and 0.81, respectively. Although the region of negative precipitation was different in August, the combined PCC was 0.97, indicating the consistency of such intraseasonal variations.

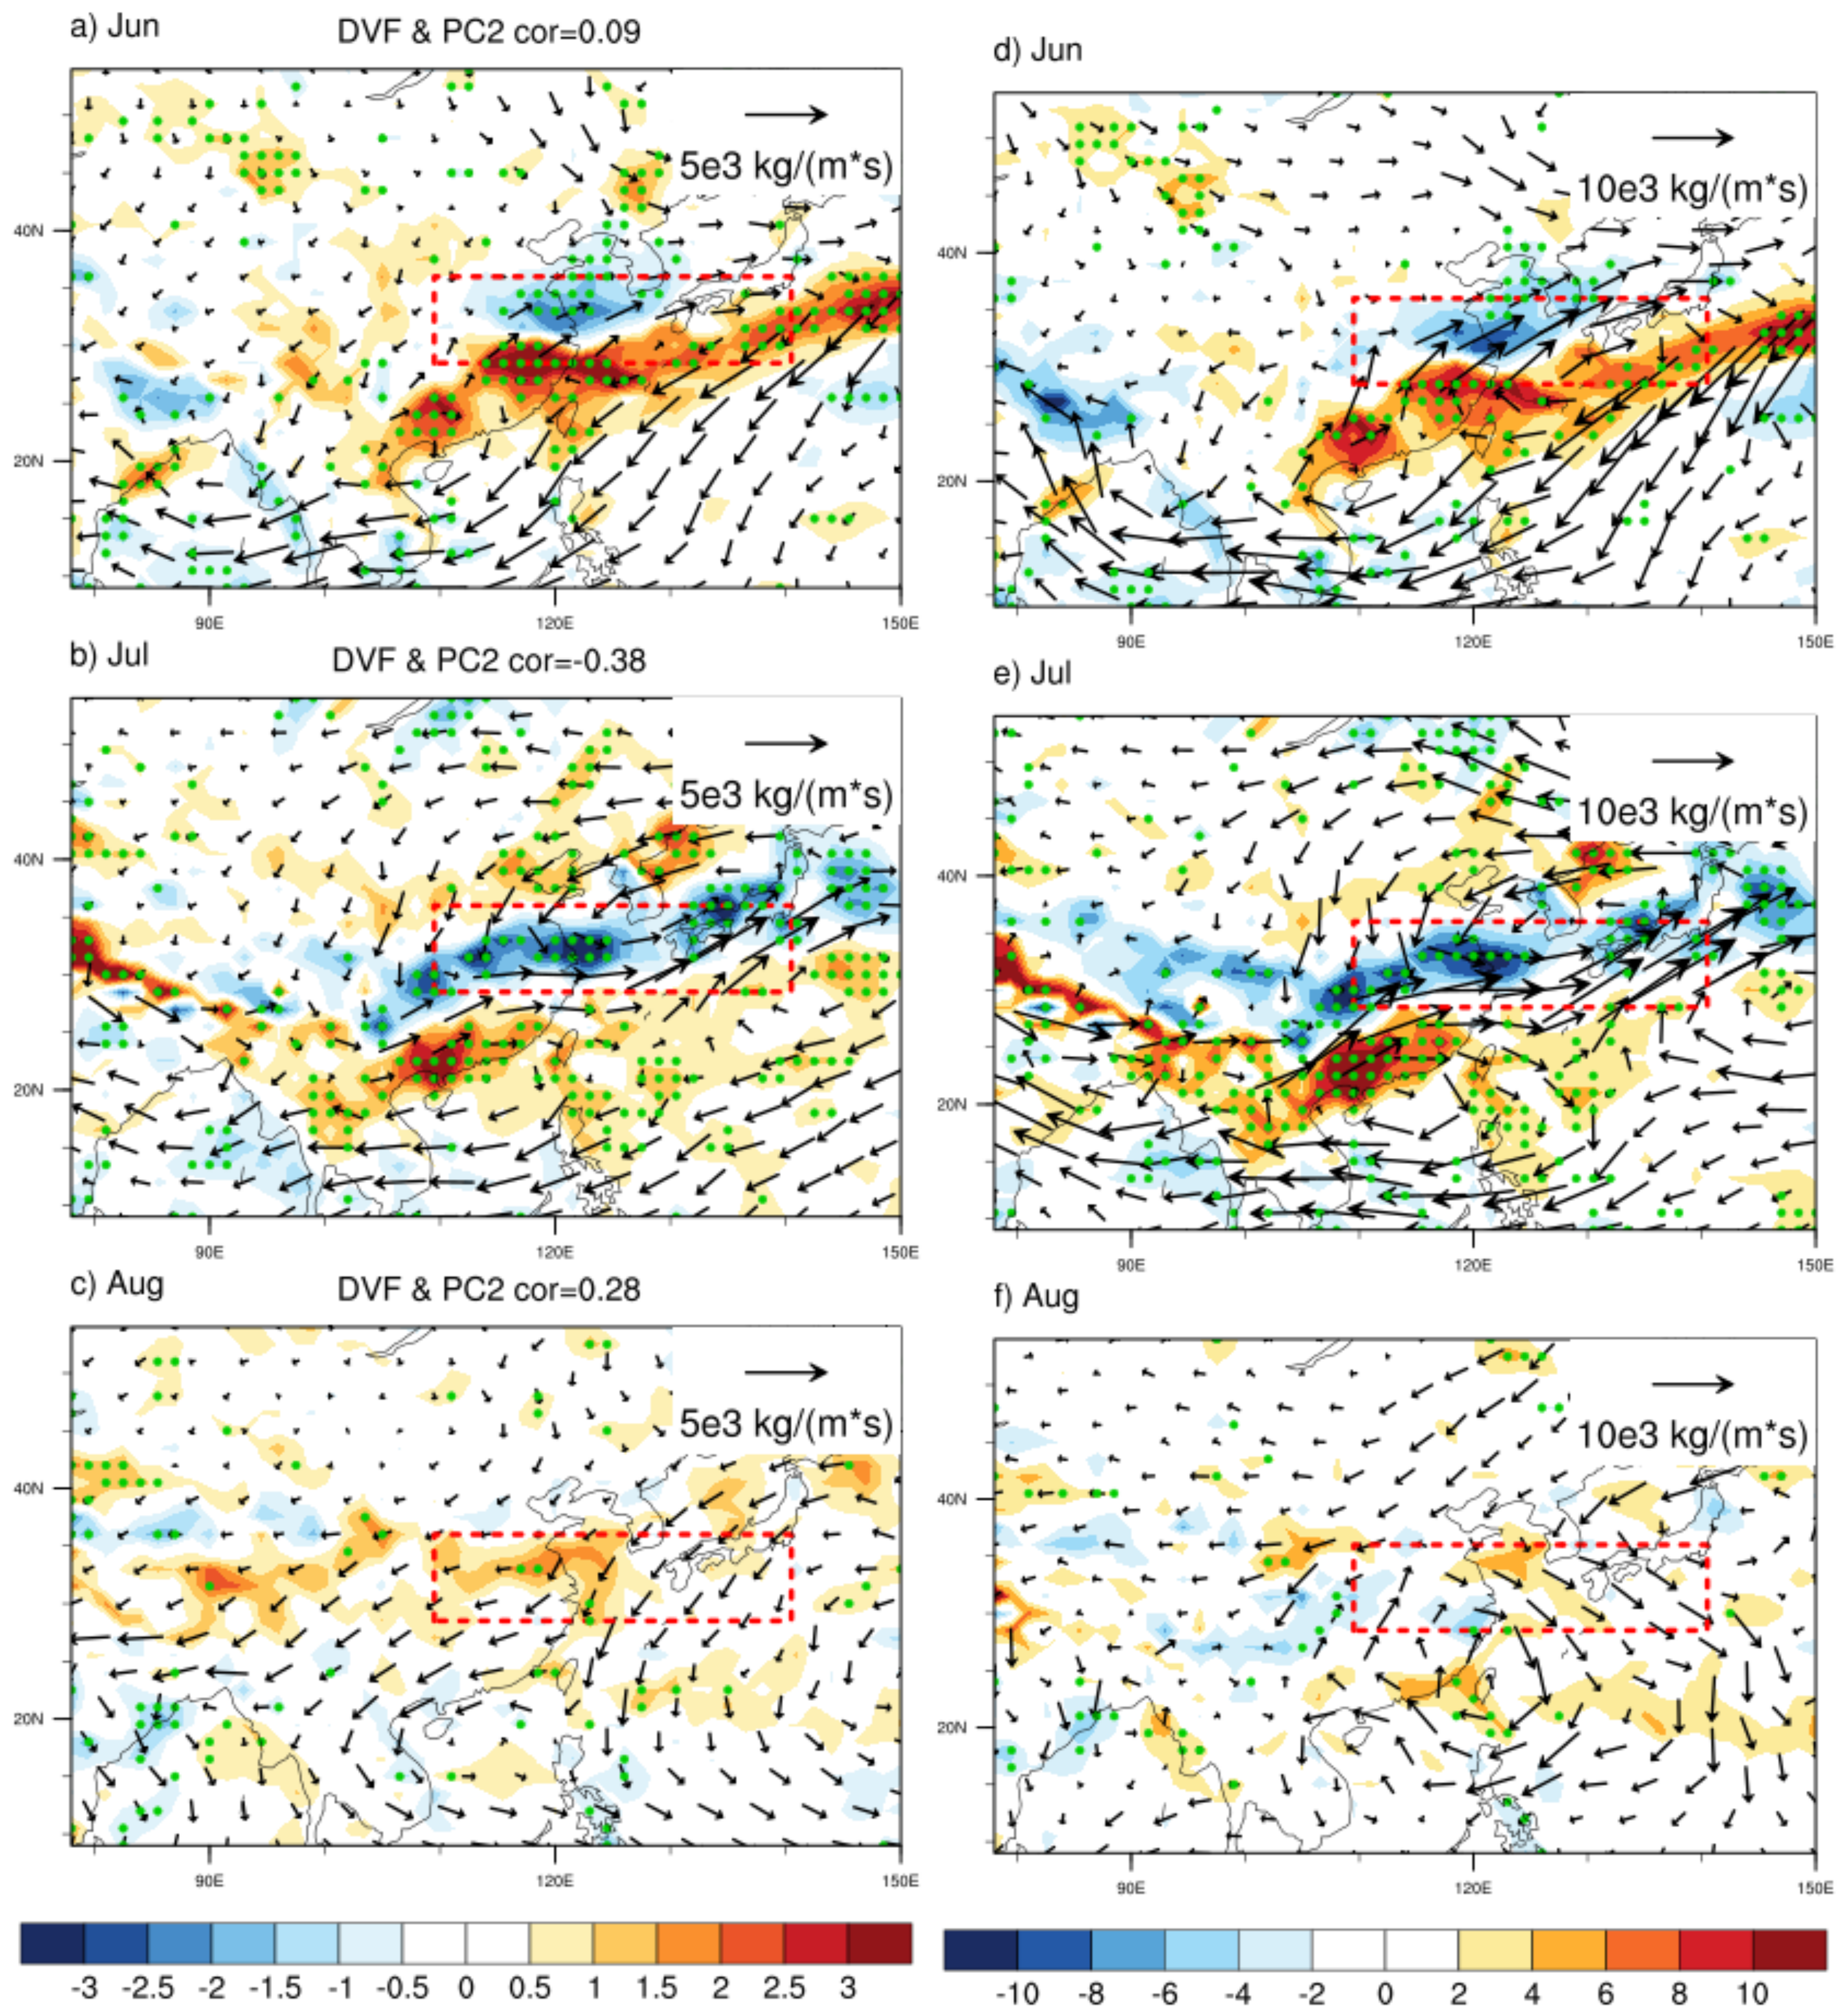
4. Characteristics of Circulation and SST

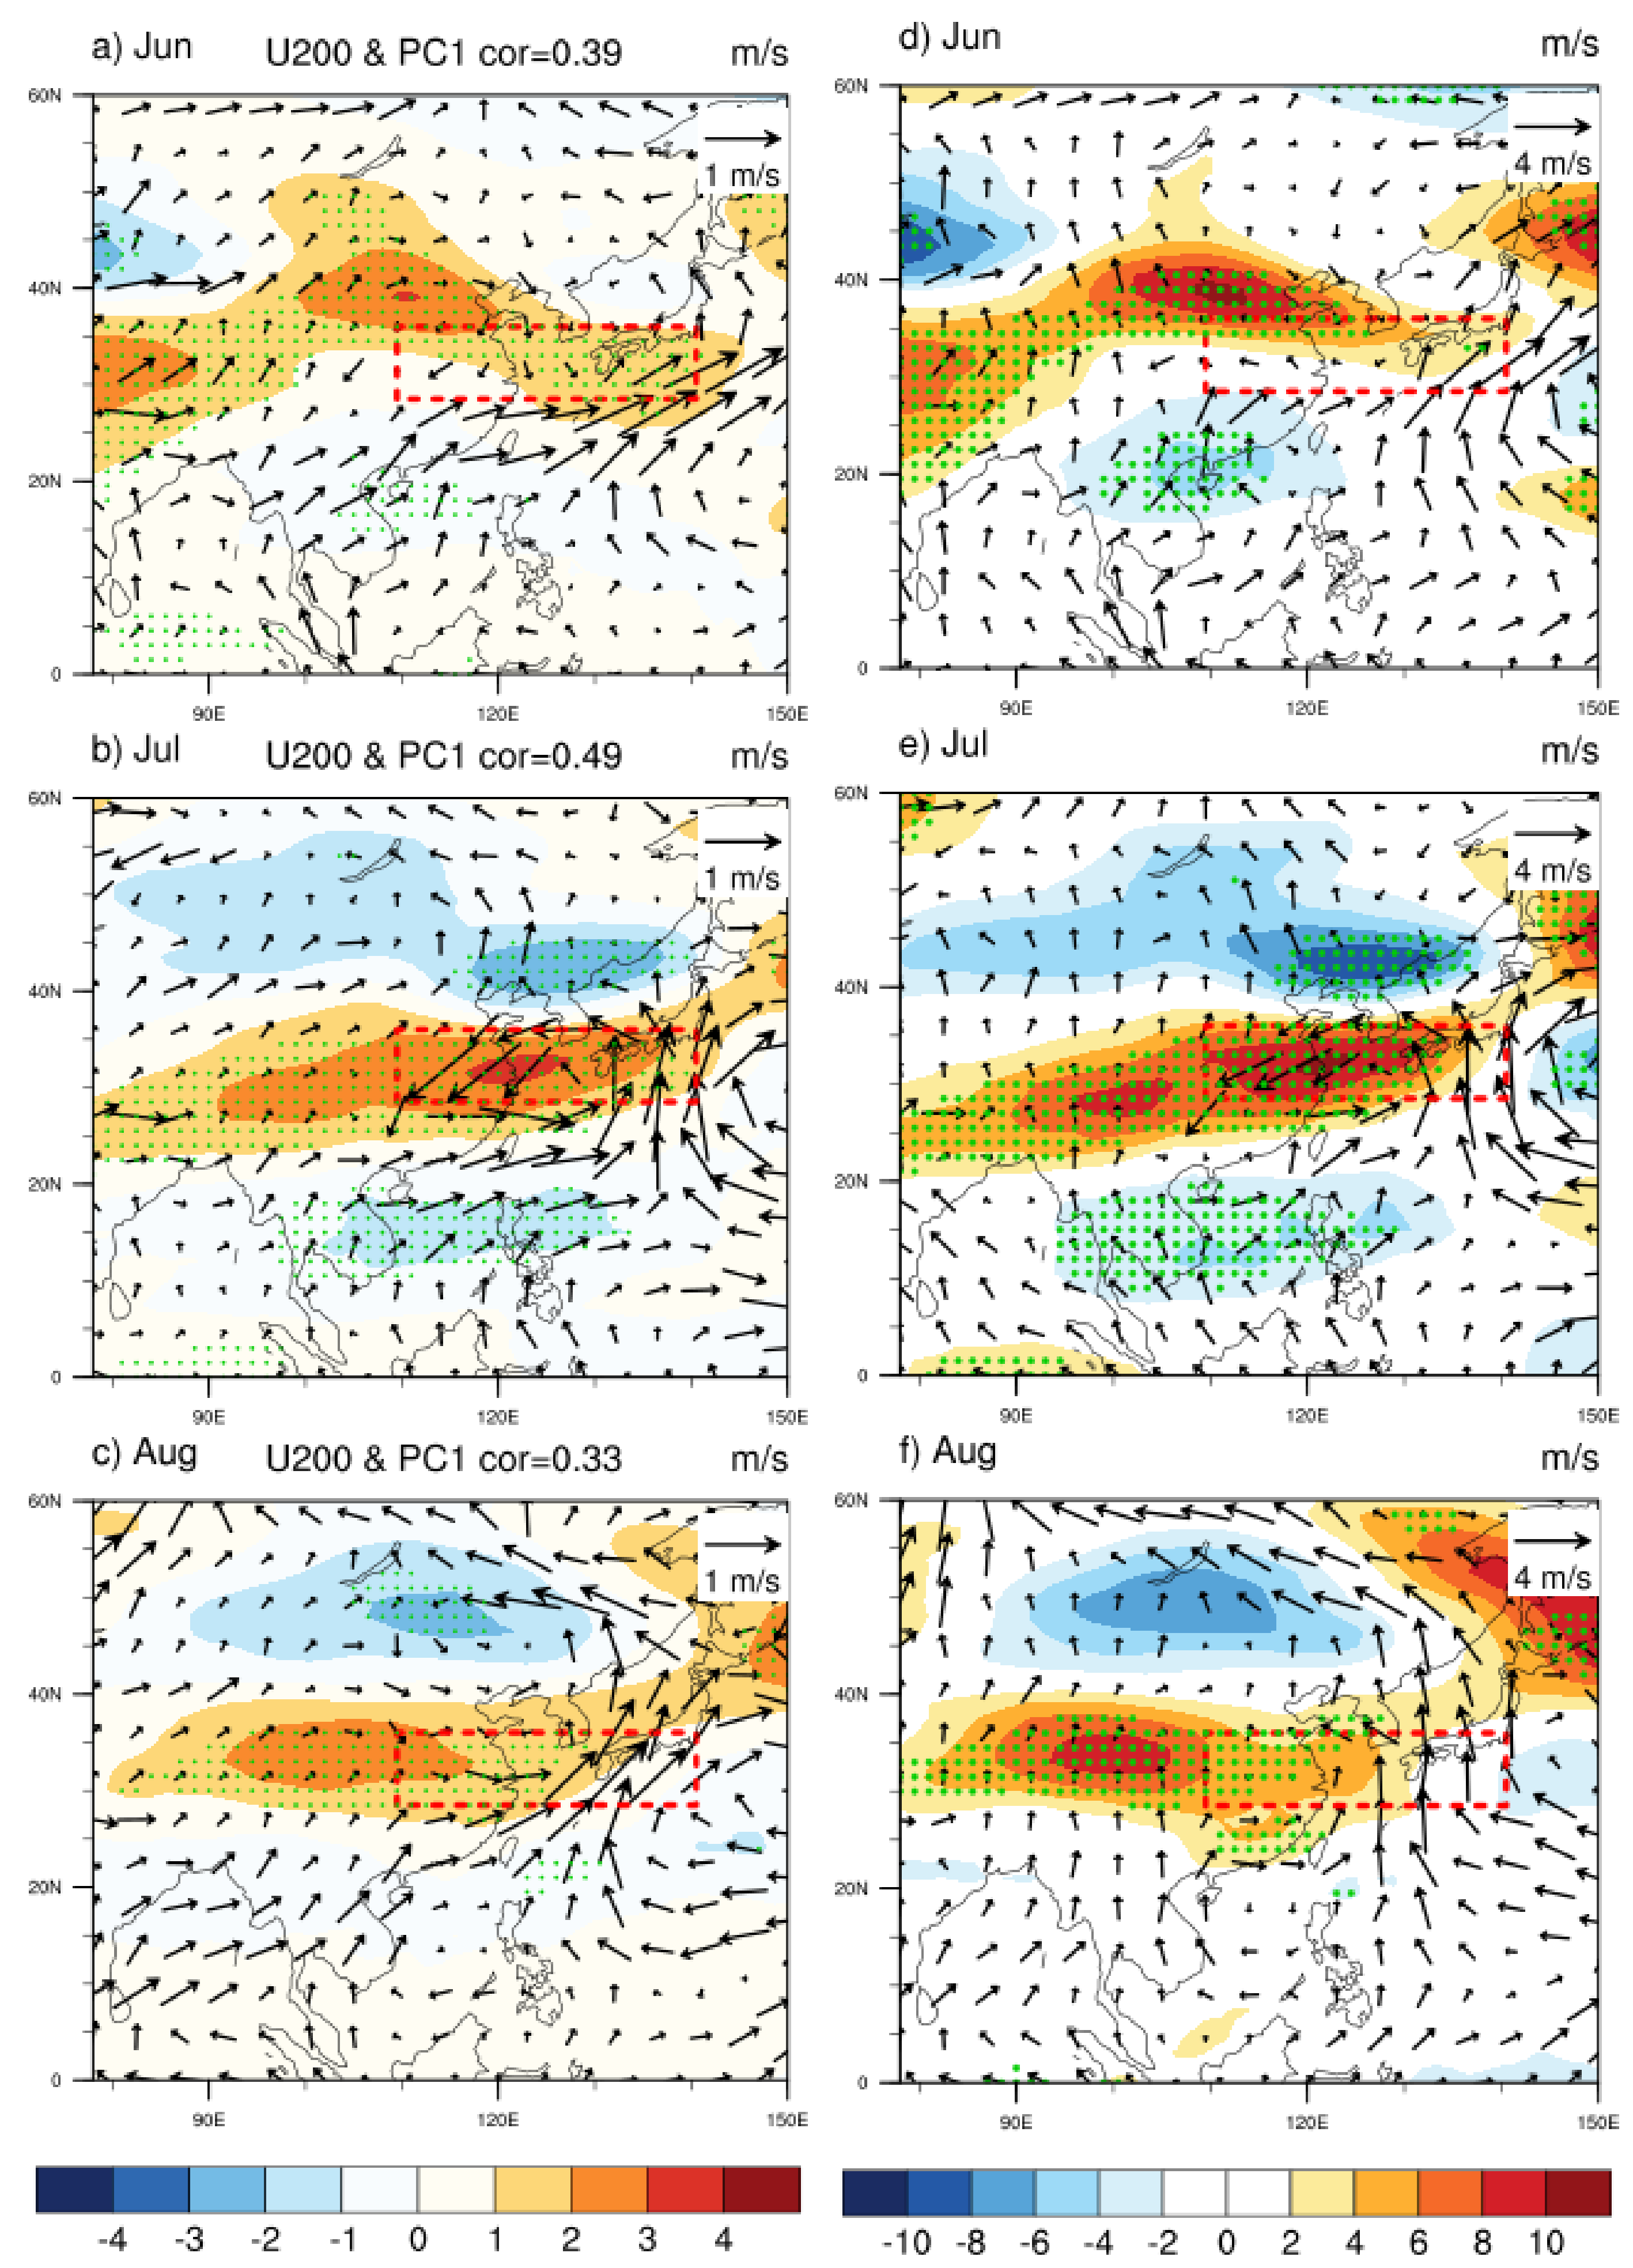
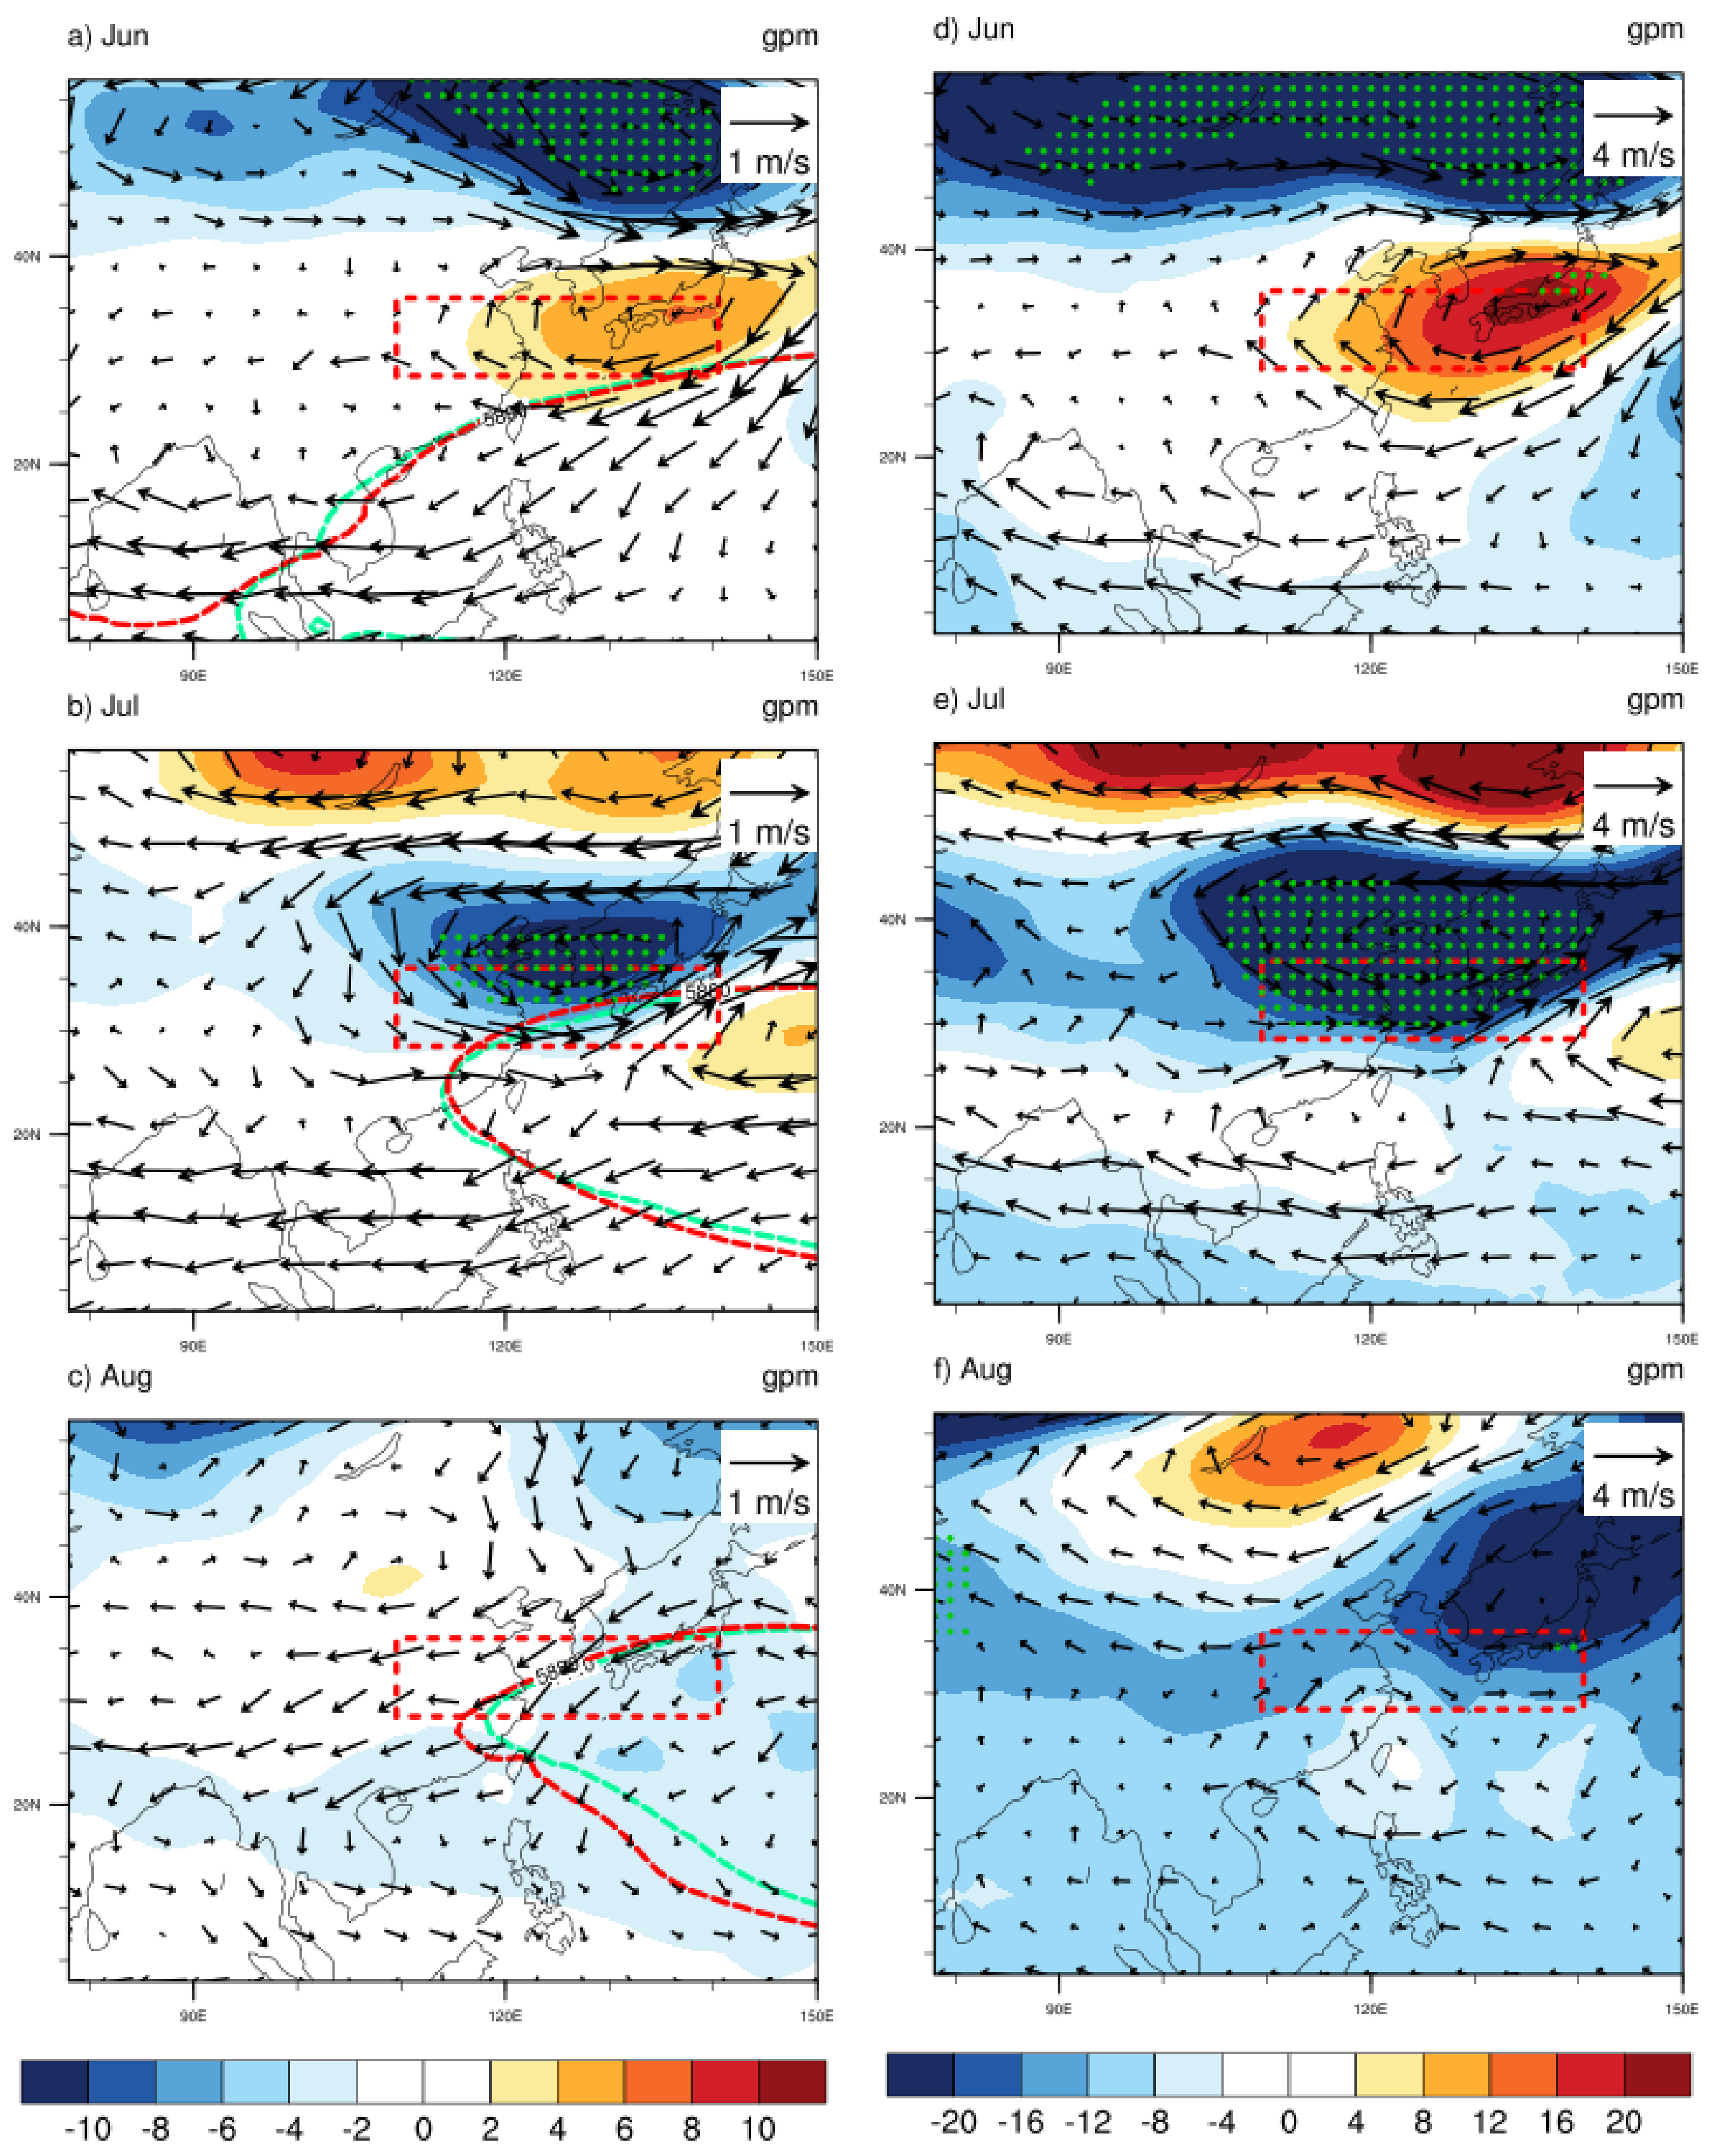
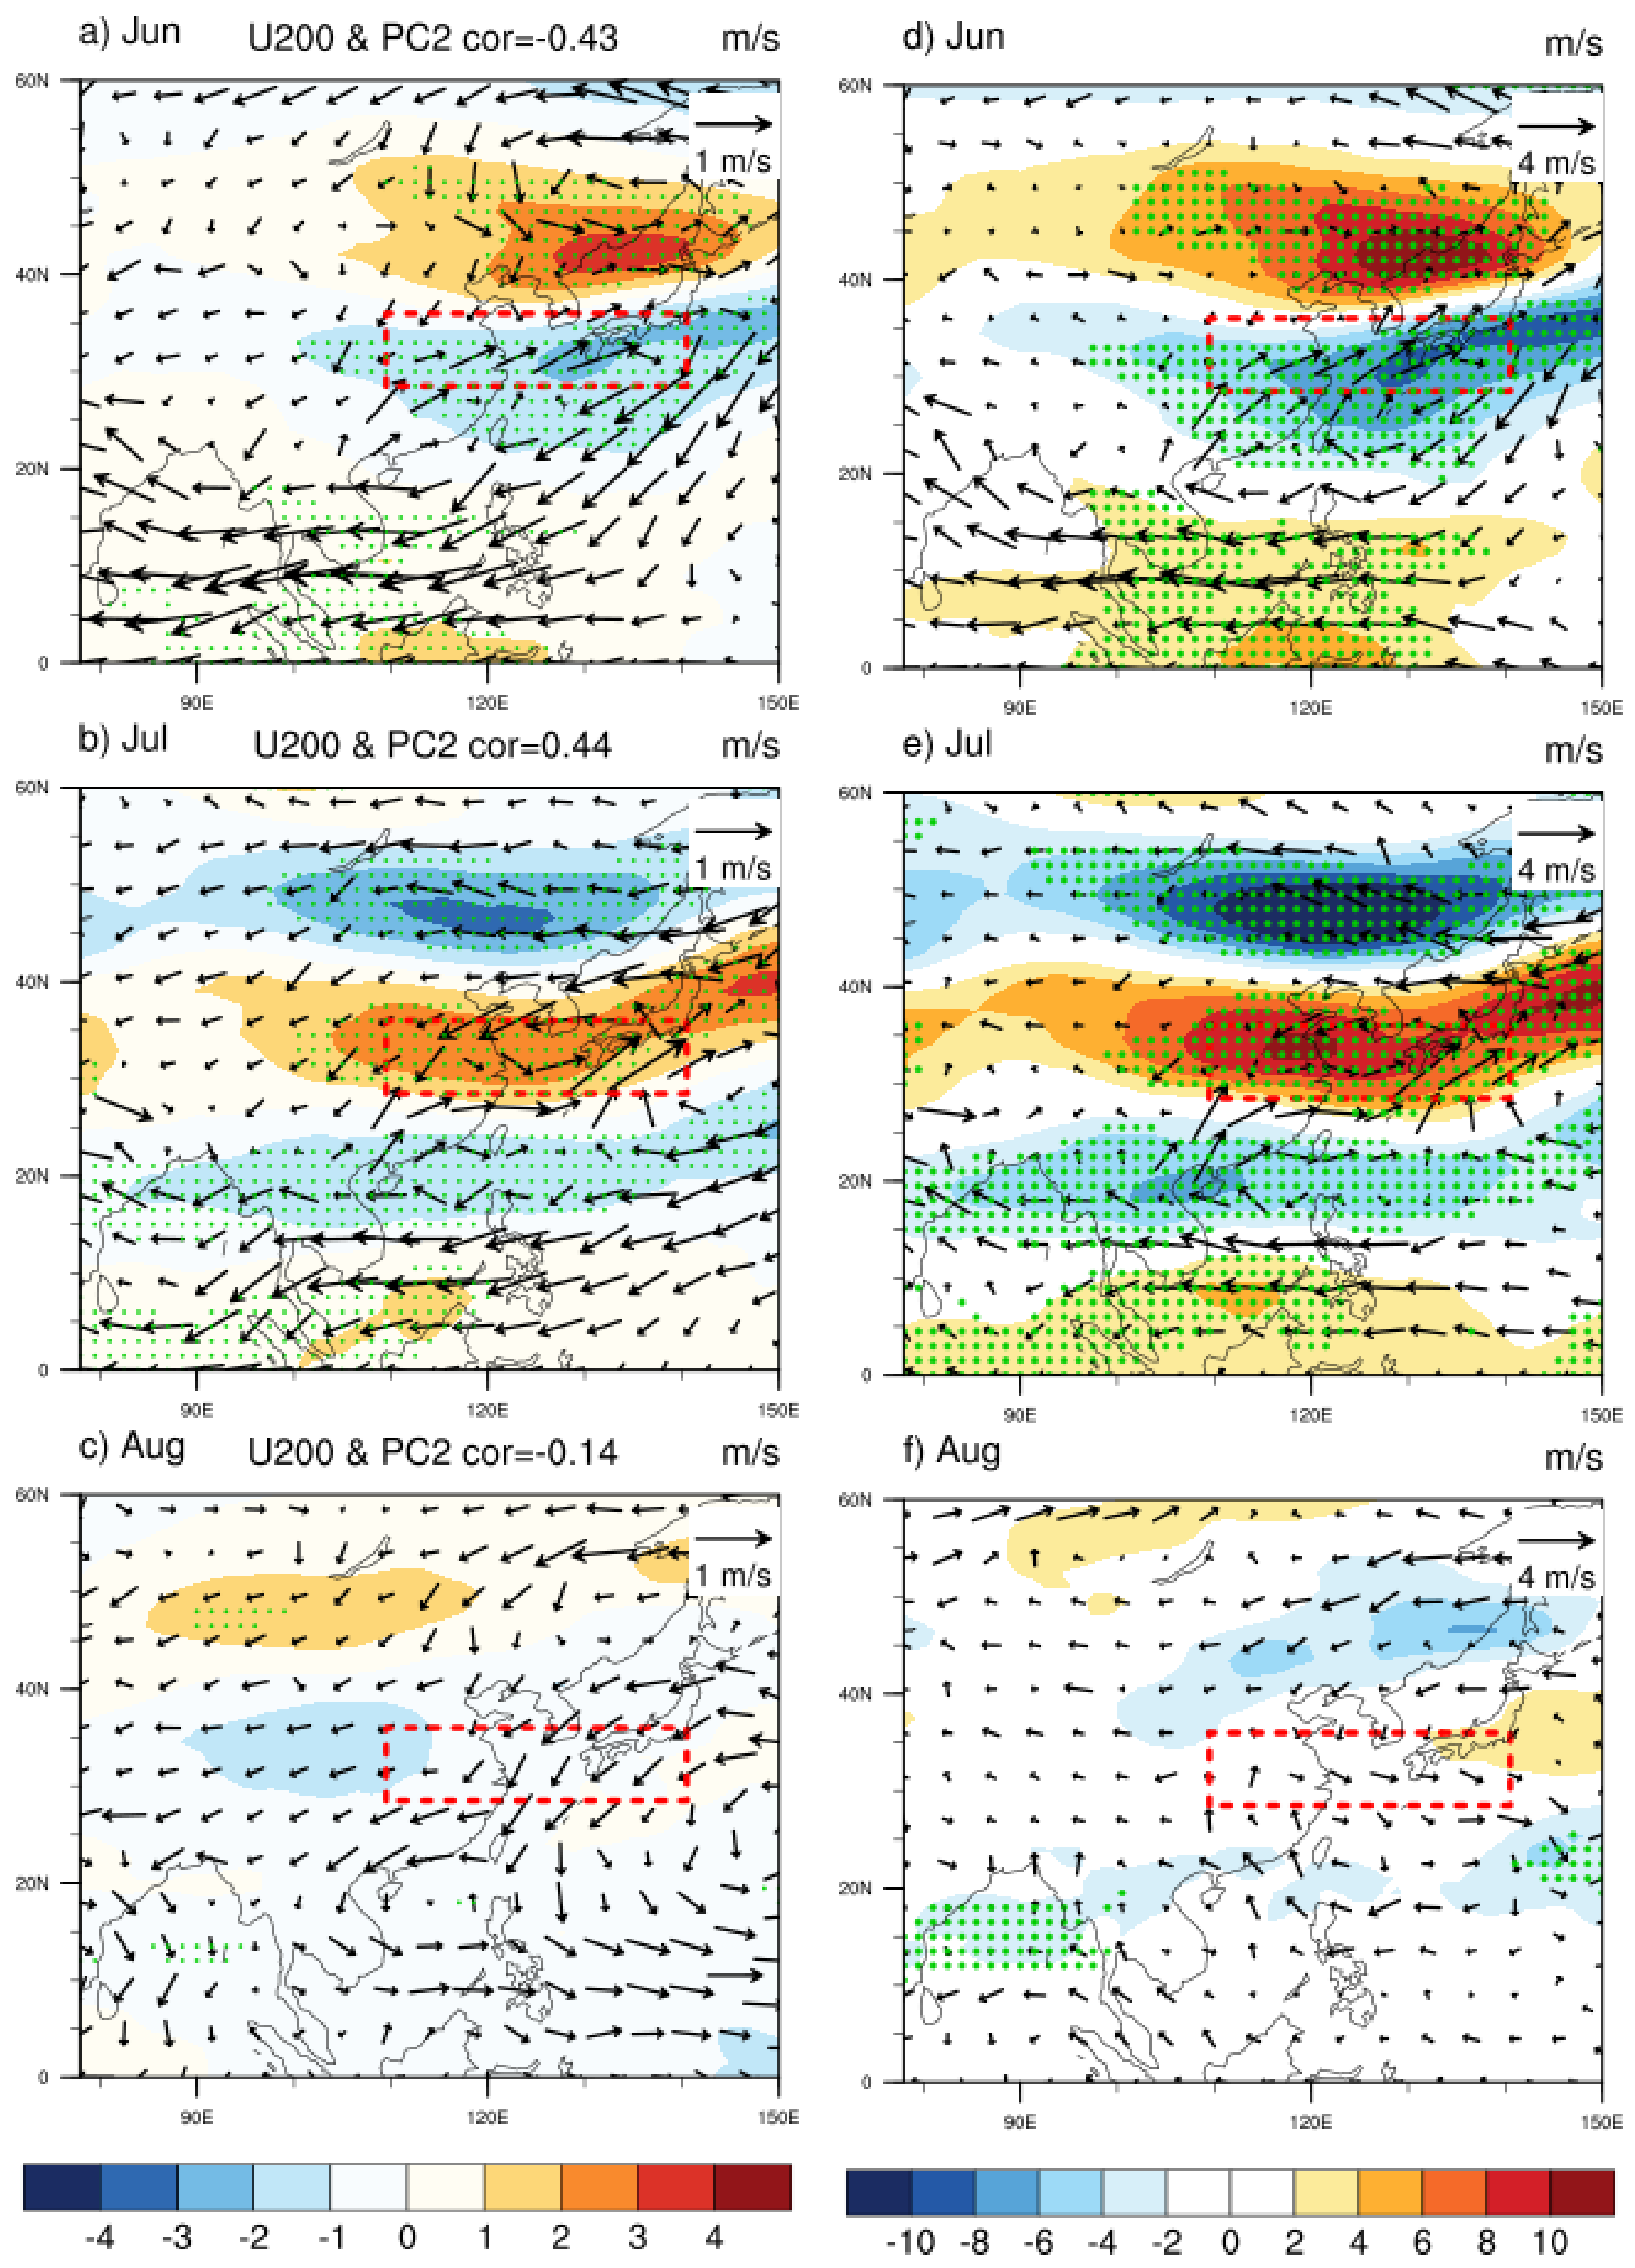
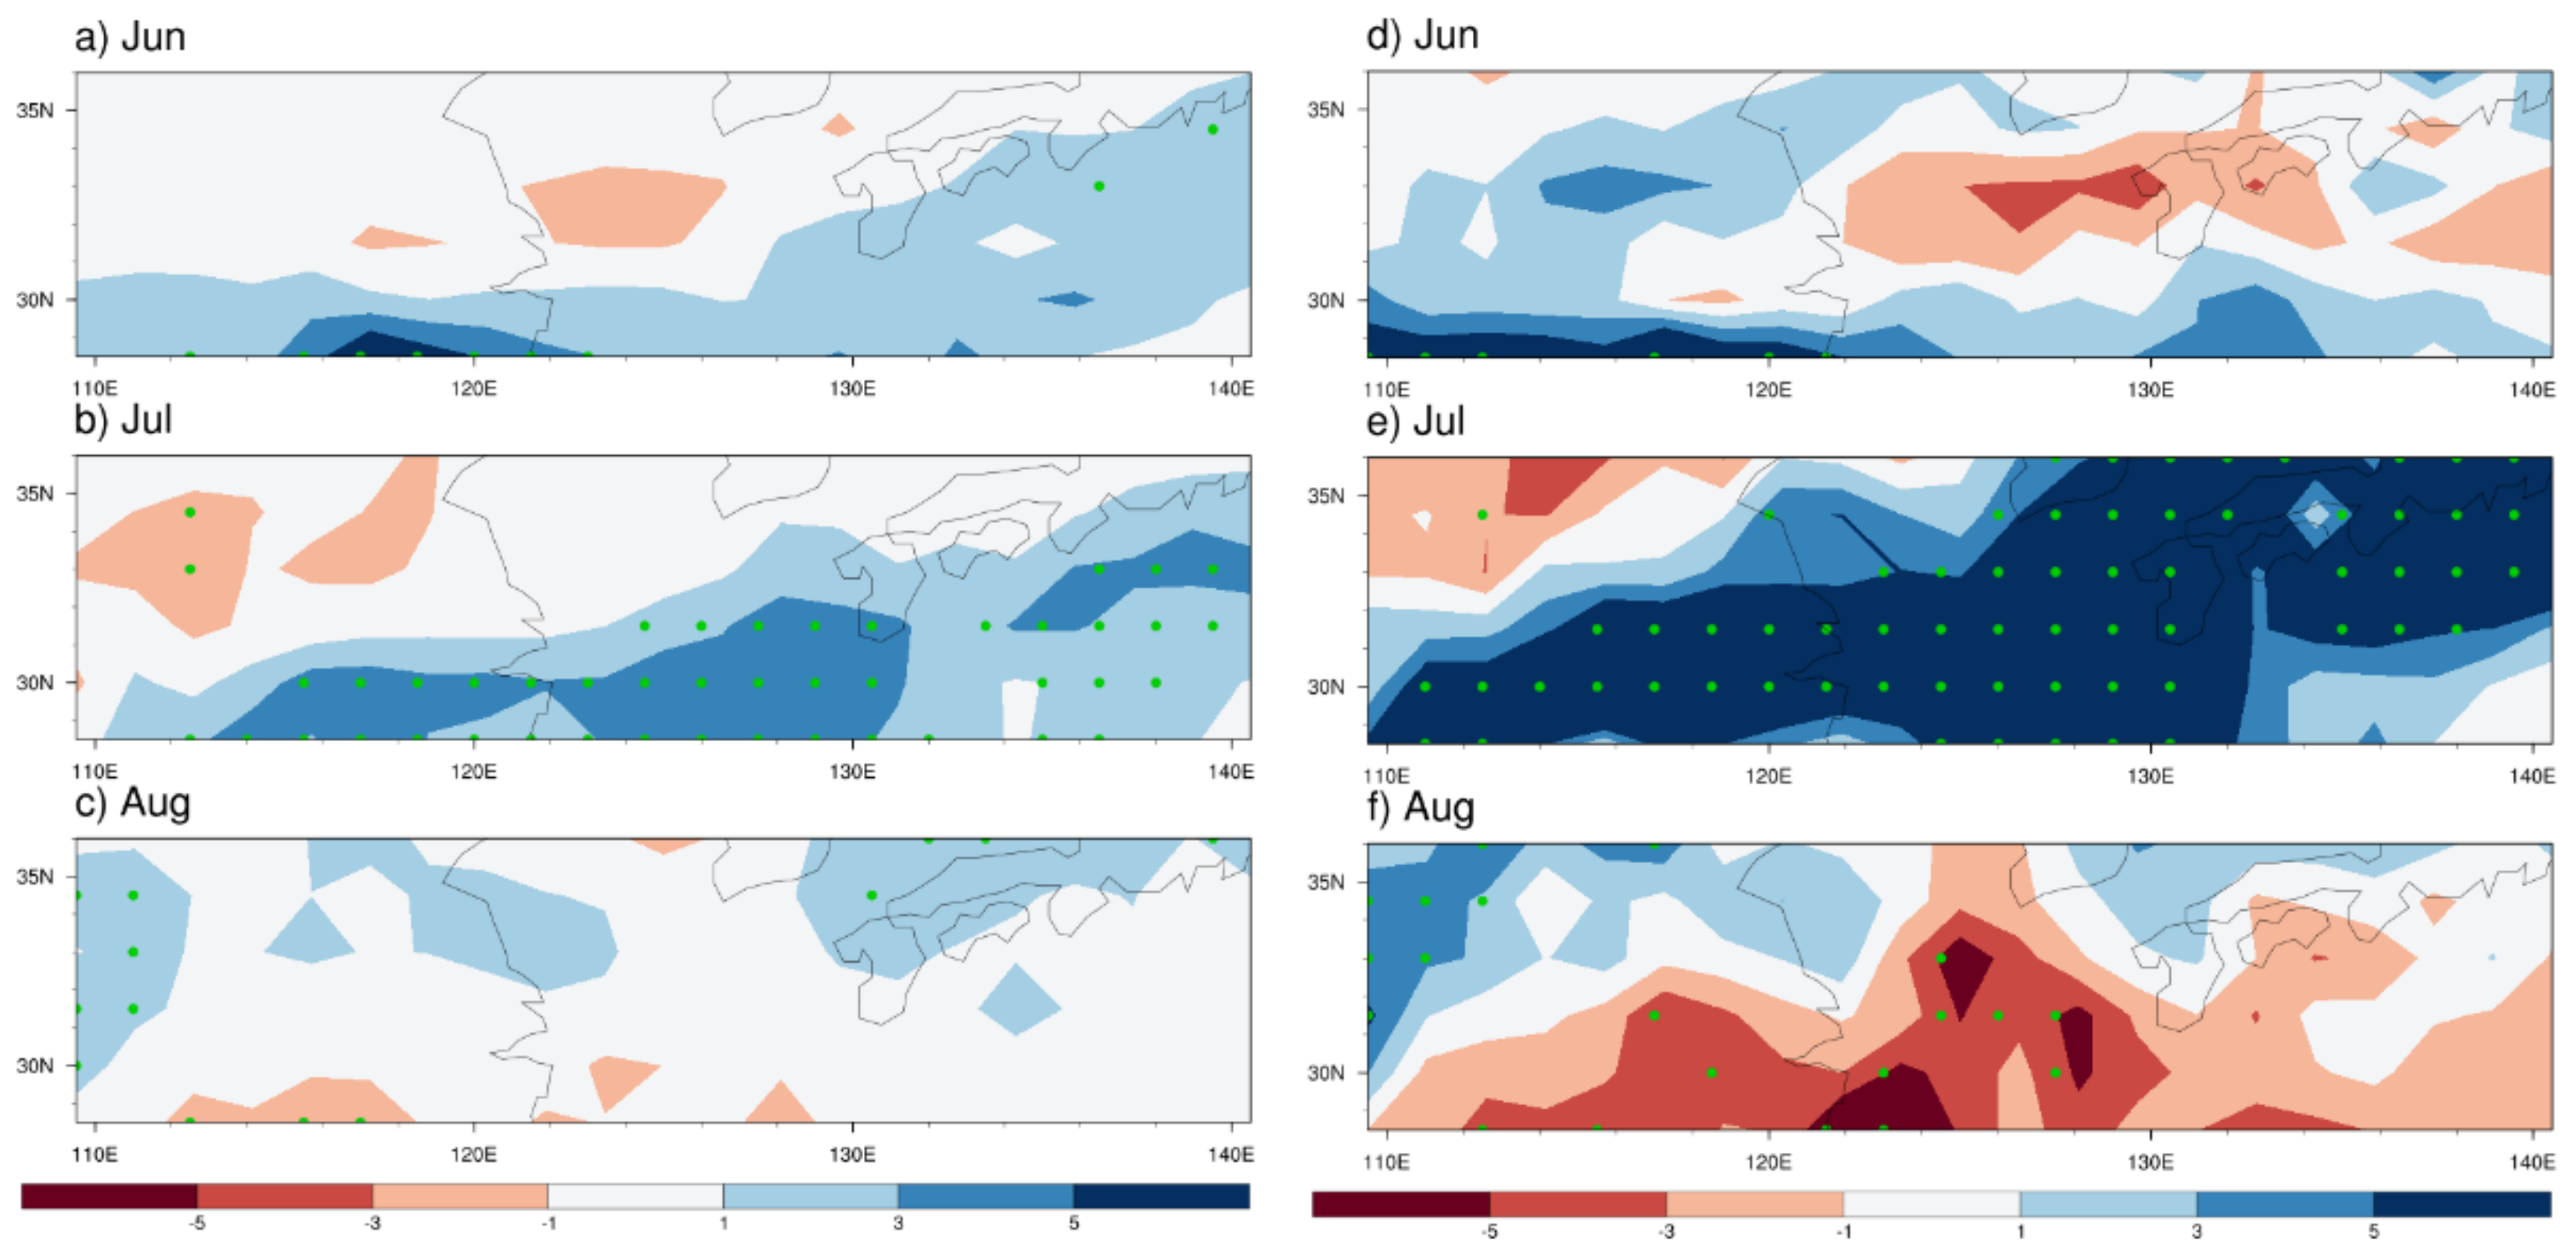
4.1. Circulation Anomaly
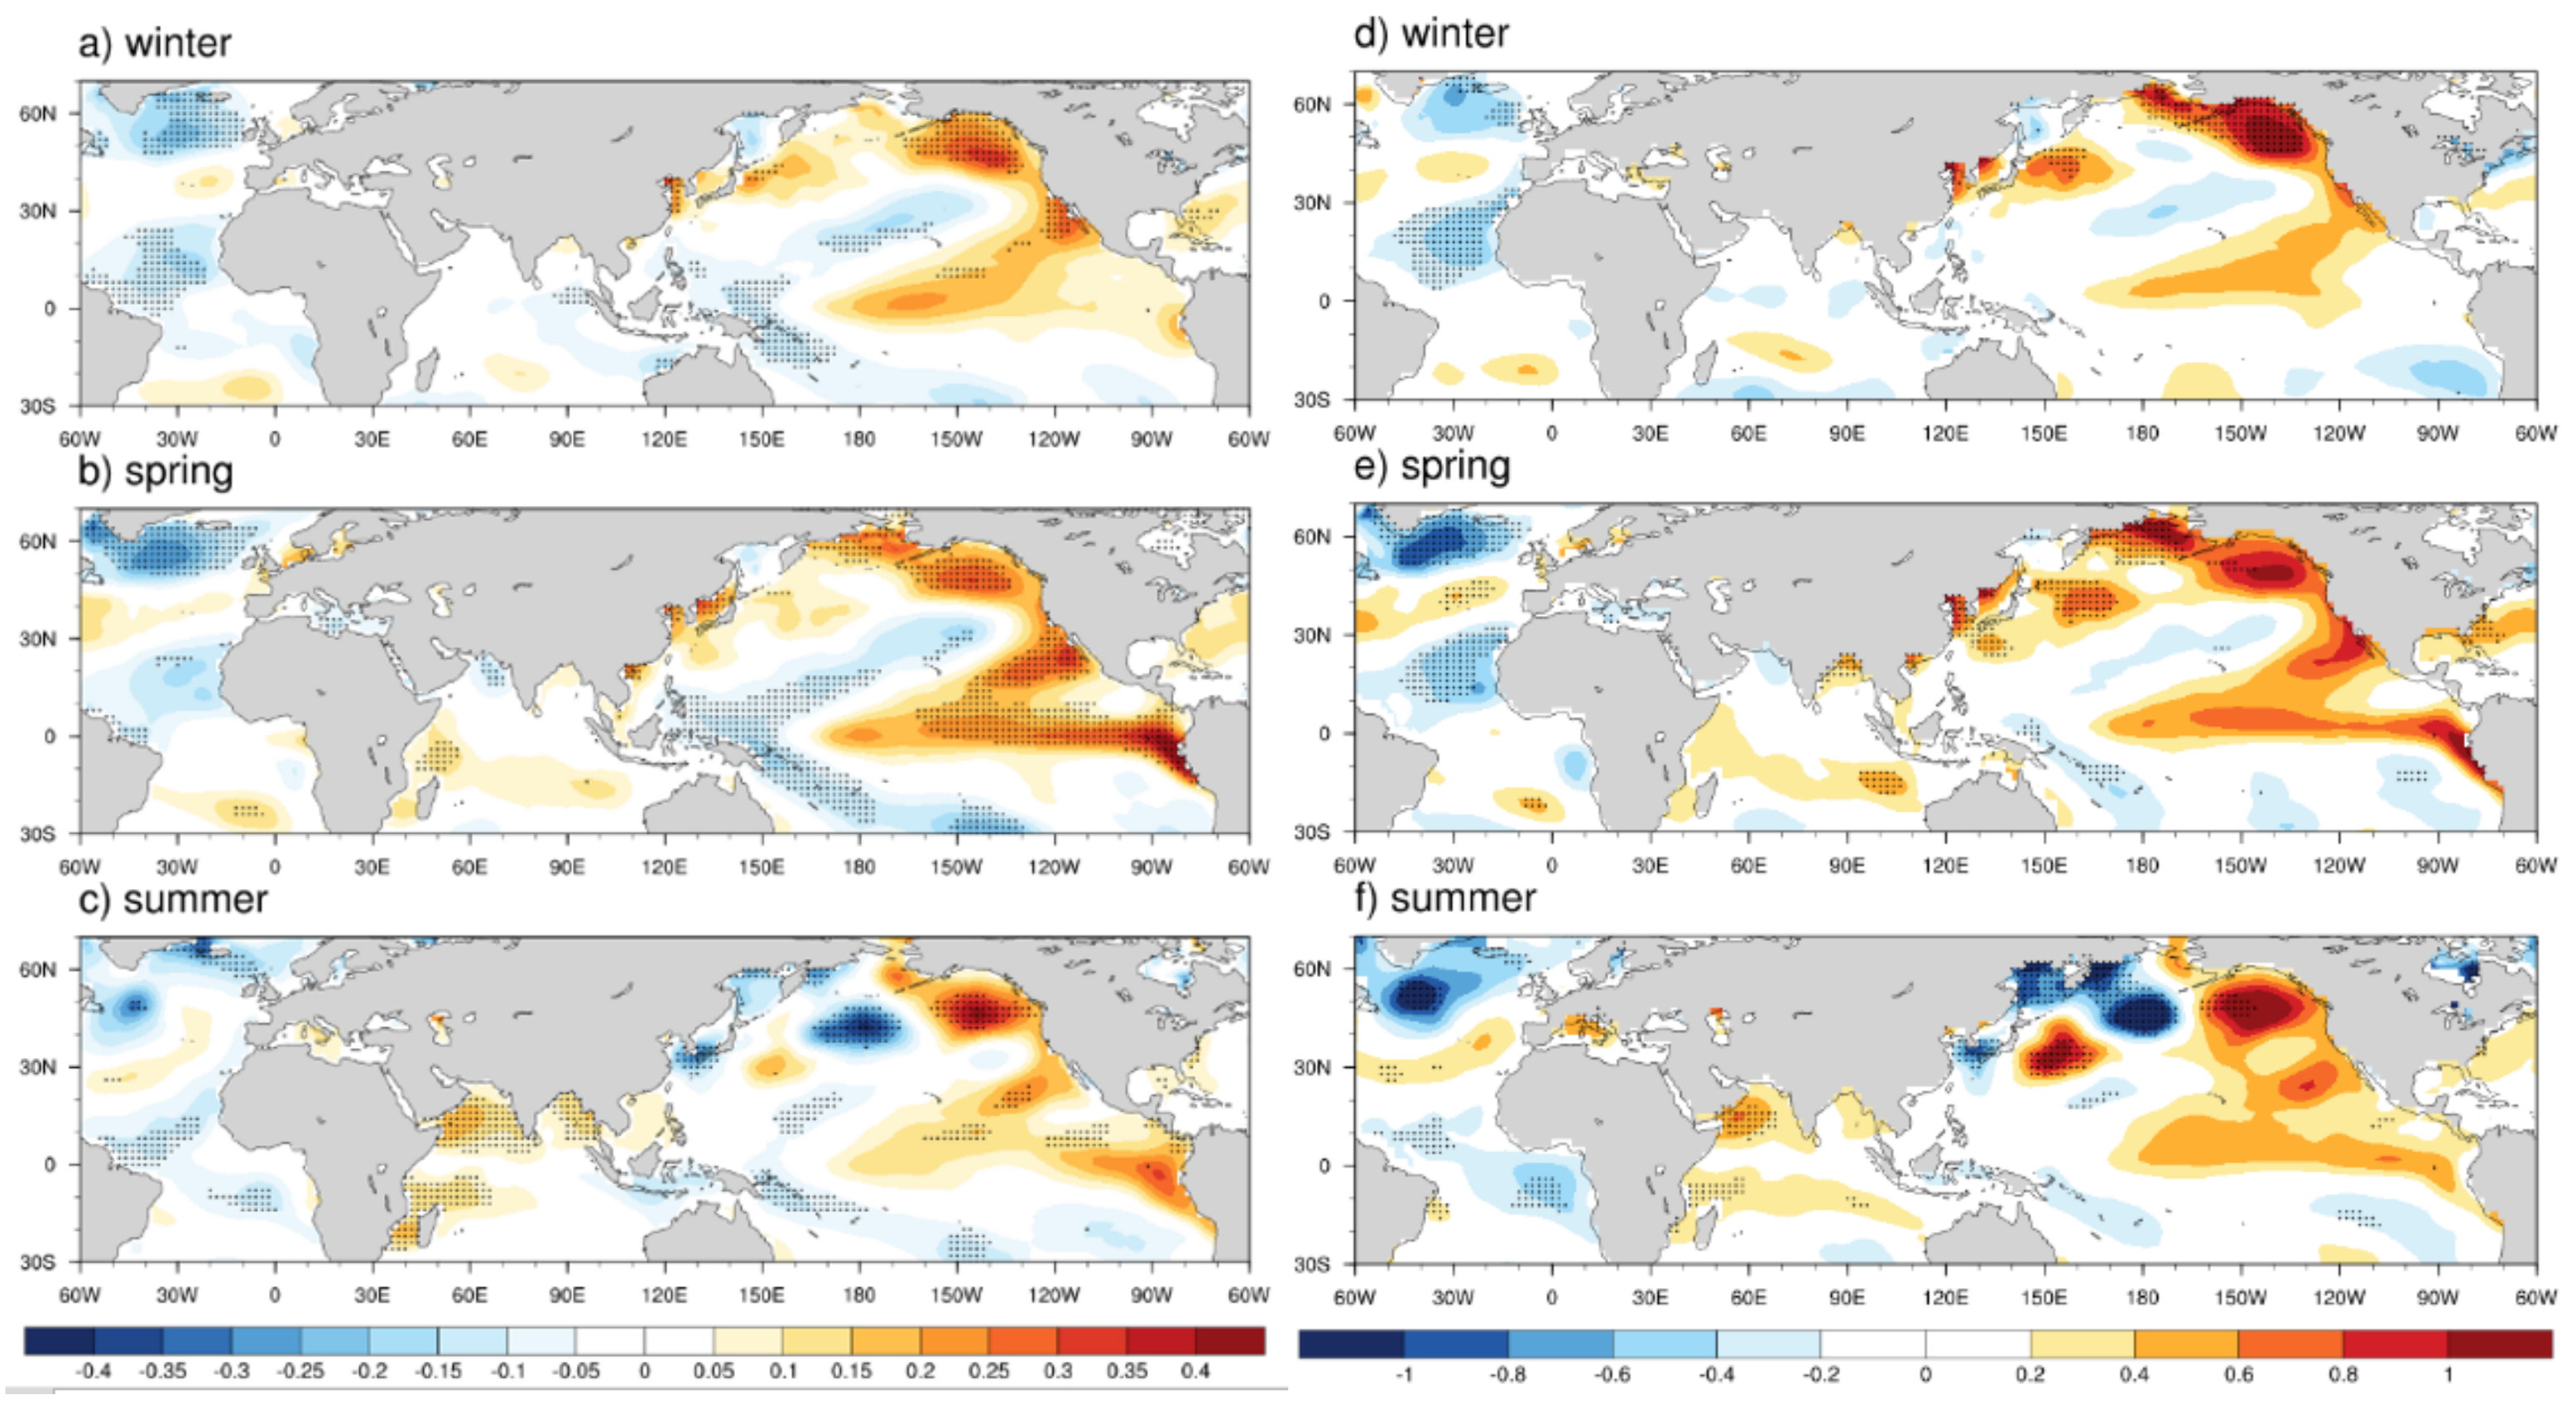
The summer precipitation in the MYA is affected by WPSH, southwest monsoons, East Asian westerly jets, and other lower-to-upper troposphere and multi-latitude circulation systems. Therefore, we analyzed 850 hPa wind, 200 hPa zonal wind, 500 hPa wind, and geopotential height corresponding to the two precipitation modes by regression and typical years’ difference onto PCs. The regression analysis of the first mode in Figure 5a–c shows that pressure was relatively high in the tropical area on the south side of MYA during the summer, and there was an abnormal cyclone in Northeast Asia. The WPSH was extending westward relative to the climatic state, and its ridge line was slightly southward. The southwest monsoon from the Bay of Bengal was strong particularly in July and Aug. The cold air brought by the west side of the cyclone and the warm-humid air from the south converged in MYA. Such conditions are very conducive to the enhancement of precipitation. In East Asia, the geopotential height from the subtropical zone to the mid-high latitudes showed a “positive, negative, positive” anomalous mode (the negative phase of East Asia/ pattern (EAP) pattern) in July and August. Such meridional circulation mode is suitable for more precipitation in subtropical areas in summer [35,36]. Figure 6a–c indicates low-level wind anomalies are more in line with the local winds of cyclones and anticyclones, but compared to 500 hPa, the warm-humid southerly winds from the South China Sea and the West Pacific are more pronounced. It is precisely because of the abovementioned circulation conditions that the vapor transport in the southwest direction of MYA is significantly positive in the whole summer, and the negative anomaly centers of the divergence of vapor flux are highly consistent with the precipitation anomaly centers throughout the summer (Figure 7). It is worth noting that persistent westerly wind anomalies appeared in the upper troposphere (Figure 6). The correlation coefficients between the local westerly wind and PC1 from June to August were 0.38, 0.48, and 0.32, respectively, which exceed the 95%, 99%, and 90% confidence levels, indicating consistency between precipitation and westerly wind. In order to verify this conjecture, we calculated the correlation coefficients of total precipitation and westerly wind in MYA from June to August. The correlation coefficients were 0.45, 0.64, and 0.39, which all exceed the 95% confidence levels. This consistency may be because when the East Asian westerly jet moves southward, more frequent intrusion of cold air from the upper reaches of the north occurs in MYA and the warm humid air from the south is shielded to local area, and this constant clash of warm and cold air results in increased precipitation [26,27].
Figure 5d–f shows that difference analysis and regression analysis have high consistency. The position of the abnormal cyclone in Northeast Asia was similar to the regression analysis. The southwest wind from the Bay of Bengal and the southerly wind from the South China Sea also had the characteristics of strong persistence. Westerly anomalies in the upper troposphere persisted throughout the summer (Figure 6d–f). It is proven that these circulation conditions which are favorable for more precipitation in MYA appear in both analysis methods. However, the negative phase of EAP circulation in East Asia that appeared in July and August in the regression analysis was not obvious in July in the difference analysis.
Figure 8 and Figure 9 show that the circulation anomalies of the second mode present obvious intraseasonal changes. In June, there was an obvious anticyclone in the northeastern region of the MYA. There was a large negative anomaly in the region north of 40° N and the anomaly of geopotential height at low latitudes is not obvious. WPSH was close to the climatic position. The easterly and northeasterly wind anomalies prevailed in the MYA, meanwhile the southwest monsoon was weak. Such conditions are not conducive to the occurrence of precipitation, leading to the feature of less precipitation in the second mode in June. The circulation in July showed obvious changes. The abnormal cyclone controled the northern part of MYA, and the local wind field was similar to the first mode in July, which is conducive to the occurrence of precipitation [8]. The circulation anomaly in August was no longer obvious and the WPSH was little weak. Relative to 850 hPa wind anomalies, there was a more obvious reversion feature appearing in the upper troposphere. In June, easterly wind anomalies dominated much of MYA but turned into westerly wind anomalies in July, and finally the zonal wind anomalies disappeared in August. This obvious reversion of westerly zone is very similar to the precipitation. We calculated the correlation between PC2 and 200 hPa zonal wind and found that they were −0.42, 0.44, and −0.14 from June to August, which confirms the conclusion that westerly wind and precipitation are consistent. The difference synthesis analysis was consistent with the regression analysis. At 500 hPa, there was a transition from local abnormal anticyclone in June to an abnormal cyclone in July and a reversion from easterly to westerly wind anomalies at 200 hPa, and finally these anomalies almost disappeared in August. The vapor flux also had a positive anomaly in the southwest direction only in July. The divergence vapor flux was opposite of that with the precipitation and experienced obvious “+ - +” intraseasonal inversions (Figure 10).

4.2. SSTAs

SSTA is the most important early signal of the East Asian climate. We still received the early SSTA signals of two modes through regression analysis and difference analysis. Figure 11 shows the most significant signals of the first mode of the abnormal warm SST in the equatorial Central–Eastern Pacific in spring and the cold SST in the equatorial Western Pacific. This signal had emerged in the previous winter and reached its peak in spring. It gradually disappeared in summer, while the SST of the equatorial Indian Ocean became higher in summer. This change in SST is the obvious characteristic of the decay of El Niño. This phenomenon combines with the first mode of precipitation, showing that during the summer of the El Niño decaying year, more precipitation in MYA will continue from June to August, which is similar as the predecessors’ study about the influence of ENSO to East Asian climate [12,13,37]. Meanwhile, the warm SSTA of the equatorial Indian Ocean in spring and summer will also affect the Northwest Pacific anticyclone by triggering abnormal baroclinic Kelvin waves and affecting the climate of East Asia [14]. What is interesting is that a warm SST appeared in the Arabian Sea in summer. A recent study by Wang [27] proved that the warm SST in the Arabian Sea will cause the Meiyu retracement date to be postponed, resulting in stronger precipitation in MYA. The analysis results for typical years are similar, but the SSTA in the equatorial eastern Pacific does not pass significance test of synthetic difference analysis. A possible reason is that although the first mode is related to El Niño, the extreme value of precipitation in the first mode is not necessarily consistent with the extreme value of El Niño. For example, 1998, 2010, and 2016 were all strong El Niño years, but the positive anomalies of PC1 were not obvious in these years.
In order to further prove the correlation between the SSTA signals and precipitation anomalies in first mode, we calculated the regression of summer precipitation onto the spring Nino 3 index (5° S–5° N, 150° W–90° W). The regression mode of summer precipitation shown in Figure 12a–c is very similar to the first mode in that more precipitation throughout the summer and the northward movement of an abnormal rain belt from June to July were also manifested.
The SST signal of the second mode was not obvious in the previous winter and spring. In summer, the important water vapor sources in East Asia, such as the Bay of Bengal and the South China Sea [38], had abnormal warmer SST. The signals of difference analysis are consistent with that (Figure 13). These local SSTAs will affect the East Asian climate through coastal–land interaction and water vapor transport. We also calculated the regression of summer precipitation onto these SSTAs of above region (0–20° N, 70° E–120° E). Figure 12d–f shows that the main anomaly appeared in July, with a positive deviation in the rain belt. This anomaly in June was not obvious and there were a lot of negative areas in August, which is similar to the intraseasonal variation of the second mode. These results indicate that the second mode is highly correlated with the SSTAs from the Northern Indian Ocean to the South China Sea.

5. Summary and Discussion

5.1. Summary

The MYA is greatly affected by the EASM, with abundant summer rainfall and frequent floods. ERA5 precipitation and circulation data, ERsst V5 SST data, and various meteorological analysis methods were used to study the main intraseasonal variation modes, circulation field characteristics, and SST signals of summer precipitation anomalies in MYA.
The most precipitation of MYA is in June. The central area was mainly concentrated in the area south of the Yangtze River in China, extending northeastward to southern Japan. In July, the intensity of precipitation weakened and the rain belt moved northward. The YHRB in China and the coastal in southern Japan were two heavy centers. The intensity of precipitation continued to weaken in August and the rain belt disappeared. The spatial distribution of the standard deviation is similar to the mean value of precipitation, manifesting areas with large precipitation values have stronger interannual variability of precipitation.
The main feature of the first mode of summer precipitation by CEOF is that the positive precipitation occurs throughout the summer. The positive anomalies in June mainly appeared in the LRYR and the south of Japan. The center of the anomaly on the sea moved northward in July, and the abnormal rain belt disappeared in the Chinese land area in August. The first mode accounts for 22.2% of the explained variance and have obvious interannual and interdecadal variations. The circulation regression onto PC1 shows that there was always an abnormal cyclone on the north side of MYA and a high-pressure area on the south side at 500 hPa, and that the WPSH extended westward, and its ridge line was southerly. The meridional geopotential height anomalies like the negative phase of EAP appeared over East Asian, which is conducive to the continued intensity of precipitation in MYA. Meanwhile, there were strong southwesterly and southerly winds in the lower troposphere throughout the summer, so the warm and humid air is sufficient. The upper troposphere was characterized by stronger westerly winds and frequent cold air activities. This frontal circulation condition caused more precipitation throughout the summer. The significant SST signals are the decay of El Niño after spring and the corresponding warm SST in the equatorial Indian Ocean in summer. Regression analysis shows that the warm SST of equatorial Central-East Pacific in spring is the signal of the continuous strong precipitation of MYA in summer.
In the second mode, there were north-south antiphase precipitation anomalies in June and a significant negative anomaly center appeared in the southern region. In July, this turned into a positive anomaly in the rain belt area. Finally, the abnormal rain belt disappeared and there were weak negative anomalies in most areas in August. The explained variance accounts for 11.5%, and this mode has significant interannual variation characteristics. The geopotential circulation anomaly corresponding to CEOF2 is that there was the large negative anomaly in the region north of 40° N, and a positive anomaly over Japan in June which then reversed in July. The westerly wind anomaly also showed this reversal in the upper troposphere. The intraseasonal variations of summer precipitation and heavy rainfall in July are related to the warm SST in Northern Indian Ocean and South China Sea.

5.2. Discussion

In this paper, through mathematics and meteorological analysis, the leading intraseasonal variation modes of summer precipitation anomalies in MYA are given and the circulation conditions are analyzed in detail. At the same time, main signals of SSTAs are given in order to provide some theoretical research on climate prediction. Our findings are somewhat consistent with previous research, such as the relationship between ENSO, North Indian Ocean SST, and summer precipitation in MYA, and the effects of circulation such as EAP and the southwest monsoon, etc. [6,12,32,33]. There are also new discoveries in the analysis of the intraseasonal variation characteristics of precipitation anomalies and the corresponding physical mechanisms. With the gradual improvement of weather and climate research, more attention has been paid to short-term extreme weather and climate events. MYA is facing a risk where the short-term heavy precipitation has increased significantly [6]. Precipitation studies on higher resolution time scales such as pentad or week is the next research focus. At the same time, the influence of intraseasonal circulation factors such as Madden-Julian Oscillation and QBO on the precipitation in the MYA is also an important link to improve subseasonal to seasonal forecasts [6,39,40]. Therefore, the research on precipitation in MYA will remain an important weather and climate direction for a long time.

Author Contributions

Conceptualization, Z.Z. and G.F.; methodology, Z.Z., Z.J. and M.T.; validation, Z.Z. and G.F.; formal analysis, Z.J.; investigation, Z.Z. and Z.J.; resources, Z.Z. and G.F.; writing, Z.J. and Z.Z.; visualization, Z.J. All authors have read and agreed to the published version of the manuscript.

Funding

This research was supported by the National Natural Science Foundation of China, grant number U2142207, 41875101 and 41805060; and the National Key R&D Program of China grant number 2017YFC1502303.

Institutional Review Board Statement

Not applicable.

Informed Consent Statement

Not applicable.

Data Availability Statement

The ERA5 data presented in this study are openly available in European Center for Medium-Range Weather Forecasts at https://cds.climate.copernicus.eu/cdsapp#!/search?text=ERA5&type=-dataset (accessed on 11 October 2021). The ERsst V5 data are openly available in National Oceanic and Atmospheric Administration at https://psl.noaa.gov/data/gridded/data.noaa.ersst.v5.html (accessed on 30 November 2021).

Conflicts of Interest

The authors declare no conflict of interest.

References

  1. Yihui, D.; Johnny, C.L.C. The East Asian summer monsoon: An overview. Meteorol. Atmos. Phys. 2005, 89, 117–142. [Google Scholar] [CrossRef]
  2. Tao, S.; Chen, L. A review of recent research on the East Asian summer monsoon in China. In Review in Monsoon Meteorology; Chang, C.P., Krishnamurti, T.N., Eds.; Oxford University Press: Oxford, UK, 1987; pp. 60–92. [Google Scholar]
  3. Tong, M.; Zheng, Z.; Fu, Q. Characteristics of Meiyu seen from multiple observational analyses and reanalyses. Earth Space Sci. 2021, 8, e2021EA001647. [Google Scholar] [CrossRef]
  4. Oh, T.H.; Kwon, W.T.; Ryoo, S.B. Review of the researches on Changma and future observational study (KORMEX). Adv. Atmos. Sci. 1997, 14, 207–222. [Google Scholar] [CrossRef]
  5. Ninomiya, K. The early summer rainy season (BAIU) over Japan. In Monsoon Meteorology; Chang, C.P., Krishnamurti, T.N., Eds.; Oxford University Press: Oxford, UK, 1987; pp. 93–121. [Google Scholar]
  6. Ding, Y.H.; Liang, P.; Liu, Y.J.; Zhang, Y.C. Multiscale variability of Meiyu and its prediction: A new review. J. Geophys. Res. Atmos. 2020, 125, e2019JD031496. [Google Scholar] [CrossRef]
  7. Liu, B.Q.; Yan, Y.H.; Zhu, C.W.; Ma, S.M.; Li, J.Y. Record-breaking Mei-yu rainfall around the Yangtze River in 2020 regulated by the subseasonal phase transition of the North Atlantic Oscillation. Geophys. Res. Lett. 2020, 47, e2020GL090342. [Google Scholar] [CrossRef]
  8. Qiao, S.B.; Chen, D.; Wang, B.; Cheung, H.N.; Liu, F.; Cheng, J.B.; Tang, S.K.; Zhang, Z.P.; Feng, G.L.; Dong, W.J. The Longest 2020 Meiyu Season Over the Past 60 Years: Subseasonal Perspective and Its Predictions. Geophys. Res. Lett. 2021, 48, e2021GL093596. [Google Scholar] [CrossRef]
  9. Gan, N. China has just Contained the Coronavirus. Now it’s Battling Some of the Worst Floods in Decades. CNN, 14 July 2020. Available online: https://edition.cnn.com/2020/07/14/asia/china-flood-coronavirus-intl-hnk/index.html(accessed on 20 October 2021).
  10. Liang, P.; Ding, Y.H. Climatology of intraseasonal Oscillation of East Asia Meiyu. Acta. Meteorol. Sinica. 2012, 3, 418–435. (In Chinese) [Google Scholar]
  11. Liang, P.; Chen, L.J.; Ding, Y.H.; He, J.; Zhou, B. Relationship between long-term variability of Meiyu over the Yangtze River and ocean and Meiyu’s predictability study. Acta Meteorol. Sinica. 2018, 76, 379–393. (In Chinese) [Google Scholar]
  12. Wang, B.; Wu, R.; Fu, X. Pacific-East Asian Teleconnection: How Does ENSO Affect East Asian Climate? J. Clim. 2000, 13, 1517–1536. [Google Scholar] [CrossRef]
  13. Stephan, C.C.; Klingaman, N.P.; Vidale, P.L.; Turner, A.G.; Demory, M.E.; Liang, G. A comprehensive analysis of coherent rainfall patterns in China and potential drivers. Part I: Interannual variability. Clim. Dyn. 2018, 50, 1–20. [Google Scholar] [CrossRef]
  14. Xie, S.P.; Hu, K.M.; Jan, H.; Du, Y. Indian Ocean Capacitor Effect on Indo–Western Pacific Climate during the Summer following El Niño. J. Clim. 2009, 22, 730–747. [Google Scholar] [CrossRef]
  15. Si, D.; Ding, Y.H. Oceanic forcings of the interdecadal variability in East Asian summer rainfall. J. Clim. 2016, 29, 7633–7649. [Google Scholar] [CrossRef]
  16. Ding, Y.H.; Si, D.; Liu, Y.J.; Wang, Z.; Li, Y.; Zhao, L.; Song, Y. On the characteristics, driving forces and inter-decadal variability of the East Asian summer monsoon. Chin. J. Atmos. Sci. 2018, 42, 90–115. (In Chinese) [Google Scholar]
  17. Kimoto, M. Simulated change of the East Asian circulation under global warming scenario. Geophys. Res. Lett. 2005, 32, L16701. [Google Scholar] [CrossRef]
  18. Wang, Z.L.; Zhang, H.; Guo, P.W. Effects of black carbon aerosol in South Asia on Asian summer monsoon. Plateau Meteorol. 2009, 28, 419–424. (In Chinese) [Google Scholar]
  19. Jung, W.S.; Panicker, A.S.; Lee, D.I.; Park, S.H. Estimates of aerosol indirect effect from Terra MODIS over Republic of Korea. Adv. Meteorol. 2013, 2013, 976813. [Google Scholar] [CrossRef]
  20. Ma, Y.X.; Zhang, Y.C. Numerical study of the impacts of urban expansion on Meiyu precipitation over Eastern China. J. Meteorol. Res. 2015, 29, 237–256. [Google Scholar] [CrossRef]
  21. Xue, F.; Zhao, J.J. Intraseasonal variation of the East Asian summer monsoon in La Niña years. Atmos. Ocean. Sci. Lett. 2017, 10, 156–167. [Google Scholar] [CrossRef] [Green Version]
  22. Fan, Y.; Fan, K. Pacific decadal oscillation and the decadal change in the intensity of the interannual variability of the South China Sea summer monsoon. Atmos. Ocean. Sci. Lett. 2017, 10, 162–167. [Google Scholar] [CrossRef] [Green Version]
  23. Yoon, J.; Yeh, S.W. Influence of the Pacific decadal oscillation on the relationship between El Niño and the Northeast Asian summer monsoon. J. Clim. 2010, 23, 4525–4537. [Google Scholar] [CrossRef]
  24. Geng, X.; Zhang, W.; Jin, F.F.; Stuecker, M.F.; Levine, A.F.Z. Modulation of the Relationship between ENSO and Its Combination Mode by the Atlantic Multidecadal Oscillation. J. Clim. 2020, 33, 4679–4695. [Google Scholar] [CrossRef] [Green Version]
  25. Pandey, P.; Dwivedi, S.; Goswami, B.N.; Kucharski, F. A new perspective on ENSO-Indian summer monsoon rainfall relationship in a warming environment. Clim. Dyn. 2020, 55, 1–20. [Google Scholar] [CrossRef]
  26. Ding, Y.; Liu, Y.; Hu, Z.Z. The Record-breaking Meiyu in 2020 and Associated Atmospheric Circulation and Tropical SST Anomalies. Adv. Atmos. Sci. 2021, 38, 1980–1993. [Google Scholar] [CrossRef] [PubMed]
  27. Wang, J.; Liu, Y.; Ding, Y.; Wu, Z. Towards influence of Arabian Sea SST anomalies on the withdrawal date of Meiyu over the Yangtze-Huaihe River basin. Atmos. Res. 2021, 249, 105340. [Google Scholar] [CrossRef]
  28. Ma, Y.; Chen, W.; Wang, L. A comparative study of the interannual variation of summer rainfall anomolies between the Huaihe Meiyu season and the Jiangnan Meiyu season and their climate background. Acta Meteor. Sin. 2011, 69, 334–343. [Google Scholar]
  29. Ma, Y.; Chen, W.; Fong, S.K.; Leong, K.C.; Leong, W.K. Interannual and interdecadal variations of precipitation over eastern China during Meiyu season and their relationships with the atmospheric circulation and SST. Chin. J. Atmos. Sci. 2012, 36, 397–410. (In Chinese) [Google Scholar]
  30. Sun, B.; Wang, H.; Zhou, B.; Li, H. Interdecadal variation in the synoptic features of Meiyu in the Yangtze River valley region and relationship with the Pacific decadal oscillation. J. Clim. 2019, 32, 6251–6270. [Google Scholar] [CrossRef]
  31. Yang, J.H.; Jiang, Z.H.; Wang, P.X.; Bai, H.Z. Intra-seasonal inhomogeneity of summer extreme precipitation in the east part of Northwest China. J. Appl. Meteorol. Sci. 2008, 19, 111–115. (In Chinese) [Google Scholar]
  32. Chang, C.P.; Zhang, Y.; Li, T. Interannual and interdecadal variations of the East Asian Summer Monsoon and tropical pacific SSTs. Part II: Meridional structure of the monsoon. J. Clim. 2000, 13, 4326–4340. [Google Scholar] [CrossRef]
  33. Zhang, Q.; Zheng, Y.J.; Singh, V.P.; Luo, M.; Xie, Z.H. Summer extreme precipitation in eastern China: Mechanisms and impacts. J. Geophys. Res. Atmos. 2017, 122, 2766–2788. [Google Scholar] [CrossRef]
  34. North, G.R.; Bell, T.L.; Cahalan, R.F.; Moeng, F.J. Sampling Errors in the Estimation of Empirical Orthogonal Functions. Mon. Weather Review 1982, 110, 699. [Google Scholar] [CrossRef]
  35. Yang, H.X.; Xiao, T.G.; Jin, R.H. Analysis of Time and Space and Circulation Characteristics of EAP Teleconnection Patterns in the Northern Hemisphere in Summer. J. Chengdu Univ. Inf. Technol. 2018, 430–437. [Google Scholar] [CrossRef]
  36. Chen, Y.; Zhai, P.; Liao, Z.; Li, L. Persistent precipitation extremes in the Yangtze River Valley prolonged by opportune configuration among atmospheric teleconnections. Quart. J. R. Meteorol. Soc. 2019, 145, 2603–2626. [Google Scholar] [CrossRef]
  37. Feng, J.; Chen, W.; Wang, X. Reintensification of the Anomalous Western North Pacific Anticyclone during the El Nio Modoki Decaying Summer: Relative Importance of Tropical Atlantic and Pacific SST Anomalies. J. Clim. 2020, 33, 3271–3288. [Google Scholar] [CrossRef]
  38. Han, Z.; Su, T.; Zhang, Q.; Wen, Q.; Feng, G. Thermodynamic and dynamic effects of increased moisture sources over the tropical indian ocean in recent decades. Clim. Dyn. 2019, 53, 7081–7096. [Google Scholar] [CrossRef]
  39. Tseng, K.C.; Barnes, E.A.; Maloney, E.D. Prediction of the midlatitude response to strong Madden-Julian Oscillation events on S2S time scales. Geophys. Res. Lett. 2018, 45, 463–470. [Google Scholar] [CrossRef]
  40. Vitart, F.; Robertson, A.W. The sub-seasonal to seasonal prediction project (S2S) and the prediction of extreme events. Npj Clim. Atmos. Sci. 2018, 1, 1–7. [Google Scholar]
Figure 1. Climatological mean (ac) and standard deviations (df) of precipitation for each month in summer from 1991 to 2020.
Atmosphere 13 00217 g001
Figure 2. The spatial patterns for the first (ac) and second (df) combined empirical orthogonal function (CEOF) modes of monthly precipitation anomalies in summer.
Atmosphere 13 00217 g002
Figure 3. The corresponding time series for the first (a) and second (b) CEOF modes.
Atmosphere 13 00217 g003
Figure 4. The spatial patterns for the precipitation difference between the five most positive years and the five most negative years (ac) for the first time series (PC1) and (df) for (PC2). Stippled areas indicate the difference that exceeds the 90% confidence levels.
Atmosphere 13 00217 g004
Figure 5. Regression maps (ac) of 500 hPa geopotential height (shading) and winds (vectors) onto PC1. Green line represents the regression 5880 line and red line represents the climatological mean 5880 line. The difference maps (df) of the same elements between the five most positive years and the five most negative years in PC1. Stippled areas indicate geopotential height anomalies and differences that exceed the 90% confidence levels.
Atmosphere 13 00217 g005
Figure 6. Regression maps (ac) of 200 hPa zonal wind (shading) and 850 hPa winds (vectors) onto PC1. The difference maps (df) of the same elements between the five most positive years and the five most negative years in PC1. Stippled areas indicate 200 hPa zonal wind anomalies and differences that exceed the 90% confidence levels.
Atmosphere 13 00217 g006
Figure 7. Regression maps (ac) of divergence of vapor flux (DVF, shading) and vapor flux (vectors) integral from 900 hPa to 300 hPa onto PC1. The difference maps (df) of same elements between the five most positive years and the five most negative years in PC1. Stippled areas indicate DVF anomalies and differences that exceed the 90% confidence levels. Units: 10 × 105 kg/(m2·s).
Atmosphere 13 00217 g007
Figure 8. Same as Figure 5 but for PC2. Regression maps are (ac) and difference maps are (df).
Atmosphere 13 00217 g008
Figure 9. Same as Figure 6 but for PC2. Regression maps are (ac) and difference maps are (df).
Atmosphere 13 00217 g009
Figure 10. Same as Figure 7 but for PC2. Regression maps are (ac) and difference maps are (df).
Atmosphere 13 00217 g010
Figure 11. Regression maps (ac) of sea surface temperature (SST) onto PC1. The difference maps (df) of the same elements between the five most positive years and the five most negative years in PC1. Stippled areas indicate anomalies and differences that exceed the 90% confidence levels. Units: °C.
Atmosphere 13 00217 g011
Figure 12. Regression maps of precipitation onto spring Nino 3 (5° S–5° N, 150° W–90° W) index (ac) and summer North Indian Ocean to South China Sea SSTAs (0–20° N,70–120° E) (df). Stippled areas indicate anomalies that exceed the 90% confidence levels. Units: mm/d.
Atmosphere 13 00217 g012
Figure 13. Same as Figure 11 but for PC2. Regression maps are (ac) and difference maps are (df).
Atmosphere 13 00217 g013
Publisher’s Note: MDPI stays neutral with regard to jurisdictional claims in published maps and institutional affiliations.

