
Insights on In-Situ Photochemistry Associated with Ozone Reduction in Guangzhou during the COVID-19 Lockdown

Abstract
:1. Introduction
2. Methodology
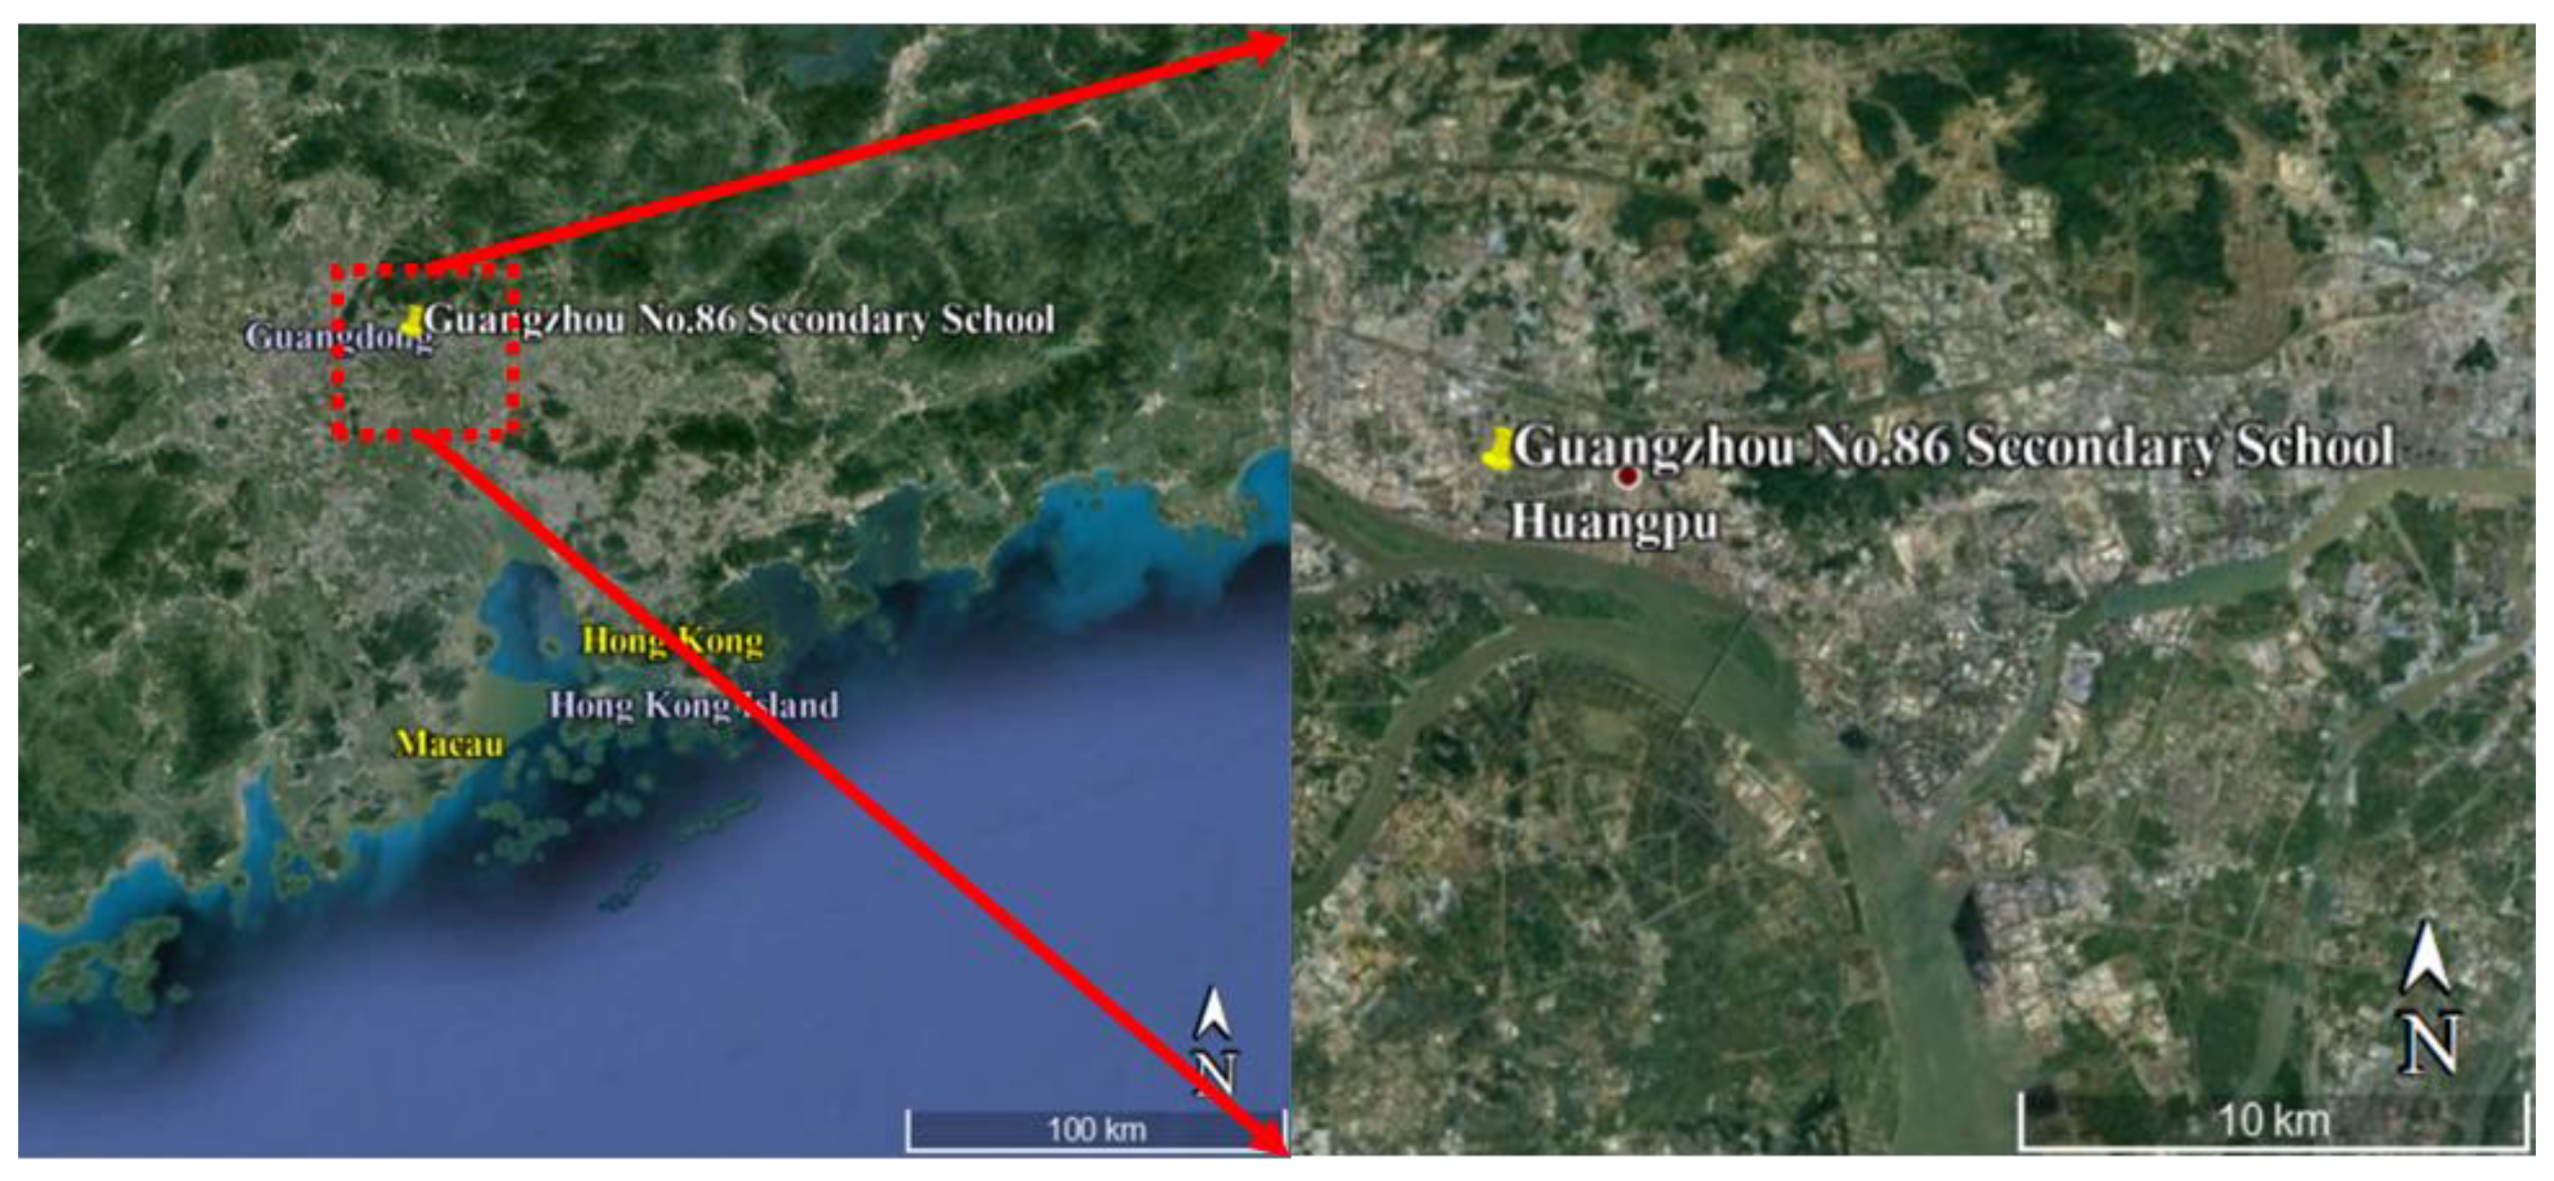
2.1. Data Sources
2.2. Missing Data Treatment and Uncertainty
2.3. Photochemical Box Model
3. Results and Discussion
3.1. Meteorological Conditions and Trace Gases
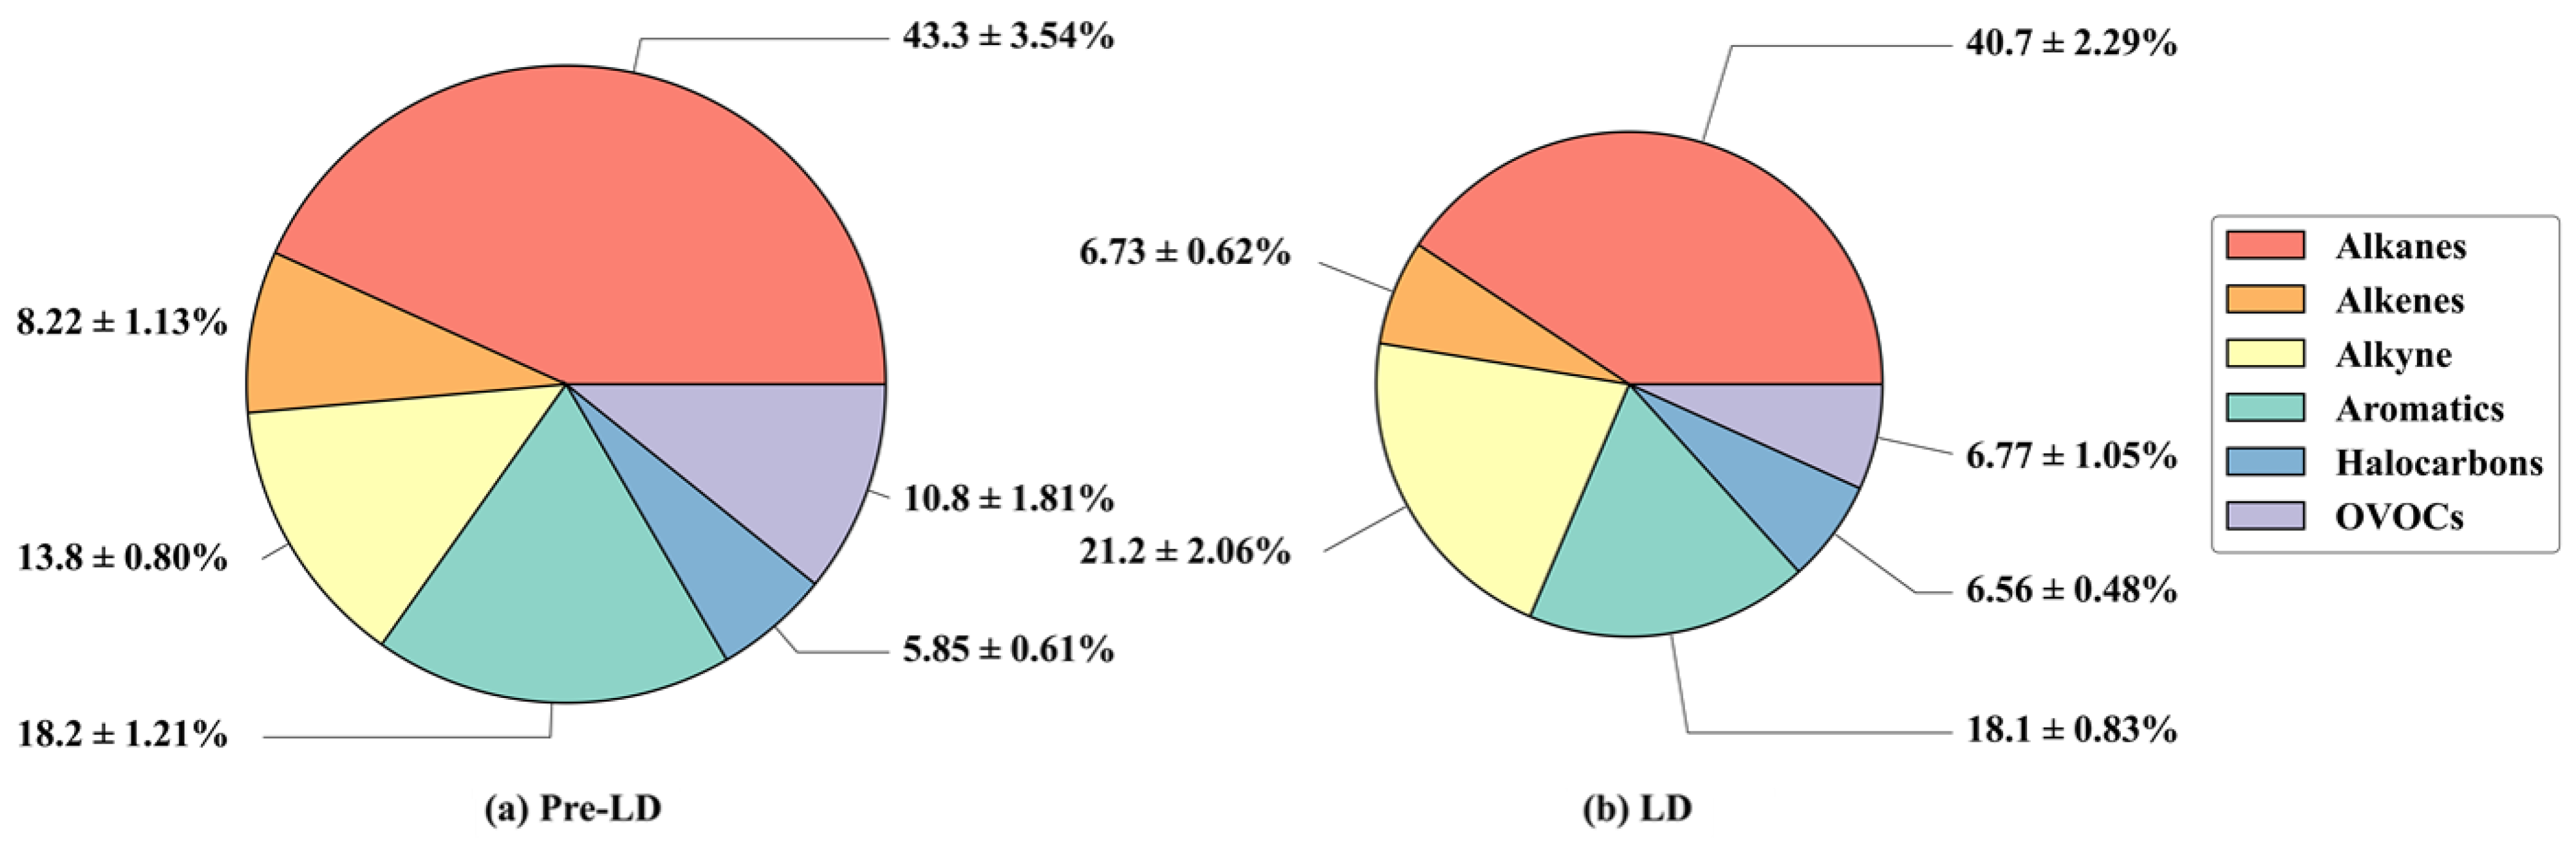
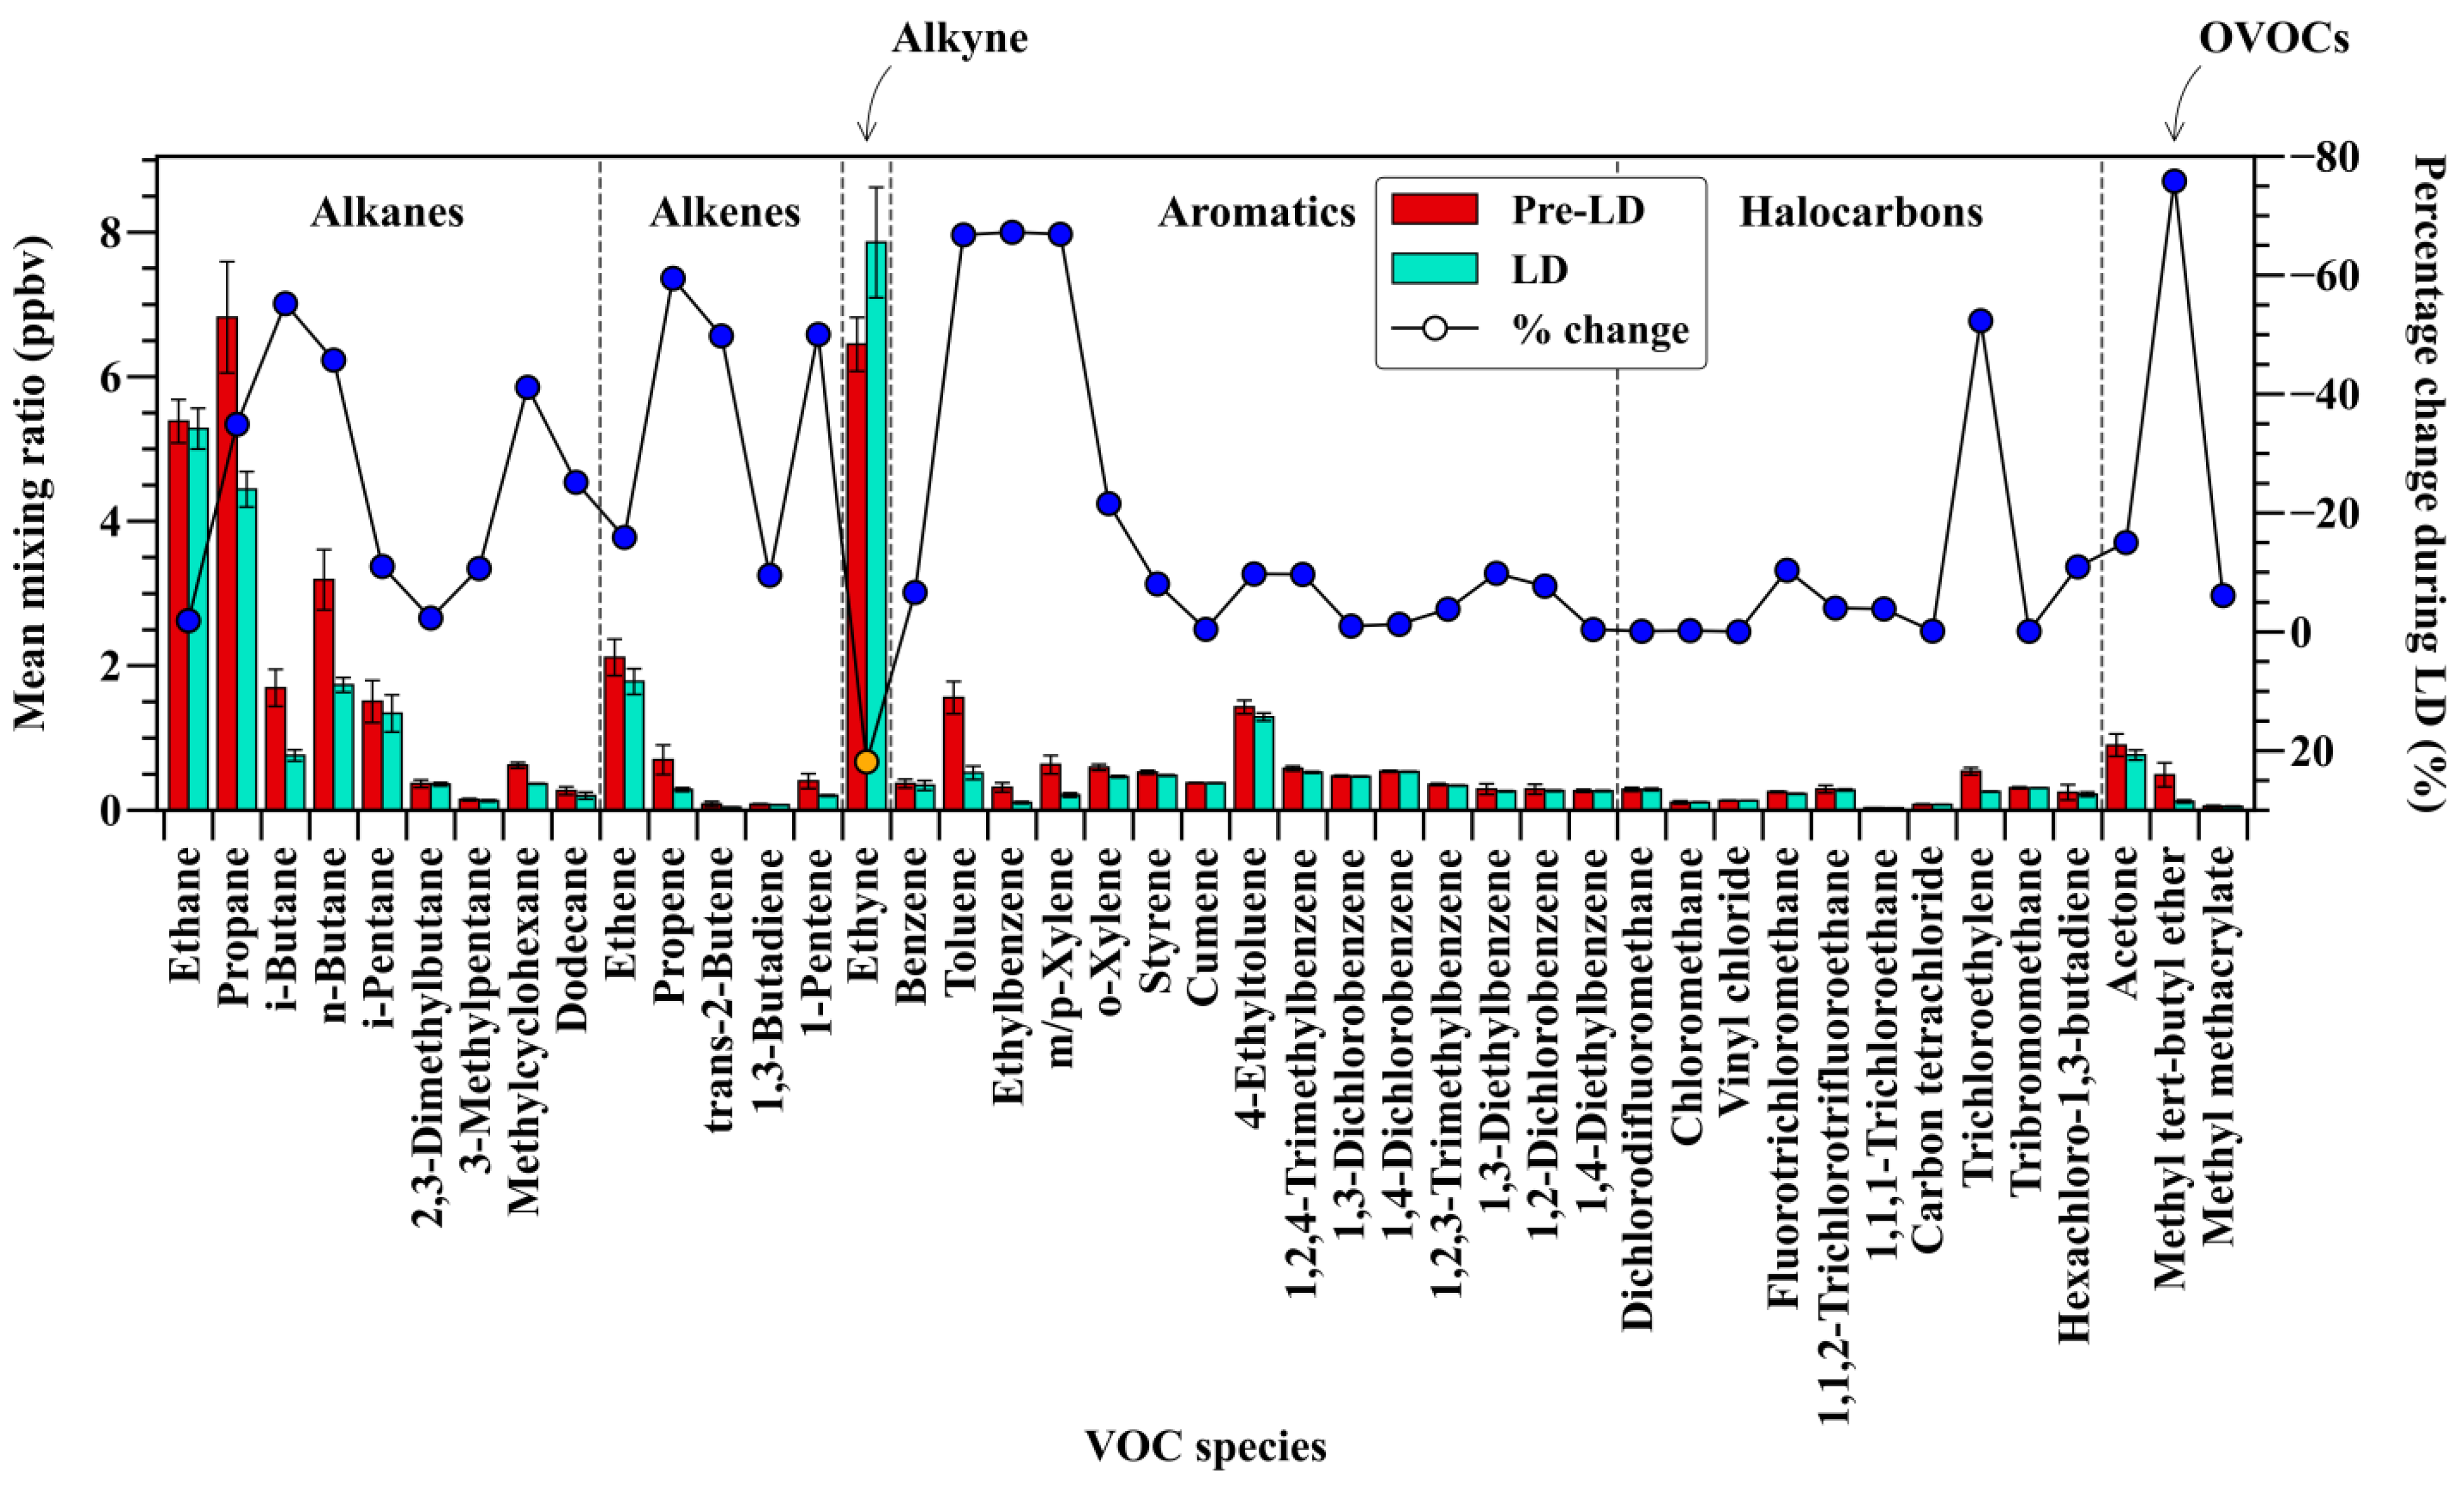
3.2. Changes in Mixing Ratios and Compositions of VOCs
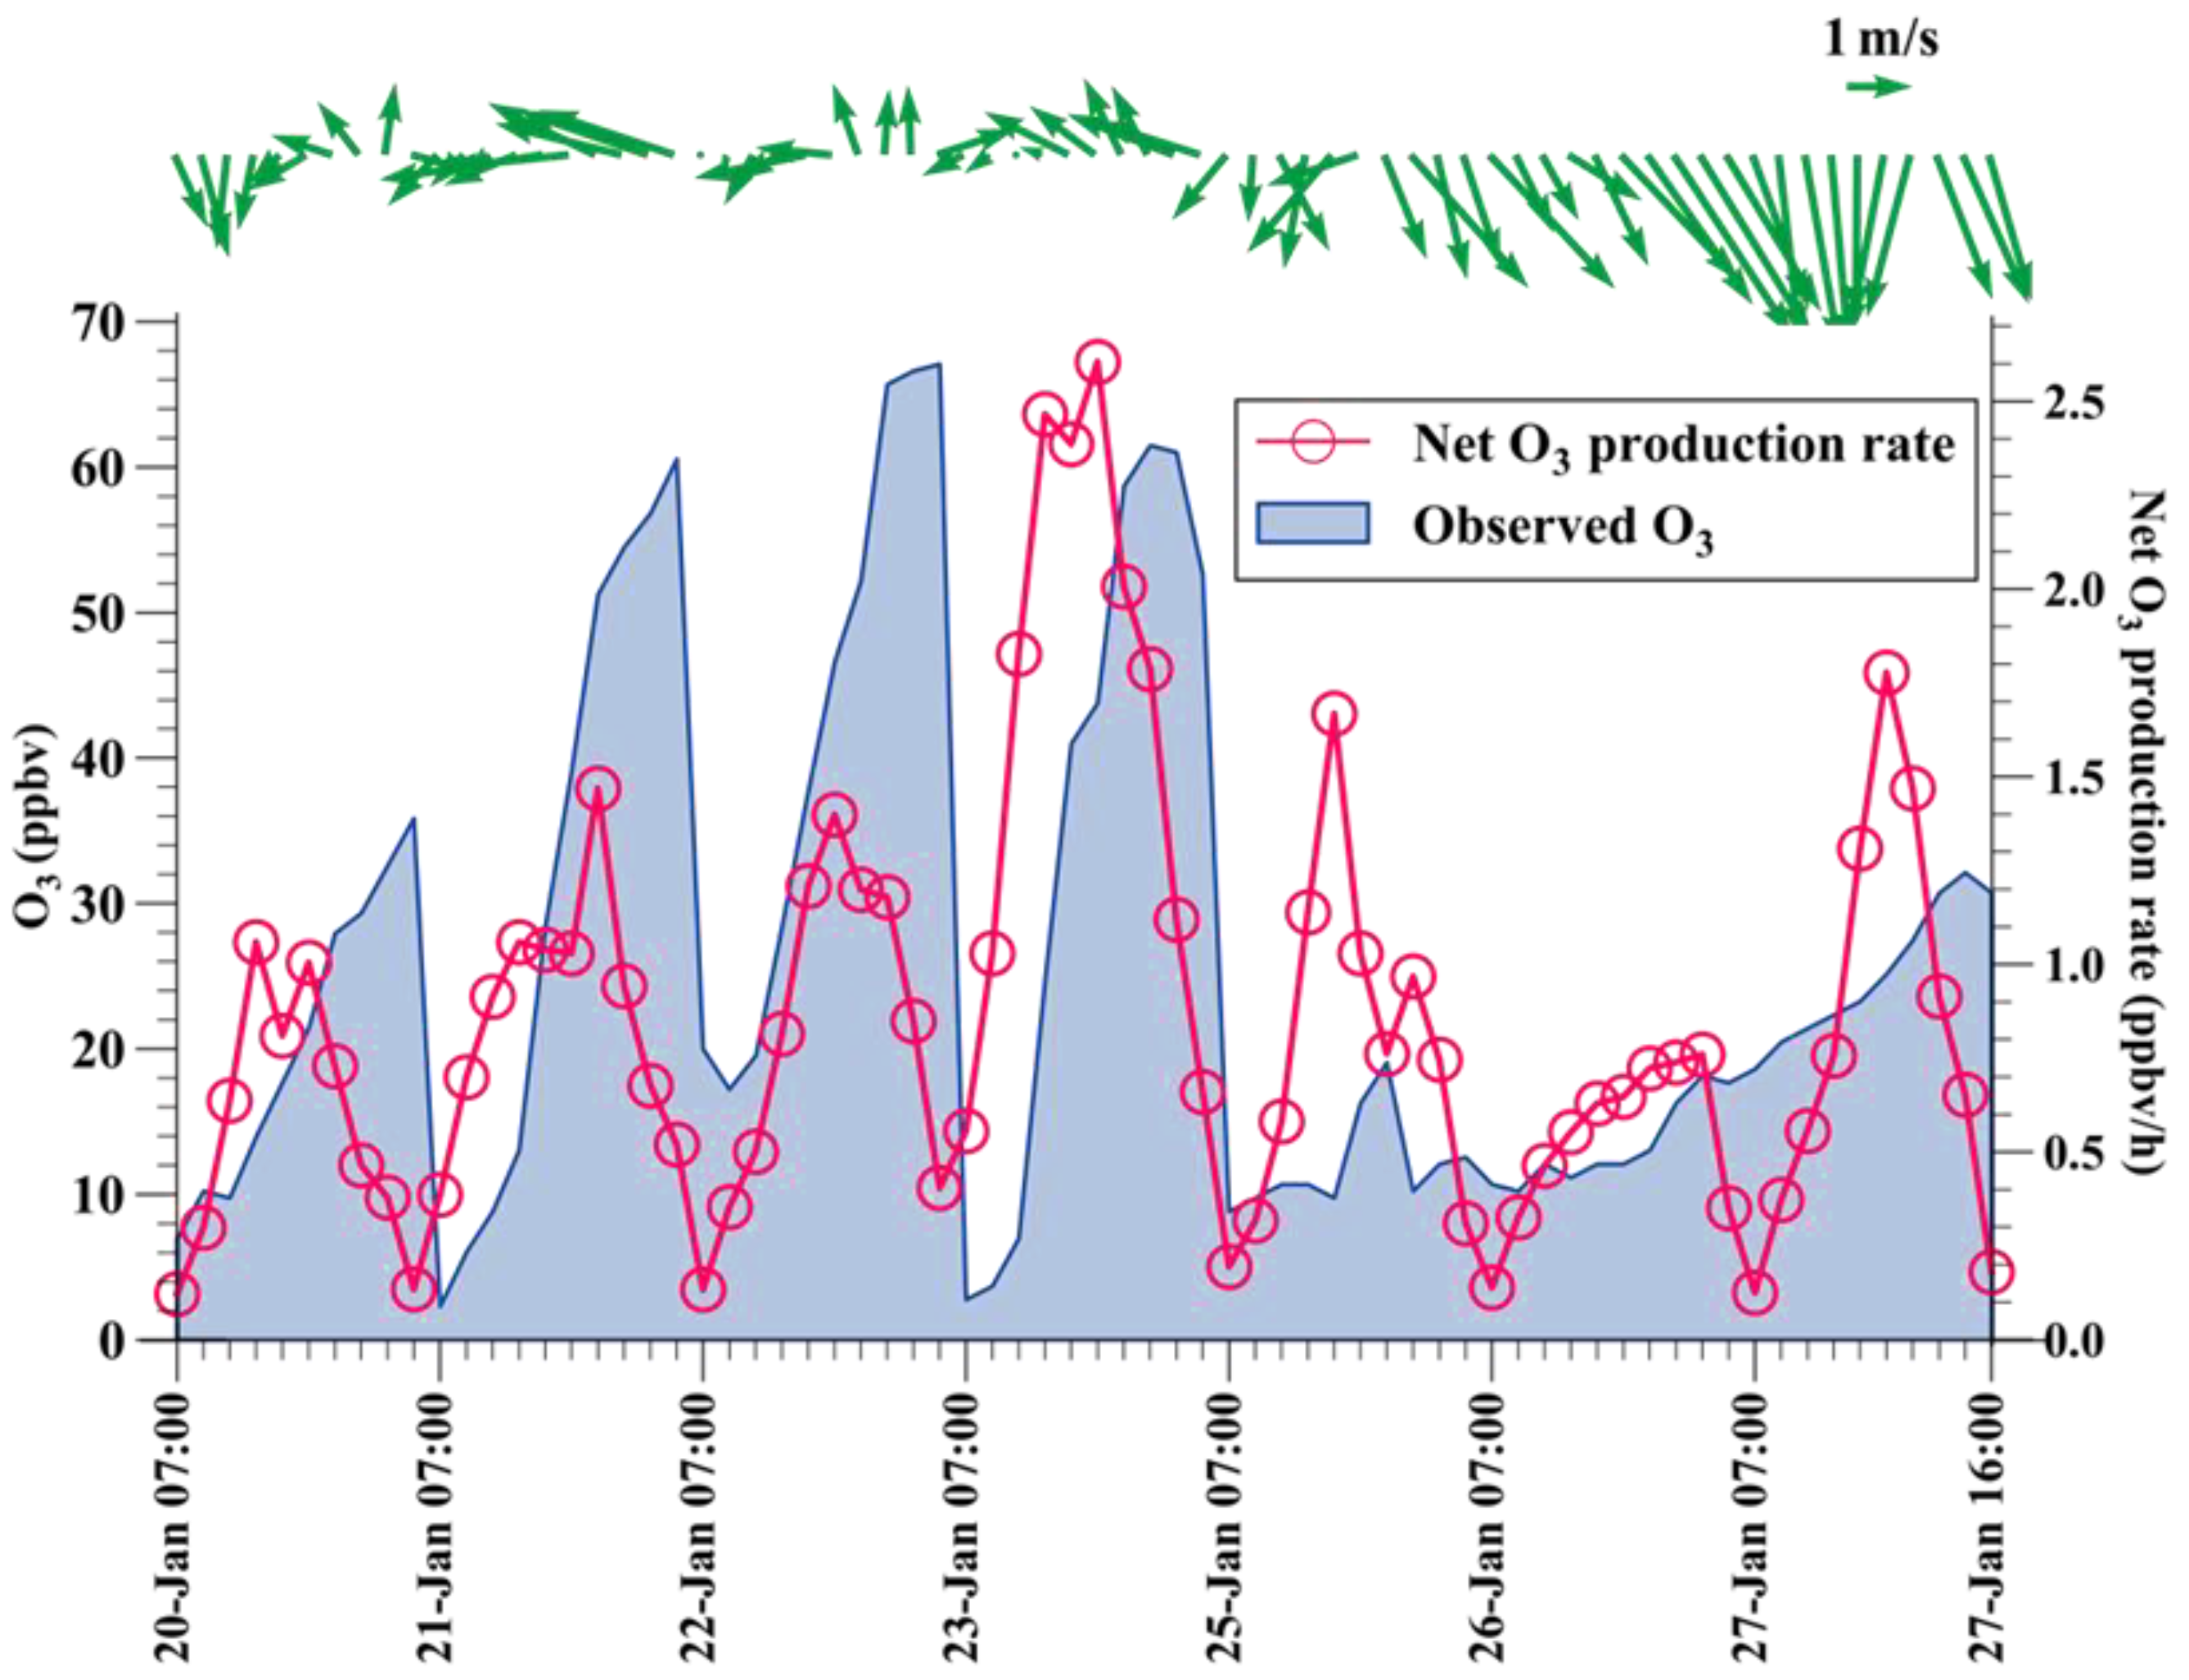
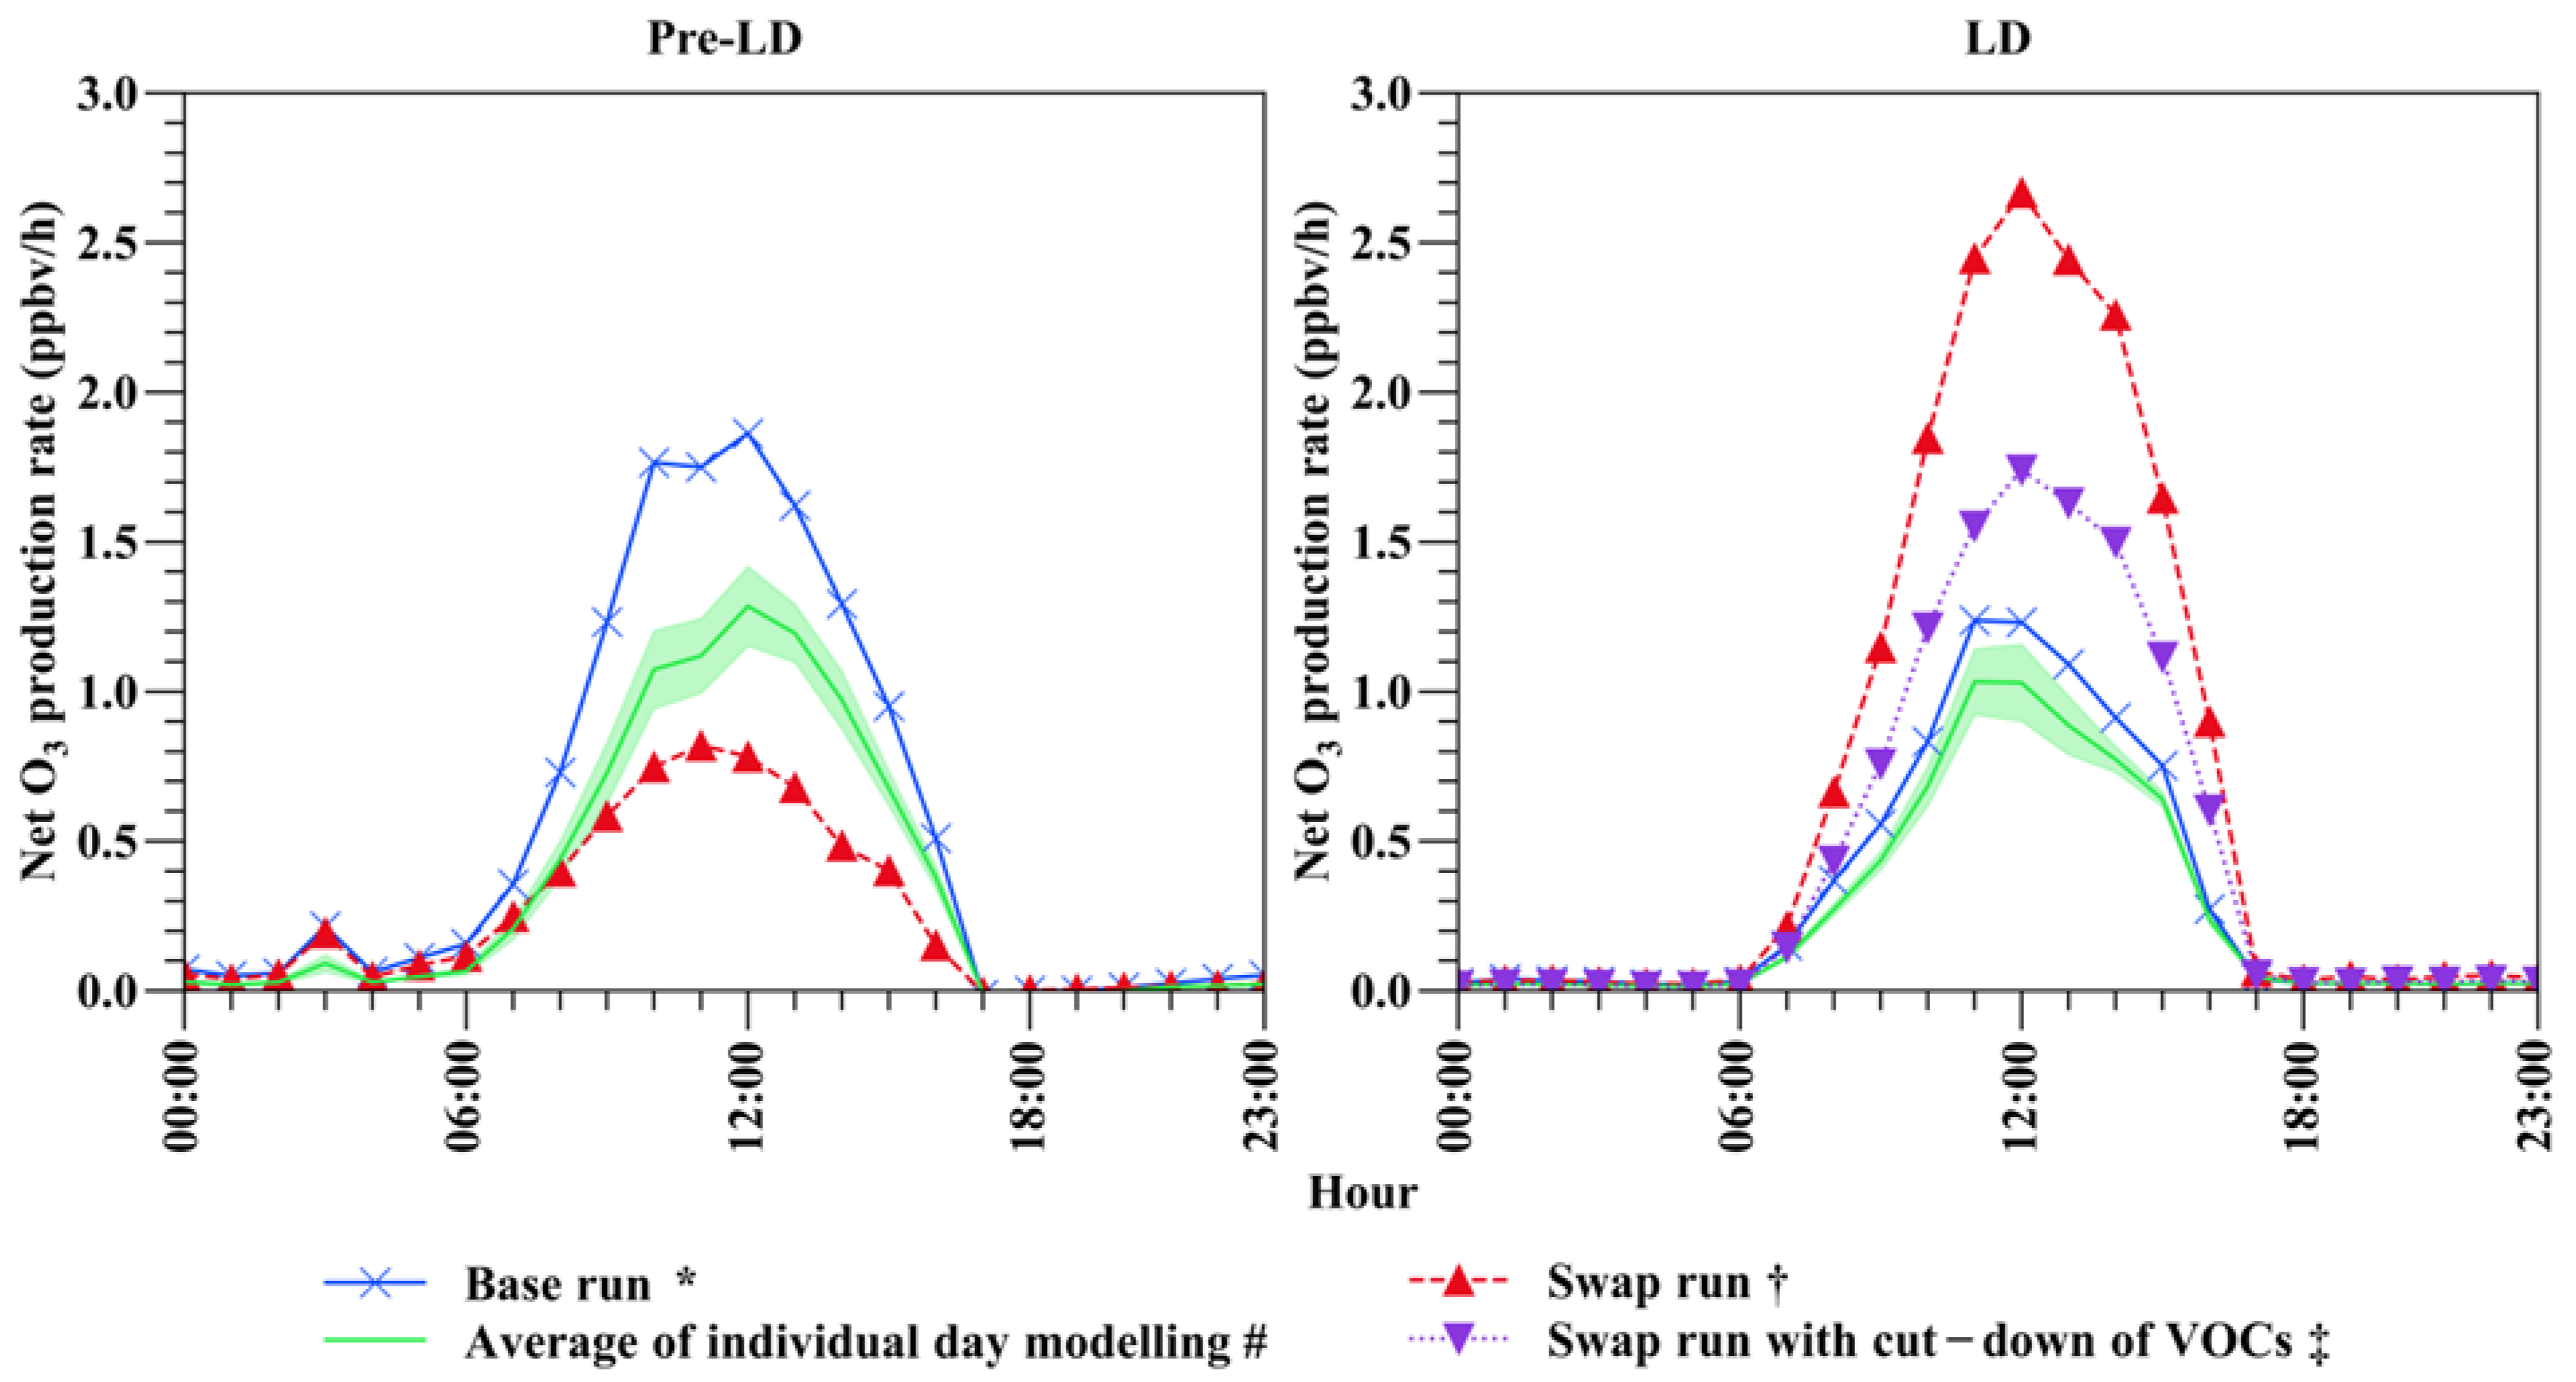
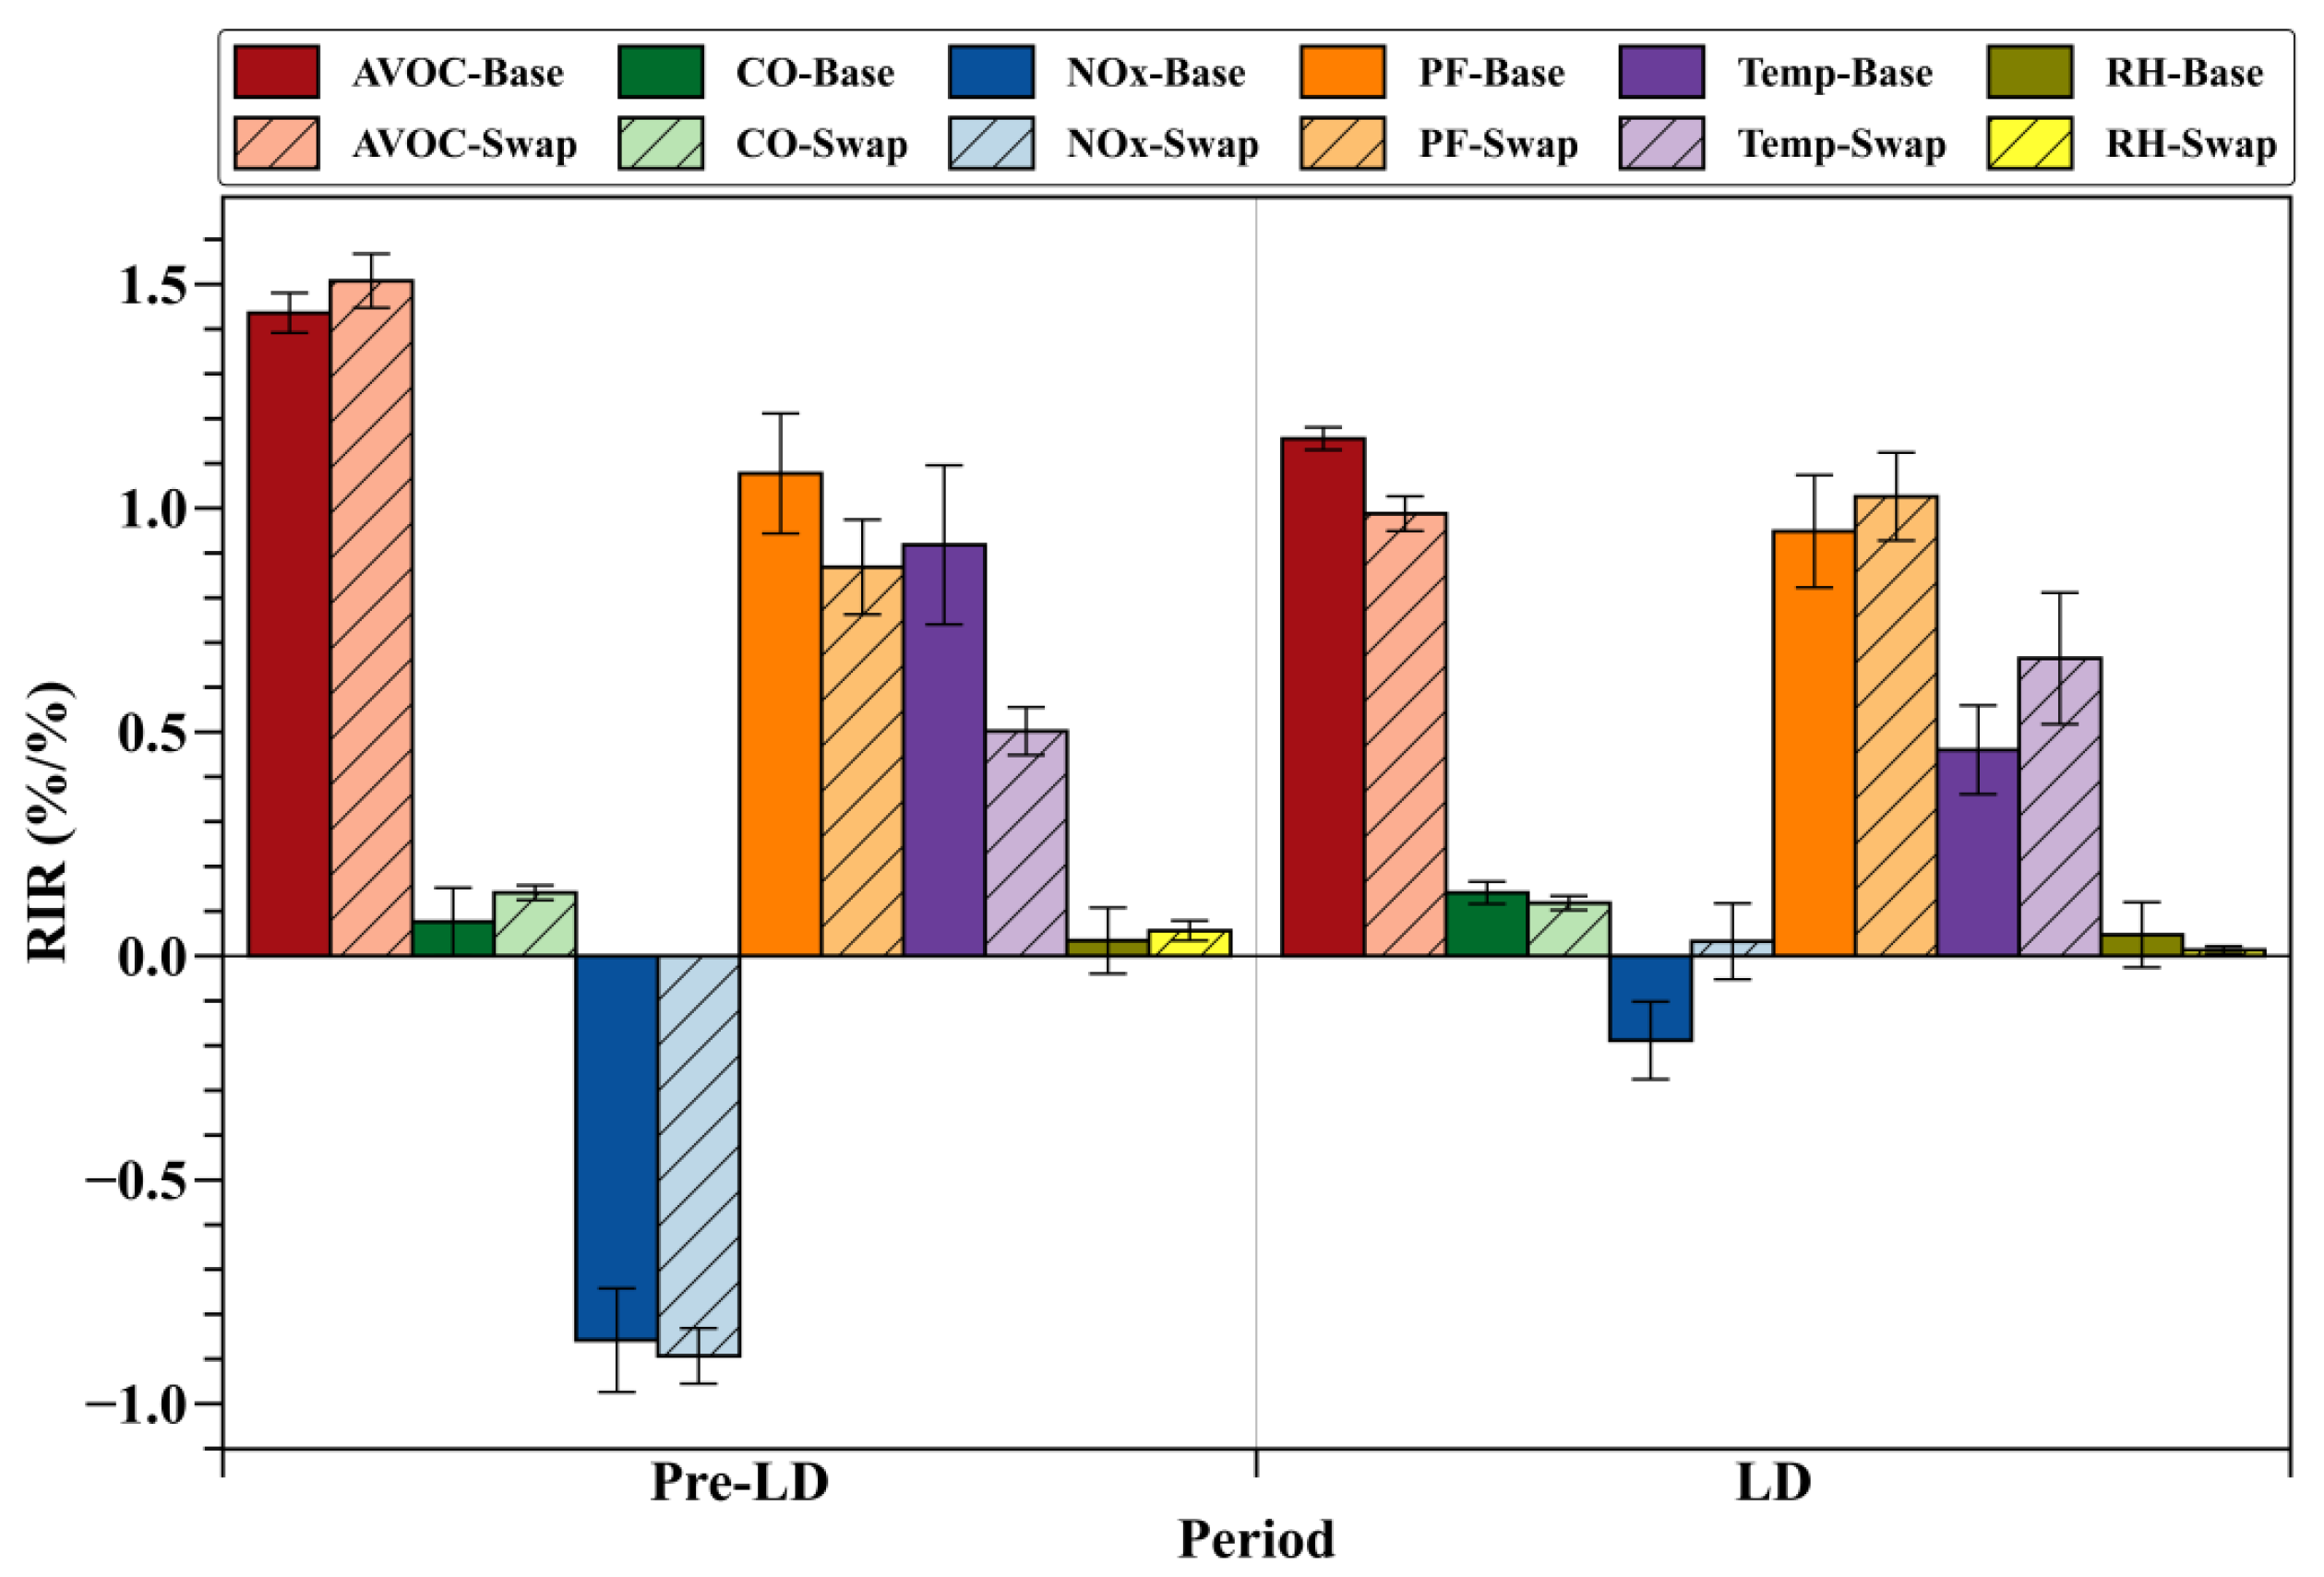
3.3. In-Situ O3 Formation and Sensitivities
4. Conclusions
Supplementary Materials
Author Contributions
Funding
Institutional Review Board Statement
Informed Consent Statement
Data Availability Statement
Acknowledgments
Conflicts of Interest
References
- Atkinson, R. Atmospheric chemistry of VOCs and NOx. Atmos. Environ. 2000, 34, 2063–2101. [Google Scholar] [CrossRef]
- Finlayson-Pitts, B.J.; Pitts, J.N. Atmospheric Chemistry of Tropospheric Ozone Formation: Scientific and Regulatory Implications. Air Waste 1993, 43, 1091–1100. [Google Scholar] [CrossRef]
- Jacob, D.J.; Winner, D.A. Effect of climate change on air quality. Atmos. Environ. 2009, 43, 51–63. [Google Scholar] [CrossRef] [Green Version]
- Wang, T.; Xue, L.K.; Brimblecombe, P.; Lam, Y.F.; Li, L.; Zhang, L. Ozone pollution in China: A review of concentrations, meteorological influences, chemical precursors, and effects. Sci. Total Environ. 2017, 575, 1582–1596. [Google Scholar] [CrossRef]
- Xu, T.L.; Ao, M.Y.; Zhou, X.; Zhu, W.F.; Nie, H.Y.; Fang, J.H.; Sun, X.; Zheng, B.; Chen, X.F. China’s practice to prevent and control COVID-19 in the context of large population movement. Infect. Dis. Poverty 2020, 9, 115. [Google Scholar] [CrossRef]
- Le, T.; Wang, Y.; Liu, L.; Yang, J.; Yung, Y.L.; Li, G.; Seinfeld, J.H. Unexpected air pollution with marked emission reductions during the COVID-19 outbreak in China. Science 2020, 369, 702–706. [Google Scholar] [CrossRef]
- Silver, B.; He, X.; Arnold, S.R.; Spracklen, D.V. The impact of COVID-19 control measures on air quality in China. Environ. Res. Lett. 2020, 15, 084021. [Google Scholar] [CrossRef]
- Huang, X.; Ding, A.; Gao, J.; Zheng, B.; Zhou, D.; Qi, X.; Tang, R.; Wang, J.; Ren, C.; Nie, W.; et al. Enhanced secondary pollution offset reduction of primary emissions during COVID-19 lockdown in China. Natl. Sci. Rev. 2021, 8, nwaa137. [Google Scholar] [CrossRef] [PubMed]
- Li, M.; Wang, T.; Xie, M.; Li, S.; Zhuang, B.; Fu, Q.; Zhao, M.; Wu, H.; Liu, J.; Saikawa, E.; et al. Drivers for the poor air quality conditions in North China Plain during the COVID-19 outbreak. Atmos. Environ. 2021, 246, 118103. [Google Scholar] [CrossRef] [PubMed]
- Chen, Y.; Zhang, S.; Peng, C.; Shi, G.; Tian, M.; Huang, R.J.; Guo, D.; Wang, H.; Yao, X.; Yang, F. Impact of the COVID-19 pandemic and control measures on air quality and aerosol light absorption in Southwestern China. Sci. Total Environ. 2020, 749, 141419. [Google Scholar] [CrossRef]
- Liu, Y.; Wang, T.; Stavrakou, T.; Elguindi, N.; Doumbia, T.; Granier, C.; Bouarar, I.; Gaubert, B.; Brasseur, G. Diverse response of surface ozone to COVID-19 lockdown in China. Sci. Total Environ. 2020, 789, 147739. [Google Scholar] [CrossRef] [PubMed]
- Wang, N.; Xu, J.; Pei, C.; Tang, R.; Zhou, D.; Chen, Y.; Li, M.; Deng, X.; Deng, T.; Huang, X.; et al. Air Quality During COVID-19 Lockdown in the Yangtze River Delta and the Pearl River Delta: Two Different Responsive Mechanisms to Emission Reductions in China. Environ. Sci. Technol. 2021, 55, 5721–5730. [Google Scholar] [CrossRef] [PubMed]
- Li, J.; Yang, H.; Zha, S.; Yu, N.; Liu, X.; Sun, R. Effects of COVID-19 Emergency Response Levels on Air Quality in the Guangdong-Hong Kong-Macao Greater Bay Area, China. Aerosol Air Qual. Res. 2021, 21, 200416. [Google Scholar] [CrossRef]
- Wang, S.; Zhang, Y.; Ma, J.; Zhu, S.; Shen, J.; Wang, P.; Zhang, H. Responses of decline in air pollution and recovery associated with COVID-19 lockdown in the Pearl River Delta. Sci. Total Environ. 2021, 756, 143868. [Google Scholar] [CrossRef]
- Qi, J.; Mo, Z.; Yuan, B.; Huang, S.; Huangfu, Y.; Wang, Z.; Li, X.; Yang, S.; Wang, W.; Zhao, Y.; et al. An observation approach in evaluation of ozone production to precursor changes during the COVID-19 lockdown. Atmos. Environ. 2021, 262, 118618. [Google Scholar] [CrossRef]
- Wang, M.; Lu, S.; Shao, M.; Zeng, L.; Zheng, J.; Xie, F.; Lin, H.; Hu, K.; Lu, X. Impact of COVID-19 lockdown on ambient levels and sources of volatile organic compounds (VOCs) in Nanjing, China. Sci. Total Environ. 2021, 757, 143823. [Google Scholar] [CrossRef]
- Attri, A.K.; Kumar, U.; Jain, V.K. Formation of ozone by fireworks. Nature 2001, 411, 1015. [Google Scholar] [CrossRef]
- Li, K.; Li, J.; Tong, S.; Wang, W.; Huang, R.-J.; Ge, M. Characteristics of wintertime VOCs in suburban and urban Beijing: Concentrations, emission ratios, and festival effects. Atmos. Chem. Phys. 2019, 19, 8021–8036. [Google Scholar] [CrossRef] [Green Version]
- Wang, Y.; Guo, H.; Zou, S.; Lyu, X.; Ling, Z.; Cheng, H.; Zeren, Y. Surface O3 photochemistry over the South China Sea: Application of a near-explicit chemical mechanism box model. Environ. Pollut. 2018, 234, 155–166. [Google Scholar] [CrossRef]
- Lyu, X.; Wang, N.; Guo, H.; Xue, L.; Jiang, F.; Zeren, Y.; Cheng, H.; Cai, Z.; Han, L.; Zhou, Y. Causes of a continuous summertime O3 pollution event in Jinan, a central city in the North China Plain. Atmos. Chem. Phys. 2019, 19, 3025–3042. [Google Scholar] [CrossRef] [Green Version]
- Liu, Y.; Shao, M.; Lu, S.; Chang, C.-C.; Wang, J.-L.; Chen, G. Volatile Organic Compound (VOC) measurements in the Pearl River Delta (PRD) region, China. Atmos. Chem. Phys. 2008, 8, 1531–1545. [Google Scholar] [CrossRef] [Green Version]
- Wu, F.K.; Yu, Y.; Sun, J.; Zhang, J.K.; Wang, J.; Tang, G.Q.; Wang, Y.S. Characteristics, source apportionment and reactivity of ambient volatile organic compounds at Dinghu Mountain in Guangdong Province, China. Sci. Total Environ. 2016, 548–549, 347–359. [Google Scholar] [CrossRef] [PubMed]
- Chen, P.Y.; Tan, P.H.; Chou, C.C.K.; Lin, Y.S.; Chen, W.N.; Shiu, C.J. Impacts of holiday characteristics and number of vacation days on “holiday effect” in Taipei: Implications on ozone control strategies. Atmos. Environ. 2019, 202, 357–369. [Google Scholar] [CrossRef]
- Tang, R.; Huang, X.; Zhou, D.; Wang, H.; Xu, J.; Ding, A. Global air quality change during the COVID-19 pandemic: Regionally different ozone pollution responses COVID-19. Atmos. Ocean. Sci. Lett. 2021, 14, 100015. [Google Scholar] [CrossRef]
- Jia, H.; Huo, J.; Fu, Q.; Duan, Y.; Lin, Y.; Jin, X.; Hu, X.; Cheng, J. Insights into chemical composition, abatement mechanisms and regional transport of atmospheric pollutants in the Yangtze River Delta region, China during the COVID-19 outbreak control period. Environ. Pollut. 2020, 267, 115612. [Google Scholar] [CrossRef]
- Gu, Y.; Liu, B.; Dai, Q.; Zhang, Y.; Zhou, M.; Feng, Y.; Hopke, P.K. Multiply improved positive matrix factorization for source apportionment of volatile organic compounds during the COVID-19 shutdown in Tianjin, China. Environ. Int. 2021, 158, 106979. [Google Scholar] [CrossRef]
- Liu, Y.; Shao, M.; Fu, L.; Lu, S.; Zeng, L.; Tang, D. Source profiles of volatile organic compounds (VOCs) measured in China: Part I. Atmos. Environ. 2008, 42, 6247–6260. [Google Scholar] [CrossRef]
- Zhang, Y.; Wang, X.; Zhang, Z.; Lü, S.; Shao, M.; Lee, F.S.C.; Yu, J. Species profiles and normalized reactivity of volatile organic compounds from gasoline evaporation in China. Atmos. Environ. 2013, 79, 110–118. [Google Scholar] [CrossRef]
- Chang, C.C.; Lo, S.J.; Lo, J.G.; Wang, J.L. Analysis of methyl tert-butyl ether in the atmosphere and implications as an exclusive indicator of automobile exhaust. Atmos. Environ. 2003, 37, 4747–4755. [Google Scholar] [CrossRef]
- Liu, Y.; Shao, M.; Lu, S.; Chang, C.-C.; Wang, J.-L.; Fu, L. Source apportionment of ambient volatile organic compounds in the Pearl River Delta, China: Part II. Atmos. Environ. 2008, 42, 6261–6274. [Google Scholar] [CrossRef]
- Guo, H.; Cheng, H.R.; Ling, Z.H.; Louie, P.K.; Ayoko, G.A. Which emission sources are responsible for the volatile organic compounds in the atmosphere of Pearl River Delta? J. Hazard. Mater. 2011, 188, 116–124. [Google Scholar] [CrossRef] [PubMed]
- Li, L.; Xie, S.; Zeng, L.; Wu, R.; Li, J. Characteristics of volatile organic compounds and their role in ground-level ozone formation in the Beijing-Tianjin-Hebei region, China. Atmos. Environ. 2015, 113, 247–254. [Google Scholar] [CrossRef]
- Hui, L.R.; Liu, X.G.; Tan, Q.W.; Feng, M.; An, J.L.; Qu, Y.; Zhang, Y.H.; Jiang, M.Q. Characteristics, source apportionment and contribution of VOCs to ozone formation in Wuhan, Central China. Atmos. Environ. 2018, 192, 55–71. [Google Scholar] [CrossRef]
- Guo, H.; Ling, Z.H.; Cheung, K.; Jiang, F.; Wang, D.W.; Simpson, I.J.; Barletta, B.; Meinardi, S.; Wang, T.J.; Wang, X.M.; et al. Characterization of photochemical pollution at different elevations in mountainous areas in Hong Kong. Atmos. Chem. Phys. 2013, 13, 3881–3898. [Google Scholar] [CrossRef] [Green Version]
- Lyu, X.; Guo, H.; Wang, Y.; Zhang, F.; Nie, K.; Dang, J.; Liang, Z.; Dong, S.; Zeren, Y.; Zhou, B.; et al. Hazardous volatile organic compounds in ambient air of China. Chemosphere 2020, 246, 125731. [Google Scholar] [CrossRef] [PubMed]
- Willmott, C.J. Some Comments on the Evaluation of Model Performance. Bull. Am. Meteorol. Soc. 1982, 63, 1309–1313. [Google Scholar] [CrossRef]
- Lyu, X.; Chen, N.; Guo, H.; Zhang, W.; Wang, N.; Wang, Y.; Liu, M. Ambient volatile organic compounds and their effect on ozone production in Wuhan, central China. Sci. Total Environ. 2016, 541, 200–209. [Google Scholar] [CrossRef]


| Date | Location | Event |
|---|---|---|
| 21 January | Guangdong Province | The first case in Guangdong province was confirmed |
| 23 January–23 February | Guangdong Province | First-level emergency response was initiated; Lockdown was announced in Wuhan |
| 24 January | Guangzhou | Lockdown was announced |
| 25 January | China | Chinese New Year’s Eve |
| 10 February | Guangdong Province | Partial resumption of work |
| 17 February | Huangpu District (Guangzhou) | Full resumption of work |
| 24 February | Guangzhou | First-level emergency response was downgraded to second-level |
| Parameter or Species | Longer Period | Shorter Period | Percentage Change | ||||||||||
|---|---|---|---|---|---|---|---|---|---|---|---|---|---|
| Pre-LD (1–24 January) | LD (25 January–17 February) | Pre-LD (20–24 January) | LD (25–27 January) | Longer Period (This Study) | Shorter Period (This Study) | Wang et al. [12] | |||||||
| Mean | 95% C.I. # | Mean | 95% C.I. | Mean | 95% C.I. | Mean | 95% C.I. | Change | p-Value * | Change | p-Value | Change | |
| Temperature (°C) | 19.2 | 0.30 | 15.4 | 0.28 | 20.1 | 0.70 | 14.1 | 0.90 | −19.5% | <0.001 | −29.9% | <0.001 | −20.8% |
| Wind speed (m/s) | 1.33 | 0.05 | 1.57 | 0.04 | 1.09 | 0.01 | 2.10 | 0.13 | 18.1% | <0.001 | 92.3% | <0.001 | |
| Relative humidity (%) | 58.7 | 0.76 | 60.6 | 1.34 | 61.9 | 1.58 | 64.9 | 2.20 | 3.20% | 0.02 | 4.82% | 0.03 | |
| PM2.5 (μg/m3) | 31.5 | 1.29 | 21.1 | 1.13 | 24.3 | 1.62 | 14.9 | 2.91 | −33.0% | <0.001 | −38.8% | <0.001 | −33.8% |
| PM10 (μg/m3) | 63.2 | 2.81 | 27.9 | 1.50 | 38.5 | 2.47 | 19.3 | 3.71 | −55.9% | <0.001 | −49.8% | <0.001 | |
| CO (ppbv) | 734 | 12.3 | 598 | 8.09 | 661 | 22.5 | 716 | 30.9 | −18.5% | <0.001 | 8.28% | <0.01 | |
| SO2 (ppbv) | 2.44 | 0.11 | 1.42 | 0.05 | 1.51 | 0.08 | 1.08 | 0.31 | −41.7% | <0.001 | −28.7% | <0.01 | |
| NO2 (ppbv) | 29.4 | 1.29 | 11.7 | 0.66 | 19.5 | 1.51 | 6.36 | 0.49 | −60.4% | <0.001 | −67.4% | <0.001 | −64.7% |
| NO (ppbv) | 15.0 | 2.59 | 3.12 | 0.64 | 3.29 | 0.95 | 1.14 | 0.17 | −79.2% | <0.001 | −65.4% | <0.001 | |
| DMA8 O3 (ppbv) | 39.2 | 1.20 | 30.3 | 0.99 | 46.8 | 2.20 | 24.7 | 1.94 | −22.8% | <0.01 | −47.2% | <0.001 | −21.3% |
| TVOC (ppbv) | 46.9 | 3.29 | 37.1 | 2.02 | −20.7% | <0.001 | |||||||
| Alkanes (ppbv) | 20.3 | 1.66 | 15.1 | 0.85 | −25.4% | <0.001 | |||||||
| Alkenes (ppbv) | 3.85 | 0.53 | 2.44 | 0.23 | −35.1% | <0.001 | |||||||
| Alkyne (ppbv) | 6.45 | 0.37 | 7.86 | 0.76 | 21.9% | <0.001 | |||||||
| Aromatics (ppbv) | 8.51 | 0.57 | 6.70 | 0.31 | −21.2% | <0.001 | |||||||
| Halocarbons (ppbv) | 2.78 | 0.31 | 2.44 | 0.18 | −11.0% | 0.13 | |||||||
| OVOCs (ppbv) | 5.04 | 0.85 | 2.51 | 0.39 | −50.1% | <0.001 | |||||||
Publisher’s Note: MDPI stays neutral with regard to jurisdictional claims in published maps and institutional affiliations. |
© 2022 by the authors. Licensee MDPI, Basel, Switzerland. This article is an open access article distributed under the terms and conditions of the Creative Commons Attribution (CC BY) license (https://creativecommons.org/licenses/by/4.0/).
Share and Cite
Shek, K.Y.; Zeren, Y.; Guo, H.; Li, M.; Liu, M.; Huang, B.; Lyu, X. Insights on In-Situ Photochemistry Associated with Ozone Reduction in Guangzhou during the COVID-19 Lockdown. Atmosphere 2022, 13, 212. https://doi.org/10.3390/atmos13020212
Shek KY, Zeren Y, Guo H, Li M, Liu M, Huang B, Lyu X. Insights on In-Situ Photochemistry Associated with Ozone Reduction in Guangzhou during the COVID-19 Lockdown. Atmosphere. 2022; 13(2):212. https://doi.org/10.3390/atmos13020212
Chicago/Turabian StyleShek, Kit Ying, Yangzong Zeren, Hai Guo, Mei Li, Ming Liu, Bo Huang, and Xiaopu Lyu. 2022. "Insights on In-Situ Photochemistry Associated with Ozone Reduction in Guangzhou during the COVID-19 Lockdown" Atmosphere 13, no. 2: 212. https://doi.org/10.3390/atmos13020212