Article

Pollution Characteristics of Water-Soluble Inorganic Ions in PM2.5 from a Mountainous City in Southwest China

1
Chongqing Key Laboratory of Water Environment Evolution and Pollution Control in Three Gorges Reservoir, Chongqing Three Gorges University, Chongqing 404000, China
2
CAS Key Laboratory of Reservoir Environment, Chongqing Institute of Green and Intelligent Technology, Chinese Academy of Sciences, Chongqing 400714, China
3
National Engineering Research Center for Flue Gas Desulfurization, Department of Environmental Science and Engineering, Sichuan University, Chengdu 610065, China
*
Authors to whom correspondence should be addressed.
Atmosphere 2022, 13(10), 1713; https://doi.org/10.3390/atmos13101713
Submission received: 29 September 2022 / Revised: 14 October 2022 / Accepted: 17 October 2022 / Published: 18 October 2022
(This article belongs to the Section Aerosols)

Abstract

:
In order to explore the characteristics of water-soluble inorganic ions (WSIIs) in the atmosphere of Wanzhou, a small mountainous city in Chongqing, four representative seasonal PM2.5 samples and gaseous precursors (SO2 and NO2) were collected from April 2016 to January 2017. The WSIIs (including Cl, NO3, SO42−, Na+, NH4 +, K+, Mg2+, and Ca2+) were analyzed by ion chromatography. During the sampling period, daily PM2.5 concentration varied from 3.47 to 156.30 μg·m−3, with an average value of 33.38 μg·m−3, which was lower than the second-level annual limit of NAAQS-China. WSIIs accounted for 55.6% of PM2.5, and 83.1% of them were secondary inorganic ions (SNA, including SO42−, NO3, and NH4+). The seasonal variations of PM2.5 and WSIIs were similar, with the minimum in summer and the maximum in winter. PM2.5 samples were the most alkaline in summer, weakly alkaline in spring and winter, and close to neutral in fall. The annual average ratio of NO3/SO42− was 0.54, indicating predominant stationary sources for SNA in Wanzhou. NO3, SO42−, and NH4+ mainly existed in the form of (NH4)2SO4 and NH4NO3. The results of the principal component analysis (PCA) showed that the major sources of WSIIs in Wanzhou were the mixture of secondary inorganic aerosols, coal combustion, automobile exhaust (49.53%), dust (23.16%), and agriculture activities (9.68%). The results of the backward trajectory analysis showed that aerosol pollution in Wanzhou was mainly caused by local emissions. The enhanced formation of SNA through homogeneous and heterogeneous reactions contributed to the winter PM2.5 pollution event in Wanzhou.

1. Introduction

Atmospheric fine particulate matter (PM2.5, with aerodynamic diameter ≤ 2.5 μm particulate matter) is one of the primary air pollutants in most cities [1,2]. Due to the characteristics of small particle size, higher surface/mass ratio, and easy retention in the air, PM2.5 easily becomes the reactant and carrier of other pollutants, thus enriching more harmful chemical components [3]. Chemical components of PM2.5 include organic carbon (OC), elemental carbon (EC), water-soluble inorganic ions (WSIIs), crustal elements, and various trace elements. WSIIs are the main components of PM2.5, which affect the formation of cloud condensation nuclei, atmospheric extinction coefficient, atmospheric radiation balance, and precipitation acidity, and harm human health [4,5,6]. Secondary inorganic ions (SNA, including SO42−, NO3, and NH4+) are the dominant components, usually accounting for 50%~90% of WSIIs [5,7,8,9]. In addition, studies showed that the proportion of SNA increased significantly during severe haze periods, indicating that they play a crucial role in haze formation and visibility impairment [10,11,12,13].
Many studies related to PM2.5 and WSIIs have focused on large or megacities in China, such as Beijing, Shanghai, Guangzhou, and Tianjin [11,14,15,16]. Those studies showed that the concentration of WSIIs was mainly determined by local emissions and regional transportation, and meteorological conditions (e.g., temperature, humidity, wind speed, etc.) can also affect the distribution and pollution characteristics of WSIIs through chemical processes and physical diffusion. From the perspective of spatial distribution, the concentrations of WSIIs in the Beijing–Tianjin–Hebei area (BTH) [2,17,18], Fenwei Plain [1,19], and Sichuan Basin [5,9] were higher than those in the Pearl River Delta (PRD) [20,21] and coastal region [22,23] in China. In terms of inter-annual variation, PM2.5 concentrations in major cities have shown a downward trend since the Chinese government issued the Air Pollution Prevention and Control Action Plan (APPCAP) in 2013 [24]. The composition proportion of WSIIs in PM2.5 and source contributions of WSIIs varied remarkably. For example, many studies showed that the concentration of SO42− had a declining trend in recent years due to strict strategies implemented in China, such as installing desulphurization systems in coal-fired power plants and conversion of fuel to natural gas [5,25,26]. However, the concentration of NO3 was found to have an increasing trend; therefore, a transition from sulfate-driven to nitrate-driven aerosol pollution appeared in some cities [26,27,28,29]. In terms of seasonal variation, the highest concentrations of PM2.5 and its WSIIs were mostly observed in the cold seasons regardless of geographical regions in China. In winter, the enhanced emissions of coal combustion and biomass burning, as well as stagnant meteorological conditions, such as low wind speed and high relative humidity, were responsible for PM2.5 pollution [24,30,31,32,33].
Wanzhou, as an important transportation hub city, is located in the border area of six provinces and cities, namely northeast Chongqing, northeast Sichuan, southern Shaanxi, western Hubei, western Hunan, and northern Guizhou. It is also the eastern opening gateway of the Chengdu–Chongqing twin city economic circle and the regional center city of northeast Chongqing Three Gorges Reservoir Area town group. It has high relative humidity and low wind speed all year round, which makes the air pollution in this area more serious [34]. Previous studies on air pollution in Wanzhou were all about PM2.5 and its carbonaceous components. For example, Zhang et al. (2015) found that annual average PM2.5 concentrations were 125.3 μg·m−3 in 2013 in Wanzhou, which was 3.6 times higher than the National Ambient Air Quality Standards of China (NAAQS-China, annual limit of 35 μg·m−3) [35]. Huang et al. (2020) found annual fine particle black carbon (BC) mean displayed a significantly decreasing trend in Wanzhou since the implementation of APPCAP, from 5.3 μg·m−3 in 2013 to 3.7 μg·m−3 in 2017 [36]. However, the characteristics of WSIIs in Wanzhou are still unknown. In order to provide effective guidance for local governments to formulate pollution prevention and control policies for PM2.5, a comprehensive sampling of PM2.5 was conducted in Wanzhou from April 2016 to January 2017 to obtain the concentration data of WSIIs in PM2.5. In this study, WSIIs’ mass concentration level and seasonal variation characteristics were firstly analyzed. Then, the chemical forms of main secondary ions and their formation mechanisms were discussed. Finally, the main sources of PM2.5 were identified through principal component analysis (PCA). In addition, the formation mechanism of an air pollution event that occurred in winter was explored in this study.

2. Materials and Methods
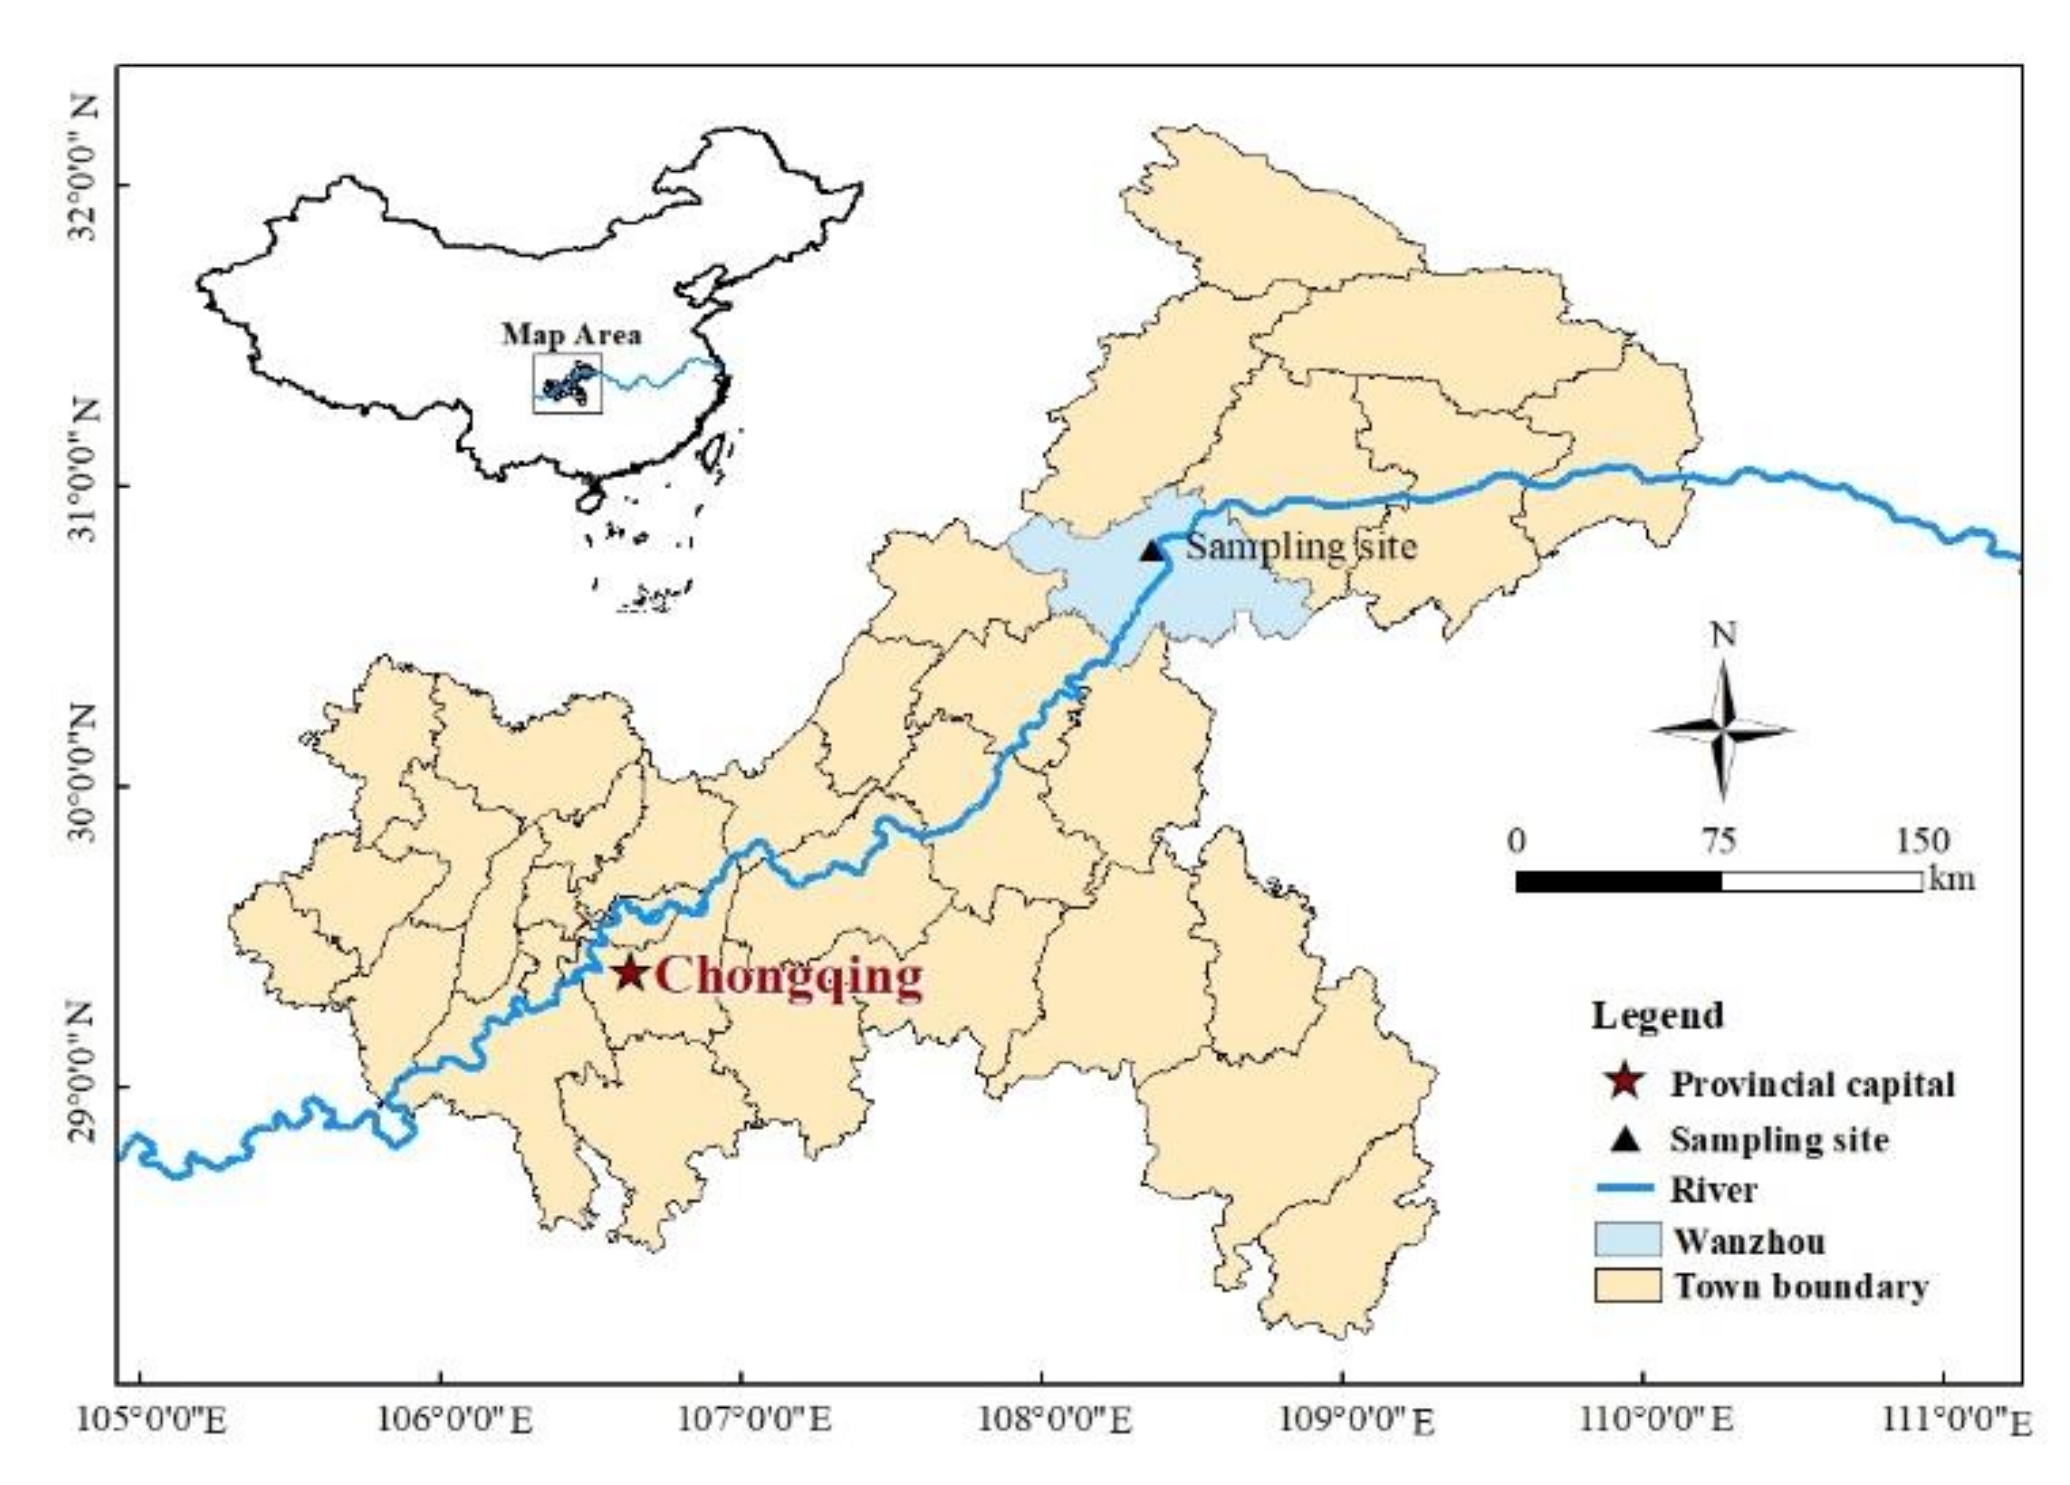
2.1. PM2.5 Sampling

PM2.5 samples were collected on a rooftop of the experimental building about 27 m above the ground (30.79° N, 108.37° E) within the Chongqing Three Georges University (Figure 1) in Wanzhou, a small urban city located about 228 km northeast of the megacity Chongqing. The monitoring site is surrounded by residential and commercial areas, agricultural fields, and a main traffic road (Shalong road). There is no fixed atmospheric pollution source within 1 km of the sampling site.
Two PM2.5 samples were collected in parallel by one sampler (URG-3000K, URG Corp., Carrboro, NC, USA) with a flow rate of 15 L·min−1. The left channel was connected with an annular denuder and Teflon filter (diameter 47 mm), while the right channel was connected with a quartz filter (diameter 47 mm). PM2.5 mass was the sum of the weight of the Teflon filter and quartz filter (after deducting the mass of the blank filters) and then divided by the sum of the volume of the left and right channels. PM2.5 samples were collected for 30 days in each of the four seasons: spring (8 April to 7 May 2016); summer (7 July to 5 August 2016); fall (14 October to 12 November 2016); winter (18 December 2016 to 16 January 2017). The sampling duration was 23 h per day, from 11:00 am to 10:00 am (the next day). A total of 120 days of PM2.5 samples were collected. The annular denuder was wetted with glycerol/citric acid solution to absorb NH3 from the air. Hourly concentrations of NO2 and SO2 were measured by on-line gas analyzers, including Thermo 42i NO2 and 43i SO2 analyzers (Thermo Scientific Corp., Waltham, MA, USA). NO2 and SO2 were averaged in the same periods as PM2.5. At the same time, the meteorological parameters were also collected by weather stations (WS500-UMB, Lufft Corp., Fellbach, Germany) during the sampling period, and the main meteorological parameters and air pollutant concentrations are listed in Table 1.

2.2. Ions Analysis

The adsorbed NH3 was eluted with ultrapure water, and the eluent was then filtered by a 0.45μm poresyringe filter. PM2.5 samples were ultrasonically extracted with ultrapure water, and then the extracted solution was filtered by a 0.45μm poresyringe filter. Eight WSIIs, including SO42−, NO3, Cl, Na+, NH4+, K+, Mg2+, and Ca2+, were determined using ion chromatography (Dionex-600, Dionex Corp., Sunnyvale, CA, USA). The cationic column CS12A and anionic column AS11-HC were used for sample analysis. The eluent used for the determination of cations was 20 mmol·L−1 MSA (methanesulfonic acid) at a flow rate of 1 mL·min−1. The anionic eluent was 30 mmol·L−1 KOH at a flow rate of 1 mL·min−1. The reference materials were prepared with the anionic and cationic standard solutions of O2Si from the United States, and the correlation coefficient of each standard curve can reach 0.999. Blank and standard samples were repeated every ten samples.

3. Results and Discussion

3.1. Concentrations of PM2.5 and WSIIs

During the sampling period, daily PM2.5 concentration varied from 3.47 to 156.30 μg·m−3 with an average value of 33.38 μg·m−3, which was lower than the NAAQS-China (annual limit of 35 μg·m−3). The PM2.5 concentration in Wanzhou was significantly lower than that in Chongqing urban areas such as Fuling, Yubei, and Beibei and lower than that in Jin Yun mountain, a rural background of Chongqing. (Table 2). In addition, compared with other cities in China, it was much lower than Handan, Taiyuan, Chengdu, and Neijiang and comparable to Nanning and Kunming. In general, the PM2.5 concentration in Wanzhou is relatively low in China. It is worth noting that the annual average PM2.5 concentration in this study decreased by 73.4% compared to the previous report in 2013 [35]. Since the implementation of the APPCAP in 2013, the Chongqing municipal government has taken a series of corresponding measures to improve the city’s air quality, such as eliminating yellow-labeled vehicles, installing desulphurization systems in coal-fired power plants, controlling dust pollution, and banning the open burning of straw and garbage. These measures have effectively reduced the atmospheric particulate matter concentration in Chongqing. We also found from the literature that the atmospheric particulate matter concentration in other districts of Chongqing has also decreased in recent years. For instance, Chen et al. (2019) found that the PM2.5 level decreased by 57.3% in 2012–2013 compared to that in 2005–2006 in Yubei, Chongqing. The PM2.5 concentration decreased by nearly 66% and 40% in 2017–2018 compared to that in 2005–2006 and in 2014–2015 in Beibei, Chongqing, respectively [7].
Daily WSIIs concentrations ranged from 3.59 to 106.99 μg·m−3, with an annual average concentration of 18.34 μg·m−3, accounting for 55.6% of PM2.5 mass. This concentration was obviously lower than in other districts of Chongqing, slightly higher than Kunming, and only about 1/3 of WSIIs concentration in Handan and Taiyuan (Table 2). The order of annual average concentrations of the eight ions is SO42− > NO3 > NH4+ > Na+ > Cl > Ca2+ > K+ > Mg2+. SO42−, NO3, and NH4+ (SNA) were the most abundant components of WSIIs, accounting for 41.1%, 22.1%, and 19.9% of total WSIIs (TWSIIs), respectively.

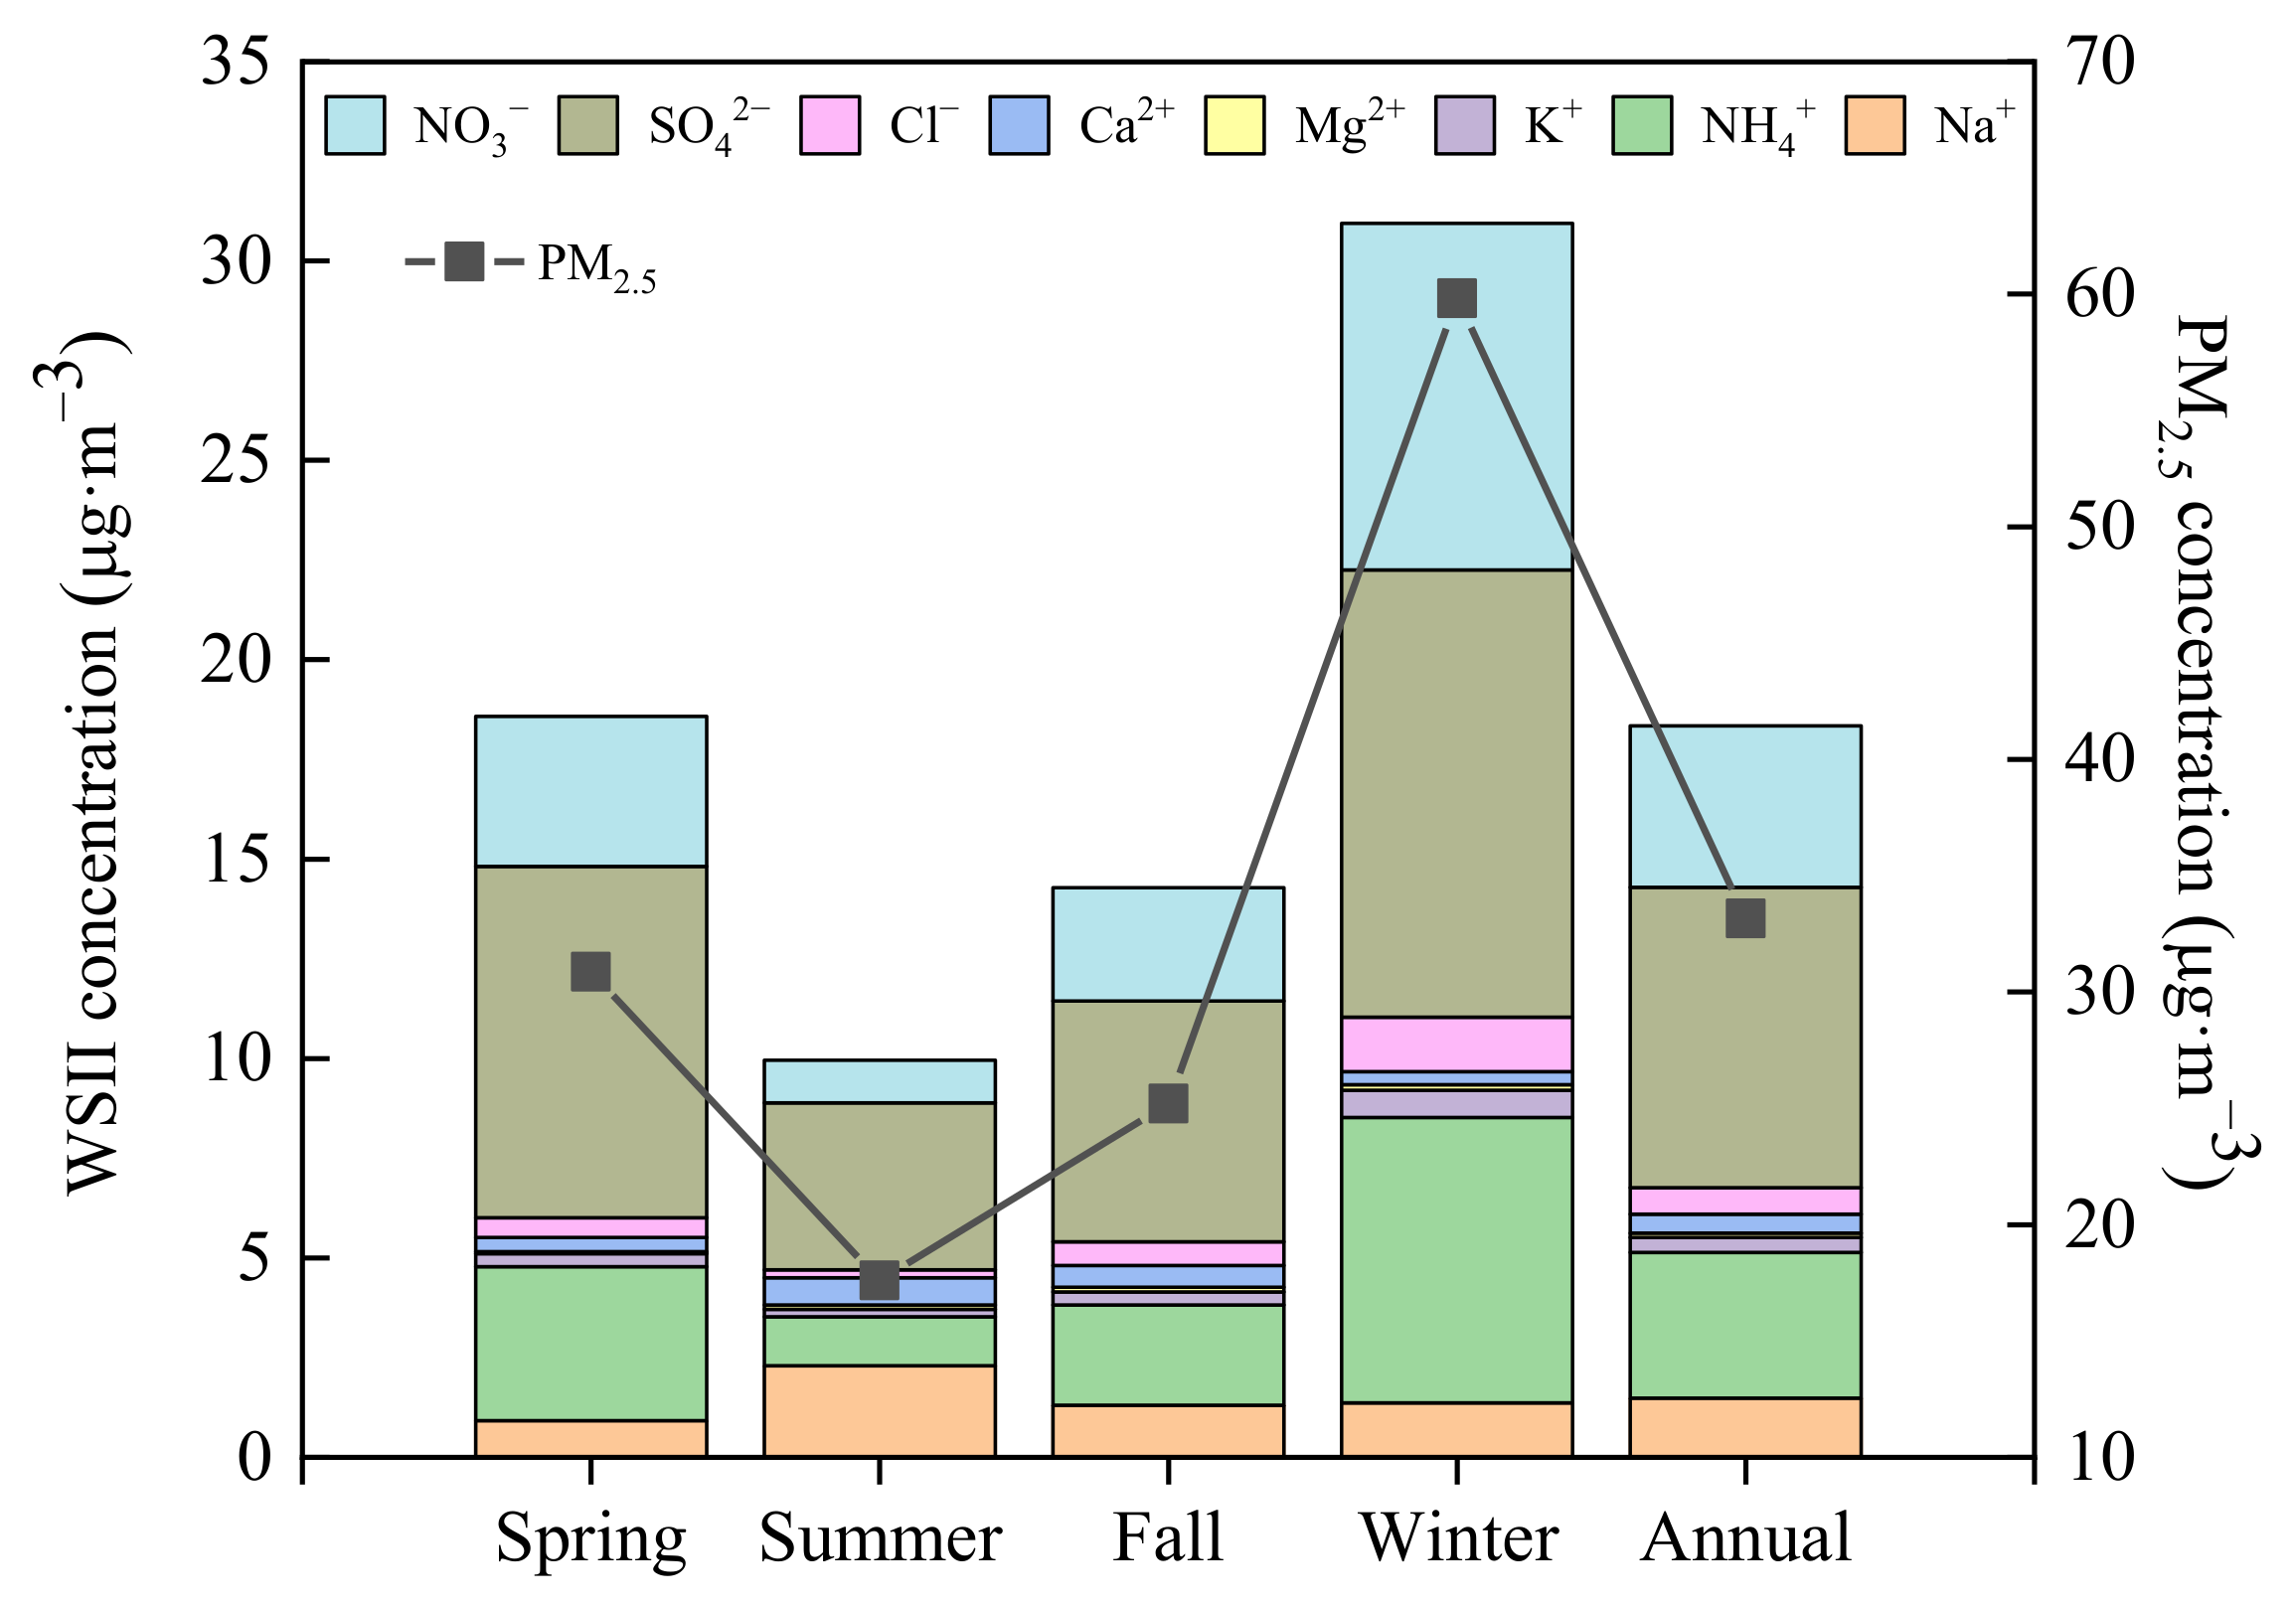
3.2. Seasonal Variations of PM2.5 and WSIIs

Figure 2 displays the seasonal variation of PM2.5 with the maximum in winter (59.82 μg·m−3), decreasing through spring (30.87 μg·m−3) and fall (25.20 μg·m−3), and the minimum in summer (17.61 μg·m−3), which was consistent with that reported at a different site of Chongqing [9]. The pollution of PM2.5 was the most serious in winter, with a concentration of 3.4 times that in summer. The number of days exceeding the NAAQS-China daily limit of 75 μg·m−3 was 26.7% in winter, while in other seasons, it did not exceed the standard. Stagnant meteorological conditions and biomass burning by residents to keep themselves warm were the major causes of the highest PM2.5 mass in winter, while the lower PM2.5 mass concentration in summer was mainly due to abundant precipitation favoring wet scavenging [44].
The seasonal variation of TWSIIs concentration was similar to PM2.5 mass, and the order was winter (30.94 μg·m−3) > spring (18.58 μg·m−3) > fall (14.28 μg·m−3) > summer (9.96 μg·m−3). The proportion of WSIIs in PM2.5 mass was ranked as follows: spring (60.2%) > fall (56.7%) ≈ summer (56.6%) > winter (51.7%). The concentration of SNA was the highest in winter (27.06 μg·m−3), followed by spring (16.43 μg·m−3), fall (11.38 μg·m−3), and summer (6.48 μg·m−3), which contributed 87.4%, 88.4%, 79.7%, and 65.0% to TWSIIs, respectively. SO42− showed the same seasonal trends as SNA, which were not consistent with those of SO2: winter > fall > summer > spring. The reason for the highest SO42− concentration in winter may be attributed to the formation of abundant precursor SO2 through heterogeneous aqueous processes reaction. It is noteworthy that SO2 concentration in spring was 1.6 times lower than that in fall, while the concentration of SO42− in spring was 1.5 times higher than that in fall. Compared with the meteorological data (Table 1), it was found that the solar radiation and temperature were stronger in spring than in fall, which was conducive to the formation of SO42− through a homogeneous gas phase oxidation reaction. The concentration of NO3 in winter was 2.3–8.1 times higher than in other seasons. However, there were little differences in the seasonal concentrations of its precursor NO2, with their concentrations 1.3–1.6 times higher in spring and winter than in other seasons. The variation of NO3 concentration in particulate matter largely depends on temperature and RH [45]. High temperature and low RH in summer are not conducive to the existence of NO3 in the form of particulate matter and also cause the loss of NO3 volatilization in the sampled filter membrane [37,39]. The low temperature and high RH in winter are beneficial for nitrate stabilization. NH3, mostly from agricultural emissions due to the intensive use of fertilizer, had higher concentrations in spring (18.86 μg·m−3) and summer (14.57 μg·m−3) than in fall (11.98 μg·m−3) and winter (11.65 μg·m−3). Abundant acidic substances in winter were conducive to the conversion of NH3 to NH4+, while high temperature and precipitation scavenging in summer decreased NH4+, leading to a significantly higher concentration of NH4+ in winter than in summer.
Na+ was another important ion and ranked fourth concentration in WSIIs. Mg2+ and Ca2+ usually come from soil dust, and Na+ can also come from sea salt in addition to soil dust [46]. In this study, the concentrations of Na+, Ca2+, and Mg2+ were higher in summer than in other seasons, which may be related to the dust from the surrounding construction sites. K+ and Cl concentrations were highest in winter, followed by spring and fall, and lowest in summer. K+ is a representative element of biomass combustion, which reflects the phenomenon of straw and leaf burning in winter. Cl comes not only from biomass burning and fossil fuel burning but also from sea salt [47]. There was a significant correlation between K+ and Cl in winter, r = 0.97. Considering that Wanzhou does not use coal for central heating in winter and is located away from the coast, biomass burning was likely to be the main cause of higher Cl concentrations in winter.

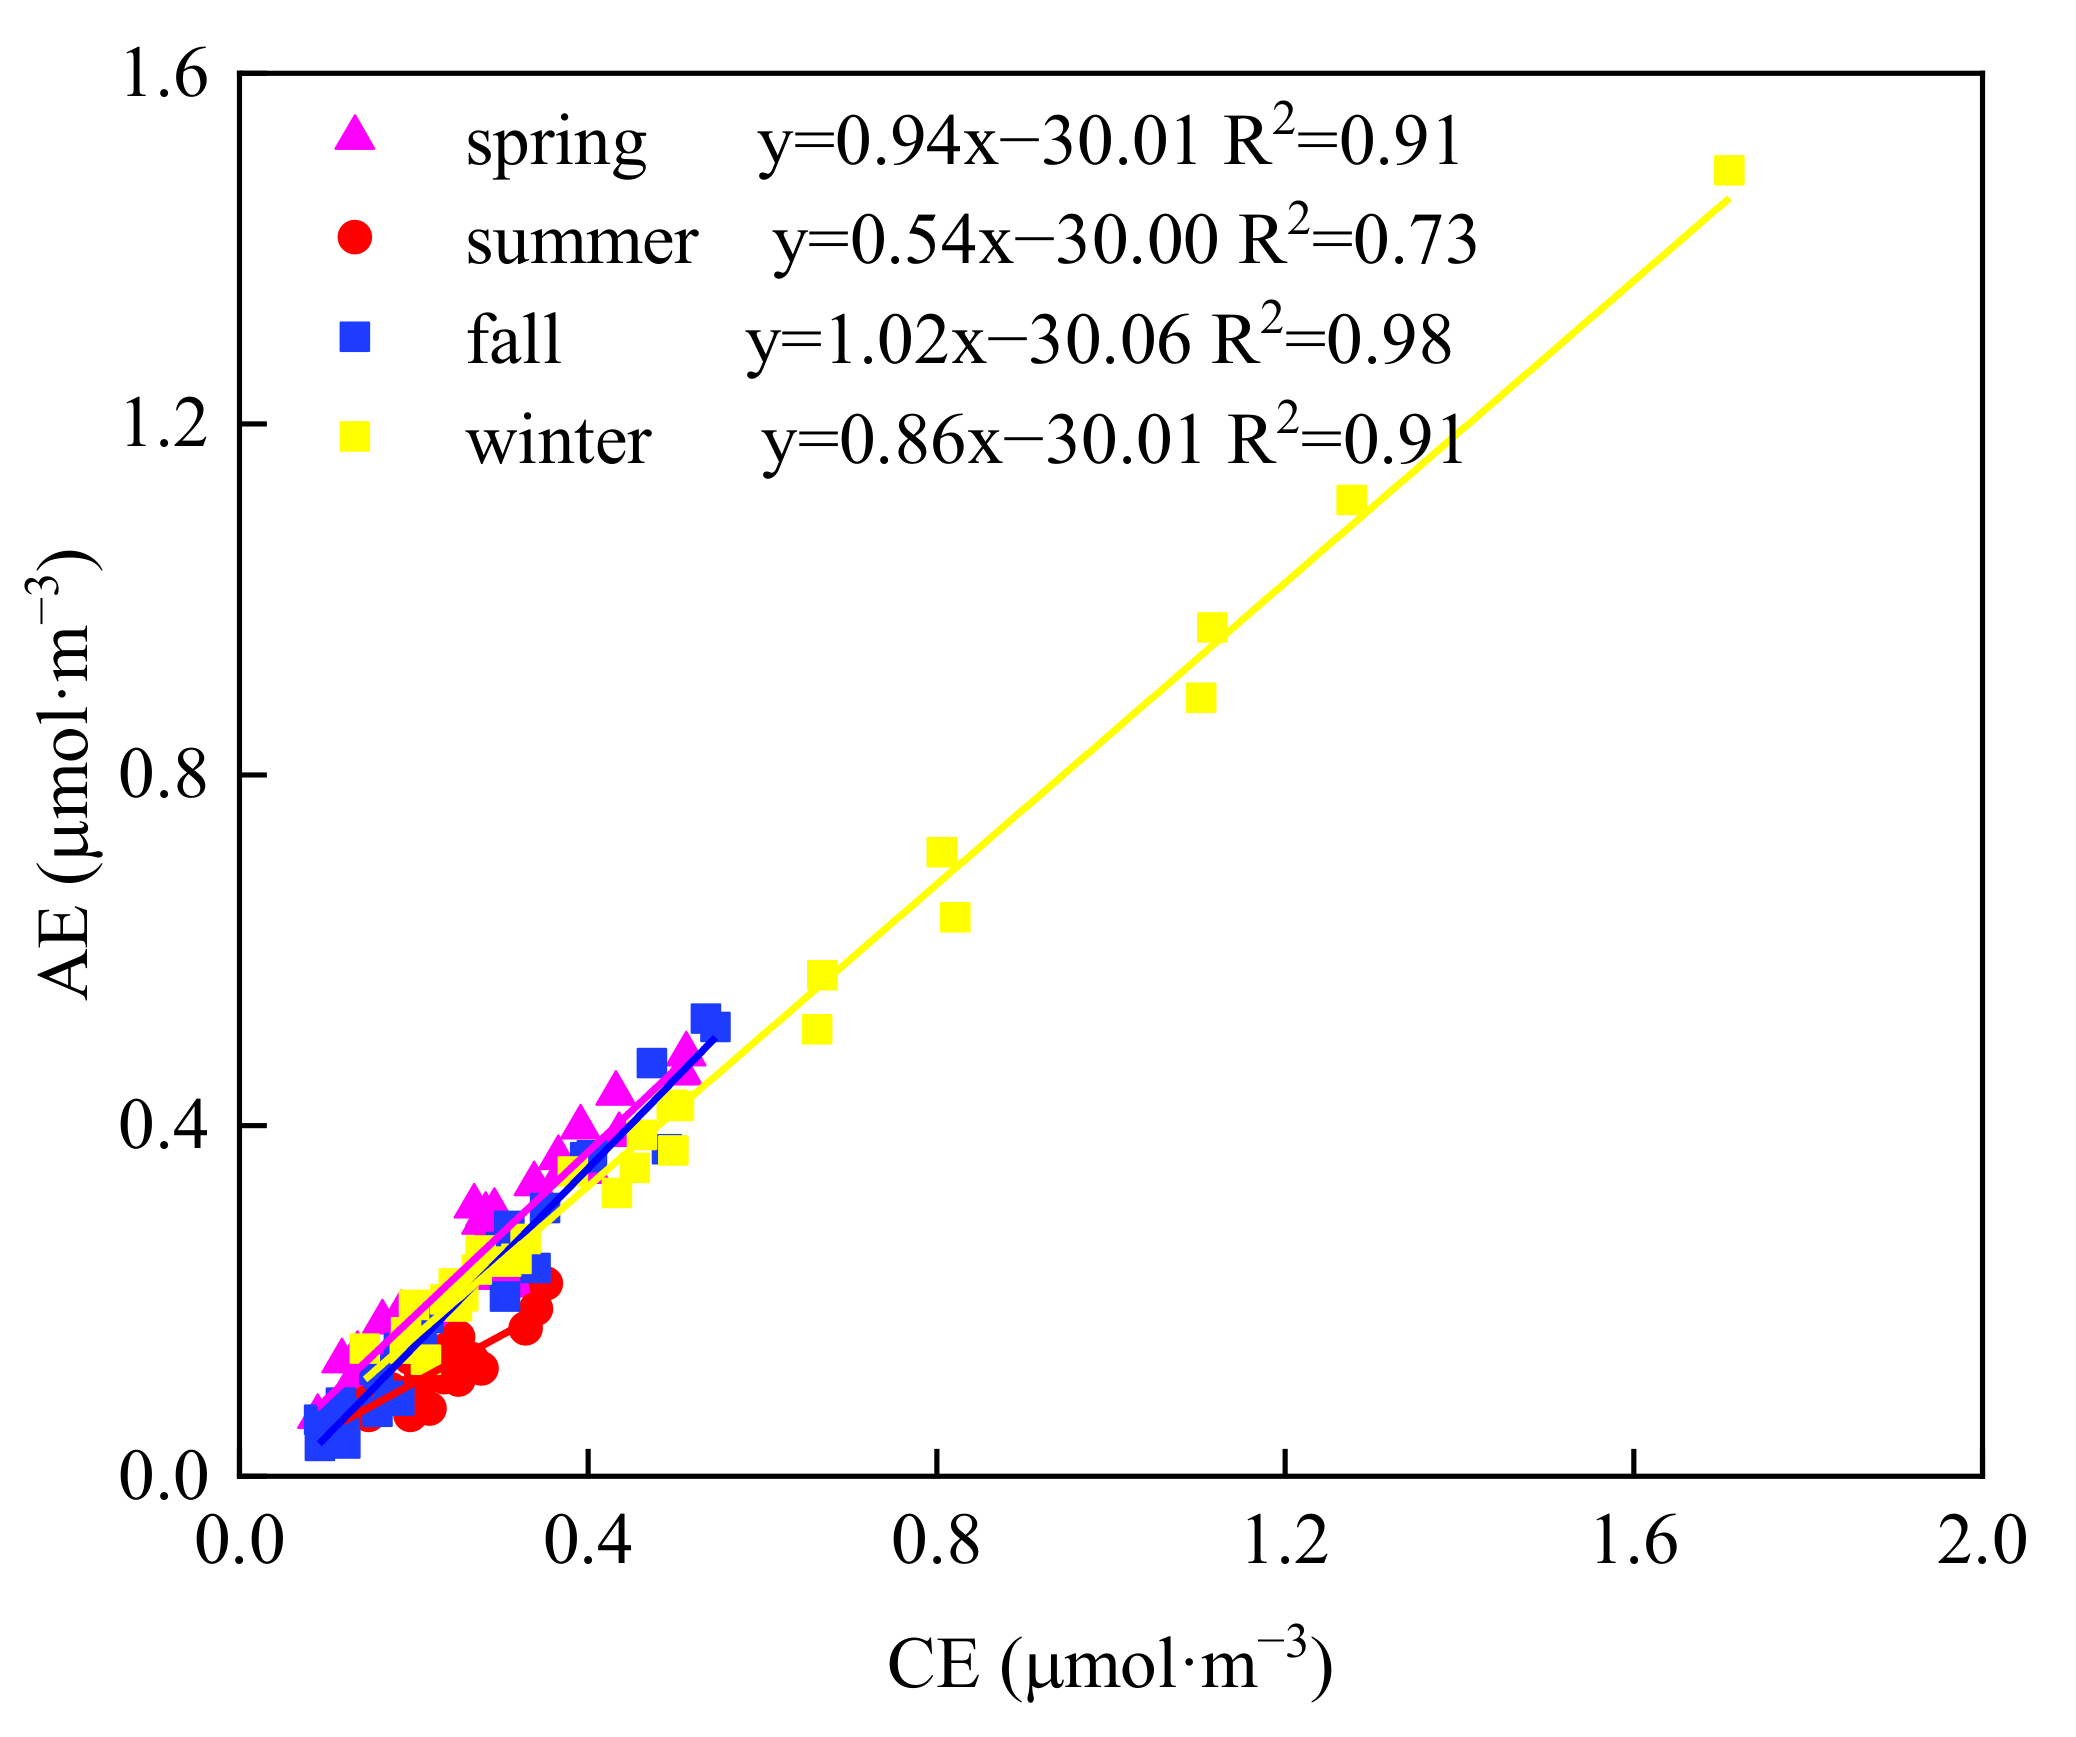
3.3. Stoichiometric Analysis of Cations and Anions
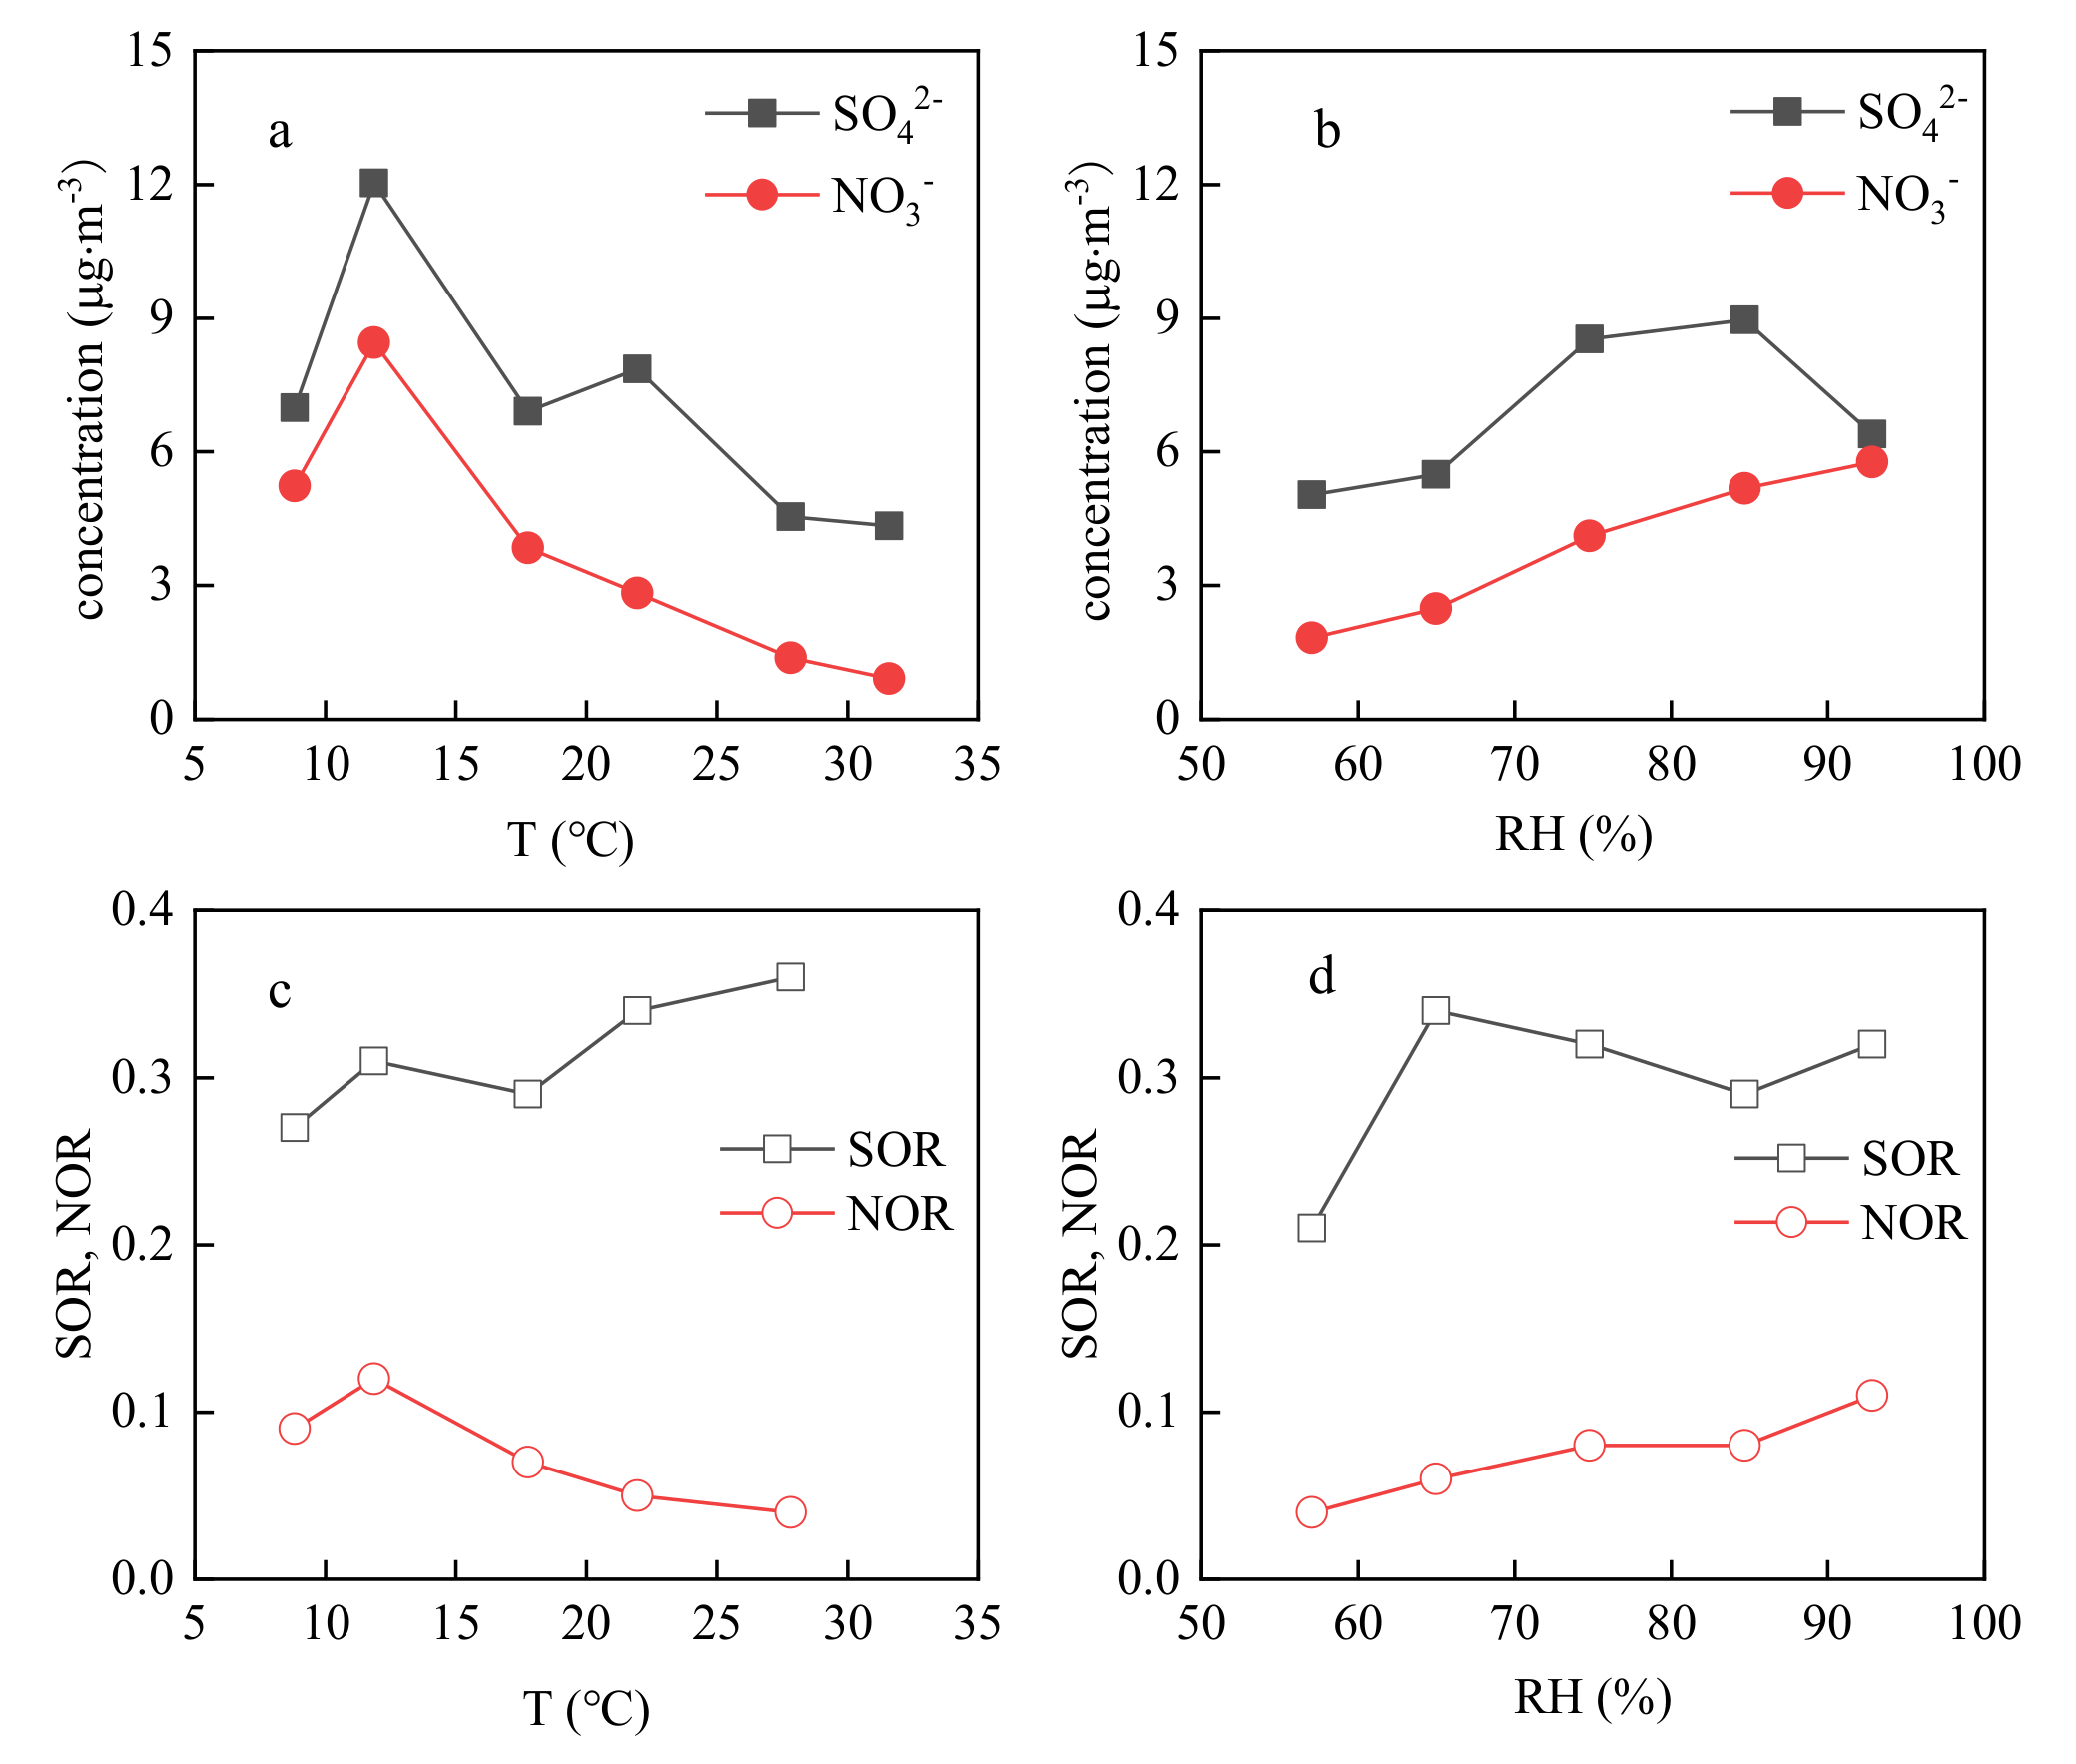
Figure 3 depicts the linear relationship between cations and anions equivalents in four seasons in Wanzhou. Anion equivalent (AE) and cation equivalent (CE) were calculated as follows:
AE = C l 35.5 + S O 4 2 48 + N O 3 62
CE = M g 2 + 12 + N H 4 + 18 + C a 2 + 20 + N a + 23 + K + 39
As shown in Figure 3, strong correlations between AE and CE were found in all seasons, supporting that the measured eight ions were the major constituents in the PM2.5 ionic components. The annual mean AE/CE ratio (slope of the linear regression) was 0.90, indicating weak alkaline PM2.5 aerosols at Wanzhou. Similar patterns of PM2.5 acidity (AE/CE slope < 1) were also observed in Fuling and Beibei, both small cities of Chongqing [7,37]. Seasonally, except for fall, the slopes of the line for spring, summer, and winter were lower than 1. In summer, the slope of the line was 0.54, demonstrating an apparent deficiency of anions of PM2.5 samples, which can be attributed partly to the measurement of bicarbonate and carbonate as well as the elevated concentrations of alkaline dust particles in summer, such as Na+ and Ca2+; thus PM2.5 samples showed alkaline feature. In spring and winter, the slopes of the line were 0.94 and 0.86, respectively, indicating a weakly alkaline property, which can be ascribed to the high levels of acid ions of SO42− and NO3 in spring and winter. In the fall, most of the samples generally showed a balance between anions and cations, and the slope of the line was almost equal to 1.

3.4. Formation Path of SO42− and NO3

NO3 and SO42− are mainly secondary ions formed by gaseous precursors (NOx, SO2) through atmospheric chemical reactions. The mass ratio of NO3/SO42− is commonly used to assess the relative influence of mobile or stationary sources on atmospheric nitrogen and sulfur [33]. The high values of NO3/SO42− (>1) are ascribed to the large number of mobile sources (such as motor vehicle exhaust) in China. If the NO3/SO42− ratios are low (<1), that indicates that a fixed source (such as coal combustion) is the main source. During the sampling period, the annual average ratio of NO3/SO42− in Wanzhou was 0.54, lower than Nanjing (1.38) and Shanghai (1.40) [48] and comparable with Fuling (0.49) [37]. The results indicated that the contribution of stationary sources to PM2.5 was greater than that of mobile sources in Wanzhou. In addition, the seasonal average ratios of NO3/SO42− were ranked in the order of winter (0.85) > fall (0.57) > spring (0.44) > summer (0.27). The NOx from automobile exhaust is more easily converted into NO3 under the poor atmospheric dilution and diffusion conditions in winter, which increases the concentration of NO3 in the atmosphere [5,45], thus resulting in the highest NO3/SO42− ratio in winter. On the contrary, the minimum ratio appeared in summer, which may be related to the volatility of nitrate at high temperature [18].
Sulfur oxidation ratio (SOR) and nitrogen oxidation ratio (NOR) are usually used to represent the formation and transformation process of secondary aerosols using the following equations [49]:
SOR = S O 4 2 S O 4 2 + S O 2
NOR = N O 3 N O 3 + N O 2
where [SO42−], [SO2], [NO3], and [NO2] are the molar concentrations of SO42−, SO2, NO3−, and NO2, respectively. Because of the monitoring instrument failure, NO2 and SO2 data in the summer were missing. Generally, the critical values of SOR and NOR are both 0.1, and higher NOR and SOR values indicate increased secondary transformation [50,51]. During the sampling period, the average value of SOR was 0.31, indicating a significant secondary transformation of SO2 in the atmosphere. In addition, the value of SOR was the highest in spring (0.40), followed by winter (0.30), and the lowest in fall (0.22). The NOR values had a different seasonal pattern from SOR, which peaked in winter (0.13) and had lower values in spring and fall (both 0.06). Both sulfate and nitrate had two formation pathways, homogenous and heterogeneous reactions. Homogeneous gas-phase oxidation reaction involves SO2 or NO2 and OH radicals, which is a strong function of temperature. Heterogeneous transformation processes (H2O2/O3 oxidization under the catalysis of metal or hydrolysis of N2O5 on preexisting particles) are correlated with RH and mass concentration of particulate matter [7,18,52]. As shown in Figure 4a, when the temperature was low (<15 °C), its concentration increased with the temperature, but when the temperature was higher than 15 °C, its concentration decreased rapidly, and NOR also presented a similar trend (Figure 4c). In winter, the temperature was usually below 15 °C, and it was found that NH4+ and NO3 had significant correction (r = 0.84, 0.92, 0.95 in spring, fall, and winter, respectively), so it can be inferred that NO3 was mainly formed through homogeneous meteorological reaction in winter. NO3 is more volatile at high temperatures, which is the reason NOR is lower at high temperatures [41]. Additionally, NOR increased with RH (Figure 4d), suggesting the main formation pathway of NO3 was a heterogenous reaction in the fall (average RH: 83.3%). Since SOR increased with temperature and RH (Figure 4c,d), it can be speculated that SO42− was mainly formed by heterogeneous reactions in winter (lower temperature, higher relative humidity, Table 1), while both homogeneous and heterogeneous reactions existed in spring and fall.

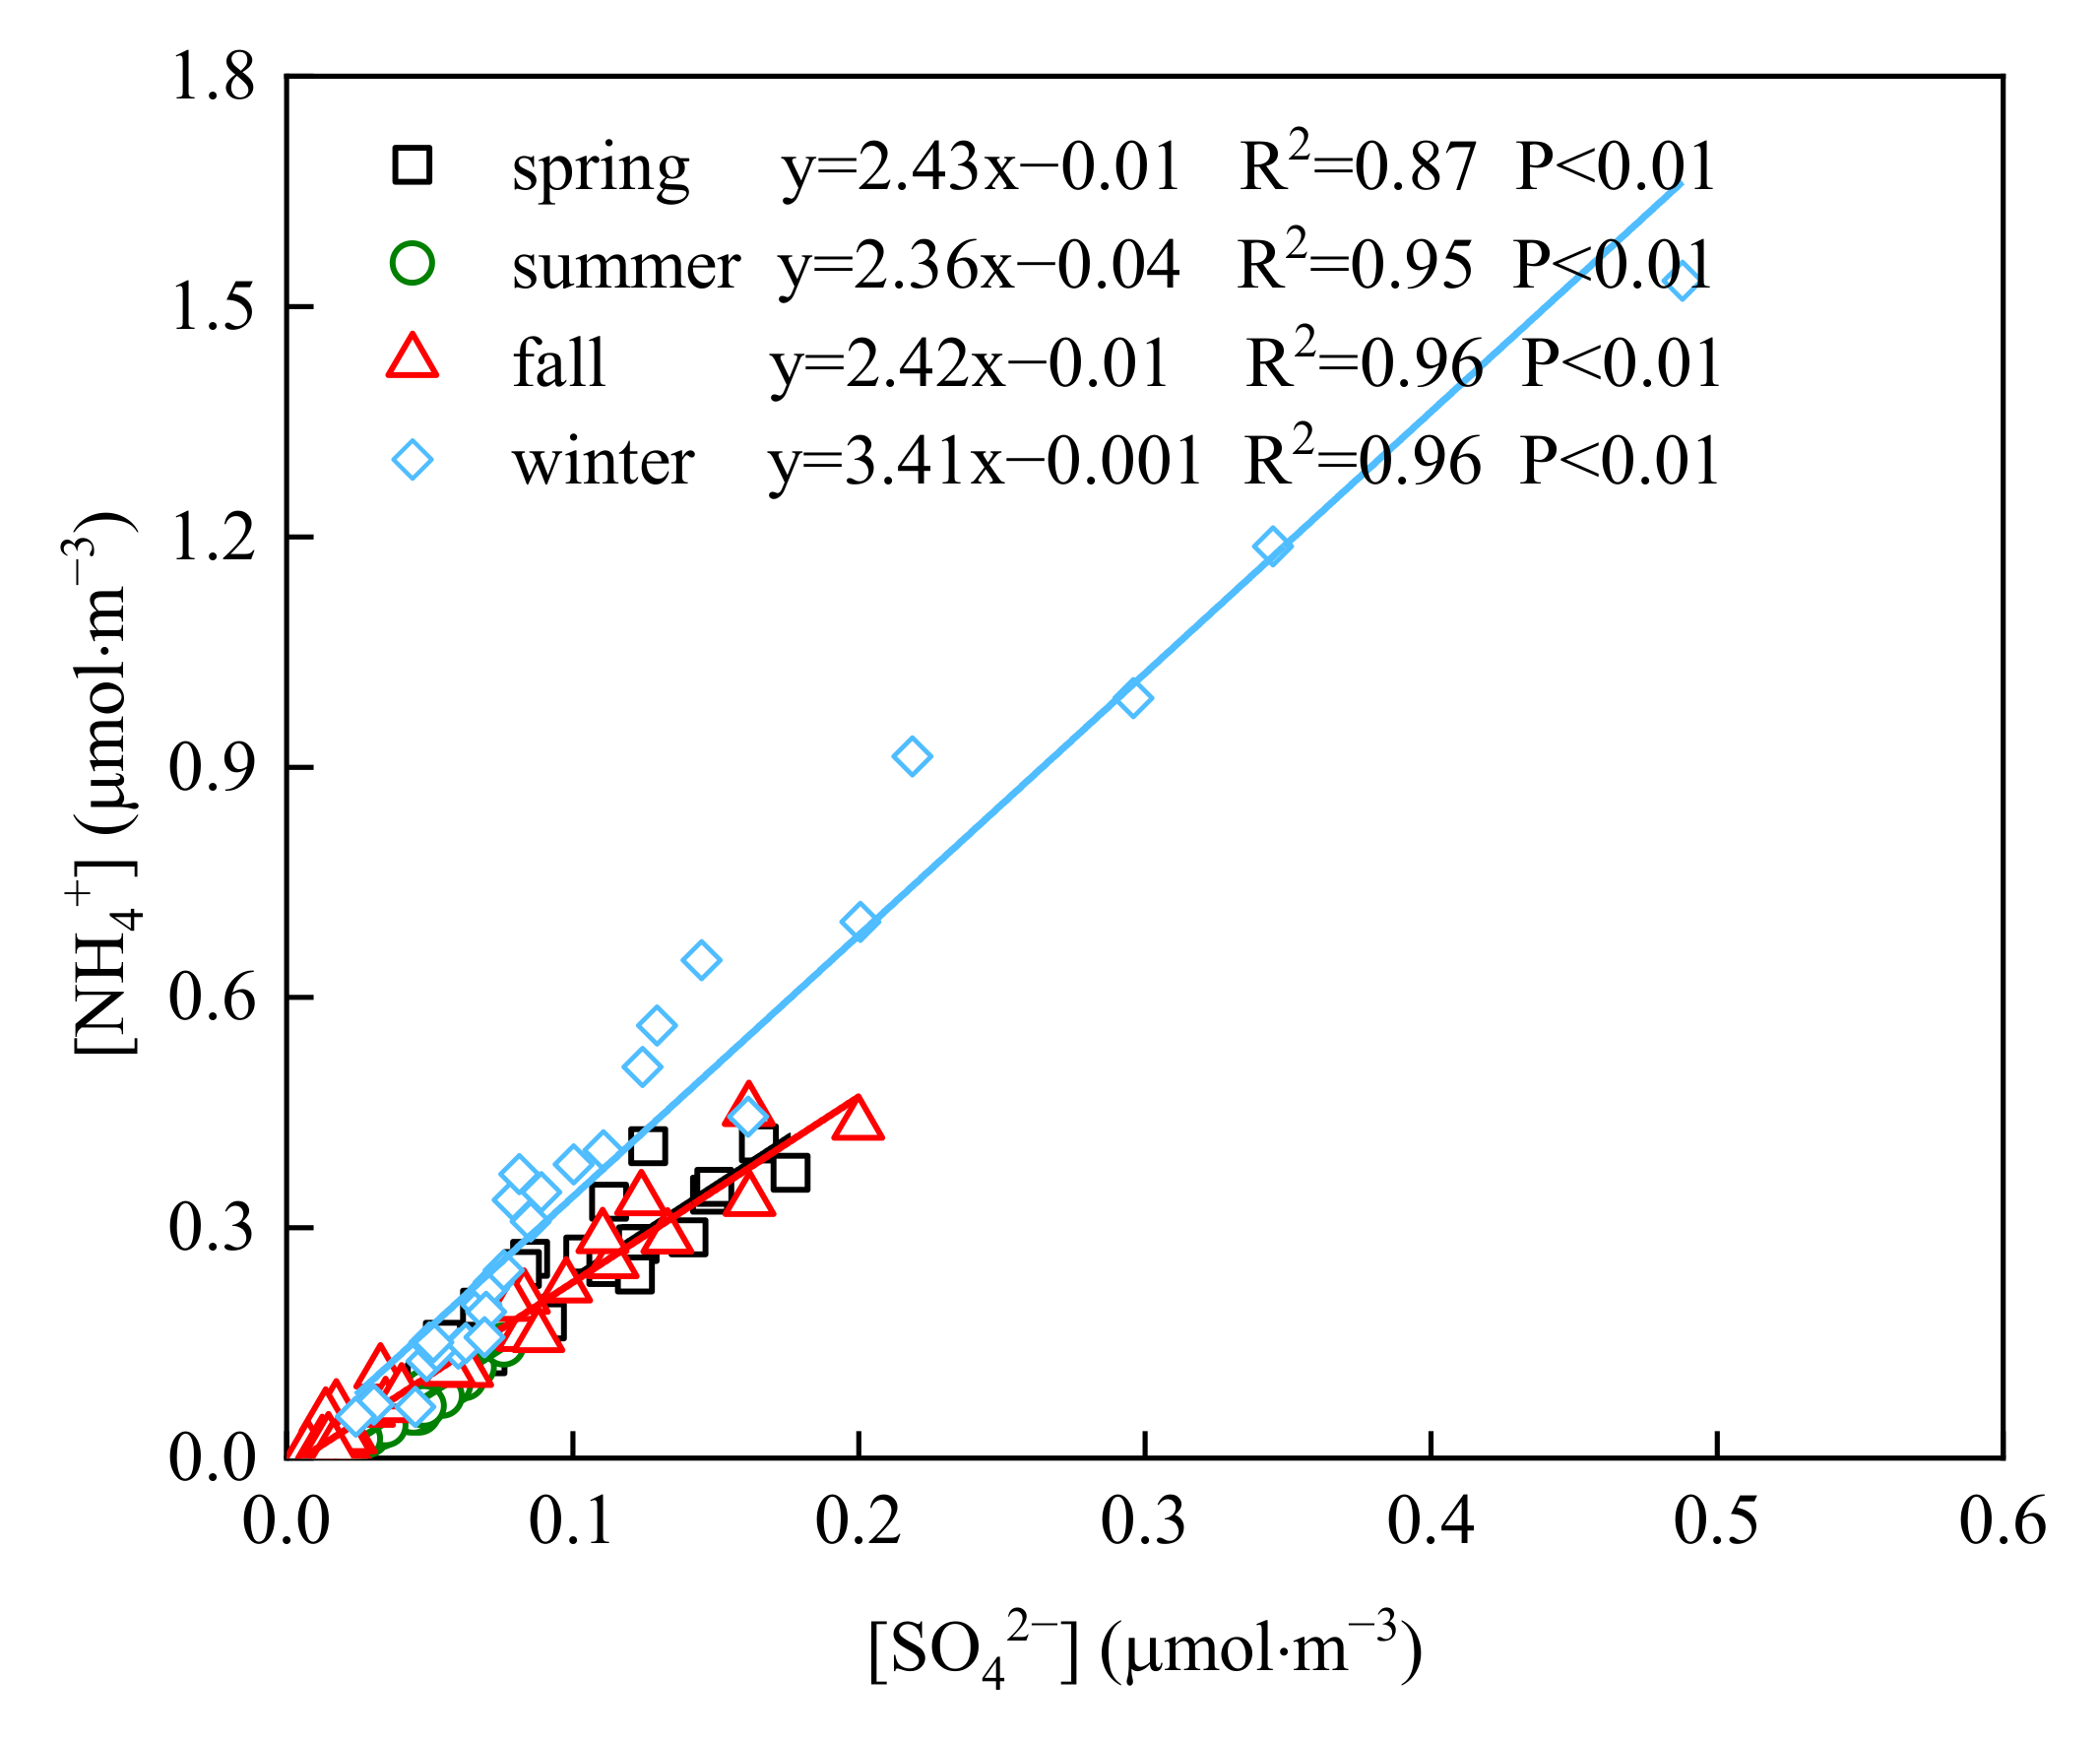
3.5. Chemical Forms of SNA

NH3 could react with acidic gases such as H2SO4 and HNO3 to form (NH4)2SO4, NH4HSO4, and NH4NO3 through homogeneous reactions. Moreover, NH3 reacts preferentially with H2SO4 to form non-volatile (NH4)2SO4 or NH4HSO4, and the excess NH3 further reacts with HNO3 to form relatively volatile NH4NO3 [53]. As shown in Figure 5, significant correlations between [NH4+] and [SO42−] were found in the four seasons, with the correlation coefficient being larger than 0.90. The slopes of linear regressions higher than 2.0 indicated that there was sufficient NH4+ to neutralize SO42− to form (NH4)2SO4 rather than NH4HSO4. In order to identify the specific existence forms of (NH4) 2SO4 or NH4HSO4 and NH4NO3, it can be distinguished by comparing the NH4+ measured experimentally with the NH4+ calculated [54]. When NO3, SO42− and NH4+ exist as the form of (NH4)2SO4 and NH4NO3, the estimated concentration of NH4+ can be calculated by ρ (NH4+) (μg· m−3) = 0.38ρ (SO42−) + 0.29ρ (NO3). When NO3, SO42− and NH4+ exist in the form of NH4HSO4 and NH4NO3, the estimated concentration of NH4+ can be expressed as ρ(NH4+) (μg m−3) = 0.192ρ (SO42−) + 0.29ρ (NO3). The regression analysis of NH4+ measured and calculated values were shown in Table 3. Assuming that NH4+ existed in (NH4)2SO4, the slopes of regression lines in spring, summer, fall, and winter were 0.99, 1.03, 0.93, and 1.21, respectively. When NH4+ was assumed to exist as the form of NH4HSO4, the slopes of regression lines were 1.57, 1.74, 1.48, and 1.83, respectively. By comparison, the slopes of (NH4)2SO4 in the four seasons were closer to 1, and the measured values and the calculated values were relatively consistent. Therefore, it can be concluded that NO3, SO42−, and NH4+ mainly exist in the form of (NH4)2SO4 and NH4NO3 in Wanzhou during the sampling period.

3.6. Source Apportionment of WSIIs

3.6.1. Principal Component Analysis (PCA) of WSIIs

In this study, principal component analysis (PCA) was used to analyze the sources of WSIIs during the observation period. PCA can extract several potential factors from the mass concentration data, which can be used to explain the relationship between the measured samples [55]. PCA was conducted for 11 variables (Na+, NH4+, K+, Mg2+, Ca2+, Cl, NO3, SO42−, NH3, SO2, NO2), and the KMO test value was 0.753, greater than 0.5, indicating that it was suitable for factor analysis. Based on the PCA method, three factors (potential sources) were identified as principal components (PC) at Wanzhou (Table 4). PC1 explained 49.5% of the total variance, and was mainly affected by NH4+ (0.96), K+ (0.98), Cl (0.95), NO3(0.89), SO42− (0.96), NO2 (0.56), and SO2 (0.65). NH4+, NO3, and SO42− are the typical traces of secondary sources [56,57]. K+ and Cl are associated with coal combustion and biomass burning. SO2 and NO2 are derived from coal burning and automobile exhaust emissions, respectively. Therefore, PC1 was attributed to the mixture of secondary origin aerosol, biomass burning, coal combustion, and automobile exhaust. PC2, responsible for 23.2% of the total variance, was characterized by high loadings of Na+ (0.87), Mg2+ (0.70), and Ca2+ (0.86). Since Na+, Mg2+, and Ca2+ are principal markers of dust emissions [58,59], PC2 was identified as construction dust and road dust source in the present study. PC3 explained 9.68% of the total variance with obvious loading of NH3 (0.93) and NH3, which mainly came from agriculture activities. In view of there being several agricultural fields to the west of the sampling site, PC3 was regarded as agricultural activity.

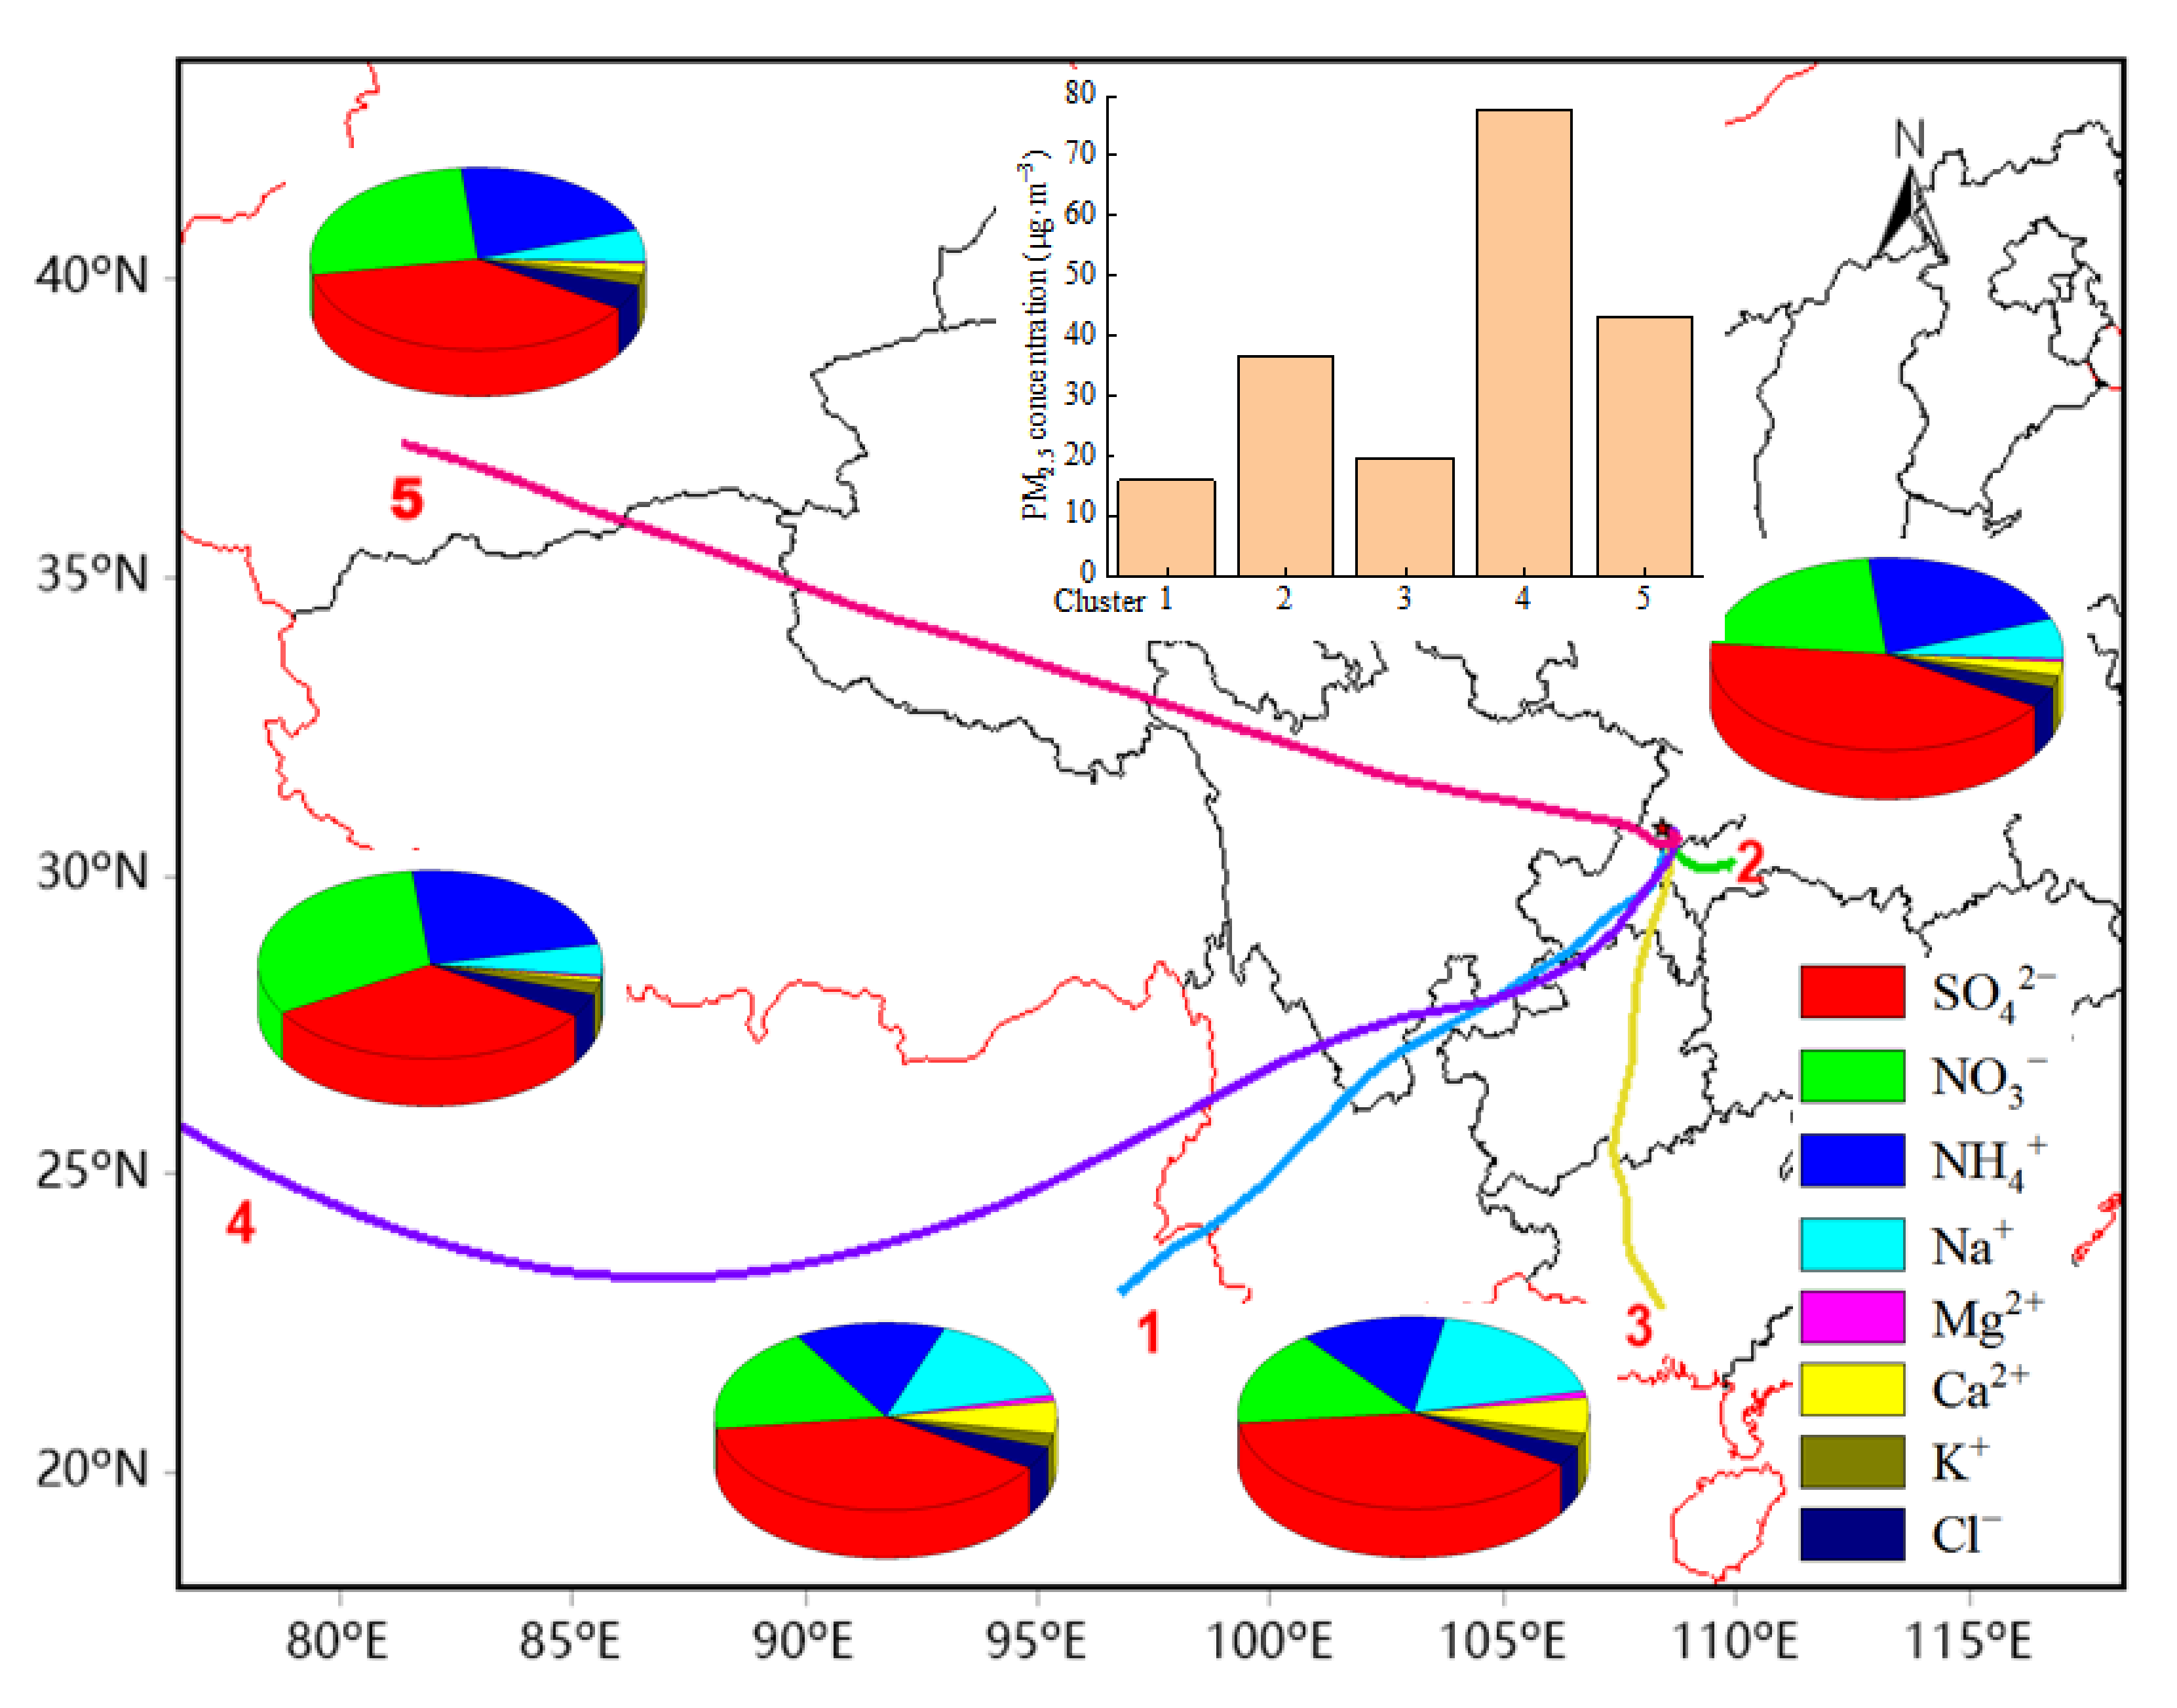
3.6.2. Regional Transport

To analyze the effects of air mass on atmospheric quality, 72 h backward trajectories arriving in Wanzhou during the sampling period were calculated by the TrajStat [60]. The starting time of trajectory calculation per day was 10:00 am (UTC), with the arrival level at 500 m AGL (Above Ground Level). The cluster analysis was based on the 72 h backward trajectories and grouped into five clusters (Figure 6). Cluster 1 mainly came from the southwest pathway, originating from Burma, through the Yunnan Province, and the junction of Chongqing and Guizhou Province. Cluster 3 represented the southern pathway which originated from Guangxi Province and passed through Guizhou Province. Clusters 1 and 3 (accounting for 8.8% and 17.7%, respectively) had mid-distance air mass trajectories and carried with the lowest PM2.5 and WSIIs concentrations. However, Clusters 1 and 3 showed high proportions of dust ions (Na+, Mg2+, and Ca2+), accounting for 22.3% and 25.5%, respectively. In terms of the origins and pathways, these air masses were expected to bring in relatively clean air passing through some sparsely populated, thus contributing toward pollution alleviation in Wanzhou. Cluster 2 was the dominant trajectory in Wanzhou (accounting for 63.7%), which mainly originated from the local southeastern area. Since Wanzhou’s large-scale industrial complexes, including chemical plants, cement plants, and power plants, are located southeast of the sampling site, the southeast wind brought in a large number of pollutants from the industrial activities from this region’s sources [61]. Cluster 5 (accounting for 7.9%) had long-range air masses originating from southern Xinjiang Province through the Tibet Autonomous Region, Qinghai, and Sichuan Provinces. The air masses in Clusters 2 and 5 carried higher concentrations of PM2.5 and WSIIs, and their ionic compositions were similar, with the proportion of SNA reaching 84.8% and 85.6% of WSIIs, respectively. Cluster 4 (accounting for 1.8%) reflected the ultra-long-distance and polluted air masses transported from Saudi Arabia. This cluster corresponded to the highest concentrations of PM2.5 and WSIIs, with the highest contribution (average 87.3%) from SNA. Since Cluster 4 mainly occurred in winter, it can be inferred that the transport of air mass from this pathway may be related to the air pollution in winter.

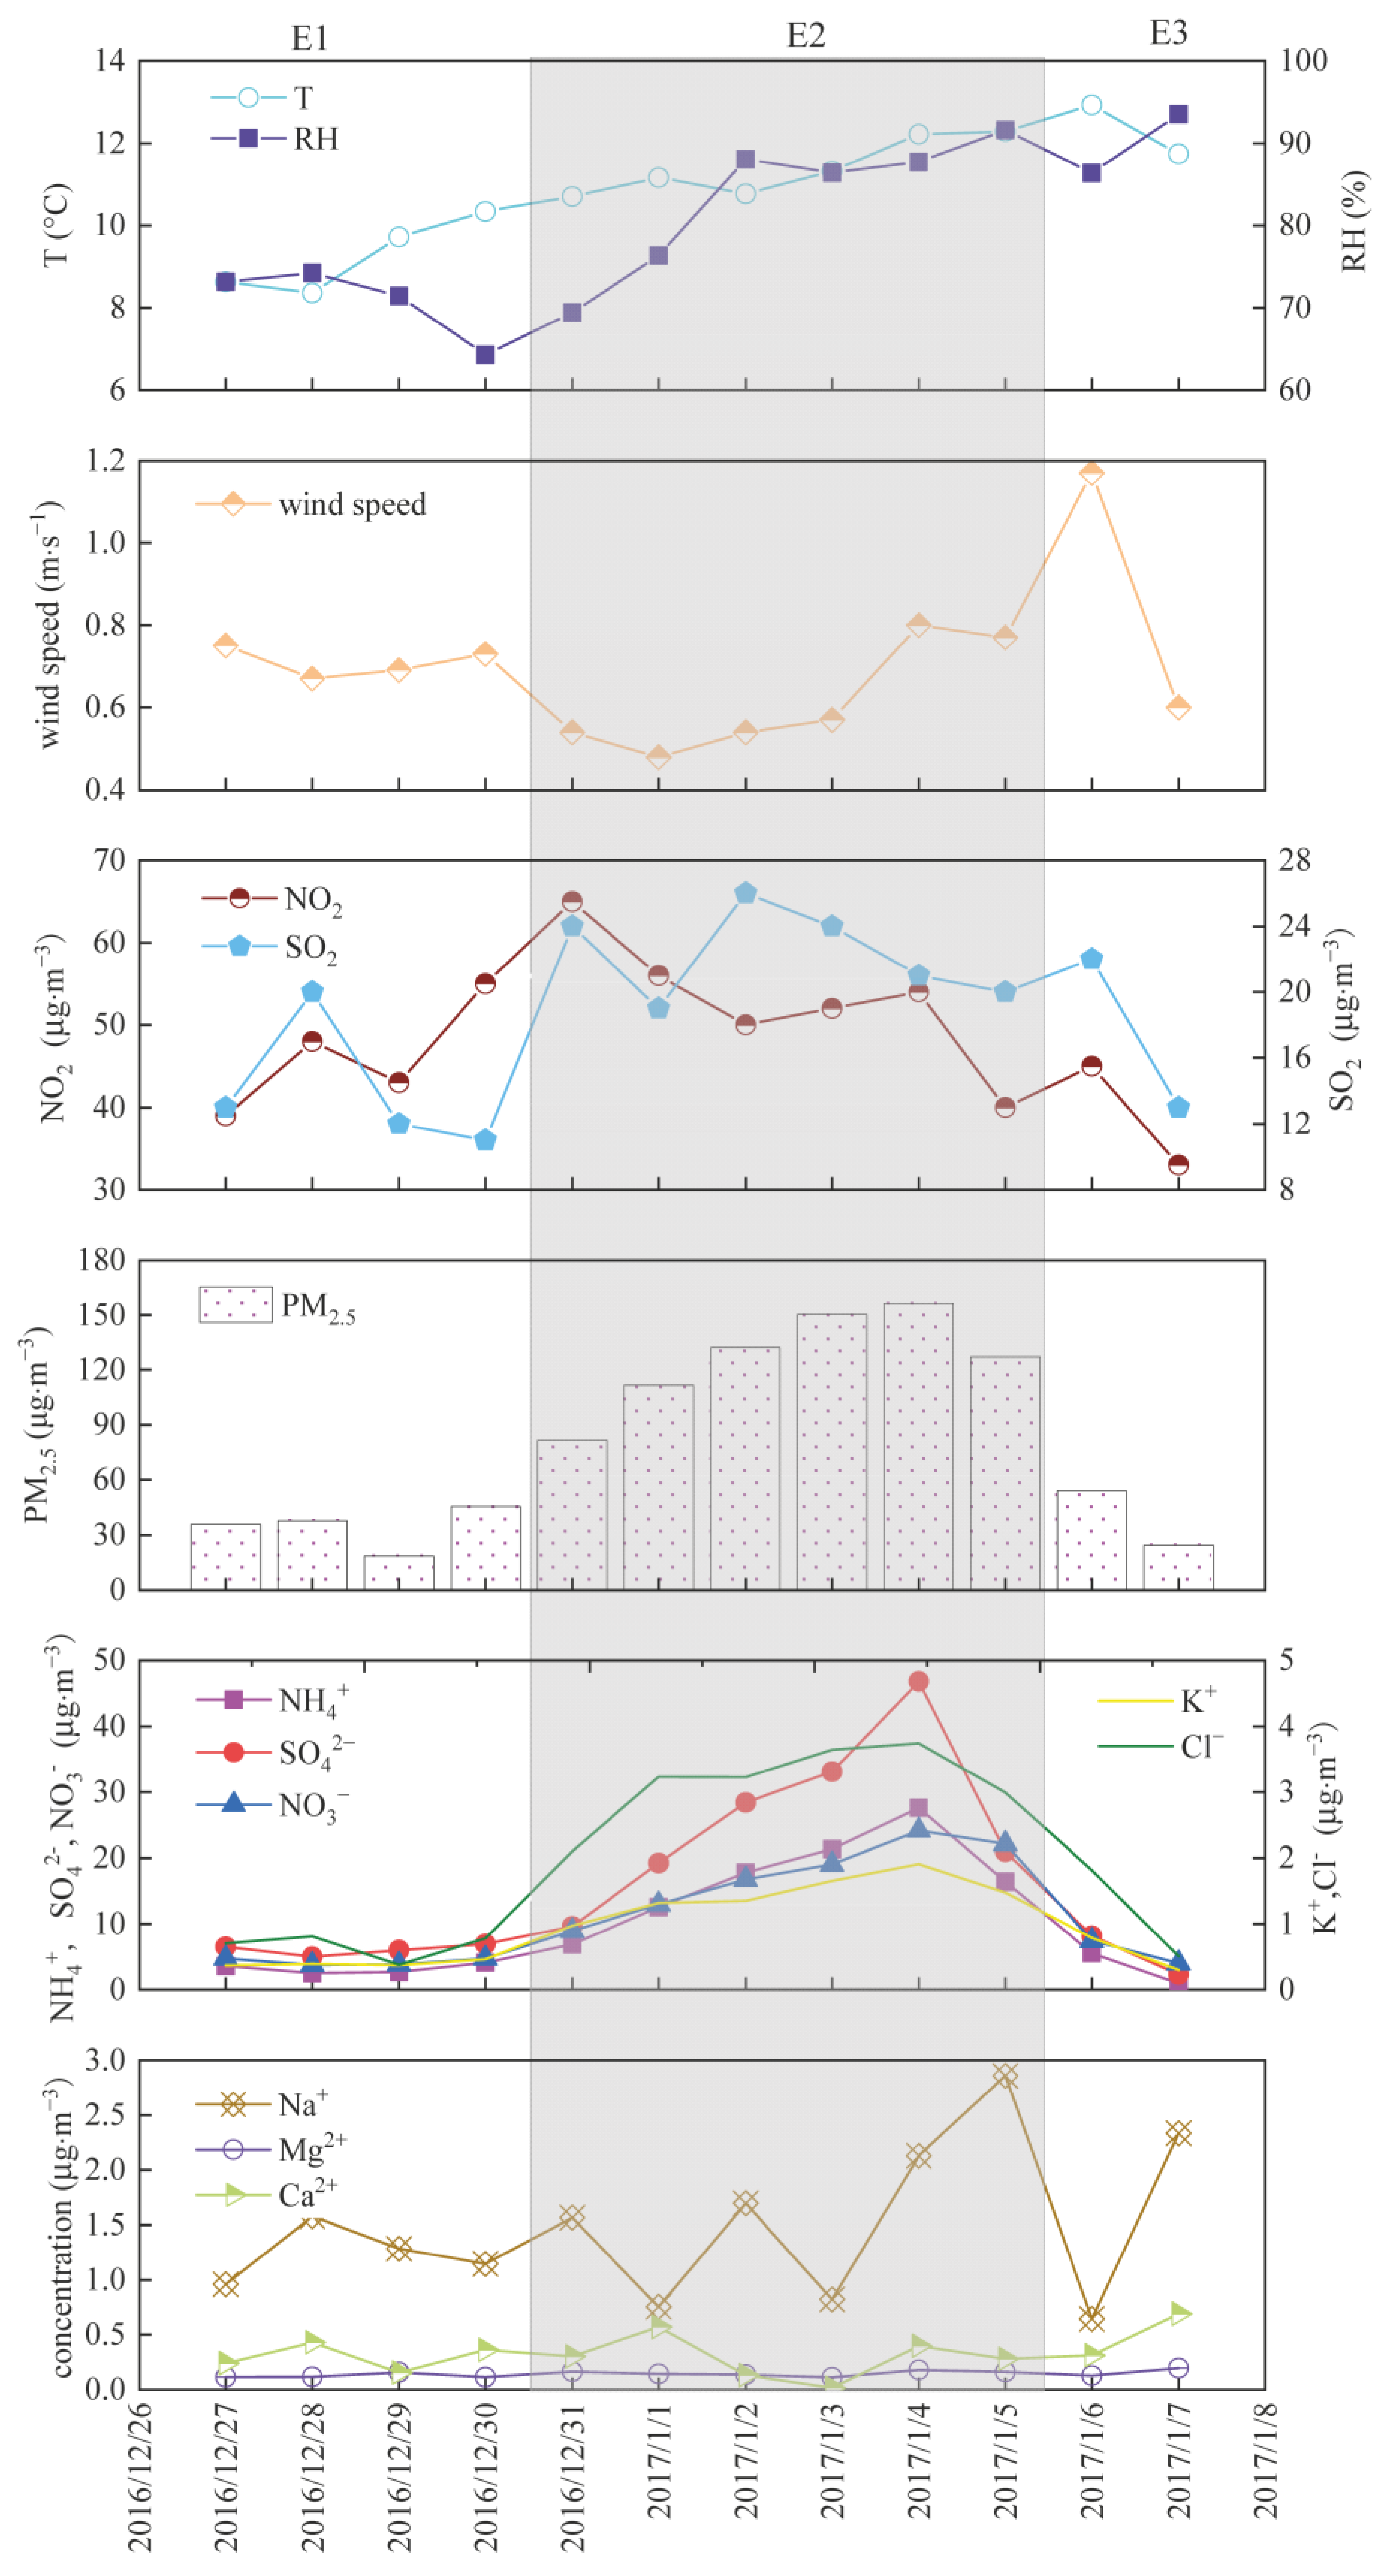
3.7. Air Pollution Event

There was a long-lasting pollution event that occurred from 31 December 2016 to 5 January 2017, with average PM2.5 concentration reaching 126.51 μg·m−3, exceeding the NAAQS-China daily limit of 75 μg·m−3 by a factor of 1.8. The time series of daily meteorological parameters, gaseous precursors, PM2.5, and WSIIs concentrations are depicted in Figure 7. The whole sampling campaign was divided into three stages according to PM2.5 concentrations, namely, the pre-pollution stage (P1), the pollution occurred stage (P2), and the post-pollution stage (P3). The P1 phase was from 27 to 30 December 2016, when the average PM2.5, NO2, and SO2 concentrations were 34.46, 46.25, and 14.00 μg·m−3. The P2 phase covered the period (31 December 2016 to 5 January 2017) of the long-lasting pollution event, when the average PM2.5, NO2, and SO2 concentrations were 126.51, 52.83, and 22.33 μg·m−3. Compared with those in P1, the temperature and relative humidity increased by 23% and 17%, respectively, while the wind speed decreased from 0.71 to 0.62 m·s−1. During this period, PM2.5 gradually accumulated and peaked on 4 January 2017 to the level of 156.30 μg·m−3, while NO2 and SO2 peaked at 65 and 26 μg·m−3 on 31 December 2016, and 2 January 2017, respectively. The P3 phase was from 6 to 7 January 2017, when PM2.5 concentration decreased rapidly due to the removal of air pollutants by rainfall.
As shown in Figure 7, the concentrations of PM2.5, WSIIS, and all the measured gaseous precursors were observably higher during the pollution phase (P2) than before (P1) and after the pollution event (P3). Taking P1 as the reference phase, PM2.5 concentration in P2 increased 3.7 times, and the total amount of SNA increased 4.5 times. SO42−, NO3, and NH4+ increased 4.3, 4.1, and 5.3 times, from a low of 6.13, 4.28, and 3.23 μg·m−3 (P1) to 26.37, 17.23, and 17.12 μg·m−3 (P2), respectively. SOR and NOR were also enhanced by a factor of 1.8 and 2.8 in P2, respectively (from 0.24 to 0.42, 0.07 to 0.20, respectively). However, their gaseous precursors SO2 and NO2 only increased by 1.6 and 1.1 times in P2, respectively. It is evident that this air pollution event was mainly caused by the enhanced chemical transformation of gaseous precursors to SNA. Compared to P1, the temperature increased by 1.2 °C in P2 (from 9.26 to 11.41 °C), which promoted stronger photochemical reactions. A good correlation was found between temperature and SOR (r = 0.65) or NOR (r = 0.85), suggesting homogeneous reactions as the main formation mechanism for the high level of SO42− and NO3. At the same time, the average relative humidity increased from 71% in P1 to 83% in P2. The relative humidity also had a good correlation with SOR and NOR, and the correlation coefficients were 0.73 and 0.95, respectively, indicating that heterogeneous reaction also contributed to the increase of SO42− and NO3 concentrations. The strong enhancement of NH4+ concentration in P2 was apparently attributed to those of SO42− and NO3. In addition, the concentration of K+ and Cl also increased significantly during the P2 stage, which increased by 3.6 and 4.7 times, respectively, but the proportion of K+ and Cl in WSIIs varied little. The elevated concentration of K+ and Cl may be related to straw burning in the surrounding farmland. The concentrations of Na+, Mg2+, and Ca2+ did not vary significantly during the whole sampling period, indicating that the source strength was relatively stable. Combined with the little variation of concentration of primary pollutants SO2 and NO2, it can be inferred that this air pollution event was mostly caused by the enhanced formation of SNA through homogeneous and heterogeneous reactions.

4. Conclusions

From April 2016 to January 2017, PM2.5 samples were collected in four months (each month represented a season) to analyze the characteristics and sources of WSIIs in Wanzhou. Statistical results displayed that the annual average value in Wanzhou was 33.38 μg·m−3, which was lower than the National Ambient Air Quality Standards of China (NAAQS-China, annual limit of 35 μg·m−3). SO42−, NO3, and NH4+ were the dominating water-soluble ions, with corresponding percentage contributions to the total WSIIs of 41.1%, 22.1%, and 19.9%, respectively. PM2.5 and WSIIs showed the highest concentrations in winter and lowest concentrations in summer. Ion balance analysis showed that PM2.5 was alkaline in summer, weakly alkaline in spring and winter, and close to neutral in fall. The annual average ratio of NO3/SO42− in Wanzhou was 0.54, demonstrating that the contribution of stationary sources to PM2.5 was greater than that of mobile sources in Wanzhou. NO3 was mainly formed through homogeneous meteorological reactions in winter and heterogeneous reactions in fall. SO42− was mainly formed by heterogeneous reactions in winter, while both homogeneous and heterogeneous reactions existed in spring and fall. NO3, SO42−, and NH4+ mainly exist in the form of (NH4)2SO4 and NH4NO3 in Wanzhou during the sampling period. Three main sources of WSIIs in PM2.5 in Wanzhou were analyzed by PCA, which were the mixture of secondary origin aerosol, biomass burning, coal combustion, construction dust and road dust, and agriculture activities, respectively. The 72 h backward trajectory analysis indicated that the local emissions had a significant influence on the atmosphere of Wanzhou, and the ultra-long-distance transport from the southwest air masses carrying the highest PM2.5 and WSIIs may cause air pollution in winter. An air pollution event that occurred in winter was mostly caused by the enhanced formation of SNA through homogeneous and heterogeneous reactions.

Author Contributions

Conceptualization, Y.H. and L.Z.; methodology, L.Z.; writing—original draft preparation, Y.H.; writing—review and editing, F.Y., T.L. and L.Z.; visualization, Y.C.; supervision, C.P.; funding acquisition, Y.H. and L.Z. All authors have read and agreed to the published version of the manuscript.

Funding

This research was funded by the Scientific and Technological Research Program of Chongqing Municipal Education Commission, grant number KJQN202001232 and KJQN202101201, and Key Laboratory of Water Environment Evolution and Pollution Control in Three Gorges Reservoir.

Institutional Review Board Statement

Not applicable.

Informed Consent Statement

Not applicable.

Data Availability Statement

All data presented in this paper are available upon request to Yimin Huang (huangyimin_1986@126.com).

Conflicts of Interest

The authors declare no conflict of interest.

References

  1. He, Q.; Yan, Y.; Guo, L.; Zhang, Y.; Zhang, G.; Wang, X. Characterization and source analysis of water-soluble inorganic ionic species in PM2.5 in Taiyuan city, China. Atmos. Res. 2017, 184, 48–55. [Google Scholar] [CrossRef]
  2. Huang, R.-J.; Zhang, Y.; Bozzetti, C.; Ho, K.-F.; Cao, J.-J.; Han, Y.; Daellenbach, K.R.; Slowik, J.G.; Platt, S.M.; Canonaco, F.; et al. High secondary aerosol contribution to particulate pollution during haze events in China. Nature 2014, 514, 218–222. [Google Scholar] [CrossRef] [PubMed] [Green Version]
  3. Wang, W.; Primbs, T.; Tao, S.; Simonich, S.L.M. Atmospheric Particulate Matter Pollution during the 2008 Beijing Olympics. Environ. Sci. Technol. 2009, 43, 6440. [Google Scholar] [CrossRef] [Green Version]
  4. Hu, G.; Zhang, Y.; Sun, J.; Zhang, L.; Shen, X.; Lin, W.; Yang, Y. Variability, formation and acidity of water-soluble ions in PM2.5 in Beijing based on the semi-continuous observations. Atmos. Res. 2014, 145–146, 1–11. [Google Scholar] [CrossRef]
  5. Tian, M.; Wang, H.; Chen, Y.; Zhang, L.; Shi, G.; Liu, Y.; Yu, J.; Zhai, C.; Wang, J.; Yang, F. Highly time-resolved characterization of water-soluble inorganic ions in PM2.5 in a humid and acidic mega city in Sichuan Basin, China. Sci. Total Environ. 2016, 580, 224–234. [Google Scholar] [CrossRef]
  6. Zheng, S.; Pozzer, A.; Cao, C.X.; Lelieveld, J. Long-term (2001–2012) concentrations of fine particulate matter (PM2.5) and the impact on human health in Beijing, China. Atmos. Chem. Phys. 2015, 15, 5715–5725. [Google Scholar] [CrossRef] [Green Version]
  7. Pan, Y.; Luo, L.; Xiao, H.; Zheng, N.; Fang, X.; Zhang, Z.; Xiao, H. A one-year comprehensive characteristics of water soluble inorganic ions in PM2.5 from a typical mountainous city. Atmos. Pollut. Res. 2020, 11, 1883–1890. [Google Scholar] [CrossRef]
  8. Chen, Y.; Xie, S.-D.; Luo, B.; Zhai, C.-Z. Particulate pollution in urban Chongqing of southwest China: Historical trends of variation, chemical characteristics and source apportionment. Sci. Total Environ. 2017, 584–585, 523–534. [Google Scholar] [CrossRef]
  9. Wang, H.; Tian, M.; Chen, Y.; Shi, G.; Liu, Y.; Yang, F.; Zhang, L.; Deng, L.; Yu, J.; Peng, C.; et al. Seasonal characteristics, formation mechanisms and source origins of PM2.5 in two megacities in Sichuan Basin, China. Atmos. Chem. Phys. 2018, 18, 865–881. [Google Scholar] [CrossRef] [Green Version]
  10. Tian, M.; Wang, H.; Chen, Y.; Yang, F.M.; Zhang, X.H.; Zou, Q.; Zhang, R.Q.; Ma, Y.L.; He, K.B. Characteristics of aerosol pollution during heavy haze events in Suzhou, China. Atmos. Chem. Phys. 2016, 16, 7357–7371. [Google Scholar] [CrossRef]
  11. Quan, J.; Tie, X.; Zhang, Q.; Liu, Q.; Li, X.; Gao, Y.; Zhao, D. Characteristics of heavy aerosol pollution during the 2012–2013 winter in Beijing, China. Atmos. Environ. 2014, 88, 83–89. [Google Scholar] [CrossRef]
  12. Wang, S.; Yin, S.; Zhang, R.; Yang, L.; Zhao, Q.; Zhang, L.; Yan, Q.; Jiang, N.; Tang, X. Insight into the formation of secondary inorganic aerosol based on high-time-resolution data during haze episodes and snowfall periods in Zhengzhou, China. Sci. Total Environ. 2019, 660, 47–56. [Google Scholar] [CrossRef]
  13. Ye, S.; Ma, T.; Duan, F.; Li, H.; He, K.; Xia, J.; Yang, S.; Zhu, L.; Ma, Y.; Huang, T.; et al. Characteristics and formation mechanisms of winter haze in Changzhou, a highly polluted industrial city in the Yangtze River Delta, China. Environ. Pollut. 2019, 253, 377–383. [Google Scholar] [CrossRef]
  14. Wang, Y.; Zhuang, G.; Zhang, X.; Huang, K.; Xu, C.; Tang, A.; Chen, J.; An, Z. The ion chemistry, seasonal cycle, and sources of PM2.5 and TSP aerosol in Shanghai. Atmos. Environ. 2006, 40, 2935–2952. [Google Scholar] [CrossRef]
  15. Tan, J.-H.; Duan, J.-C.; Chen, D.-H.; Wang, X.-H.; Guo, S.-J.; Bi, X.-H.; Sheng, G.-Y.; He, K.-B.; Fu, J.-M. Chemical characteristics of haze during summer and winter in Guangzhou. Atmos. Res. 2009, 94, 238–245. [Google Scholar] [CrossRef]
  16. Yang, Y.; Zhou, R.; Yu, Y.; Yan, Y.; Liu, Y.; Di, Y.; Wu, D.; Zhang, W. Size-resolved aerosol water-soluble ions at a regional background station of Beijing, Tianjin, and Hebei, North China. J. Environ. Sci. 2017, 55, 146–156. [Google Scholar] [CrossRef]
  17. Zhao, P.S.; Dong, F.; He, D.; Zhao, X.J.; Zhang, X.L.; Zhang, W.Z.; Yao, Q.; Liu, H.Y. Characteristics of concentrations and chemical compositions for PM2.5 in the region of Beijing, Tianjin, and Hebei, China. Atmos. Chem. Phys. 2013, 13, 4631–4644. [Google Scholar] [CrossRef] [Green Version]
  18. Meng, C.; Wang, L.; Zhang, F.; Wei, Z.; Ma, S.; Ma, X.; Yang, J. Characteristics of concentrations and water-soluble inorganic ions in PM2.5 in Handan City, Hebei province, China. Atmos. Res. 2016, 171, 133–146. [Google Scholar] [CrossRef]
  19. Zhou, H.; Lü, C.; He, J.; Gao, M.; Zhao, B.; Ren, L.; Zhang, L.; Fan, Q.; Liu, T.; He, Z.; et al. Stoichiometry of water-soluble ions in PM2.5: Application in source apportionment for a typical industrial city in semi-arid region, Northwest China. Atmos. Res. 2018, 204, 149–160. [Google Scholar] [CrossRef]
  20. Tao, J.; Zhang, L.; Cao, J.; Zhong, L.; Chen, D.; Yang, Y.; Chen, D.; Chen, L.; Zhang, Z.; Wu, Y.; et al. Source apportionment of PM2.5 at urban and suburban areas of the Pearl River Delta region, south China-With emphasis on ship emissions. Sci. Total Environ. 2016, 574, 1559–1570. [Google Scholar] [CrossRef]
  21. Zhou, J.; Xing, Z.; Deng, J.; Du, K. Characterizing and sourcing ambient PM2.5 over key emission regions in China I: Water-soluble ions and carbonaceous fractions. Atmos. Environ. 2016, 135, 20–30. [Google Scholar] [CrossRef]
  22. Zhao, J.; Zhang, F.; Xu, Y.; Chen, J. Characterization of water-soluble inorganic ions in size-segregated aerosols in coastal city, Xiamen. Atmos. Res. 2011, 99, 546–562. [Google Scholar] [CrossRef]
  23. Xu, L.; Chen, X.; Chen, J.; Zhang, F.; He, C.; Zhao, J.; Yin, L. Seasonal variations and chemical compositions of PM2.5 aerosol in the urban area of Fuzhou, China. Atmos. Res. 2012, 104–105, 264–272. [Google Scholar] [CrossRef]
  24. Tao, J.; Zhang, L.; Cao, J.; Zhang, R. A review of current knowledge concerning PM2.5 chemical composition, aerosol optical properties and their relationships across China. Atmos. Chem. Phys. 2017, 17, 9485–9518. [Google Scholar] [CrossRef] [Green Version]
  25. Li, M.; Liu, H.; Geng, G.; Hong, C.; Liu, F.; Song, Y.; Tong, D.; Zheng, B.; Cui, H.; Man, H.; et al. Anthropogenic emission inventories in China: A review. Natl. Sci. Rev. 2017, 4, 834–866. [Google Scholar] [CrossRef]
  26. Zhang, Y.; Tang, A.; Wang, C.; Ma, X.; Li, Y.; Xu, W.; Xia, X.; Zheng, A.; Li, W.; Fang, Z.; et al. PM2.5 and water-soluble inorganic ion concentrations decreased faster in urban than rural areas in China. J. Environ. Sci. 2022, 122, 83–91. [Google Scholar] [CrossRef]
  27. Li, H.; Zhang, Q.; Zheng, B.; Chen, C.; Wu, N.; Guo, H.; Zhang, Y.; Zheng, Y.; Li, X.; He, K. Nitrate-driven urban haze pollution during summertime over the North China Plain. Atmos. Chem. Phys. 2018, 18, 5293–5306. [Google Scholar] [CrossRef] [Green Version]
  28. Xu, Q.; Wang, S.; Jiang, J.; Bhattarai, N.; Li, X.; Chang, X.; Qiu, X.; Zheng, M.; Hua, Y.; Hao, J. Nitrate dominates the chemical composition of PM2.5 during haze event in Beijing, China. Sci. Total Environ. 2019, 689, 1293–1303. [Google Scholar] [CrossRef]
  29. Fu, X.; Wang, T.; Gao, J.; Wang, P.; Liu, Y.; Wang, S.; Zhao, B.; Xue, L. Persistent Heavy Winter Nitrate Pollution Driven by Increased Photochemical Oxidants in Northern China. Environ. Sci. Technol. 2020, 54, 3881–3889. [Google Scholar] [CrossRef]
  30. Li, H.; Zhang, Q.; Zhang, Q.; Chen, C.; Wang, L.; Wei, Z.; Zhou, S.; Parworth, C.; Zheng, B.; Canonaco, F.; et al. Wintertime aerosol chemistry and haze evolution in an extremely polluted city of the North China Plain: Significant contribution from coal and biomass combustion. Atmos. Chem. Phys. 2017, 17, 4751–4768. [Google Scholar] [CrossRef]
  31. Xu, J.-S.; Xu, M.; Snape, C.; He, J.; Behera, S.N.; Xu, H.-H.; Ji, D.-S.; Wang, C.; Yu, H.; Xiao, H.; et al. Temporal and spatial variation in major ion chemistry and source identification of secondary inorganic aerosols in Northern Zhejiang Province, China. Chemosphere 2017, 179, 316–330. [Google Scholar] [CrossRef] [PubMed]
  32. Zheng, B.; Zhang, Q.; Zhang, Y.; He, K.B.; Wang, K.; Zheng, G.J.; Duan, F.K.; Ma, Y.L.; Kimoto, T. Heterogeneous chemistry: A mechanism missing in current models to explain secondary inorganic aerosol formation during the January 2013 haze episode in North China. Atmos. Chem. Phys. 2015, 15, 2031–2049. [Google Scholar] [CrossRef] [Green Version]
  33. Ming, L.; Jin, L.; Li, J.; Fu, P.; Yang, W.; Liu, D.; Zhang, G.; Wang, Z.; Li, X. PM2.5 in the Yangtze River Delta, China: Chemical compositions, seasonal variations, and regional pollution events. Environ. Pollut. 2017, 223, 200–212. [Google Scholar] [CrossRef] [PubMed]
  34. Chen, Y.; Xie, S. Temporal and spatial visibility trends in the Sichuan Basin, China, 1973 to 2010. Atmos. Res. 2012, 112, 25–34. [Google Scholar] [CrossRef]
  35. Zhang, L.; Huang, Y.; Liu, Y.; Yang, F.; Lan, G.; Fu, C.; Wang, J. Characteristics of Carbonaceous Species in PM2.5 in Wanzhou in the Hinterland of the Three Gorges Reservior of Northeast Chongqing, China. Atmosphere 2015, 6, 534–546. [Google Scholar] [CrossRef] [Green Version]
  36. Huang, Y.; Zhang, L.; Qiu, Y.; Chen, Y.; Shi, G.; Li, T.; Zhang, L.; Yang, F. Five-year Record of Black Carbon Concentrations in Urban Wanzhou, Sichuan Basin, China. Aerosol Air Qual. Res. 2020, 20, 1282–1293. [Google Scholar] [CrossRef]
  37. Qiao, B.; Chen, Y.; Tian, M.; Wang, H.; Yang, F.; Shi, G.; Zhang, L.; Peng, C.; Luo, Q.; Ding, S. Characterization of water soluble inorganic ions and their evolution processes during PM2.5 pollution episodes in a small city in southwest China. Sci. Total Environ. 2018, 650, 2605–2613. [Google Scholar] [CrossRef]
  38. Peng, C.; Tian, M.; Chen, Y.; Wang, H.; Zhang, L.; Shi, G.; Liu, Y.; Yang, F.; Zhai, C. Characteristics, Formation Mechanisms and Potential Transport Pathways of PM2.5 at a Rural Background Site in Chongqing, Southwest China. Aerosol Air Qual. Res. 2019, 19, 1980–1992. [Google Scholar] [CrossRef]
  39. Chen, Y.; Xie, S.-D.; Luo, B.; Zhai, C. Characteristics and Sources of Water-Soluble Ions in PM2.5 in the Sichuan Basin, China. Atmosphere 2019, 10, 78. [Google Scholar] [CrossRef] [Green Version]
  40. Guo, W.; Long, C.; Zhang, Z.; Zheng, N.; Xiao, H.; Xiao, H. Seasonal Control of Water-Soluble Inorganic Ions in PM2.5 from Nanning, a Subtropical Monsoon Climate City in Southwestern China. Atmosphere 2019, 11, 5. [Google Scholar] [CrossRef]
  41. Guo, W.; Zhang, Z.; Zheng, N.; Luo, L.; Xiao, H.; Xiao, H. Chemical characterization and source analysis of water-soluble inorganic ions in PM2.5 from a plateau city of Kunming at different seasons. Atmos. Res. 2019, 234, 104687. [Google Scholar] [CrossRef]
  42. Liu, K.; Ren, J. Seasonal characteristics of PM2.5 and its chemical species in the northern rural China. Atmos. Pollut. Res. 2020, 11, 1891–1901. [Google Scholar] [CrossRef]
  43. Ma, X.; Xiao, Z.; He, L.; Shi, Z.; Cao, Y.; Tian, Z.; Vu, T.; Liu, J. Chemical Composition and Source Apportionment of PM2.5 in Urban Areas of Xiangtan, Central South China. Int. J. Environ. Res. Public Health 2019, 16, 539. [Google Scholar] [CrossRef] [Green Version]
  44. Zhang, L.; Tian, M.; Peng, C.; Fu, C.; Li, T.; Chen, Y.; Qiu, Y.; Huang, Y.; Wang, H.; Li, Z.; et al. Nitrogen wet deposition in the Three Gorges Reservoir area: Characteristics, fluxes, and contributions to the aquatic environment. Sci. Total Environ. 2020, 738, 140309. [Google Scholar] [CrossRef]
  45. Pathak, R.K.; Louie, P.K.; Chan, C.K. Characteristics of aerosol acidity in Hong Kong. Atmos. Environ. 2004, 38, 2965–2974. [Google Scholar] [CrossRef]
  46. Liu, J.; Wu, D.; Fan, S.; Mao, X.; Chen, H. A one-year, on-line, multi-site observational study on water-soluble inorganic ions in PM2.5 over the Pearl River Delta region, China. Sci. Total Environ. 2017, 601–602, 1720–1732. [Google Scholar] [CrossRef]
  47. Li, X.; Wang, S.; Duan, L.; Hao, J.; Li, C.; Chen, Y.; Yang, L. Particulate and Trace Gas Emissions from Open Burning of Wheat Straw and Corn Stover in China. Environ. Sci. Technol. 2007, 41, 6052–6058. [Google Scholar] [CrossRef]
  48. Du, W.; Hong, Y.-W.; Xiao, H.; Zhang, Y.; Chen, Y.; Xu, L.; Chen, J.; Deng, J. Chemical Characterization and Source Apportionment of PM2.5 during Spring and Winter in the Yangtze River Delta, China. Aerosol Air Qual. Res. 2017, 17, 2165–2180. [Google Scholar] [CrossRef] [Green Version]
  49. Cheng, C.; Shi, M.; Liu, W.; Mao, Y.; Hu, J.; Tian, Q.; Chen, Z.; Hu, T.; Xing, X.; Qi, S. Characteristics and source apportionment of water-soluble inorganic ions in PM2.5 during a wintertime haze event in Huanggang, central China. Atmos. Pollut. Res. 2020, 12, 111–123. [Google Scholar] [CrossRef]
  50. Zhang, R.; Sun, X.; Shi, A.; Huang, Y.; Yan, J.; Nie, T.; Yan, X.; Li, X. Secondary inorganic aerosols formation during haze episodes at an urban site in Beijing, China. Atmos. Environ. 2018, 177, 275–282. [Google Scholar] [CrossRef]
  51. Kang, C.-M.; Lee, H.S.; Kang, B.-W.; Lee, S.-K.; Sunwoo, Y. Chemical characteristics of acidic gas pollutants and PM2.5 species during hazy episodes in Seoul, South Korea. Atmos. Environ. 2004, 38, 4749–4760. [Google Scholar] [CrossRef]
  52. Seinfeld, J.H. ES&T Books: Atmospheric Chemistry and Physics of Air Pollution. Environ. Sci. Technol. 1986, 20, 863. [Google Scholar] [CrossRef]
  53. Pathak, R.K.; Wu, W.S.; Wang, T. Summertime PM2.5 ionic species in four major cities of China: Nitrate formation in an ammonia-deficient atmosphere. Atmos. Chem. Phys. 2009, 9, 1711–1722. [Google Scholar] [CrossRef] [Green Version]
  54. Shen, Z.; Arimoto, R.; Cao, J.; Zhang, R.; Li, X.; Du, N.; Okuda, T.; Nakao, S.; Tanaka, S. Seasonal Variations and Evidence for the Effectiveness of Pollution Controls on Water-Soluble Inorganic Species in Total Suspended Particulates and Fine Particulate Matter from Xi’an, China. J. Air Waste Manag. Assoc. 2008, 58, 1560–1570. [Google Scholar] [CrossRef]
  55. Mukerjee, S.; Shadwick, D.S.; A Smith, L.; Somerville, M.C.; E Dean, K.; Bowser, J.J. Techniques to assess cross-border air pollution and application to a US-Mexico border region. Sci. Total Environ. 2001, 276, 205–224. [Google Scholar] [CrossRef]
  56. Jain, S.; Sharma, S.K.; Choudhary, N.; Masiwal, R.; Saxena, M.; Sharma, A.; Mandal, T.K.; Gupta, A.; Gupta, N.C.; Sharma, C. Chemical characteristics and source apportionment of PM2.5 using PCA/APCS, UNMIX, and PMF at an urban site of Delhi, India. Environ. Sci. Pollut. Res. 2017, 24, 14637–14656. [Google Scholar] [CrossRef]
  57. Liu, Z.; Xie, Y.; Hu, B.; Wen, T.; Xin, J.; Li, X.; Wang, Y. Size-resolved aerosol water-soluble ions during the summer and winter seasons in Beijing: Formation mechanisms of secondary inorganic aerosols. Chemosphere 2017, 183, 119–131. [Google Scholar] [CrossRef]
  58. Agarwal, A.; Satsangi, A.; Lakhani, A.; Kumari, K.M. Seasonal and spatial variability of secondary inorganic aerosols in PM2.5 at Agra: Source apportionment through receptor models. Chemosphere 2019, 242, 125132. [Google Scholar] [CrossRef]
  59. Saxena, M.; Sharma, A.; Sen, A.; Saxena, P.; Saraswati Mandal, T.; Sharma, S.; Sharma, C. Water soluble inorganic species of PM10 and PM2.5 at an urban site of Delhi, India: Seasonal variability and sources. Atmos. Res. 2017, 184, 112–125. [Google Scholar] [CrossRef]
  60. Wang, Y.Q.; Zhang, X.Y.; Draxler, R.R. TrajStat: GIS-based software that uses various trajectory statistical analysis methods to identify potential sources from long-term air pollution measurement data. Environ. Model. Softw. 2009, 24, 938–939. [Google Scholar] [CrossRef]
  61. Huang, Y.; Liu, Y.; Zhang, L.; Peng, C.; Yang, F. Characteristics of Carbonaceous Aerosol in PM2.5 at Wanzhou in the Southwest of China. Atmosphere 2018, 9, 37. [Google Scholar] [CrossRef]
Figure 1. Location of sampling site.
Atmosphere 13 01713 g001
Figure 2. Seasonal variations of PM2.5 and WSIIs.
Atmosphere 13 01713 g002
Figure 3. Plot of cations concentration vs. anions concentration in four seasons.
Atmosphere 13 01713 g003
Figure 4. Evolution characteristics of SO42− and NO3− (a,b) and their conversion rates (SOR and NOR) (c,d) with temperature and humidity.
Atmosphere 13 01713 g004
Figure 5. Correlations between [NH4+] and [SO42−].
Atmosphere 13 01713 g005
Figure 6. 72 h backward trajectories clusters in Wanzhou during the observation period.
Atmosphere 13 01713 g006
Figure 7. The time series of daily meteorological parameters, gaseous precursors, PM2.5, and WSIIs concentrations from 27 December 2016 to 7 January 2017.
Atmosphere 13 01713 g007
Table 1. Meteorological data and air pollutant concentrations during the sampling period.
SeasonT/(°C)RH/(%)WS/(m·s−1)Radiation/
(W·m−2)
NH3/(μg·m−3)NO2/(μg·m−3)SO2/(μg·m−3)
Spring20.6176.620.95151.1818.8644.388.55
Summer30.0368.281.01226.8214.5723.6012.40
Fall17.4183.300.7365.8711.9831.6313.23
Winter10.4176.900.7436.9711.6542.2715.67
Annual19.6976.270.86120.8914.4938.3712.49
T, temperature; WS, wind speed; RH, relative humidity.
Table 2. Comparison of water-soluble inorganic ion (WSII) concentrations (μg·m−3) in Wanzhou to other cities in China.
CitySampling TimeNa+NH4+K+Mg2+Ca2+ClSO42−NO3WSIIsPM2.5Reference
Wanzhou2016.04–2017.011.483.660.380.100.480.667.534.0518.3433.16This study
Fuling, Chongqing2015.04–2016.01 6.800.57 1.0013.706.7028.7766.90[37]
Yubei, Chongqing2015.12–2016.030.286.561.170.350.281.3517.510.938.467.54[5]
Beibei, Chongqing2017.09–2018.080.224.870.870.071.510.909.817.3625.6143.02[7]
Jin Yun mountain,
Chongqing
2014.10–2015.07 5.50.48 12.25.624.856.2[38]
Chengdu2012–20130.459.01.230.070.442.4617.711.943.086.7[39]
Neijiang0.218.21.170.060.320.6917.67.835.478.6
Nanning2017.09–2018.080.193.230.610.082.310.449.143.0819.0837.02[40]
Handan20130.7131.80.114.425.220.666.80131[18]
Kunming2017.09–2018.080.132.530.440.092.490.516.842.3715.4030.27[41]
Taiyuan2015.08–2016.050.512.71.30.82.63.419.113.153.2109.6[42]
Xiangtan2016.04–2017.01 5.6 2.814.49.640.973.6[43]
Table 3. Regression analysis between calculated values and measured values of NH4+a.
SeasonIn the Form of (NH4)2SO4In the Form of NH4HSO4
Linear Regression EquationR2pLinear Regression EquationR2p
Springy = 0.99x − 0.540.98<0.01y = 1.57x − 0.520.98<0.01
Summery = 1.04x − 0.740.97y = 1.74x − 0.710.93
Fally = 0.93x − 0.390.99y = 1.48x − 0.420.98
Wintery = 1.21x − 1.020.99y = 1.83x − 1.380.99
x represents NH4+ measured value (μg· m−3); y represents NH4+ calculated value (μg· m−3).
Table 4. Results of principal component analysis.
PCA Source Loadings
PC1PC2PC3
Na+0.130.87−0.05
NH4+0.96−0.040.16
K+0.980.070.02
Mg2+0.330.70−0.52
Ca2+−0.210.860.03
Cl0.950.01−0.06
NO30.89−0.030.29
SO42−0.96−0.010.03
NH30.19−0.080.93
NO20.56−0.440.27
SO20.650.12−0.34
Variance49.53%23.16%9.68%
Cumulative49.53%72.69%82.37%
Publisher’s Note: MDPI stays neutral with regard to jurisdictional claims in published maps and institutional affiliations.

