Article

Climatic Relationship of Vegetation in Forest Stands in the Mediterranean Vegetation Belt of the Eastern Adriatic

1
Faculty of Forestry and Wood Technology, University of Zagreb, 10000 Zagreb, Croatia
2
Energy Institute Hrvoje Požar, 10000 Zagreb, Croatia
*
Author to whom correspondence should be addressed.
Atmosphere 2022, 13(10), 1709; https://doi.org/10.3390/atmos13101709
Submission received: 29 August 2022 / Revised: 7 October 2022 / Accepted: 13 October 2022 / Published: 18 October 2022
(This article belongs to the Special Issue Vegetation and Climate Relationships)

Abstract

:
The Mediterranean vegetation belt on the eastern Adriatic covers an area of nearly 15,000 km2. It is comprised of forest stands that can be divided into three vegetation zones based on the presence of certain plant species within each: sub-Mediterranean, eu-Mediterranean, and steno-Mediterranean. The dominant ecological factors result in the domination of specific tree species within the floral composition between these vegetation zones. The aim of this study was to collect climate data from 38 weather stations over a 30-year period to compare climate data and bioclimate properties in the area of these three vegetation zones. The results confirmed statistically significant differences between the main climatic elements and most bioclimatic indices between the vegetation zones. Cooler and more humid conditions were found in the sub-Mediterranean zone, warmer and somewhat drier conditions in the eu-Mediterranean zone, and particularly pronounced warm and dry conditions in the steno-Mediterranean zone. However, the analysis of the main components for researching climate parameters showed that the mean annual air temperature, average minimum air temperature of the coldest month of the year and continentality index, length of the dry season, and de Martonne aridity index contribute the most to the grouping of vegetation in forest stands in the Mediterranean vegetation belt of the eastern Adriatic.

1. Introduction

The Mediterranean region, situated between Europe, Asia, and Africa, is one of the world’s largest centres of biological diversity [1]. According to Hure et al. [2], the Adriatic Sea is an elongated and relatively shallow sea, and it stretches in the southeast direction for 800 km2 from the highest Mediterranean latitude (45°47′ N). The eastern coast of the Adriatic Sea, though spatially small, is one of the most biologically diverse regions in the Mediterranean basin, and is considered a biodiversity hotspot [3,4]. For example, the total floral biodiversity in the Mediterranean basin is estimated at some 25,000 plant species [5], while over 10% of this (2797 species) is contained within the wealth of flora of the Mediterranean part of the eastern Adriatic coast [6]. The presence of vegetation in a given area is the result of interrelations between climate, geological substrate, and soil. The Mediterranean climate is characterised by mild and rainy winters, and warm and dry summers [7,8], which in addition to the presence of extended dry periods significantly characterises the Mediterranean climate [9].
The relationship between climate and vegetation determines the interrelations of climatic elements and the distribution range of plant species, plant communities, and entire ecosystems [10]. This is the focus of bioclimatology, as one of the geobotanical sciences. The fundamental climatic elements are expressed in the form of climate indices and are considered useful in describing the relations between the climate and vegetation of a given area [11]. To date, several studies in the Mediterranean have been conducted to examine the relationships between climate and vegetation with the mapping of climate regions [8,12,13,14,15,16]. However, studies of this kind are lacking for the eastern Adriatic coast.
The eastern Adriatic coast is characterised as a region with a strong reaction to climate change, drying, and negative precipitation trends [17,18] and an increase in the number of dry days and consecutive dry days [17,19]. Declining precipitation for the western and eastern Mediterranean regions was reported by Giorgi and Lionello [20]. According to Penzar et al. [21], the eastern Adriatic coast has a moderately warm, rainy climate with hot summers. They also stated that there are parts of the coast with pronounced dry periods (Dalmatian coast with islands north to Lošinj), with shorter dry periods (western part of Istria, part of the northern Adriatic islands, and the narrow coastal belt under Mt. Velebit), and without pronounced dry periods (northern Adriatic coast and the Dalmatian inland).
Along the eastern Adriatic coast, the interrelation of environmental factors led to the development of diverse plant communities, characterised by a high species richness and high variability of the climatic conditions in which they develop. Trees represent 20% of the biological diversity of the vascular flora, and as such are a key factor that determines biosphere function [22]. Considering the geographic differentiation of forest vegetation in the Mediterranean-littoral vegetation belt along the eastern Adriatic coast, three vegetation zones can be horizontally distinguished [23,24]. These are the sub-Mediterranean vegetation zone, with stands of pubescent oak (Quercus pubescens Willd.) as the dominant forest tree species; the eu-Mediterranean vegetation zone, with stands of holm oak (Quercus ilex L.) as the dominant forest tree species; and the steno-Mediterranean vegetation zone, with Aleppo pine (Pinus halepensis Mill.) as the dominant species in forest stands. Climatologically, the sub-Mediterranean vegetation zone of the eastern Adriatic coast is characterised by a per-humid climate, with a mean minimum temperature in the coldest month of less than 2 °C and a mean annual precipitation of over 1200 mm. The climate of the eu-Mediterranean vegetation zone is humid, with a mean temperature minimum in the coldest month between 4 and 6 °C and a total annual precipitation of over 1000 mm. The steno-Mediterranean vegetation zone is marked by a sub-humid climate, with a mean minimum temperature in the coldest month of over 6 °C and mean annual precipitation of less than 1000 mm [23,24].
In addition to descriptions of the basic climate, data on precipitation and mean minimum temperatures in the coldest month was also reported by Trinajstić [23,24], while Seletković et al. [25] reported data on air temperature, precipitation, relative air humidity and wind, climate classification of the Croatian Mediterranean region according to Köppen, and the bioclimatic position of vegetation zones based on pluviothermic quotients and mean minimum temperature in the coldest month. Šegota & Filipčić [26], and later Penzar et al. [21] gave very detailed descriptions of the climate and weather along the Croatian Adriatic coast, but not in relation to the forest vegetation, and without reference to an analysis of climate indices. The division of the eastern Adriatic coast into three vegetation zones was made on the basis of the plant communities present and their plant species composition [23]. However, to date, there has been no detailed bioclimatic analyses or comparisons of bioclimatic parameters that describe the relationships between climate and vegetation between the vegetation zones.
The aims of this study were to: (i) analyse and compare the climatic elements, indices and bioclimatic properties of forest stands in the Mediterranean vegetation belt of the eastern Adriatic coast, (ii) establish whether there is a clear differentiation of the existing vegetation zones according to the bioclimatic parameters. Analysing the most commonly used bioclimatic indices with the existing vegetation zones is important to explain the relationship between climate parameters and the presence and success of forest vegetation in the Mediterranean vegetation belt of the eastern Adriatic. This gives a better description of the relationship between climate and vegetation through the bioclimatic properties of the vegetation zones, which in turn contribute to the protection and conservation of these areas.

2. Materials and Methods
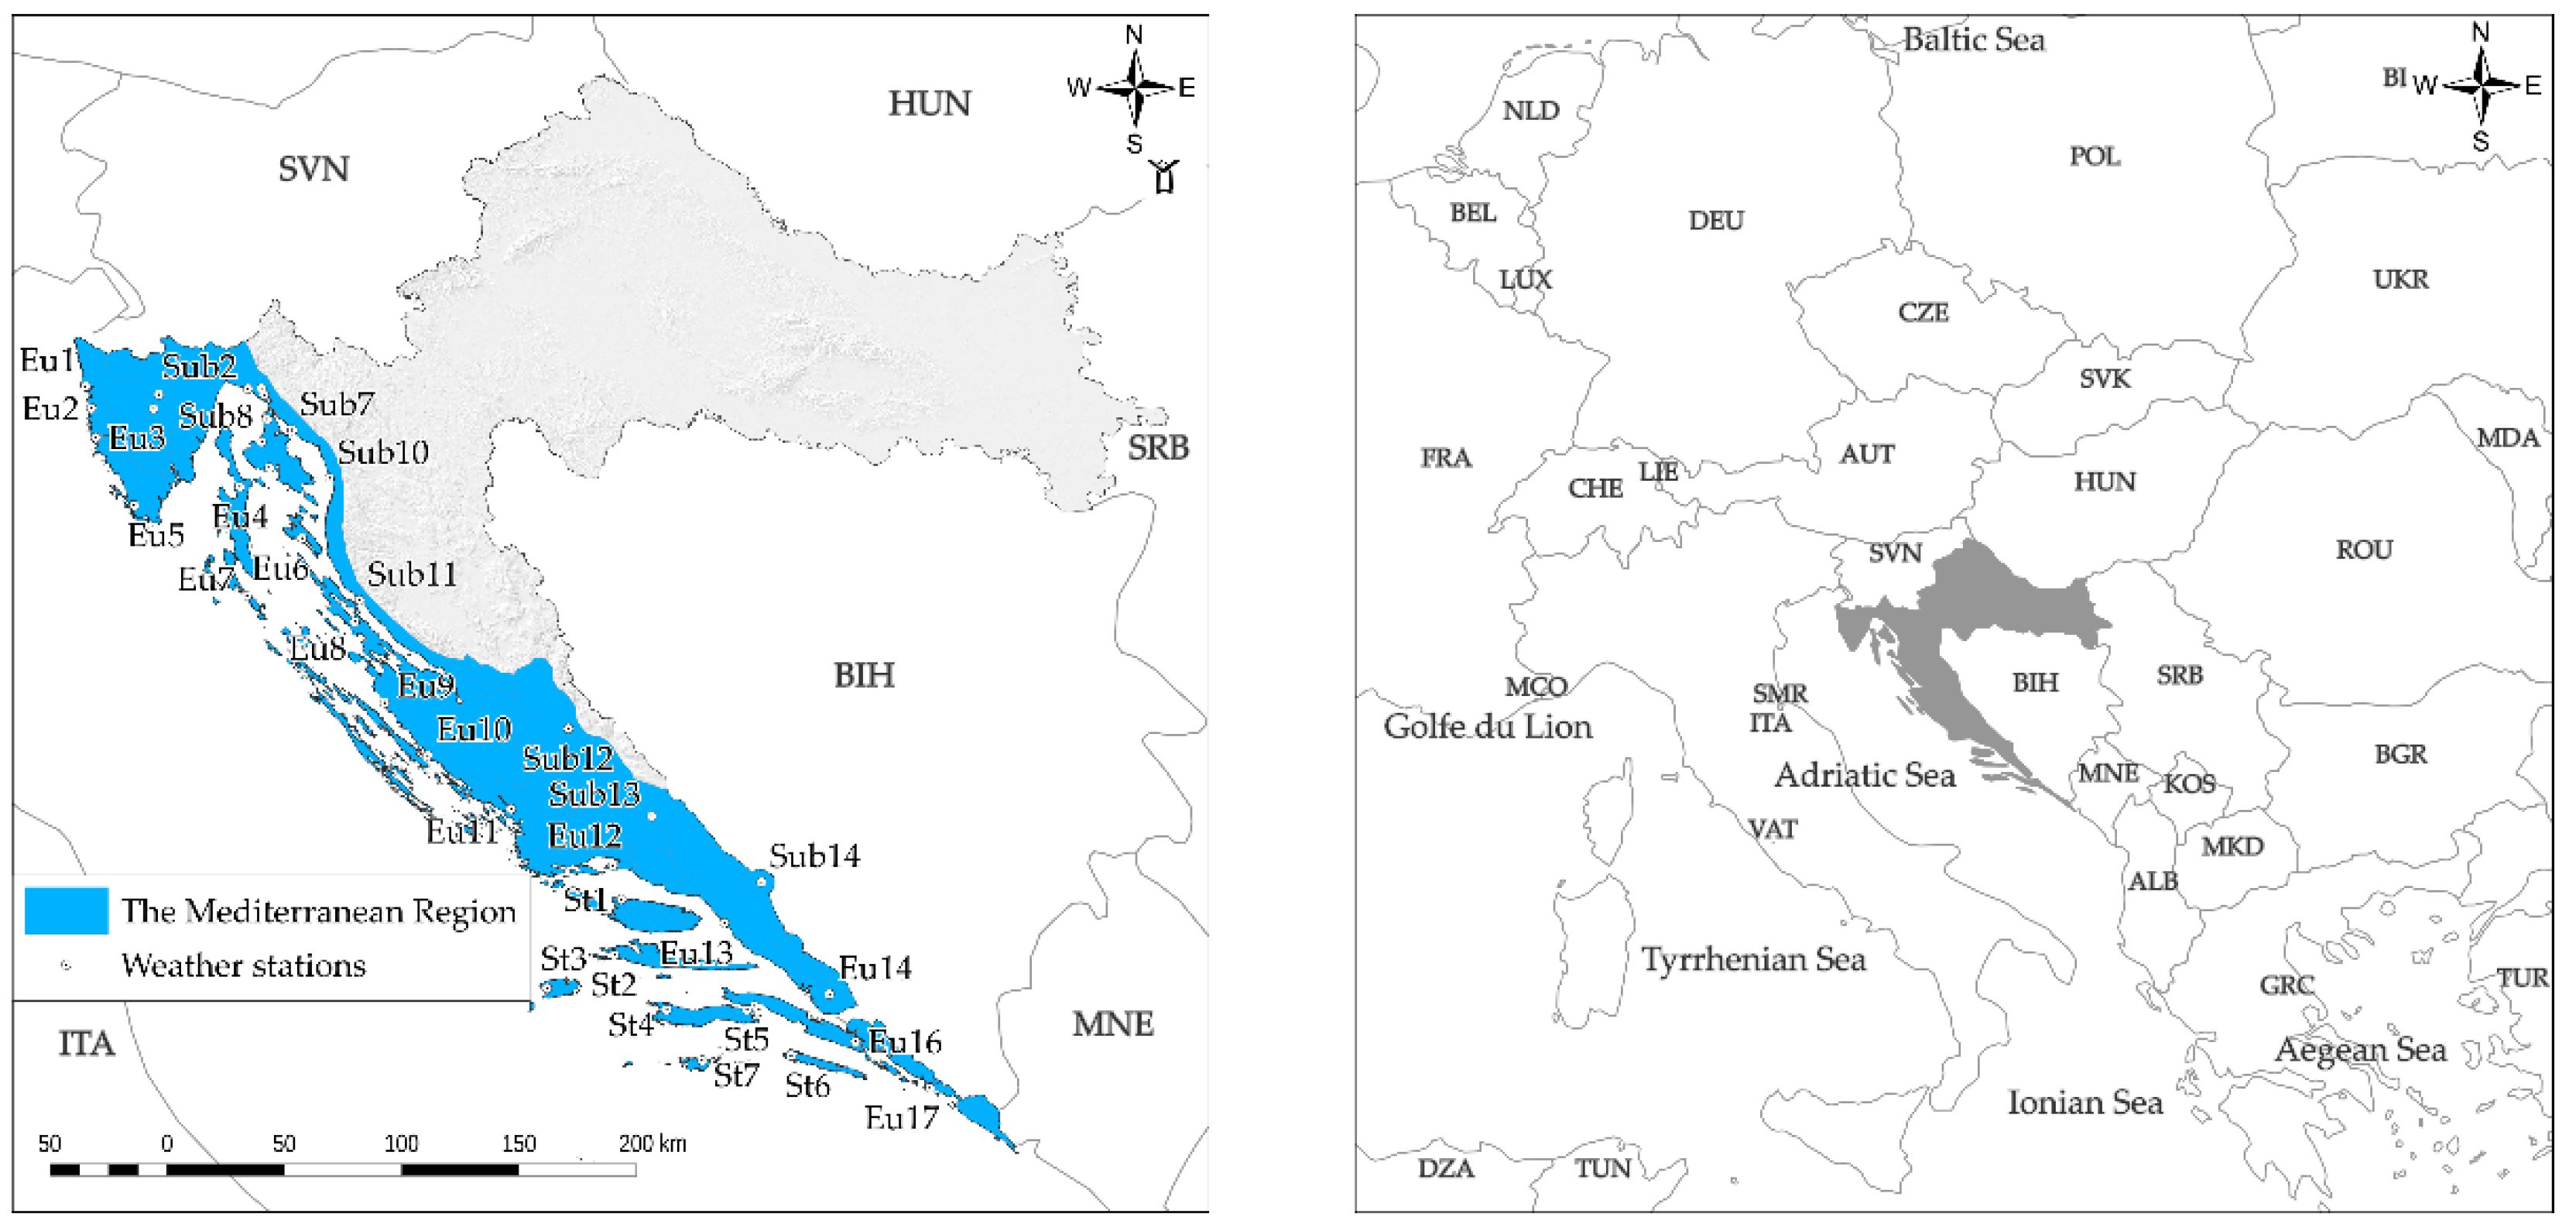
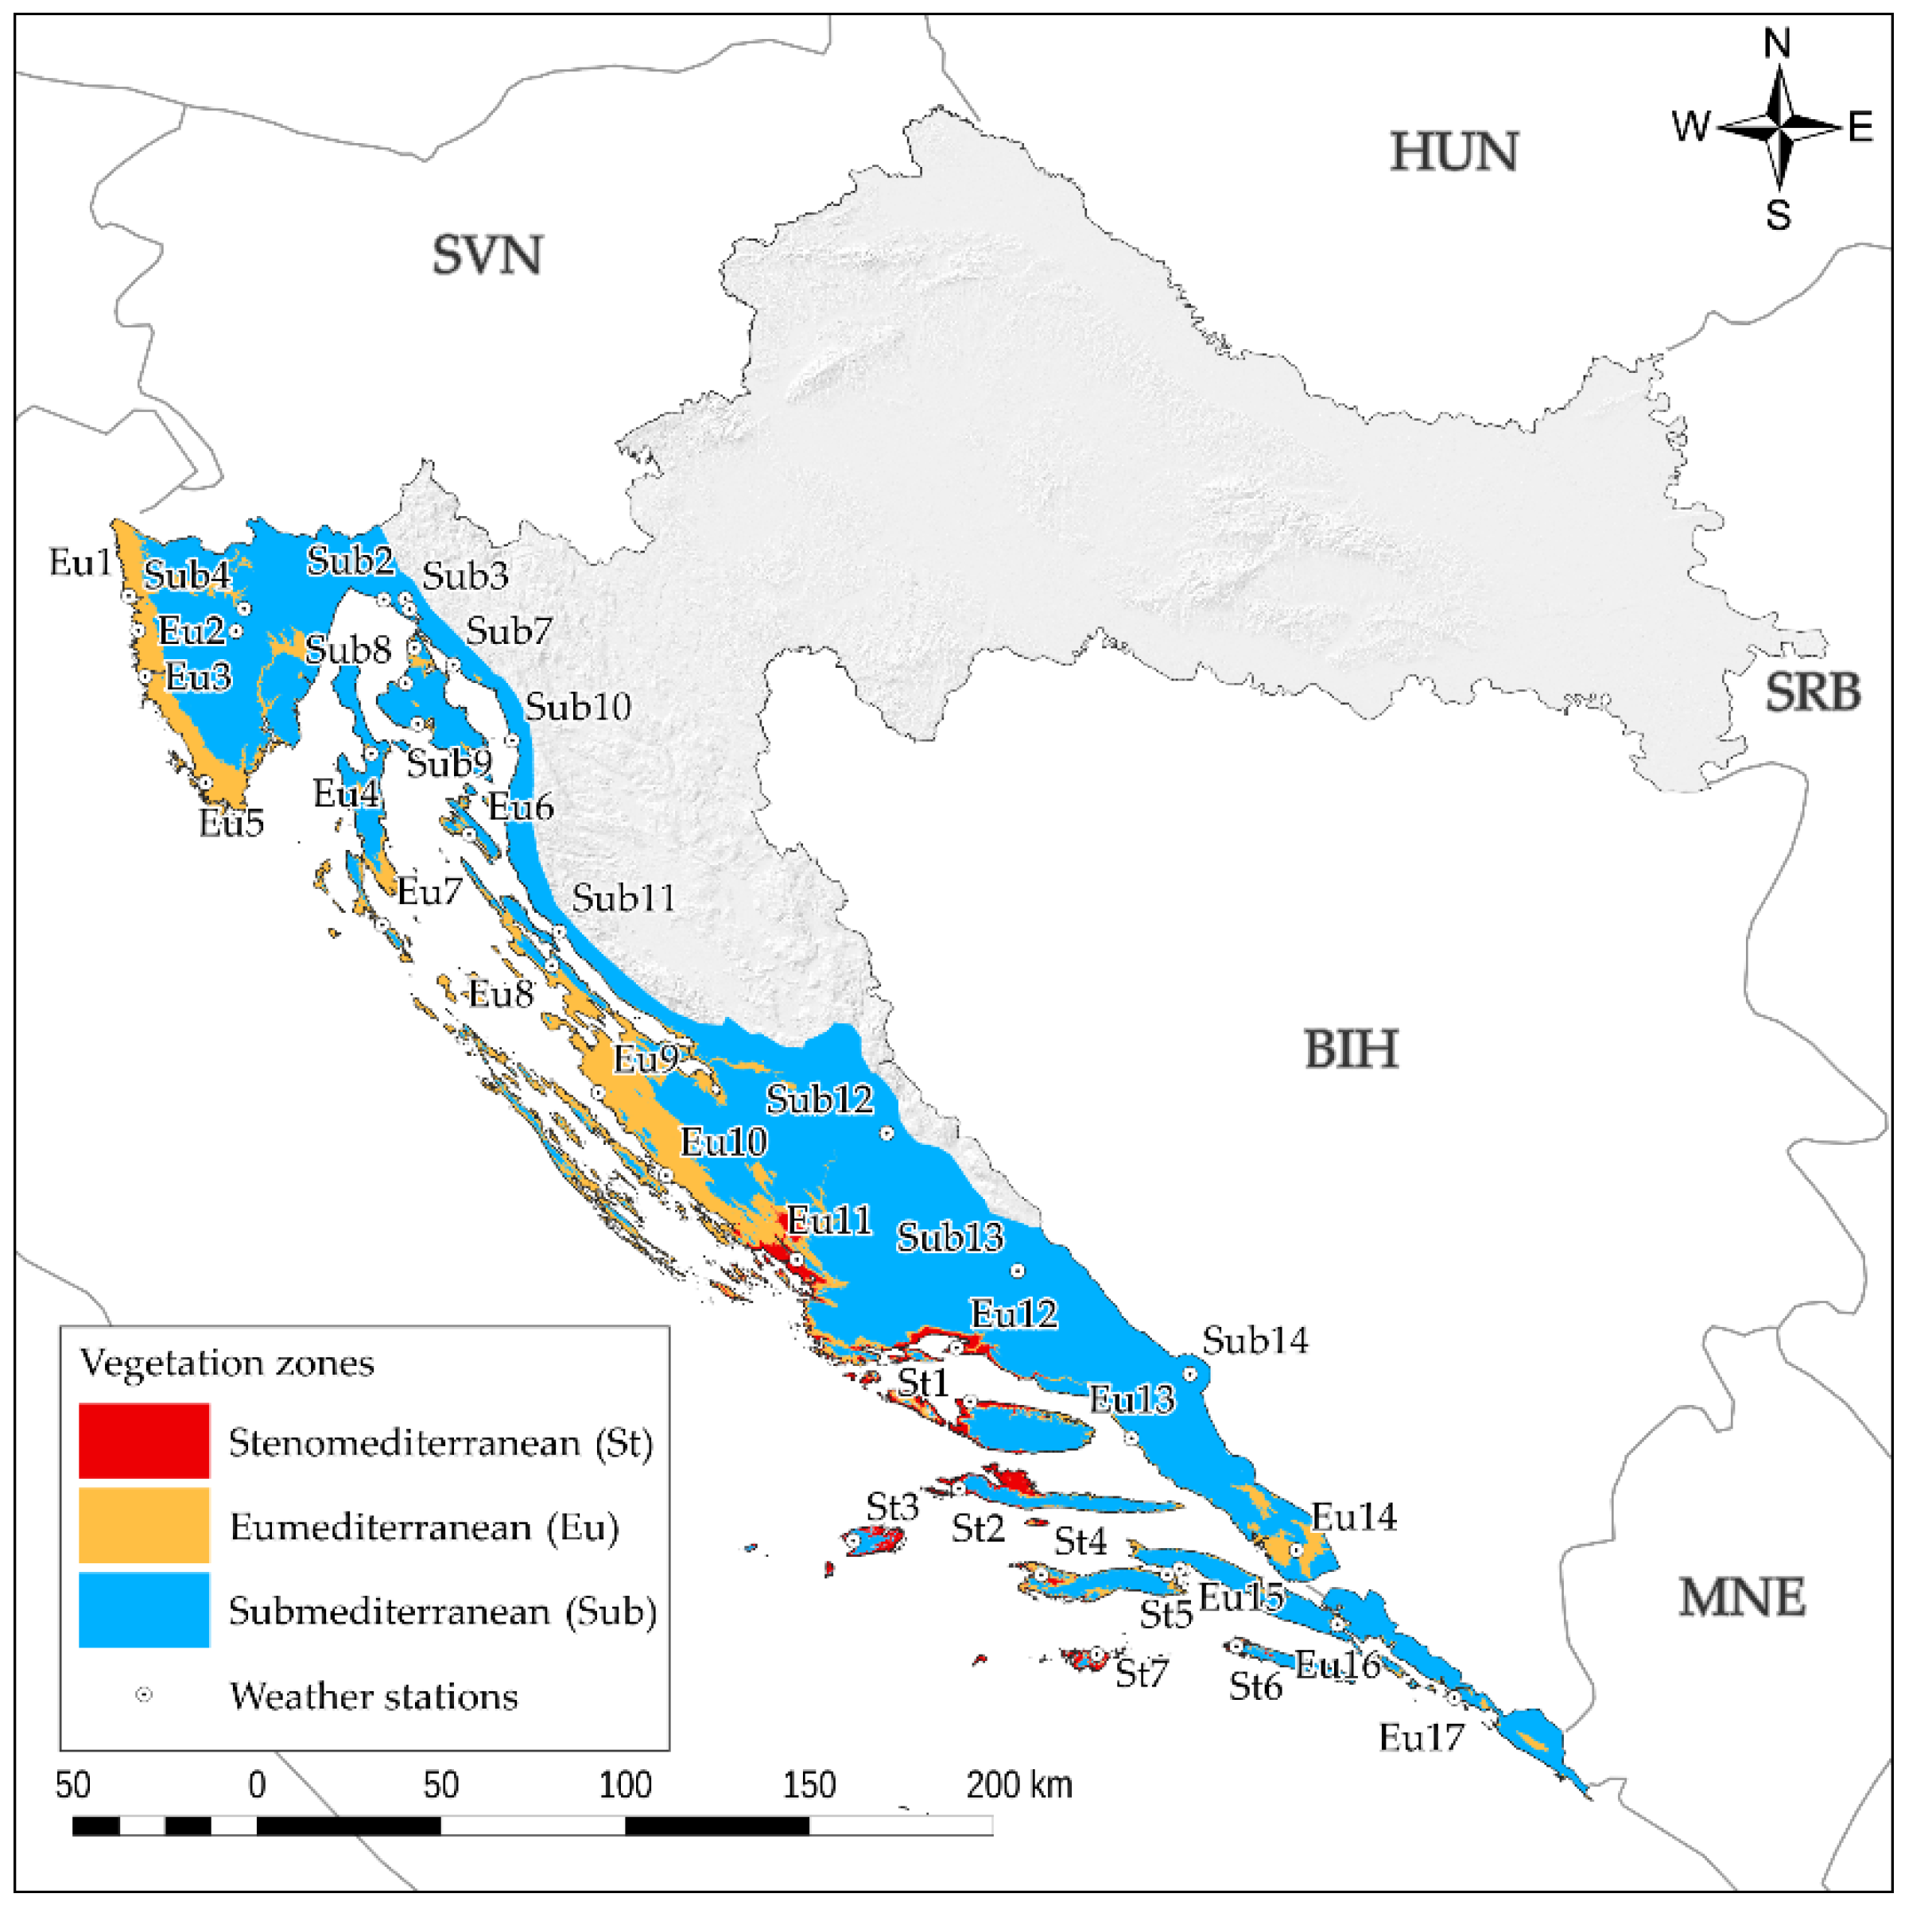
2.1. Study Area

This study encompasses the Mediterranean vegetation belt along the eastern Adriatic coast in the Republic of Croatia (Figure 1), covering an area of 15,389 km2 [27]. In the vertical range, the Mediterranean vegetation belt covers an area up to an elevation of 250 m in the northern part, and up to 600 m in the southern part. A detailed description of the spatial distribution of the Mediterranean vegetation belt, with sub-Mediterranean, eu-Mediterranean and steno-Mediterranean vegetation zones, was performed by Trinajstić [23,24]. The limits of the Mediterranean region and different vegetation zones in the Republic of Croatia are taken from the Bioportal–geoportal of the Croatian Nature Protection Information system [28].
In the sub-Mediterranean vegetation zone along the eastern Adriatic coast, pubescent oak is the dominant tree species in two associations of the order Quercetalia pubescentis [29].
Forests and thickets of pubescent oak described within the association Ostryo-Carpinion orientalis are adjacent to the Mediterranean coniferous community from Istria to the Dubrovnik inland. In the northern Adriatic coastal zone, it is found at elevations up to 350 m and in the lower areas of the Dalmatian continental inland up to 600 m. In the lower, warmer part, pubescent oak is accompanied by Oriental hornbeam (Carpinus orientalis Mill.), in the boundary area towards holm oak forests the coniferous species of holm oak associations succeed, though rarely holm oak. Pubescent oak is often found in combination with other deciduous species, such as oriental hornbeam (Carpinus orientalis Mill.), nettle trees (Celtis spp.), manna ash (Fraxinus ornus L.) and hop hornbeam (Ostrya carpinifolia Scop.) [30].
The eu-Mediterranean vegetation zone in Croatia encompasses forest stands within two associations of the order Quercetalia ilicis [29]. Spatially, it includes the most significant and largest forest communities of the coastal vegetation belt, in the north from the western part of Istria, over part of the islands in Kvarner Bay to Zadar, and further south along a narrow coastal belt towards the far south, including the islands. The dominant species is holm oak, which in most of the southern part forms stands with coniferous species, while in the wetter parts of the Adriatic coast forms mixed stands with deciduous species. Holm oak is often found with other species such as olive (Olea europaea L.), carob (Ceratonia siliqua L.), strawberry tree (Arbutus unedo L.), mock privet (Phillyrea latifolia L.), Mediterranean buckthorn (Rhamus alaternus L.) and terebinth (Pistacia terebinthus L.) [31,32,33]. Holm oak forests also include laurel (Laurus nobilis L.), and tree heath (Erica arborea L.) [32,34].
The steno-Mediterranean vegetation zone includes the association Oleo-Ceratonion with Aleppo pine as the dominant species. This zone is found in the warmest part of the outermost southern and central Dalmatian islands. Aleppo pine is a xerophilic species that is highly resistant to drought, and thrives in the warmest parts of the Mediterranean where forest fires are common [35,36]. Other than occasional forest stands, degradation stages of macchia and garrigues are common, and depending on the level of degradation and the ecological factors within the Aleppo pine stands, holm oak can also be present.

2.2. Selection of Weather Stations

The study area includes a total of 38 weather stations (Table 1, Figure 1) found within the areas of the vegetation zones according to Trinajstić [23,24]. Fourteen stations were in the sub-Mediterranean, seventeen in the eu-Mediterranean and seven in the steno-Mediterranean zone. Data collected include air temperature (°C) and precipitation (mm) for a 30-year time period (from 1981 to 2010) of the Croatian Hydrological and Meteorological Service.

2.3. Bioclimatic Indices

In order to show the climate trends during the research period, 12 bioclimatic indices were calculated for use in this study (Table 2). These bioclimatic indices were calculated using the data on mean monthly air temperature and precipitation obtained from the weather stations. Most of the bioclimatic indices are used to calculate the relations of temperature and precipitation during the time period, indicating their robustness and comparability over longer time series [37].
Annual potential evapotranspiration (PET) is calculated as the sum of the monthly potential evapotranspiration (PETi) in mm according to Thornthwaite’s formula [38].
The dry season water deficit (DSWD) is expressed in mm, and is calculated as the difference in precipitation in the given month (Pi) and the potential evapotranspiration of the given month (PETi) [39].
Length of the dry season (LDS) is calculated according to the method of Gaussen [40] and UNESCO/FAO [41], and according to Blondel and Aronson [48] is considered one of the most useful methods for describing the Mediterranean bioclimates. According to this method, a month is “dry” when the amount of monthly precipitation (P) in mm is less than or equal to twice the amount of the average air temperature (T) in °C, or P ≤ 2T.
The Ombro-evapotranspiration index (Ioe) is calculated as the quotient of the mean annual precipitation (P) and the annual potential evapotranspiration (PET) for an area [42].
Lang’s rain factor (LRF) is calculated as the quotient of the mean annual precipitation (P) and mean annual temperature (T). Values lower than 30 indicate arid conditions [43].
The De Martonne index (DMI) is calculated by using the mean annual precipitation (P) and mean annual temperature (T), in which lower values indicate more arid conditions and higher values indicated more humid conditions [44].
The Continentality index (CONTINENTY) is the only bioclimatic index to use air temperature by subtracting the mean air temperature of the coldest month from the mean air temperature of the hottest month. The calculated values pertain to the annual values expressed in degrees Celsius, and the higher the difference, the higher the continentality level [42]. For the study area, the highest air temperatures were measured in August.
The Ellenberg Index (EQ) is calculated as the quotient of the mean air temperature of the hottest month (Tmax) in °C and annual precipitation (P) in mm [45].
The Ombrothermic Index (Io) is calculated at the annual level as the quotient of the yearly positive precipitation (in mm) which is the total average precipitation of those months whose average temperature is higher than 0 °C, and the yearly positive air temperature (in °C) which represents the sum of the monthly average temperature of those months whose average temperature is higher than 0 °C. In line with the obtained values, the area is classified according to the Ombric horizons [42] from Lower ultrahyperarid (those with the lowest values) to Ultrahyperhumid (those with the highest values).
The Ombrothermic index of the summer quarter (Iosq) is calculated as the quotient of the monthly precipitation and temperature for June, July and August [46].
The Thermicity Index (It) is calculated as the sum of the mean annual air temperature (T), average minimum air temperature of the coldest month of the year (m) and average maximum air temperature of the warmest month of the year (M) in °C [46].
Emberger [47] developed an approach to explain the distribution of species in the Mediterranean, on the basis of the minimum temperature in the coldest month (m) and the pluviothermic coefficient (Q2). According to Daget [13], this system is best for defining a Mediterranean climate, and the approach has been widely accepted [49].
All climate data were processed using the software package KlimaSoft 2.1. [50].

2.4. Statistical Analysis of Data

The statistical analysis of the bioclimatic index of different vegetation zones (descriptive statistics, one-way analysis of variance ANOVA, Kruskal–Wallis test and principal components analysis (PCA) were performed in the software package Statistica 13.4.0 [51]. For ANOVA, the post hoc Fisher LSD test was used, with a significant limit set at p < 0.05. The Shapiro–Wilk test was used to test the normality of data. Where Shapiro–Wilk and Leven’s test of homogeneity of variance were statistically significant (p < 0.05), data were then tested with the non-parametric Kruskal–Wallis test.
Spatial interpolation for bioclimatic indices within the researched area was performed using QGIS [52] and GRASS [53] software. For that purpose, inverse distance weighted (IDW) with nearest neighbour searching interpolation was used (GDAL/OGR). This algorithm computes the inverse distance to power gridding combined with the nearest neighbour method using default settings (Weighting power = 4; Smoothing = 0; The radius of the search circle = 1; Maximum number of data points to use = 12; Minimum number of data points to use = 0, Resolution = 100 m). IDW interpolation was used for generating spatial maps of those bioclimatic indices which do not depend on altitude (e.g., m, M, P, LDS and Q2). Additionally, in cases where a good correlation (R > 0.5) was present between altitude and bioclimatic indices (e.g., dM, LKF, T, PET, DSWD, C, Io), linear regression was used to create a spatial raster layers of bioclimatic indices using altitude as an independent variable. Average values of the derived regression model and IDW interpolation were then used for producing maps of the spatial distribution of these bioclimatic indices.
The spatial distribution of vegetation zones was obtained by logistic regression. We defined the vegetation zones for each meteorological station according to Trinajstić [23,24]. The dependent variable was vegetation zones, while the independent variables were altitude and climate elements (average annual air temperature and annual precipitation). Logistic regression equations and coefficients were obtained for each of the three zones. Spatial maps of zones were created based on the logistic regression and cut-off value (c = 0.5). However, the generated boundaries between zones are not in completely in line and they are spatially deviating. Due to those overlaps and/or gaps between zones, the centerline is created at an equal distance from two neighbour zones. This centerline represents the boundary between vegetation zones.
Prior to the principal component (PC) analysis, the correlations among all 16 bioclimatic variables for all weather stations were calculated to exclude the highly correlated ones (r > 0.85). Finally, the PC analysis was performed on eight bioclimatic variables and biplots with the first and second principal component (PC) and with the first and third principal components constructed showing the studied weather stations and bioclimatic variables (as vectors).

3. Results

3.1. Descriptive Statistics and Comparison of Climatic Elements with Bioclimatic Indices

The absolute minimum air temperature in the sub-Mediterranean vegetation zone was −11.4 °C, with an absolute maximum air temperature of 38.1 °C. In the eu-Mediterranean zone, the absolute air temperature variation ranged from the absolute minimum of −5.7 °C to the absolute maximum of 38.1 °C. The range of the absolute minimum and maximum air temperature in the steno-Mediterranean zone was from −4.7 °C to 37.5 °C.
Table 3 shows the descriptive statistics of the minimum and maximum values and comparison of mean values of the bioclimatic parameters and indices in the sub-Mediterranean, eu-Mediterranean and steno-Mediterranean vegetation zones.
Statistically significant differences were found among all three vegetation zones for the parameters mean annual air temperature (T), quantity of precipitation (P), dry season water deficit (DSWD), length of the dry season (LDS), ombro-evapotranspiration index (Ioe), Lang’s rain factor (LRF), de Martonne aridity index (DMI), continentality index (CONTINENTY), Ellenberg index (EQ), ombrothermic index (Io), and the ombrothermic index in the summer quarter (Iosq).
The mean annual air temperature (T) was statistically different (MS = 0.9912, df = 35.00, p = 0.038) and it ranged from 13.93 °C in the sub-Mediterranean up to 16.19 °C in the steno-Mediterranean. The mean minimum air temperature in the coldest month of the year (m) in the sub-Mediterranean zone was 6.09 °C and was significantly lower than the temperatures recorded in the eu-Mediterranean and steno-Mediterranean zones (H = 18.14, p < 0.001), of 0.69 °C and 12.50 °C, respectively. In terms of the values of the mean maximum air temperature in the warmest month of the year (M), there was no significant difference in the vegetation zones in the area of the Mediterranean vegetation belt (H = 1.22, p = 0.541).
The average annual precipitation (P) was also statistically significant (MS = 29551, df = 35.00, p = 0.009) between three vegetation zones with the lowest in the steno-Mediterranean which had 721.22 mm of rain, followed by 933.94 mm in the eu-Mediterranean, while the sub-Mediterranean had the 1233.41 mm.
The lowest amount of potential evapotranspiration (PET) was in the sub-Mediterranean zone with 801.76 mm, and this difference was significant (MS = 1588.7, df = 35.00, p < 0.001). The amount of potential evapotranspiration in the eu-Mediterranean (847.95 mm) and steno-Mediterranean (880.40 mm) did not differ significantly (MS = 1588.7, df = 35.00, p = 0.078).
There was no significant difference in the thermal index (It) between the sub- and eu-Mediterranean zones (MS = 3252.8, df = 35.00, p = 0.818), though these zones differed significantly from the highest index values obtained in the steno-Mediterranean zone (MS = 3252.8, df = 35.00, p = 0.045).
The Emberger pluviothermic quotient (Q2) was highest in the sub-Mediterranean zone and differed significantly from the two other zones (H = 18.21, p < 0.001), while the difference between the eu-Mediterranean and steno-Mediterranean zones was not significant (H = 18.21, p = 0.1258).

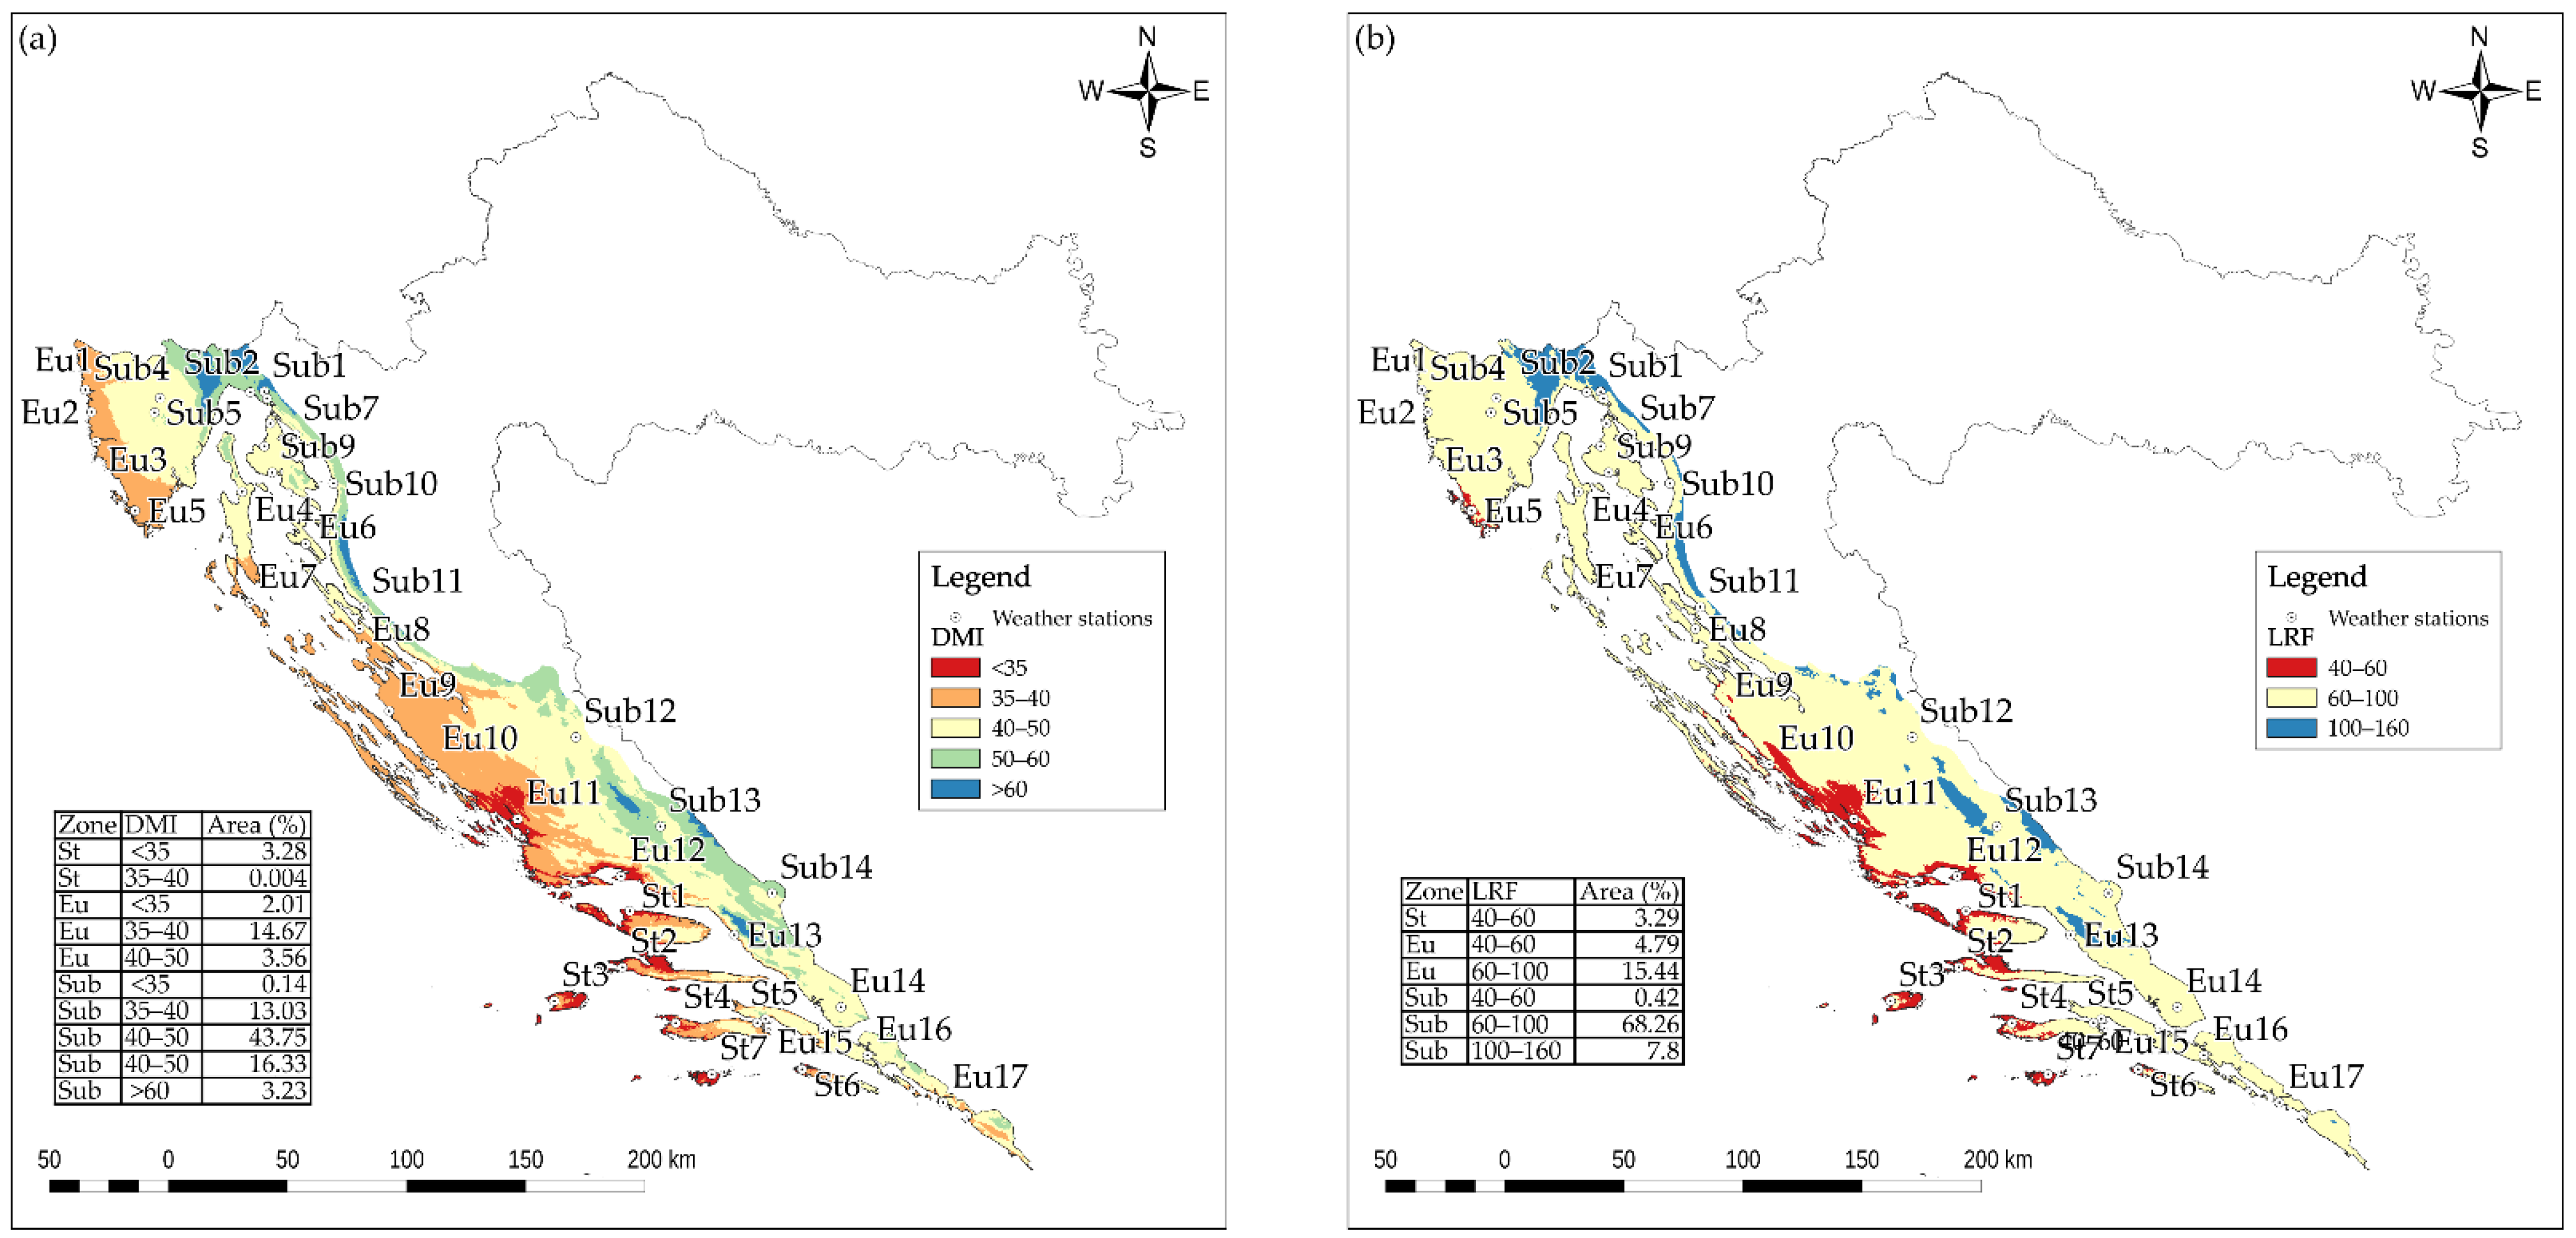
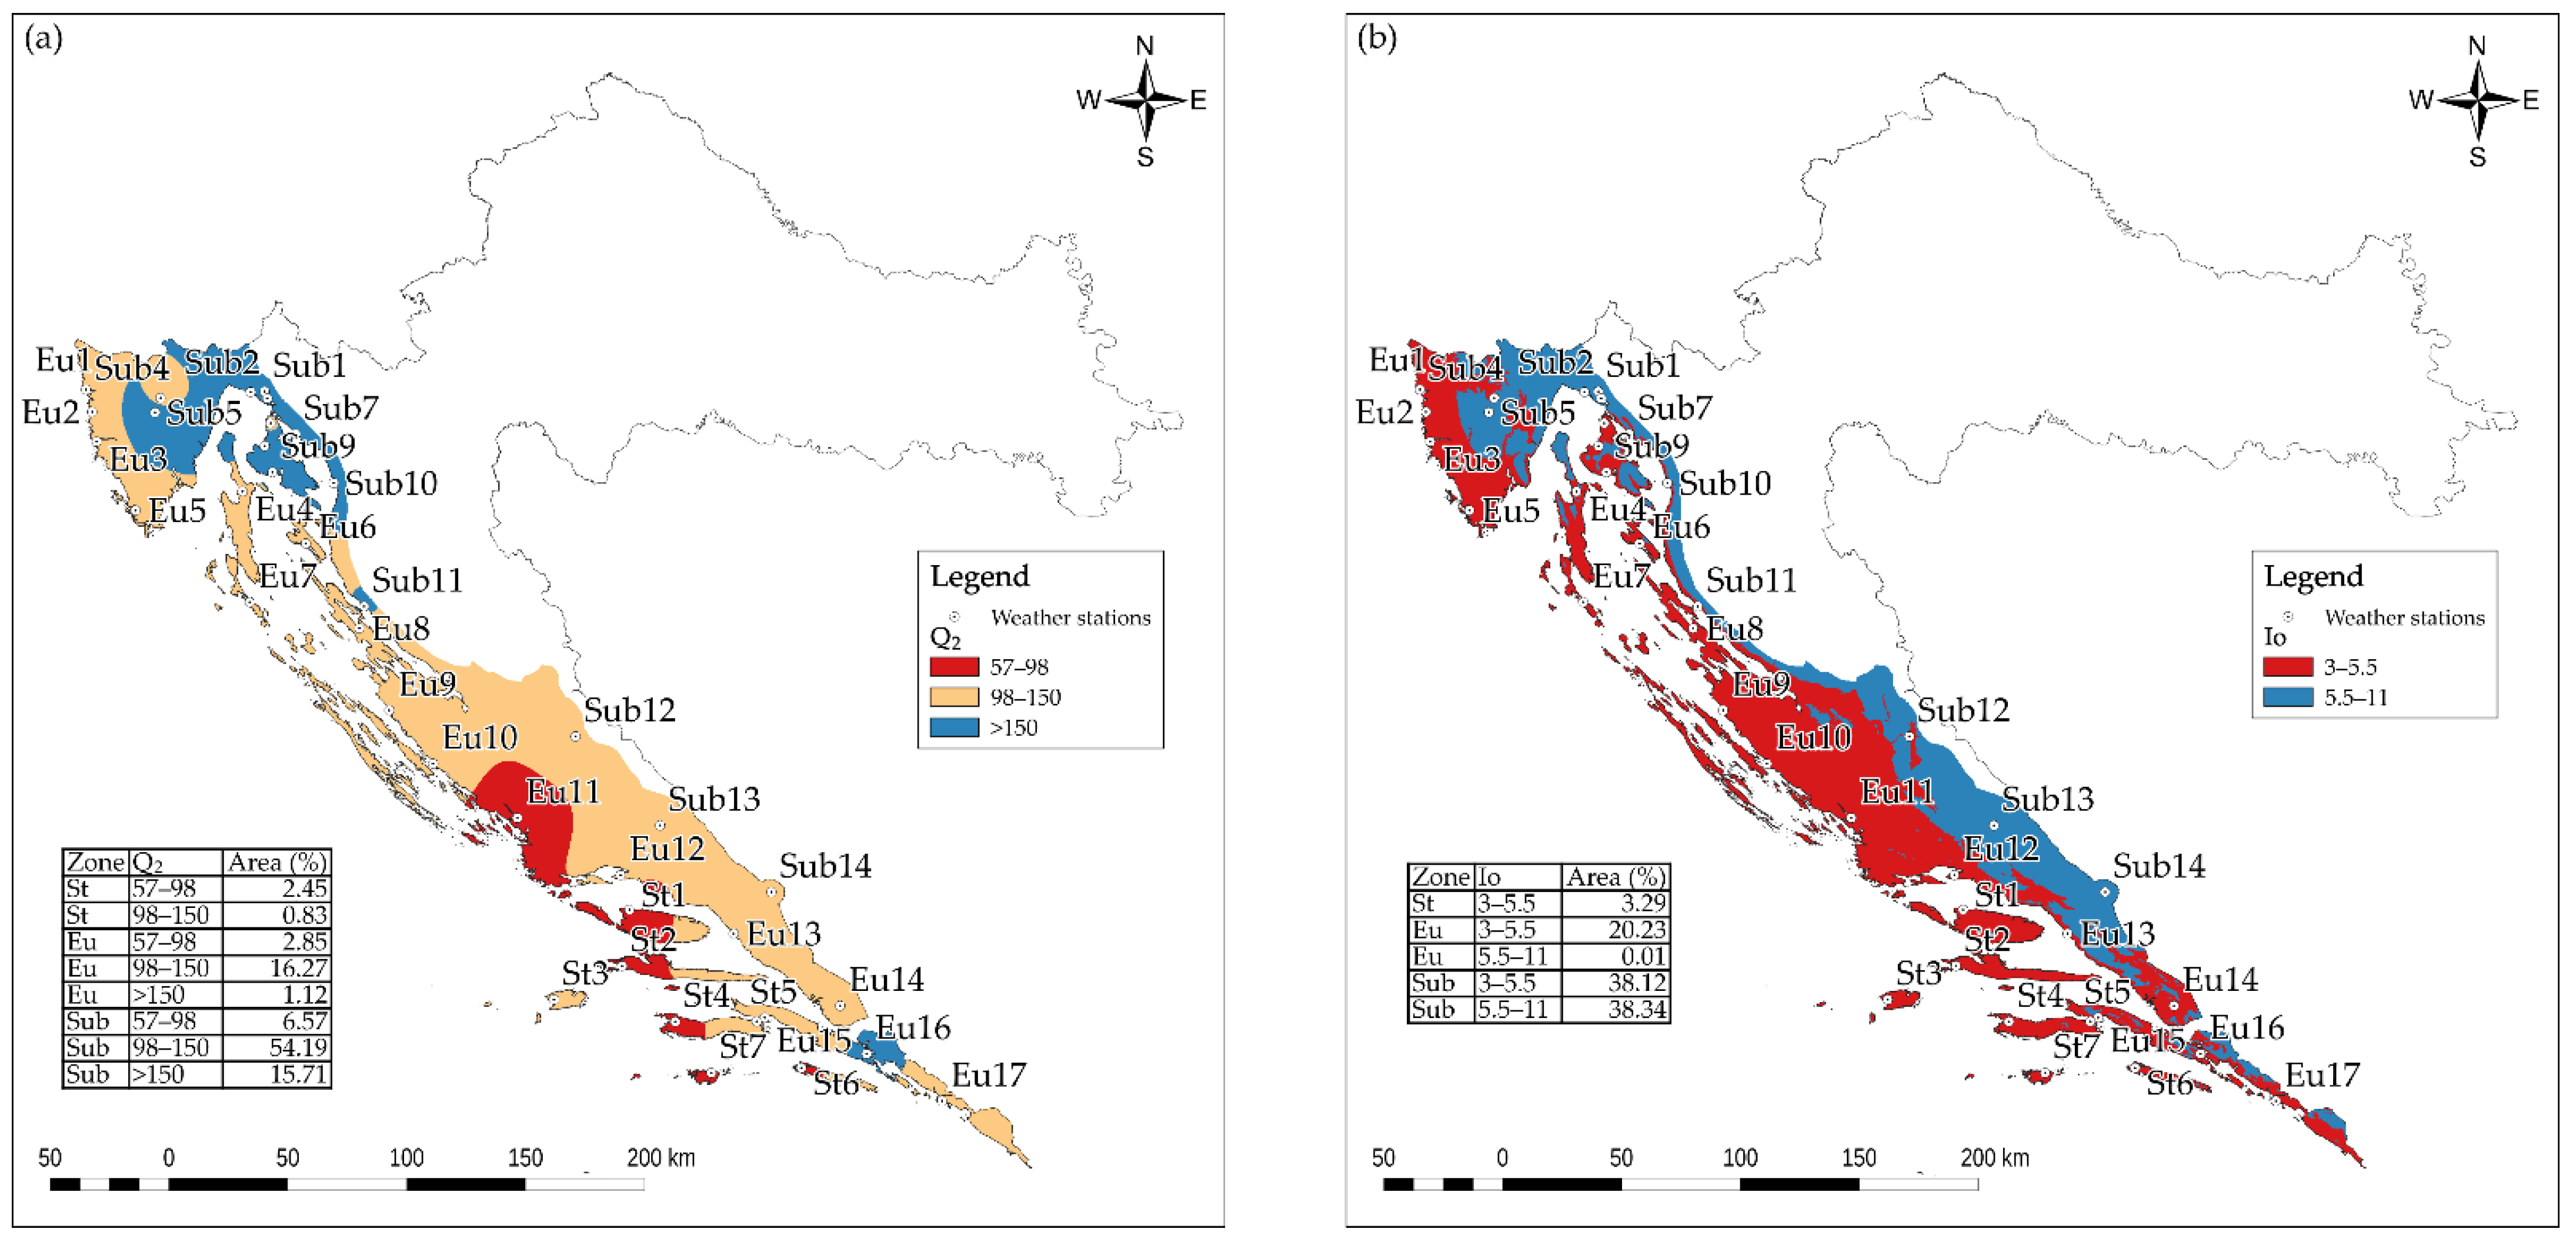
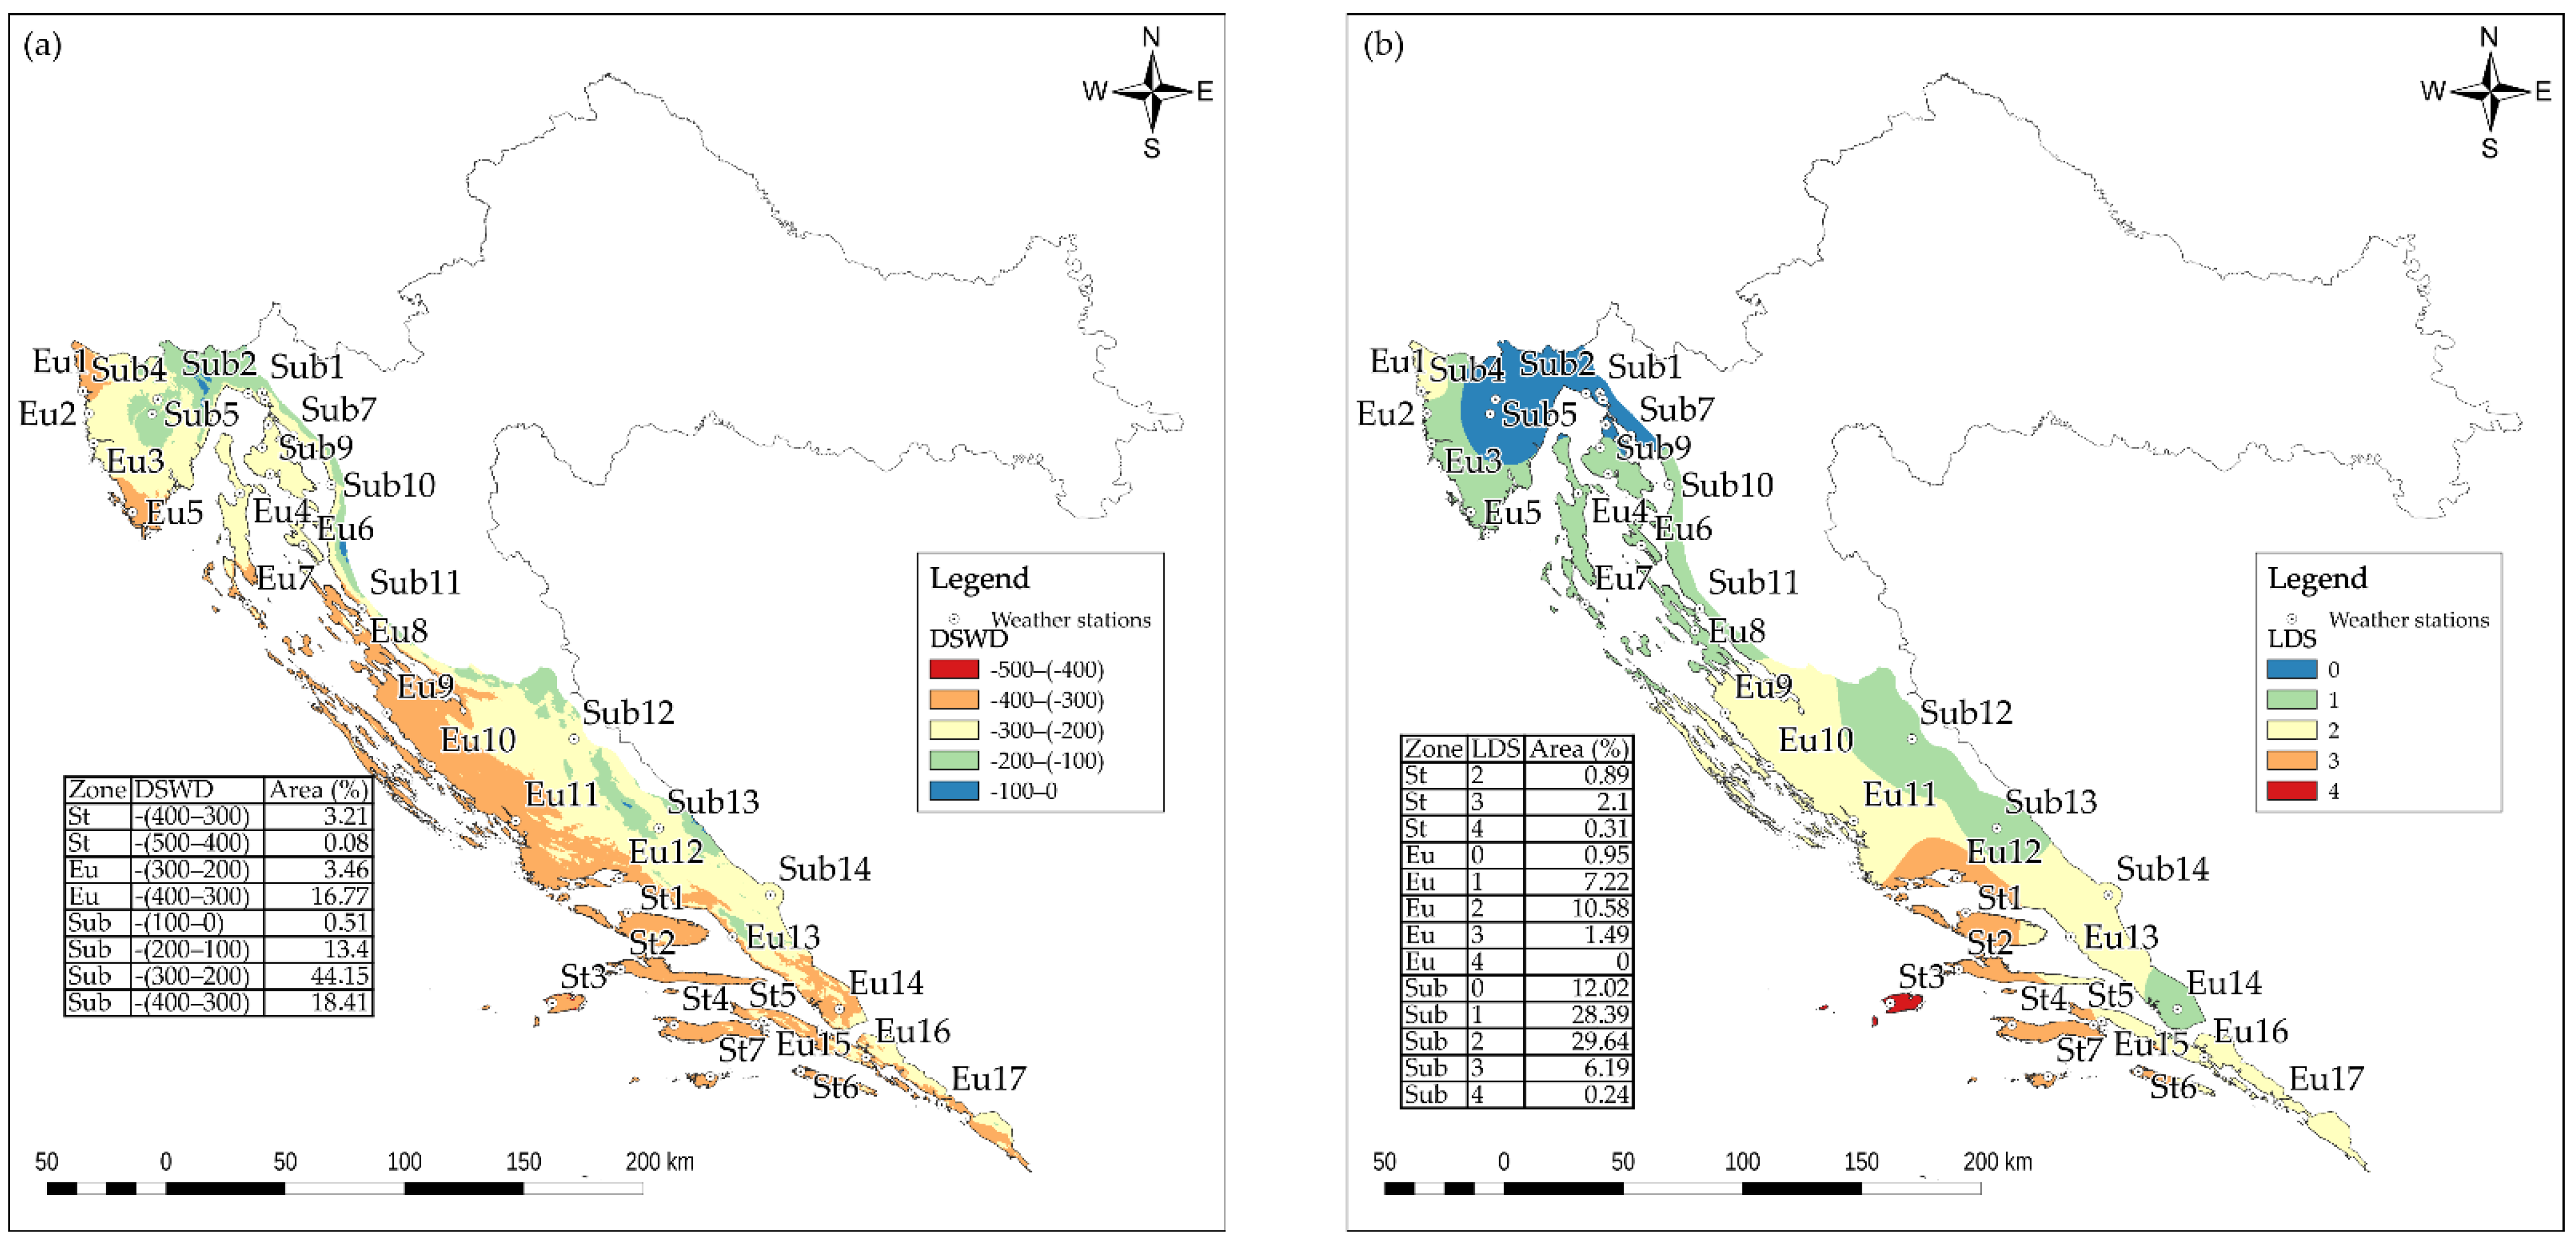
3.2. Spatial Overview of the Bioclimatic Indices

According to the results of logistic regression of spatial distribution (Figure 2, Supplementary Materials Table S1), the area of the Mediterranean region is 16,893.34 km2. Vegetation zones are not spatially separated from each other, that is, they overlap each other spatially. The largest part of the land surface is occupied by the sub-Mediterranean vegetation zone (76.5%), followed by the eu-Mediterranean vegetation zone (20.2%), and the smallest part by the steno-Mediterranean vegetation zone (3.3%).
Figure 3 shows the spatial distribution of the de Martonne aridity index (DMI), and Lang’s rain factor (LRF) for the research area. The largest part of the eastern Adriatic Sea, which is occupied by the sub-Mediterranean vegetation zone, has a humid climate according to the aridity index (DMI) (43.75%). According to Lang’s rain factor (LRF) a semihumid climate dominates in 68.26% of the land area in a sub-Mediterranean vegetation zone.
The spatial distribution of the Emberger pluviothermic quotient (Q2) and the ombrothermic index (Io) is shown in Figure 4a,b. According to the Emberger pluviothermic quotient (Q2), most of the area in the sub-Mediterranean and eu-Mediterranean vegetation zone can be described as humid, while the steno-Mediterranean was sub-humid. In examining the values of the Ombrothermic index (Io), most of the area is found within the values that correspond to a Mediterranean climate, while in a sub-Mediterranean vegetation zone nearly equal land area has a Mediterranean and a temperate climate, 38.12% and 38.34% respectively.
Figure 5 shows the dry season water deficit (DSWD) and the length of the dry season (LDS) in months. Dry season water deficit (DSWD) was largest in the steno-Mediterranean vegetation zone. In the sub-Mediterranean, the length of the dry season (LDS) was one month, in the eu-Mediterranean two months, and in the steno-Mediterranean three months.

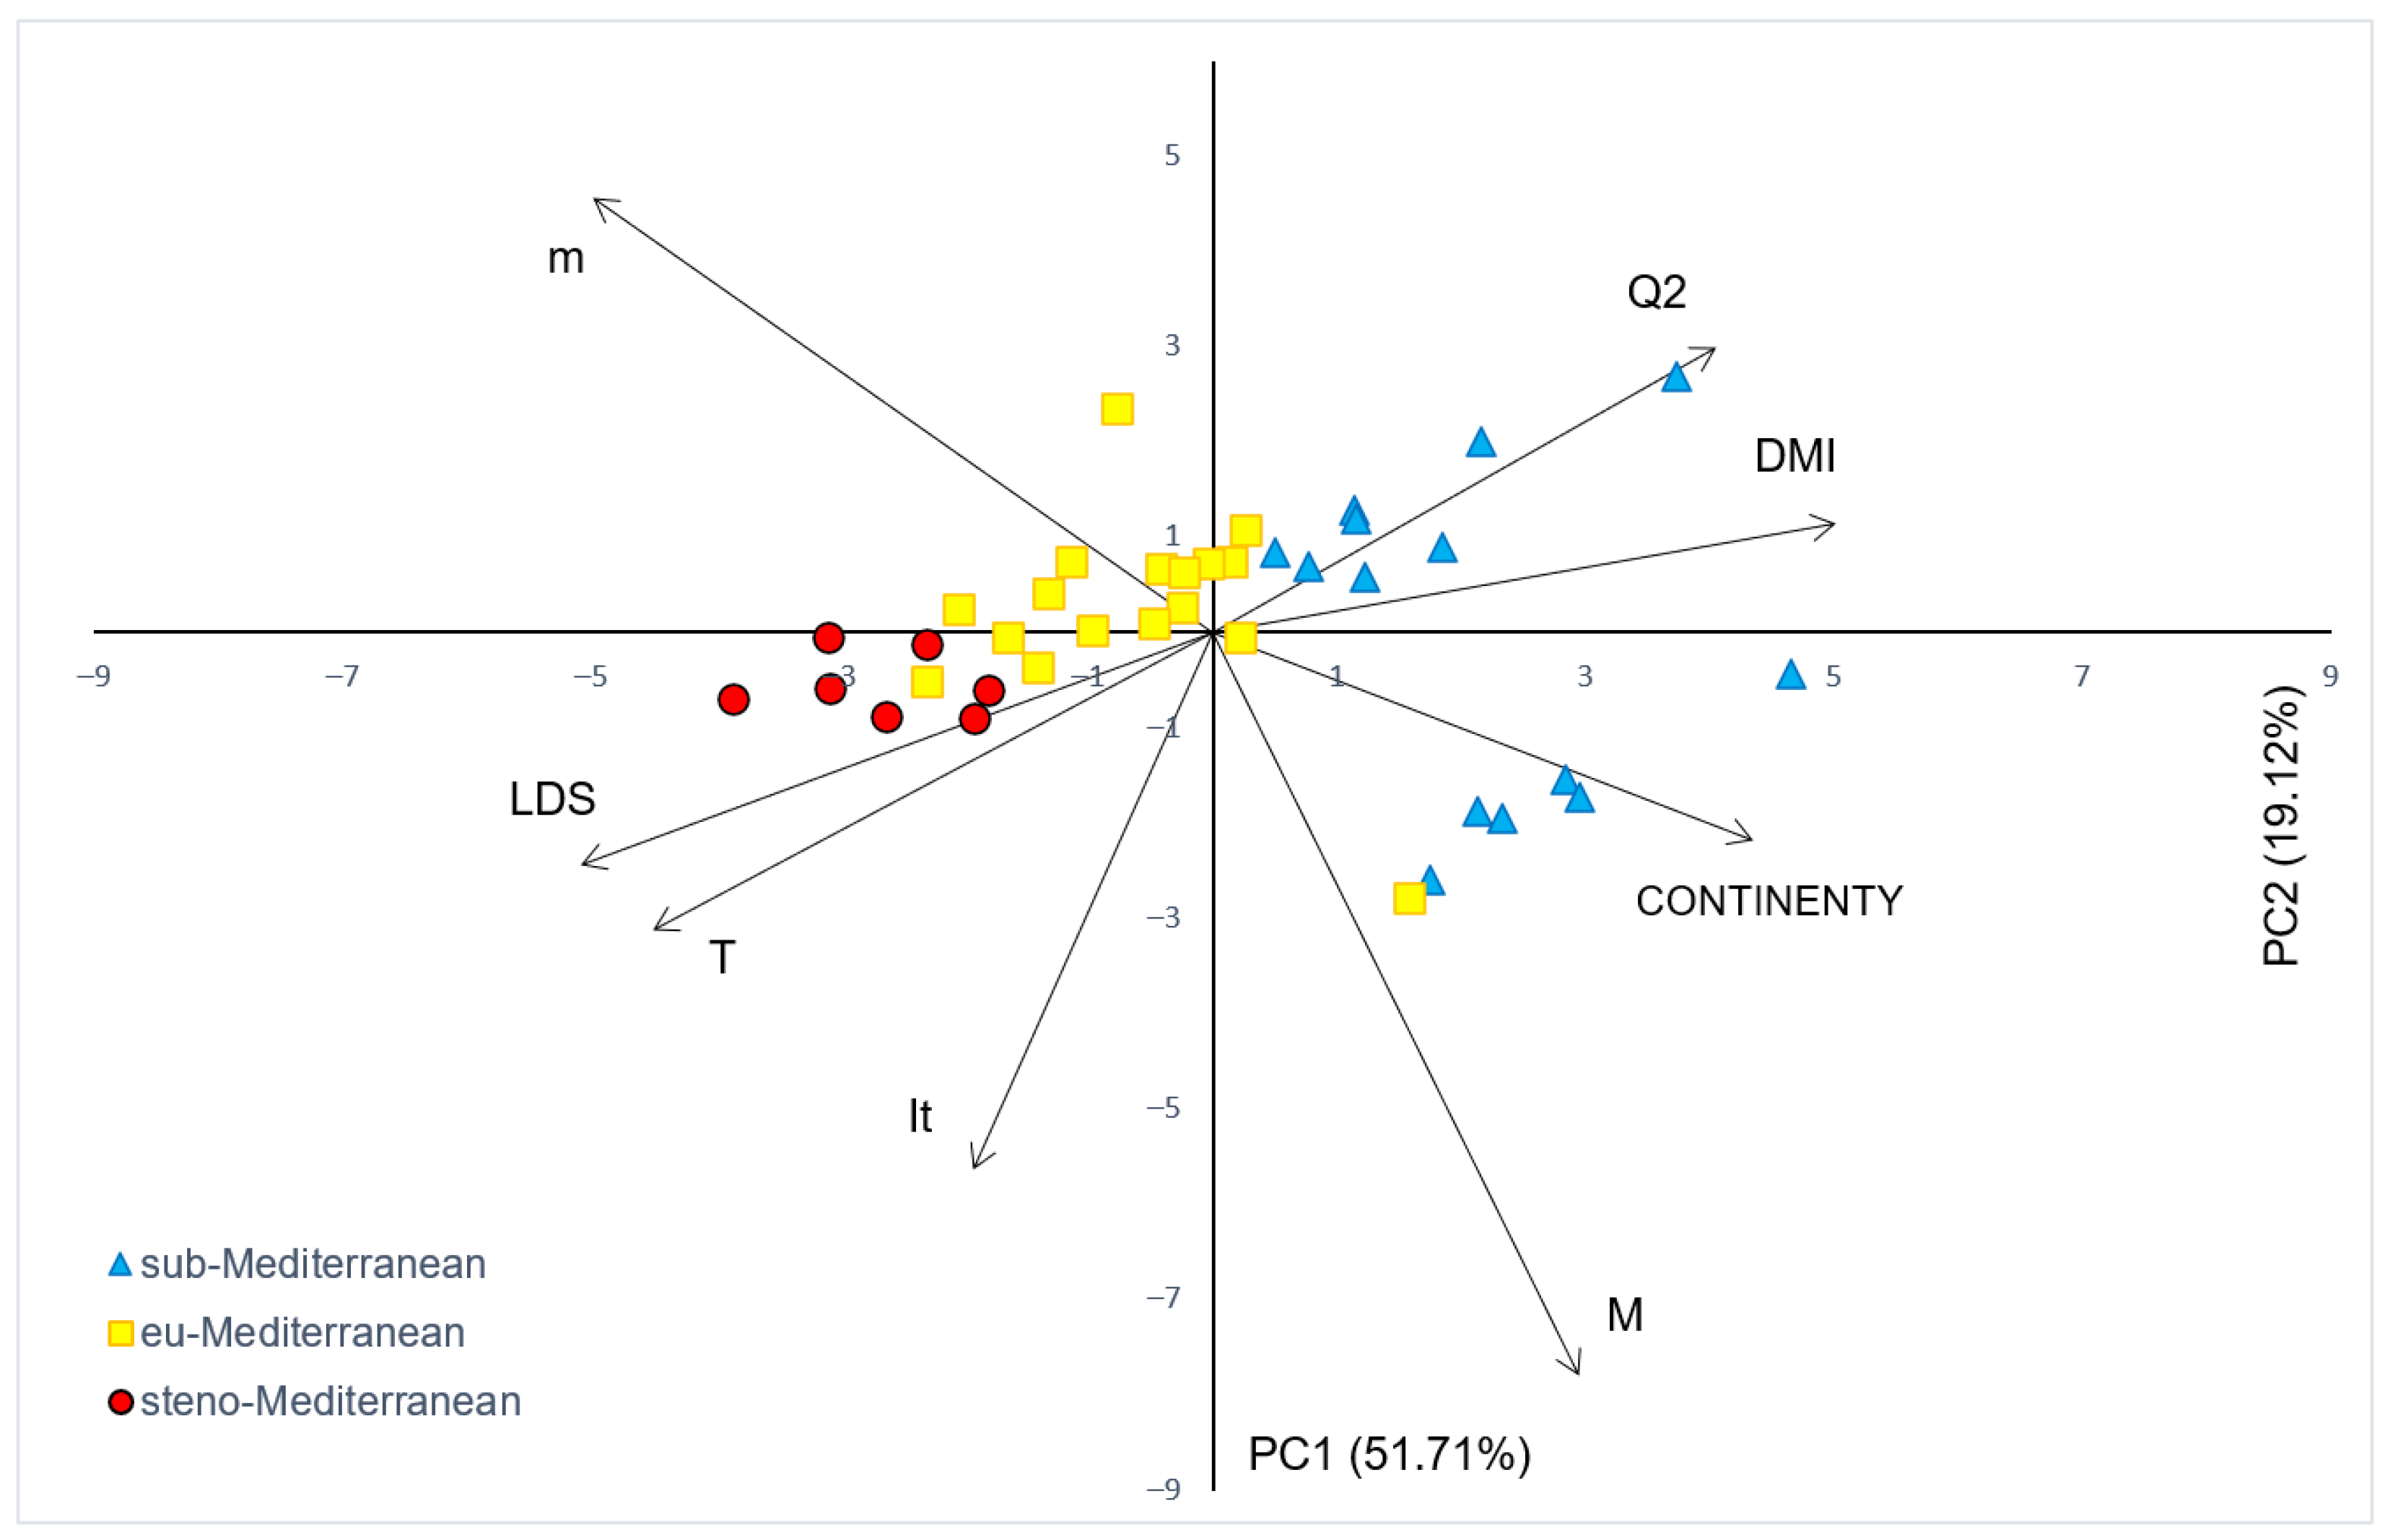
3.3. Principal Component Analysis of Climatic Relationships in Vegetation Zones

Sixteen bioclimatic variables were used to describe environmental differences between the 38 weather stations included in the study. In general, bioclimatic variables were highly correlated. Among the 120 pairs examined, a strong positive correlation (r > 0.85) was found in 14 pairs, and a strong negative correlation (r < −0.85) in seven pairs (Supplementary Materials Table S2). Finally, eight environmental variables were selected for the PC analysis. The variables that were highly correlated were not included in the analysis because of redundancy. The first principal component explained 51.7% of the total variance, with a strong negative correlation found for three bioclimatic variables (LDS, m and T), and a strong positive correlation for two bioclimatic variables (DMI and CONTINENTY) (Supplementary Materials Table S3). The first principal component separated the sub-Mediterranean localities (Imotski, Sinj, Knin, Crikvenica, Rijeka, Senj, Krk, Malinska, Kukuljanovo, Karlobag, Pazin, Omišalj, Bakar, Botonega) characterized by lower temperatures and a shorter dry season and higher de Martonne aridity index and continentality index, from the eu-Mediterranean (Dubrovnik, Ston, Orebić, Opuzen, Makarska, Split, Šibenik, Biograd, Zadar, Rab, Mali Lošinj, Cres, Rovinj, Poreč, Pag, Pula, Novigrad) and steno-Mediterranean localities (Lastovo, Mljet, Korčula, Vela Luka, Komiža, Hvar), where higher temperatures and longer dry season and lower de Martonne aridity index and continentality index were recorded (Figure 6). Within the same principal component, some overlap was observed between the eu-Mediterranean and steno-Mediterranean localities. In addition, one locality from the eu-Mediterranean was grouped with localities from the sub-Mediterranean. The second PC axis explained 19.1% of the variability (Supplementary Materials Table S3). Along the same PC axis, a notable sub-structure within the sub-Mediterranean vegetation zone was observed (Figure 6), where each of the localities was clustered along the average maximum temperature of the warmest month. Although the third PC axis had the Eigenvalue of 1.07 and explained 13.4% of the variability (Supplementary Materials Table S3), along the same axis no separation or grouping of localities was observed along the studied vegetation zones, nor was a substructure observed within individual vegetation zones (Supplementary Materials Figure S1). Moreover, only weak correlations of bioclimatic variables with the third PC axis were recorded. In view of that, the third variable can be disregarded.

4. Discussion

Air temperature and precipitation are the two most significant climatic elements used to express certain climatic relations, and to calculate the bioclimatic indices. Using bioclimatic indices, it is possible to conduct a detailed analysis of the relationships between climate and vegetation. It is well known that climate and vegetation patterns in the Mediterranean region are highly correlated [7]. Within an individual vegetation zone, there may be one or more vegetation zones due to the influence of relief factors, primarily altitude. The ecological limits defined by climate and vegetation are less abrupt in the area of the Tyrrhenian Sea than in the area of the Adriatic Sea [54]. The ecological conditions of the forest tree species that dominate in the vegetation zones in the area of the Mediterranean vegetation belt are closely related to the values of the bioclimatic parameters [55]. Five out of eight bioclimatic variables (mean annual air temperature (T), average minimum temperature of the coldest month (m), length of the dry season (LDS), de Martonne aridity index (DMI), continentality index (CONTINENTY)) that were included in the PC analysis along the first PC axis separated the studied localities, albeit with a small overlap, into three groups that correspond with predefined vegetation zones. From the PC graph showing the first and second principal component, it is clearly visible that the range of variation in the examined bioclimatic variables appears to be more pronounced between the sub-Mediterranean localities than among the eu-Mediterranean and steno-Mediterranean localities.

4.1. Sub-Mediterranean Vegetation Zone

This vegetation zone occupies the largest part of the eastern Adriatic and is most influenced by altitude. The lowest mean annual air temperature (T) was 13.9 °C and recorded in the sub-Mediterranean zone; this was substantially lower than the temperatures in the Mediterranean parts of Italy (16.1 °C) and Spain (16.3 °C) [56]. According to Canu et al. [15], the sub-Mediterranean climate type is a transitional zone towards a Mediterranean macro-bioclimate. In this vegetation zone, the absolute minimum air temperature was recorded, however, the absolute maximum air temperatures in this vegetation zone were indeed high, as also seen by the presence of thermophilic species such as pubescent oak. Based on the mean minimum temperature of the coldest month (m), this zone can be considered temperate.
In terms of its geographic position, Croatia is situated between central Europe and the Mediterranean regions, where the interaction between the atmosphere and complex local geophysical properties can cause large spatial and temporal variations in the distribution of precipitation [18]. The mean annual precipitation (P) was highest in the sub-Mediterranean vegetation zone, especially in its northern parts, with an average of 1233.4 mm of precipitation. This amount is far higher than in the Mediterranean parts of Spain (408 mm) and Italy (720 mm) [56]. These results are similar to reports by Raicich [57] and Penzar et al. [21], who explained that the Alps are the cause for the high levels of precipitation in the northern Adriatic. The sub-Mediterranean vegetation zone is situated at a higher elevation, and therefore relief elements result in higher amounts of precipitation [58] and lower values of air temperature [59].
The northern Adriatic in the sub-Mediterranean zone also lacks water in the summer quarter, and towards the south and on the islands, this deficit is larger and lasts for longer, which corroborates the findings of Penzar et al. [21] and Gajić-Čapka and Zaninović [60]. However, in certain parts of this vegetation zone (stations Sub1–Sub3), there is no dry period and according to Breckle [61], this can be considered a temperate climate. According to Lang’s rain factor (LRF), the sub-Mediterranean climate zone is semi-humid, while according to the de Martonne index (DMI), it is a very humid climate. According to the ombrothermic index (Io), it is humid. The values of the Emberger pluviothermic quotient (Q2) place the sub-Mediterranean zone in the per-humid climate. Months with a water deficit in the northern part of the sub-Mediterranean were July and August, while in the southern part of the zone, this extended from May to August. However, the length of the dry season (LDS) was lowest in the sub-Mediterranean zone, with an average of one dry month with a water deficit of −215.50 mm. These results are also in line with the claims that the number of dry days and the maximum number of consecutive dry days were lower in the northern part than elsewhere in the Croatian coastal region [62]. Though some authors [15] consider the sub-Mediterranean to be a transitional zone towards the Mediterranean macro-bioclimate, others [63,64] define the Mediterranean climate as having a dry period of at least one month, which is the average of this vegetation zone. There are also more restrictive climatic classifications and definitions, where it is considered that at least two consecutive dry months should not be sufficient to classify a climate as the Mediterranean if the precipitation of the preceding two months can compensate for the deficit of the two dry months [42,65].

4.2. Eu-Mediterranean Vegetation Zone

In terms of air temperature, this vegetation zone was significantly warmer than the sub-Mediterranean zone. The mean annual air temperature (T) was from 0.9 °C to 1.1 °C lower than in the Mediterranean parts of Italy and Spain [56]. This vegetation zone has a very high-temperature variation in terms of the mean minimum temperature of the coldest month (m). Since the increase in air temperature also affects the increase in the amount of potential evapotranspiration [66], this vegetation zone also has significantly higher values of potential evapotranspiration compared to the sub-Mediterranean (PET). Spatially, the coastal area of the Republic of Croatia receives more precipitation than the islands, especially in the coastal area near the Dinarides mountain range, which agrees with reports of Branković et al. [67]. According to the ratio of annual precipitation and air temperature (LRF), the climate of this zone is semi-humid, while according to the de Martonne index (DMI), the eu-Mediterranean has a moderately humid climate. The quantity of precipitation (933.8 mm) is substantially higher than in the neighbouring parts of Mediterranean Italy, where annual precipitation was 720 mm [56].
In the northern part of the eu-Mediterranean, months with a water deficit were from May to August, while in the southern area of the eu-Mediterranean, from May to September. A widely distributed tree species in this vegetation zone is the xerophyte holm oak [23,29]. These results are in line with Timbal and Aussenac [68], who state that holm oak is drought resistant. The maximum duration of the dry period in one year was seven months, while in the steno-Mediterranean was up to eight months, which can reduce the vitality of holm oak and result in die-offs. The average water deficit was two dry months, with a value of −325.47 mm. This zone was sub-humid according to the values of the ombrothermic index (Io) and humid according to the Emberger pluviothermic quotient (Q2). Holm oak is able to grow in different Mediterranean climates, from semi-arid to very humid, depending on the amount of precipitation, and from warm to very cold depending on air temperature [31,69]. The grouping of weather stations in this vegetation zone is not completely homogeneous. Namely, the meteorological station Novigrad, which is located in the eu-Mediterranean vegetation zone, was grouped into the sub-Mediterranean zone. This weather station is situated in the western part of the Istrian peninsula, where there is a narrow coastal belt of holm oak forests, which could be influenced by the climate of the continental part of the Istrian peninsula that is in the sub-Mediterranean vegetation zone.
The research results indicated that there were no significant differences in the values of the pluviothermic quotient (Q2) and in the mean minimum temperatures of the coldest month of the year (m) between this vegetation zone and the steno-Mediterranean zone. Based on the Emberger climate diagram [25], the eu-Mediterranean and steno-Mediterranean vegetation zones overlapped to form one vegetation zone.

4.3. Steno-Mediterranean Vegetation Zone

The warmest vegetation zone, the steno-Mediterranean, occupies the smallest part of the eastern Adriatic Sea. It is located in its southern island part and narrow coastal strip. The reason for this is the position of the Adriatic Sea, which is located further north compared to other seas in the Mediterranean area. The results showed that the mean annual air temperature in the steno-Mediterranean zone corroborated reports of Seletković et al. [25] and Penzar et al. [21] that the Adriatic Sea is warmest in the offshore areas of the southern Adriatic, where the dominant species is Aleppo pine. It is well known that large water bodies are heat reservoirs and have a strong effect on temperature [7]. The mean annual air temperature (T) in this vegetation zone was 16.1 °C, which is similar to the temperature values of the Mediterranean parts of Italy and Spain [56]. Aleppo pine is a highly drought-tolerant species, a thermophyte that grows well in the warmer parts of the Mediterranean where forest fires are very common [70]. In this vegetation zone, the lowest absolute minimum air temperature was recorded. In the steno-Mediterranean, the absolute minimum air temperature was −4.7 °C. Aleppo pine prefers an absolute minimum temperature of −2 to 10 °C [34,35]. In terms of temperature, the Adriatic Sea represents the cooler part of the distribution range of Aleppo pine. In terms of the winter variation of the mean minimum temperature of the coldest month, this zone is a very hot region.
Precipitation levels are low on the Adriatic islands, and exceptionally low on the islands in the southern part of the Adriatic Sea [71,72]. According to Penzar et al. [21], this is because airflow is horizontal off-shore and on the islands. Considering the values of the Lang rain factor (LRF), this zone has a semi-arid climate, and according to the de Martonne index (DMI) has a moderately-humid climate. Months with a water deficit were from April to October, which is highly xerophilic conditions. According to our analyses, the largest water deficit was in the area of the southern Adriatic, which corresponds to the findings of Perčec Tadić et al. [73], who showed that the period of precipitation deficit was longer in the southern Adriatic. The maximum duration of the dry period within one year was eight months. According to the results of research in this vegetation zone, the average was three dry months (LDS), which is in line with data on the drought tolerance of Aleppo pine [74]. Lower values of the ratio of precipitation and potential evapotranspiration (PET) correspond to dry areas, and the lowest amount of this index was in the area dominated by Aleppo pine, or the steno-Mediterranean. The water deficit in the dry season (DSWD) was −440.22 mm. The steno-Mediterranean is a sub-humid area according to the ombrothermic index (Io) and humid according to the Emberger pluviothermic quotient (Q2).
Aleppo pine is a xerophyte and is more drought resilient than pedunculate oak and holm oak [75,76] and in the area where it is the dominant species and the annual precipitation levels are lowest. Aleppo pine is found in habitats ranging from less arid or semi-arid to humid, and the precipitation level is between 350 and 700 mm [77,78], while in the steno-Mediterranean area in the Republic of Croatia, the quantity of precipitation is on average 721.22 mm, which was nearly the same as in Italy (720 mm) but far more than in the Mediterranean part of Spain, where only 408 mm of precipitation falls [56].

5. Conclusions

There is a statistically significant difference between all three vegetation zones in the mean annual air temperature, the quantity of precipitation, duration of the dry period, dry season water deficit, Lang rain factor, ombro-evapotranspiration index, aridity index, continentality index, Ellenberg index, ombrothermic index, and ombrothermic index in the summer period. The mean annual air temperature significantly increased from the sub-Mediterranean vegetation zone, to the eu-Mediterranean zone and finally the steno-Mediterranean vegetation zone. On the eastern Adriatic coast, the quantity of precipitation significantly declined from the northern part of the Adriatic Sea in the sub-Mediterranean towards the western part of the Istrian Peninsula, then the islands and the central and southern part of the Croatian Mediterranean areas that belong to the eu-Mediterranean, dominated by holm oak, and was lowest on the southern Adriatic islands in the steno-Mediterranean zone dominated by Aleppo pine. The number of dry months increased from the northern Adriatic coast in the sub-Mediterranean towards the south, i.e., towards the eu-Mediterranean and steno-Mediterranean zones. Through this research, it was found that the mean annual air temperature, average minimum air temperature of the coldest month of the year and bioclimatic indices, continentality index, length of the dry season and de Martonne aridity index contribute the most to the grouping of vegetation in forest stands in the Mediterranean vegetation belt of the eastern Adriatic.

Supplementary Materials

The following supporting information can be downloaded at: https://www.mdpi.com/article/10.3390/atmos13101709/s1, Table S1: Logistic regression statistics for spatial distribution of tree vegetation zones; Table S2: Correlations among studied bioclimatic variables at 38 sites from the east Adriatic coast, Table S3: Correlations between 16 bioclimatic variables and the first three principal components, Figure S1: Biplot of the principal component analysis based on bioclimatic variables PC1–PC3.

Author Contributions

Conceptualization, D.U.; methodology, D.U., I.Š., I.T. and I.P., database management, D.U. and V.P.; statistical analyses, D.U., I.P., I.S. and V.P.; Maps, I.S. and M.A., Writing, D.U., I.Š., I.P. and V.P.; technical editing, D.U. and V.P. All authors have read and agreed to the published version of the manuscript.

Funding

D.U. and V.P. were supported by Ministry of Economy and Sustainable Development (Croatia) under the project KK.05.1.1.02.0009 (MEMORIE).

Institutional Review Board Statement

Not applicable.

Informed Consent Statement

Not applicable.

Data Availability Statement

The climatic data that support the findings of this study are available on request from the Croatian Hydrological and Meteorological Service. Terms of use, data availability, and contact available at: https://klima.hr/razno/katalog_i_cjenikDHMZ.pdf (accessed on 9 August 2022).

Acknowledgments

Climatic data from weather stations used in this study was provided by courtesy of the Croatian Meteorological and Hydrological Service, for which we thank them.

Conflicts of Interest

The authors declare no conflict of interest.

References

  1. Médail, F.; Quézel, P. Biodiversity hotspots in the Mediterranean Basin: Setting global conservation priorities. Conserv. Biol. 1999, 13, 1510–1513. [Google Scholar] [CrossRef]
  2. Hure, M.; Batistić, M.; Kovačević, V.; Bensi, M.; Garić, R. Copepod Community structure in pre- and post- winter conditions in the Southern Adriatic Sea (NE Mediterranean). J. Mar. Sci. Eng. 2020, 8, 567. [Google Scholar] [CrossRef]
  3. Medail, F.; Quézel, P. Hot-Spots analysis for conservation of plant biodiversity in the Mediterranean Basin. Ann. Mo. Bot. Gard. 1997, 84, 112–127. [Google Scholar] [CrossRef]
  4. Jasprica, N.; Dolina, K.; Milović, M. The flora and vegetation of the NE Mediterranean islet with centuries-long human influences. Acta Bot. Croat. 2018, 77, 126–134. [Google Scholar] [CrossRef]
  5. Cowling, R.M.; Rundel, P.W.; Lamont, B.B.; Kalin Arroyo, M.; Arianoutsou, M. Plant diversity in Mediterranean-climate regions. Trends Ecol. Evol. 1996, 11, 362–366. [Google Scholar] [CrossRef]
  6. Nikolić, T.; Antonić, O.; Alegro, A.L.; Dobrović, I.; Bogdanović, S.; Liber, Z.; Rešetnik, I. Plant species diversity of Adriatic Islands: An introductory survey. Plant Biosyst. 2008, 142, 435–445. [Google Scholar] [CrossRef]
  7. Rego, F.; Rocha, M.S. Climatic patterns in the Mediterranean region. Ecol. Mediterr. 2014, 40, 49–59. [Google Scholar] [CrossRef]
  8. Caloiero, T.; Callegari, G.; Coletta, V.; Pellicone, G.; Veltri, A. Bioclimatic analysis in a region of southern Italy (Calabria). Plant Biosyst. Int. J. Deal. Aspects Plant Biol. 2016, 150, 1282–1295. [Google Scholar] [CrossRef]
  9. Suc, J.-P. Origin and evolution of the Mediterranean vegetation and climate in Europe. Nature 1984, 307, 429–432. [Google Scholar] [CrossRef]
  10. Molero, J.M.; Marfil, J.M. The bioclimates of Sierra Nevada national park. IJGR 2015, 5, 1–11. [Google Scholar]
  11. Tuhkanen, S. Climatic Parameters and Indices in Plant Geography; Almqvist & Wiksell International: Uppsala/Stockholm, Sweden, 1980; ISBN 978-91-7210-467-9. [Google Scholar]
  12. Giacobbe, A. Le basi concrete per una classificazione ecologica della vegetazione Italiana. Arch. Bot. 1949, IX, 65–177. [Google Scholar]
  13. Daget, P. Le bioclimat mediterraneen: Caracteres generaux, modes de caracterisation. Vegetatio 1977, 34, 1–20. [Google Scholar] [CrossRef]
  14. Pesaresi, S.; Galdenzi, D.; Biondi, E.; Casavecchia, S. Bioclimate of Italy: Application of the worldwide bioclimatic classification system. J. Maps 2014, 10, 538–553. [Google Scholar] [CrossRef]
  15. Canu, S.; Rosati, L.; Fiori, M.; Motroni, A.; Filigheddu, R.; Farris, E. Bioclimate map of Sardinia (Italy). J. Maps 2015, 11, 711–718. [Google Scholar] [CrossRef] [Green Version]
  16. Pellicone, G.; Caloiero, T.; Guagliardi, I. The de martonne aridity index in Calabria (Southern Italy). J. Maps 2019, 15, 788–796. [Google Scholar] [CrossRef]
  17. Gajić-Čapka, M.; Cindric, K. Secular trends in indices of precipitation extremes in Croatia, 1901–2008. Geofizika 2011, 28, 293–312. [Google Scholar]
  18. Gajić-Čapka, M.; Cindric, K.; Pasarić, Z. Trends in precipitation indices in Croatia, 1961–2010. Theor. Appl. Climatol. 2014, 121, 167–177. [Google Scholar] [CrossRef]
  19. Cindrić, K.; Pasarić, Z.; Gajić-Čapka, M. Spatial and temporal analysis of dry spells in Croatia. Theor. Appl. Climatol. 2010, 102, 171–184. [Google Scholar] [CrossRef]
  20. Giorgi, F.; Lionello, P. Climate change projections for the Mediterranean region. Glob. Planet. Change 2008, 63, 90–104. [Google Scholar] [CrossRef]
  21. Penzar, B.; Penzar, I.; Orlić, M. Vrijeme i Klima Hrvatskog Jadrana (Weather and Climate of the Croatian Adriatics); Dr. Feletar, Hrvatski Hidrografski Institut: Zagreb/Koprivnica/Split, Croatia, 2001; ISBN 953-6235-63-3. [Google Scholar]
  22. Médail, F.; Monnet, A.-C.; Pavon, D.; Nikolic, T.; Dimopoulos, P.; Bacchetta, G.; Arroyo, J.; Barina, Z.; Albassatneh, M.C.; Domina, G.; et al. What is a tree in the Mediterranean Basin hotspot? A critical analysis. For. Ecosyst. 2019, 6, 17. [Google Scholar] [CrossRef] [Green Version]
  23. Trinajstić, I. Fitogeografsko raščlanjenje klimazonalne šumske vegetacije Hrvatske (Plantgeographycal division of klimazonal forest vegetation of Croatia). Šumar. List 1998, 122, 407–421. [Google Scholar]
  24. Trinajstić, I. Fitogeografska raščlanjenost biljnoga pokrova (Phytogeographic analysis of Croatian Mediterranean vegetation cover). In Šume Hrvatskoga Sredozemlja/Forests of the Croatian Mediterranean; Akademija Šumarskih Znanosti: Zagreb, Croatia, 2011; pp. 182–193. ISBN 978-953-98571-5-6. [Google Scholar]
  25. Seletković, Z.; Tikvić, I.; Vučetić, M.; Ugarković, D. Climatic features and the vegetation of Mediterranean Croatia. In Šume Hrvatskoga Sredozemlja; Akademija Šumarskih Znanosti: Zagreb, Croatia, 2011; pp. 142–161. ISBN 978-953-98571-5-6. [Google Scholar]
  26. Šegota, T.; Filipčić, A. Climatology for Geographers; Školska Knjiga: Zagreb, Croatia, 1996; p. 471. [Google Scholar]
  27. Topić, V.; Butorac, L. Protuerizijska, hidrološka i vodozaštitna uloga sredozemnih šuma. In Šume Hrvatskog Sredozemlja; Matić, S., Ed.; Akademija Šumarskih Znanosti: Zagreb, Croatia, 2011; pp. 307–337. ISBN 978-953-98571-5-6. [Google Scholar]
  28. IEN Bioportal—Geoportal of the Croatian Nature Protection Information System, Institute for Environment and Nature of Republic of Croatia. Available online: http://services.bioportal.hr/gis/ (accessed on 2 April 2022).
  29. Vukelić, J. Forest Vegetation in Croatia; Šumarski Fakultet, Sveučilište u Zagrebu, DZZP: Zagreb, Croatia, 2012; ISBN 978-953-292-024-6. [Google Scholar]
  30. Pasta, S.; de Rigo, D.; Caudullo, G. Quercus pubescens in Europe: Distribution, habitat, usage and threats. In European Atlas of Forest Tree Species; San-Miguel- Ayanz, J., de Rigo, D., Caudullo, G., Houston Durrant, T., Mauri, A., Eds.; Publication Office of the European Union: Luxembourg, 2016; ISBN 978-92-79-36740-3. [Google Scholar]
  31. Barbero, M.; Loisel, R.; Quézel, P. Biogeography, ecology and history of Mediterranean Quercus ilex ecosystems. In Quercus ilex L. Ecosystems: Function, Dynamics and Management; Romane, F., Terradas, J., Eds.; Advances in Vegetation Science; Springer: Dordrecht, The Netherlands, 1992; pp. 19–34. ISBN 978-94-017-2836-2. [Google Scholar]
  32. Davies, C.; Moss, D.; Hill, M. EUNIS Habitat Classification Revised 2004; European Environment Agency: Copenhagen, Denmark, 2004. [Google Scholar]
  33. Devillers, P.; Devillers-Terschuren, J.; Ledant, J. CORINE biotopes manual: Habitats of the European community. Pub. EUR 1991, 1–3, 12587. [Google Scholar]
  34. Biondi, E.; Blasi, C.; Burrascano, S.; Casavecchia, S.; Copiz, R.; Del Vico, E.; Galdenzi, D.; Gigante, D.; Lasen, C.; Spampinato, G.; et al. Manuale Italiano Di Interpretazione Degli Habitat (Direttiva 92/43/CEE); Ministero dell’Ambiente e della Tutela del Territorio e del Mare, Direzione per la Protezione della Natura: Rome, Italy, 2010.
  35. Mauri, A.; Di Leo, M.; de Rigo, D.; Caudullo, G. Pinus halepensis and Pinus brutia in Europe: Distribution, habitat, usage and threats. In European Atlas of Forest Tree Species; San-Miguel-Ayanz, J., de Rigo, D., Caudullo, G., Houston Durrant, T., Mauri, A., Eds.; Publication Office of the European Union: Luxembourg, 2016; ISBN 978-92-79-36740-3. [Google Scholar]
  36. Boulli, A.; Baaziz, M.; M’Hirit, O. Polymorphism of natural populations of Pinus halepensis Mill. in Morocco as revealed by morphological characters. Euphytica 2001, 119, 309–316. [Google Scholar] [CrossRef]
  37. Torregrosa, A.; Taylor, M.D.; Flint, L.E.; Flint, A.L. Present, future, and novel bioclimates of the San Francisco, California region. PLoS ONE 2013, 8, e58450. [Google Scholar] [CrossRef] [Green Version]
  38. Thornthwaite, C.W. An approach toward a rational classification of climate. Geogr. Rev. 1948, 38, 55–94. [Google Scholar] [CrossRef]
  39. Dufour-Dror, J.-M.; Ertas, A. Bioclimatic perspectives in the distribution of Quercus ithaburensis decne. subspecies in Turkey and in the Levant. J. Biogeogr. 2004, 31, 461–474. [Google Scholar] [CrossRef]
  40. Gaussen, H. Théorie et classification des climats et microclimate. 8me congrès internat. Bot. Paris Sect. 1954, 7, 125–130. [Google Scholar]
  41. UNESCO/FAO. Bioclimatic Map of the Mediterranean Zone: Ecological Study of the Mediterranean Zone: Explanatory Notes—UNESCO Digital Library; UNESCO: Paris, France; FAO: Rome, Italy, 1963. [Google Scholar]
  42. Rivas-Martínez, S.; Rivas-Sáenz, S.; Penas, A. Worldwide bioclimatic classification system. Glob. Geobot. 2011, 1, 1–634. [Google Scholar]
  43. Lang, R. Versuch Einer Exakten Klassifikation der Böden in Klimatischer und Geologischer Hinsicht; Verlag für Fachliteratur: Berlin, Germany, 1915. [Google Scholar]
  44. De Martonne, E. Areisme et Indice d’aridite; Comptes Rendus de L’Academy of Science: Paris, France, 1926; p. 1395. English: Regions of interior basin drainage. Geogr. Rev. 1926, 17, 397–414. [Google Scholar] [CrossRef]
  45. Ellenberg, H. Vegetation Mitteleuropas Mit Den Alpen in Ökologischer Sicht, 4th ed.; Verlag Eugen Ulmer: Stuttgart, Germany, 1986. [Google Scholar]
  46. Rasztovits, E.; Móricz, N.; Berki, I.; Pötzelsberger, E.; Mátyás, C. Evaluating the performance of stochastic distribution models for European beech at low-elevation xeric limits. Időjárás 2012, 116, 173–194. [Google Scholar]
  47. Emberger, L. Une classification biogéographique des climats. Recueil Trav. Lab. Bot. Geol. Zool. Univ. Fac. Sci. Montpellier 1955, 7, 3–43. [Google Scholar]
  48. Blondel, J.; Aronson, J. Biology and Wildlife of the Mediterranean Region; Oxford University Press: Oxford, UK, 1999; ISBN 978-0-19-850035-3. [Google Scholar]
  49. Mhirit, O. Climats et bioclimats de la forêt. In Le Grand Livre de la Forêt Marocaine; Mardaga: Sprimont, Belgium, 1999; pp. 54–60. ISBN 2-87009-686-0. [Google Scholar]
  50. Monachus KlimaSoft 2.1. Available online: https://climatediagrams.net (accessed on 15 April 2022).
  51. Statistica (Data Analysis Software System), version 13; TIBCO Software Inc.: Palo Alto, CA, USA, 2018.
  52. QGIS Development Team. QGIS Geographic Information System. Open Source Geospatial Foundation Project. 2022. Available online: http://qgis.osgeo.org (accessed on 15 April 2022).
  53. Geographic Resources Analysis Support System (GRASS), Version 8.2; GRASS Development Team: Corvallis, OR, USA, 2012.
  54. Blasi, C.; Carranza, M.L.; Filesi, L.; Tilia, A.; Acosta, A. Relation between climate and vegetation along a Mediterranean-temperate boundary in central Italy. Glob. Ecol. Biogeogr. 1999, 8, 17–27. [Google Scholar] [CrossRef]
  55. Prpić, B.; Tikvić, I.; Idžojtić, M.; Seletković, Z. Ekološka konstitucija značajnijih vrsta drveća i grmlja. In Šume Hrvatskoga Sredozemlja/Forests of the Croatian Mediterranean; Akademija Šumarskih Znanosti: Zagreb, Croatia, 2011; pp. 245–287. ISBN 978-953-98571-5-6. [Google Scholar]
  56. Aguilera, F.; Orlandi, F.; Oteros, J.; Tommaso, B.; Fornaciari, M. Bioclimatic characterisation of the Mediterranean region: Future climate projections for Spain, Italy and Tunisia. Ital. J. Agrometeorol. 2015, 2015, 45–58. [Google Scholar]
  57. Raicich, F. On the fresh balance of the Adriatic Sea. J. Mar. Syst. 1996, 9, 305–319. [Google Scholar] [CrossRef]
  58. Osborn, H.B. Estimating precipitation in mountainous regions. J. Hydraul. Eng. 1984, 110, 1859–1863. [Google Scholar] [CrossRef]
  59. Waring, R.H.; Running, S.W. Forest Ecosystems: Analysis at Multiple Scales, 2nd ed.; Running Academic Press Inc.: San Diego, CA, USA, 1998; ISBN 978-0-12-735443-9. [Google Scholar]
  60. Gajić-Čapka, M.; Zaninovic, K. Long-term trends in temperature, precipitation and runoff at the Croatian Eastern Adriatic Coast. In Proceedings of the BALWOIS (Balkan Water Observation and Information System) Conference, Ohrid, North Macedonia, 23–26 May 2006. [Google Scholar]
  61. Breckle, S.-W. Walter’s Vegetation of the Earth: The Ecological Systems of the Geo-Biosphere, 4th ed.; Completely Revised and Enlarged 2002 Edition; Springer: Berlin/Heidelberg, Germany, 2008; ISBN 978-3-540-43315-6. [Google Scholar]
  62. Patarčić, M.; Gajić-Čapka, M.; Cindrić, K.; Branković, Č. Recent and near-future changes in precipitation-extreme indices over the Croatian Adriatic coast. Clim. Res. 2014, 61, 157–176. [Google Scholar] [CrossRef]
  63. Bagnouls, F.; Gaussen, H. Les climats biologiques et leur classification. Ann. Géogr. 1957, 66, 193–220. [Google Scholar] [CrossRef]
  64. Le Houerou, H.N. An agro-bioclimatic classification of Arid and Semiarid Lands in the isoclimatic Mediterranean zones. Arid Land Res. Manag. 2004, 18, 301–346. [Google Scholar] [CrossRef]
  65. Rivas-Martinez, S.; Penas, A.; del Rio, S.; Diaz Gonzalez, T.E.; Rivas-Saenz, S. Bioclimatology of the Iberian Peninsula and the Balearic Islands. In The Vegetation of the Iberian Peninsula; Plant and Vegetation; Springer: Berlin/Heidelberg, Germany, 2017; p. 676. ISBN 978-3-319-56140-0. [Google Scholar]
  66. Piñar Fuentes, J.C.; Cano-Ortiz, A.; Musarella, C.M.; Quinto Canas, R.; Pinto Gomes, C.J.; Spampinato, G.; del Río, S.; Cano, E. Bioclimatology, structure, and conservation perspectives of Quercus pyrenaica, Acer opalus subsp. granatensis, and Corylus avellana deciduous forests on Mediterranean bioclimate in the south-central part of the Iberian Peninsula. Sustainability 2019, 11, 6500. [Google Scholar] [CrossRef] [Green Version]
  67. Branković, Č.; Güttler, I.; Gajić-Čapka, M. Evaluating climate change at the Croatian Adriatic from observations and regional climate models’ simulations. Clim. Dyn. 2013, 41, 2353–2373. [Google Scholar] [CrossRef]
  68. Timbal, J.; Aussenac, G. An overview of ecology and silviculture of indigenous oaks in France. Ann. For. Sci. 1996, 53, 649–661. [Google Scholar] [CrossRef]
  69. De Rigo, D.; Caudullo, G. Quercus ilex in Europe: Distribution, habitat, usage and threats. In European Atlas of Forest Tree Species; San-Miguel- Ayanz, J., de Rigo, D., Caudullo, G., Houston Durrant, T., Mauri, A., Eds.; Publication Office of the European Union: Luxembourg, 2016; ISBN 978-92-79-36740-3. [Google Scholar]
  70. Chambel, M.R.; Climent, J.; Pichot, C.; Ducci, F. Mediterranean pines (Pinus halepensis mill. and Brutia ten). In Forest Tree Breeding in Europe: Current State-of-the-Art and Perspectives; Pâques, L.E., Ed.; Managing Forest Ecosystems; Springer: Dordrecht, The Netherlands, 2013; pp. 229–265. ISBN 978-94-007-6146-9. [Google Scholar]
  71. Bonacci, O.; Patekar, M.; Pola, M.; Roje-Bonacci, T. Analyses of climate variations at four meteorological stations on remote islands in the Croatian part of the Adriatic Sea. Atmosphere 2020, 11, 1044. [Google Scholar] [CrossRef]
  72. Bonacci, O.; Andrić, I.; Vrsalović, A.; Bonacci, D. Precipitation regime changes at four Croatian meteorological stations. Atmosphere 2021, 12, 885. [Google Scholar] [CrossRef]
  73. Perčec Tadić, M.; Gajić-Čapka, M.; Zaninović, K.; Cindrić, K. Drought vulnerability in Croatia. Agric. Conspec. Sci. 2014, 79, 31–38. [Google Scholar]
  74. Calamassi, R.; Della Rocca, G.; Falusi, M.; Paolettiinstb, E.; Strati, S. Resistance to water stress in seedlings of eight European provenances of Pinus halepensis mill. Ann. For. Sci. 2001, 58, 663–672. [Google Scholar] [CrossRef] [Green Version]
  75. Henderson, L. Alien weeds and invasive plants: A complete guide to declared weeds and invader in South Africa, including another 36 species invasive in that region. In Plant Protection Research Institute Handbook; Plant Protection Research Institute: Pretoria, South Africa, 2001; ISBN 978-1-86849-192-6. [Google Scholar]
  76. Rouget, M.; Richardson, D.M.; Milton, S.J.; Polakow, D. Predicting invasion dynamics of four alien pinus species in a highly fragmented semi-arid shrubland in South Africa. Plant Ecol. 2001, 152, 79–92. [Google Scholar] [CrossRef]
  77. Fady, B.; Semerci, H.; Vendramin, G.G. Aleppo pine (Pinus halepensis) and Brutia pine (Pinus brutia). In EUFORGEN Technical Guidelines for Genetic Conservation and Use; International Plant Genetic Resources Institute: Rome, Italy, 2003; ISBN 978-92-9043-571-6. [Google Scholar]
  78. De las Heras, J.; Moya, D.; Vega, J.A.; Daskalakou, E.; Vallejo, V.R.; Grigoriadis, N.; Tsitsoni, T.; Baeza, J.; Valdecantos, A.; Fernández, C.; et al. Post-fire management of serotinous pine forests. In Post-Fire Management and Restoration of Southern European Forests; Moreira, F., Arianoutsou, M., Corona, P., de las Heras, J., Eds.; Managing Forest Ecosystems; Springer: Dordrecht, The Netherlands, 2012; pp. 121–150. ISBN 978-94-007-2208-8. [Google Scholar]
Figure 1. Mediterranean vegetation belt in the research area with the position of weather stations.
Atmosphere 13 01709 g001
Figure 2. Spatial distribution of vegetation zones according to the results of logistic regression of climatic elements and altitude.
Atmosphere 13 01709 g002
Figure 3. (a) de Martonne aridity index (DMI), (b) Lang’s rain factor (LRF).
Atmosphere 13 01709 g003
Figure 4. (a) Emberger pluviothermic quotient (Q2), (b) Ombrothermic index (Io).
Atmosphere 13 01709 g004
Figure 5. (a) Dry season water deficit (DSWD), (b) Length of the dry season (LDS).
Atmosphere 13 01709 g005
Figure 6. Biplot of the principal component analysis based on bioclimatic variables.
Atmosphere 13 01709 g006
Table 1. List of weather stations in the vegetation zones of the Mediterranean vegetation belt along the eastern Adriatic coast.
Vegetation ZoneAbbreviationWeather StationLatitude LongitudeAltitude (m)
Sub-MediterraneanSub1Kukuljanovo45°19′48.88″ N14°31′12.02″ E355
Sub2Rijeka45°19′37.07″ N14°26′45.16″ E120
Sub3Bakar45°18′17.18″ N14°32′9.90″ E2
Sub4Butoniga45°17′41.50″ N13°57′48.68″ E50
Sub5Pazin45°14′22.20″ N13°56′14.19″ E291
Sub6Omišalj45°12′38.84″ N14°33′22.47″ E85
Sub7Crikvenica45°10′19.54″ N14°41′30.87″ E2
Sub8Malinska45°7′26.61″ N14°31′42.29″ E1
Sub9Krk45°1′31.86″ N14°34′24.24″ E28
Sub10Senj44°59′23.83″ N14°54′1.80″ E26
Su11Karlobag44°31′29.38″ N15° 4′27.76″ E30
Sub12Knin44°2′28.06″ N16°11′46.81″ E255
Sub13Sinj43°42′16.24″ N16°38′20.36″ E308
Sub14Imotski43°27′0.00″ N17°12′59.98″ E435
Eu-MediterraneanEu1Novigrad45°19′0.83″ N13°33′45.62″ E34
Eu2Poreč45°13′60.00″ N13°35′60.00″ E15
Eu3Rovinj45°7′18.00″ N13°37′45.33″ E20
Eu4Cres44°57′0.00″ N14°25′0.00″ E5
Eu5Pula44°52′0.00″ N13°50′60.00″ E43
Eu6Rab44°45′31.70″ N14°45′33.32″ E24
Eu7Mali Lošinj44°31′55.89″ N14°28′6.64″ E53
Eu8Pag44°26′30.69″ N15° 3′4.03″ E3
Eu9Zadar44° 7′60.00″ N15°13′0.00″ E5
Eu10Biograd43°55′60.00″ N15°26′60.00″ E8
Eu11Šibenik43°43′51.51″ N15°53′40.22″ E77
Eu12Split43°31′0.00″ N16°25′60.00″ E122
Eu13Makarska43°17′37.08″ N17° 1′10.94″ E52
Eu14Opuzen43°1′0.00″ N17°34′0.00″ E2
Eu15Orebić42°58′27.88″ N17°10′34.72″ E6
Eu16Ston42°49′60.00″ N17°41′60.00″ E2
Eu17Dubrovnik42°38′60.00″ N18° 4′60.00″ E52
Steno-MediterraneanSt1Sutivan43°23′7.14″ N16°28′44.00″ E6
St2Hvar43°10′20.77″ N16°26′29.62″ E20
St3Komiža43°2′39.72″ N16°5′22.18″ E20
St4Vela Luka42°57′40.99″ N16°42′56.51″ E5
St5Korčula42°57′37.46″ N17°8′6.61″ E15
St6Mljet42°46′59.84″ N17°21′47.57″ E30
St7Lastovo42°46′0.00″ N16°53′60.00″ E186
Table 2. Bioclimatic indices used in this study.
Bioclimatic Indices FormulaReference
Annual potential evapotranspiration (PET) 16 N m ( 10 T i _ I ) a I = i m = ( T i _ 5 ) 1.5
a = 6.7 × 10⁻⁷ × I3 − 7.7 × 10⁻⁵ × I2 + 1.8 × 10⁻² × I + 0.49
[38]
Dry season water deficit (DSWD) Pi—PETi[39]
Length of the dry season (LDS)Pi < 2Ti[40,41]
Ombro-evapotranspiration index (Ioe)P/PET[42]
Lang’s rain factor (LRF)P/T[43]
De Martonne aridity index (DMI)P/(T + 10)[44]
Continentality index (CONTINENTY)Tmax−Tmin[42]
Ellenberg Index (EQ)(Tmax/P)1000[45]
Ombrothermic Index (Io)(Pp/Tp)10[42]
Ombrothermic index of the summer quarter (Iosq)(P6–8/T6–8)/10[46]
Thermicity Index (It)(T + m + M) 10[46]
Emberger’s pluviothermic quotient (Q2) 2000 × P ( M + m + 546.24 ) × ( M m ) [47]
Tmax—mean air temperature of the hottest month (°C); Tmin—mean air temperature of the coldest month (°C); P—annual precipitation (mm); Pp—yearly positive precipitation (mm) (total average precipitation of those; months whose average temperature is higher than 0 °C); Tp—yearly positive air temperature (°C) (sum of the monthly average temperature of those months whose average temperature is higher than 0 °C); m—average minimum air temperature of the coldest month of the year (°C); M—average maximum air temperature of the warmest month of the year (°C); Ti—mean temperature of the given month (°C); Pi—precipitation of the given month (mm); Nm—monthly adjustment factor related to hours of daylight (-); I—heat index for the year (-); PET—annual potential evapotranspiration: sum of the monthly potential evapotranspiration (mm); PETi—potential evapotranspiration of the given month (mm); T—mean annual air temperature (°C).
Table 3. Descriptive statistics and comparison of bioclimatic parameters and indices in the area of different vegetation zones in forest stands of the Mediterranean vegetation belt on the eastern Adriatic coast.
Climate Element/IndexSub-MediterraneanEu-MediterraneanSteno-Mediterranean
MinMaxMean ± Std. Dev.MinMaxMean ± Std. Dev.MinMaxMean ± Std. Dev.
T13.0015.3013.93 ± 1.17 a 15.5017.4015.23 ± 0.96 b15.9017.5016.19 ± 0.51 c
m−1.66.36.09 ± 3.95 a 2.78.410.69 ± 2.69 b3.28.312.50 ± 1.11 b
M26.0031.8023.56 ± 5.88 a 28.232.420.33 ± 3.03 a28.431.820.37 ± 0.75 a
P730.51971.61233.41 ± 213.05 a 486.61019.5933.84 ± 149.58 b383.71031.9721.22 ± 119.82 c
PET674.47817.77801.76 ± 48.02 a784.82830.15847.95 ± 37.33 b791.78829.54880.40 ± 21.75 b
DSWD−282.22−42.67−215.50 ± 61.45 a−439.14−183.53−325.47 ± 53.69 b−487.02−168.96−440.22 ± 23.87 c
LDS030.57 ± 0.64 a171.58 ± 0.61 b283.14 ± 0.37 c
Ioe 28.1759.9139.02 ± 8.21 a7.5818.6725.64 ± 4.81 b6.9218.6719.40 ± 3.48 c
LRF 87.50145.2088.78 ± 15.68 a30.4164.9461.31 ± 9.20 b23.5464.9044.83 ± 6.85 c
DMI4.266.9651.55 ± 8.77 a1.563.3136.97 ± 5.60 b1.223.3227.71 ± 4.30 c
CONTINETY2.8022.6018.73 ± 0.51 a16.021.717.74 ± 0.90 b15.0018.9016.95 ± 0.95 c
EQ11.1619.7919.79 ± 2.89 a24.4253.1827.08 ± 4.24 b23.4563.3335.46 ± 4.69 c
Io6.0810.106.16 ± 1.08 a2.114.524.25 ± 0.63 b1.634.513.11 ± 0.47 c
Iosq0.240.880.30 ± 0.07 a0.030.260.20 ± 0.04 b0.030.300.11 ± 0.01 c
It393.00464.00435.87 ± 40.75 a467.00523.00440.63 ± 75.37 a480.00527.00490.70 ± 15.01 b
Q244.2378.47163.96 ± 44.32 a22.2448.21122.67 ± 20.81 b13.9740.7498.97 ± 17.20 b
a,b,c Values within rows with different superscript letters differ significantly (p < 0.05); T—mean annual temperature (°C), m—average minimum temperature of the coldest month (°C), M—average maximum temperature of the warmest month (°C), P—mean annual precipitation (mm), PET—annual accumulated potential evapotranspiration (mm), DSWD—dry season water deficit (mm), LDS—length of the dry season (months), Ioe—ombro-evapotranspiration index, LRF—Lang’s rain factor, DMI—de Martonne aridity index, CONTINENTY—continentality index, EQ—Ellenberg index, Io—ombrothermic index, Iosq—ombrothermic index of the summer quarter, It—thermicity index, Q2—Emberger’s pluviothermic quotient.
Publisher’s Note: MDPI stays neutral with regard to jurisdictional claims in published maps and institutional affiliations.

