Article

Effects of Home Office Order on Ambient Particulate Matters Assessed by Interrupted-Time-Series Analysis: Evidence from Shanghai, China

1
Department of Environmental Health, Shanghai Municipal Center for Disease Control and Prevention, Shanghai 200032, China
2
School of Public Health, Fudan University, Shanghai 200032, China
*
Authors to whom correspondence should be addressed.
Atmosphere 2022, 13(10), 1659; https://doi.org/10.3390/atmos13101659
Submission received: 25 July 2022 / Revised: 23 September 2022 / Accepted: 8 October 2022 / Published: 12 October 2022
(This article belongs to the Special Issue Air Quality, Health and Environmental Impact Assessment)

Abstract

:
Coronavirus Disease 2019 (COVID-19) has caused a pandemic globally since its outbreak in 2019. As an important port city with prosperous foreign trade, Shanghai has been under severe pressure to prevent the input of COVID-19. With this in mind, solid policies and measures have always been taken in Shanghai to control the input of COVID-19 strictly. In March 2022, the SARS-CoV-2 Omicron variant swept Shanghai, and then the home office order was rapidly carried out in most of the districts. This article focuses on quantifying the changes in concentrations of PM10 and PM2.5 in Shanghai after implementing the home office order and exploring the spatial-distribution characteristics and time trend of the impact of the home office order on airborne particulate matters (PMs) through an interrupted-time-series (ITS) analysis. This study found that PM10 and PM2.5 decreased by 31.40 μg/m3 (p = 0.028) and 10.33 μg/m3 (p = 0.276), respectively, with the fastest decrease speed in the first 10 days of the home office order. Meanwhile, the changes in PM concentrations in eastern areas such as Fengxian District and Chongming District are less than those in central and western areas of Shanghai. Therefore, it can be concluded that implementing the home office order for 10 days could effectively cut down PM concentrations, and the reduction values can be affected by spatial difference and time factor.

1. Introduction

Since the outbreak of Coronavirus Disease 2019 (COVID-19) in December 2019, COVID-19 has been widespread worldwide. According to the World Health Organization (WHO; https://covid19.who.int.html, (accessed on 26 August 2022)), as of 26 August 2022, a total of 596,873,121 cases and a total of 6,459,684 deaths of COVID-19 were reported globally, and this has deeply affected the healthcare system and global socioeconomic balances [1]. As a port city with prosperous foreign trade in China, Shanghai has always faced colossal pressure to prevent the overseas input of COVID-19. Unfortunately, the omicron variant of COVID-19 swept through Shanghai in late February 2022, causing a sharp increase in the number of infected persons in a short time. According to the Shanghai Municipal Health Commission, as of 4 May 2022, 601,942 cases have been identified, including 547,056 asymptomatic carriers and 503 deaths [2]. A series of strict public health measures have been taken throughout the city to curb the spread of COVID-19 and achieve zero increase in community transmission as soon as possible. Since Mar 17, the home office order has been carried out in a majority of districts in Shanghai. The epidemic of COVID-19 has been effectively controlled after implementing the home office order for 60 days. Shanghai has won the battle to defend itself against the COVID-19 epidemic. We also observed that the home office order, which is challenging due to economic pressures, was effectively implemented for 60 days in Shanghai, which may provide us with a valuable opportunity to study the impact of limiting human activities on improving air quality.
Several studies have suggested that air pollution is the most important environmental risk factor for morbidity and mortality, affecting nearly every organ in the body, and causing or contributing to many illnesses, especially respiratory and cardiopulmonary diseases [3,4,5]. Particulate matter (PM), the most toxic air pollutant, has attracted our wide attention. Scientific evidence displayed that PM elicited inflammatory injury, oxidative damage, and other adverse biological effects. Aerodynamic particles less than 10 μm (PM10) and 2.5 μm (PM2.5) in diameter are often used to reflect the level of PM in the air. According to the Global Burden of Disease (GBD) project report, ambient PM2.5 contributed to 4.2 million deaths worldwide in 2015 [6]. In China, PM also causes a heavy disease burden every year. As we all know, PM10 and PM2.5 are closely related to human activities and mainly come from fuel combustion, such as thermal power, industrial production, and transportation, including vehicle emissions [7,8,9,10]. Thus, global efforts have been taken to reduce the level of PM, including reducing fossil fuel burning, controlling industrial smoke and dust emissions, reducing construction dust pollution, restricting traffic, and increasing green space. Under the implementation of these measures, the concentration of airborne PM in developed countries has significantly dropped in recent years. In developing countries, such as India and China, the concentration of airborne PM is still relatively high. Previous studies have displayed that a heavy toll on health damage and economic burden, and climate change led by PM have been found in China, including Shanghai. That is to say, PM2.5 is, so far, one of the major air pollutants in Shanghai. Reducing the level of PM in Shanghai remains an important public health task. Although some researchers have indicated that limiting human activity could reduce the levels of PM, the decreased value and time trend are certainly affected by regional differences. This study aimed to explore whether the implementation of the home office order could effectively lower the level of airborne PM in all districts of Shanghai and to investigate the time trend of this effect, which may provide some evidence to improve the air quality.

2. Materials and Methods

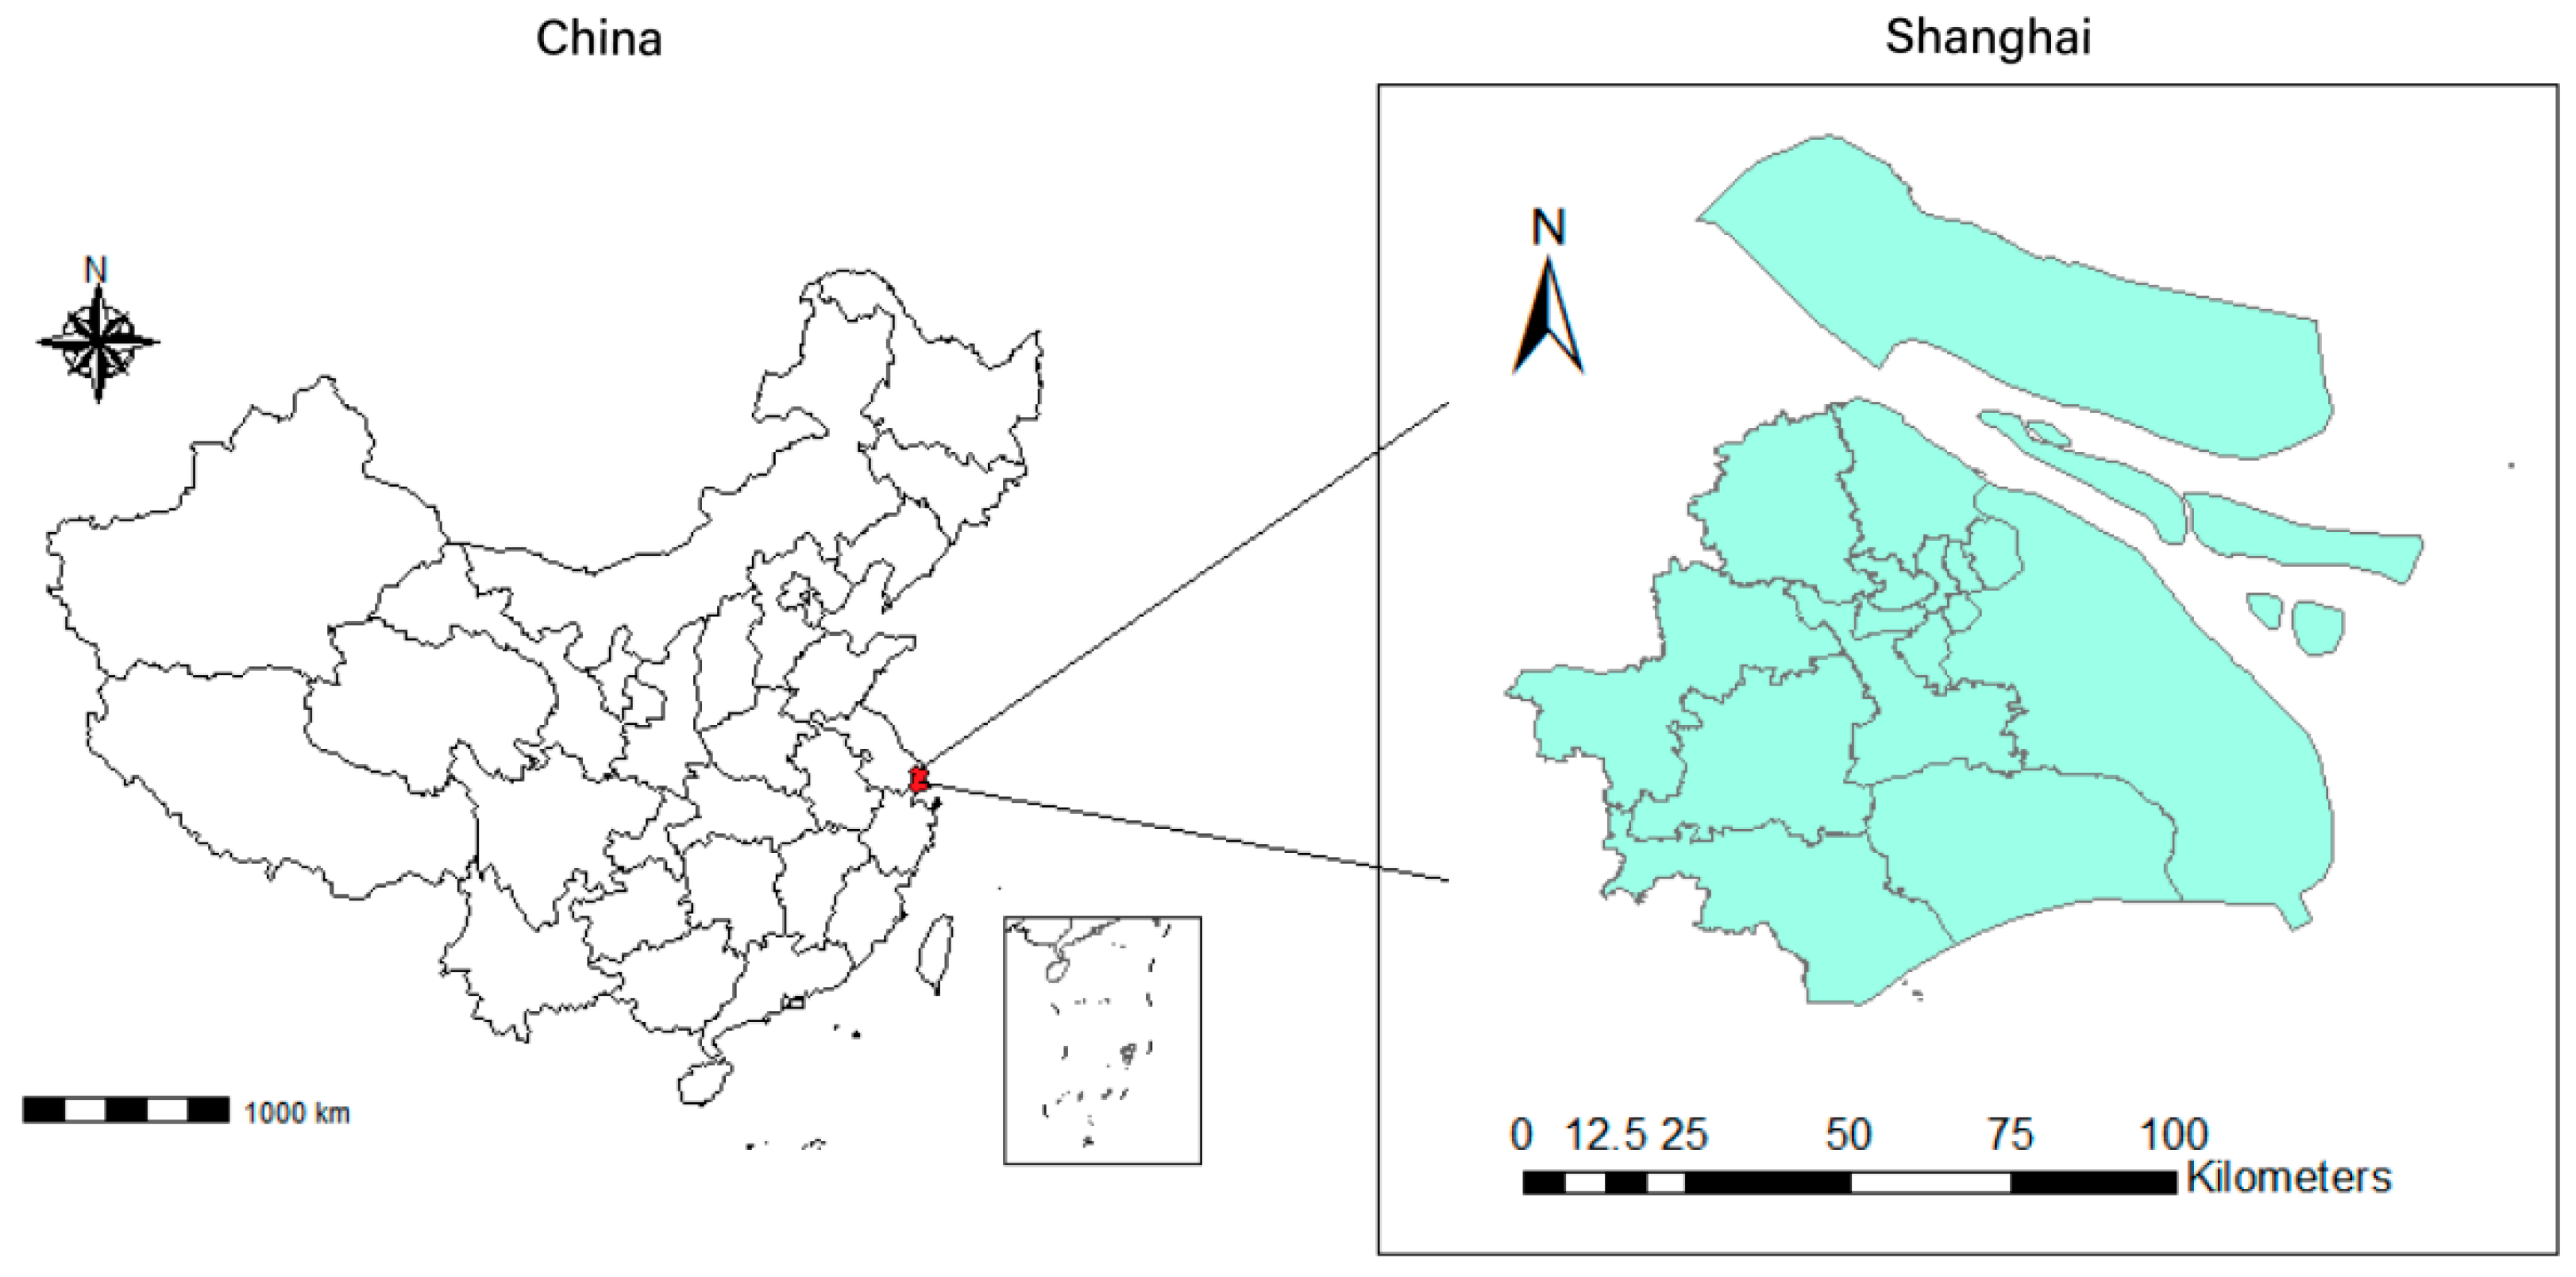
2.1. Data Sources and Study Period

Shanghai is located in Eastern China, with the East China Sea in the east and Jiangsu provinces and Zhejiang provinces in the west. It is an important port city in China and a global financial center. The location of Shanghai, China, is shown in Figure 1. The daily average concentrations of PM10 and PM2.5 in Shanghai were collected from the website of Shanghai Ecological Environment (https://sthj.sh.gov.cn/index.html, (accessed on 20 May 2022)). In addition, the study period was divided into three stages, and each stage lasted 60 days. The first stage, from 17 Mar 2021 to 15 May 2021, was used to calculate the year-on-year value. The second stage, from 16 Jan 2022 to 16 Mar 2022, was the period before the implementation of the home office order and was used to calculate the ring-on-year value. The third stage, from 17 Mar 2022 to 15 May 2022, was the period during the implementation of the home office order.

2.2. Statistics Analysis
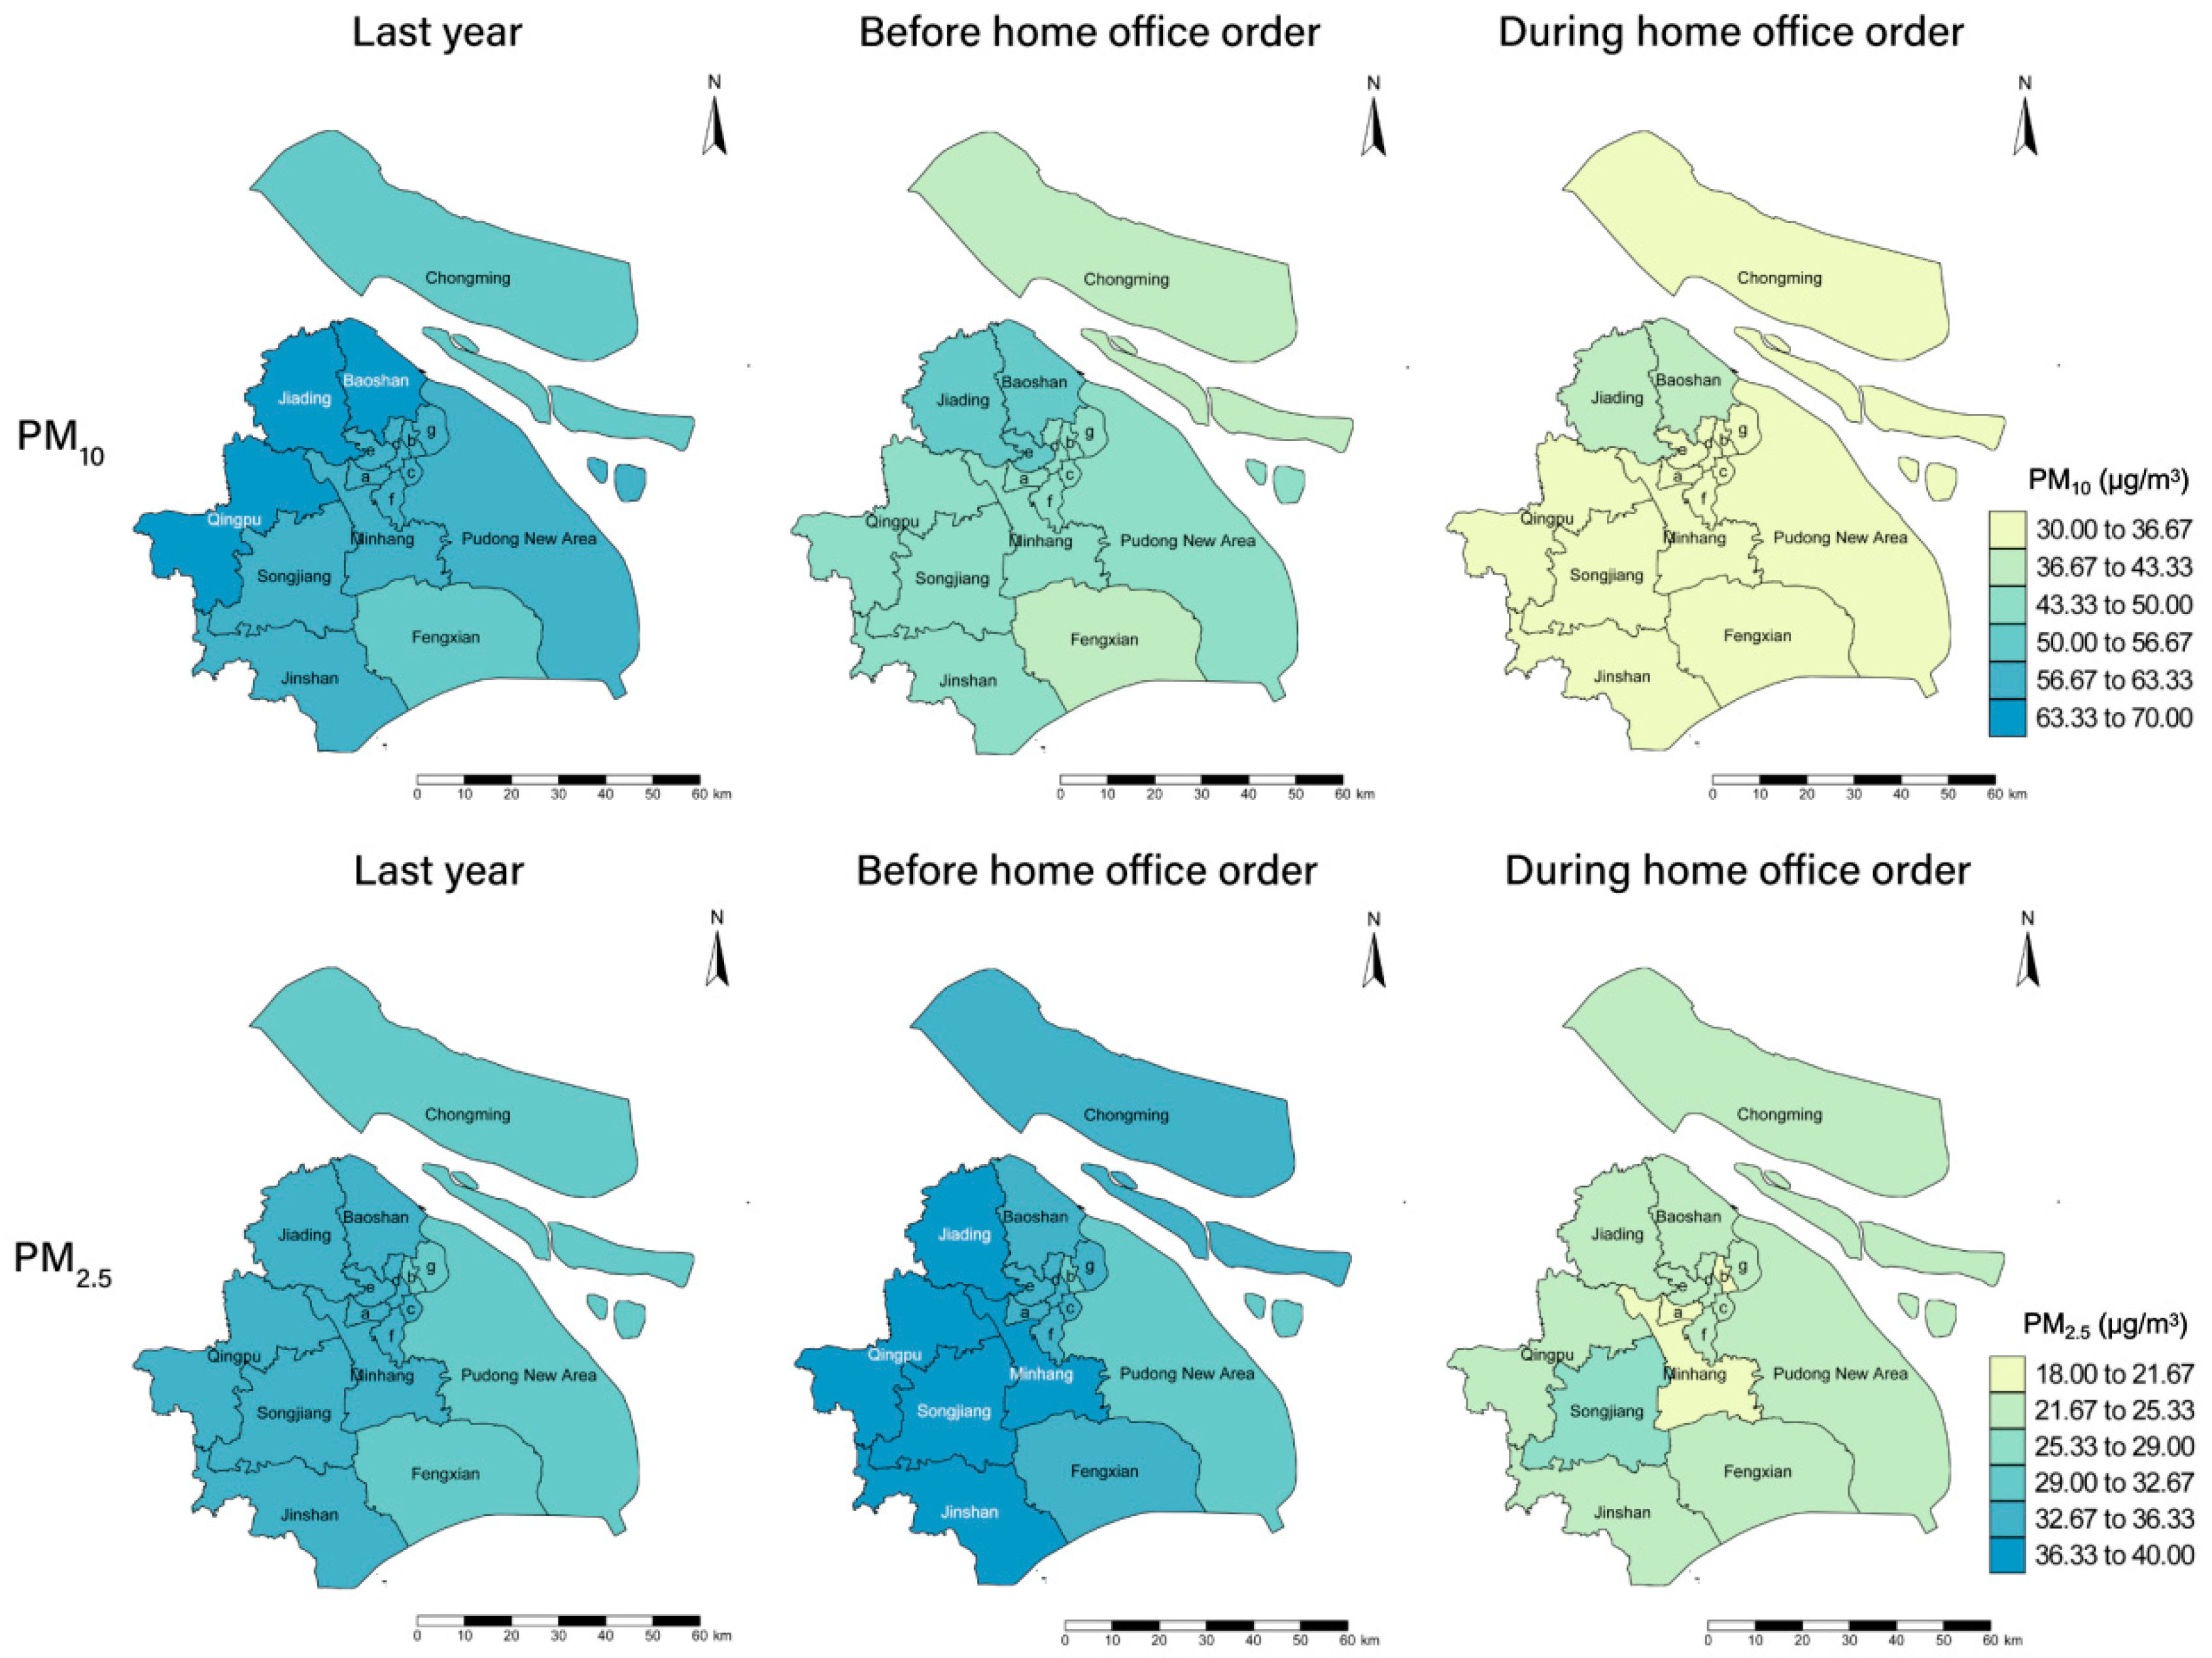
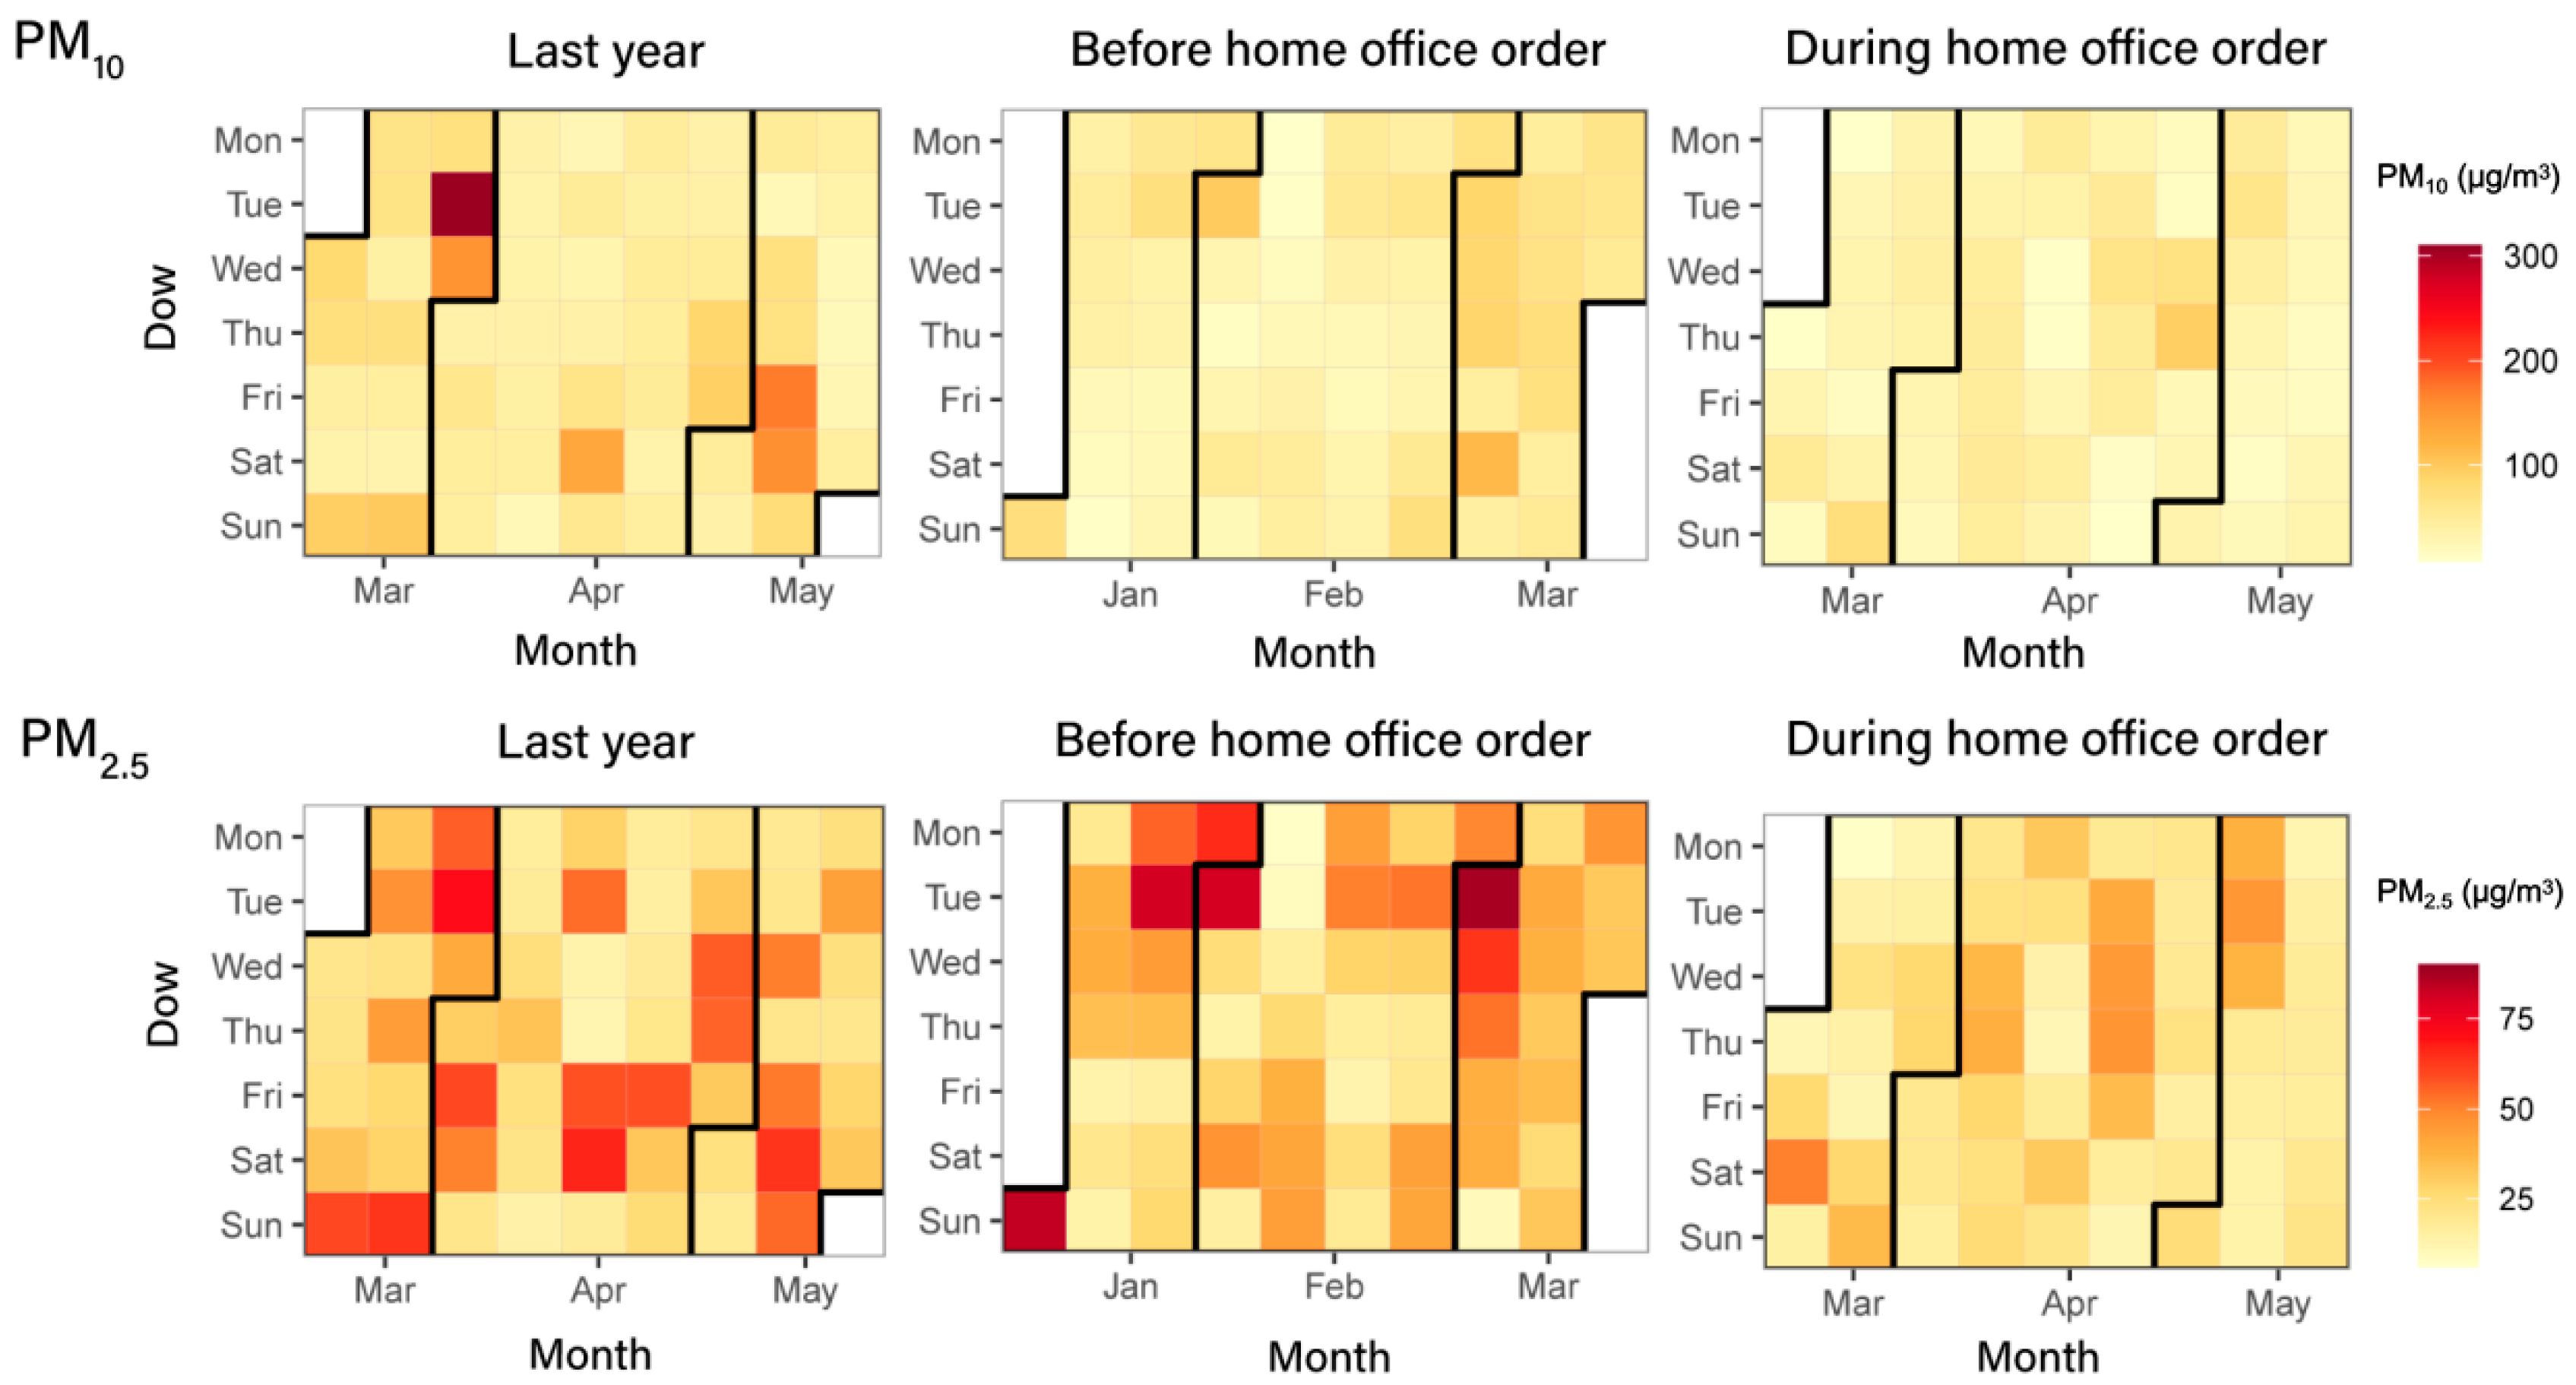
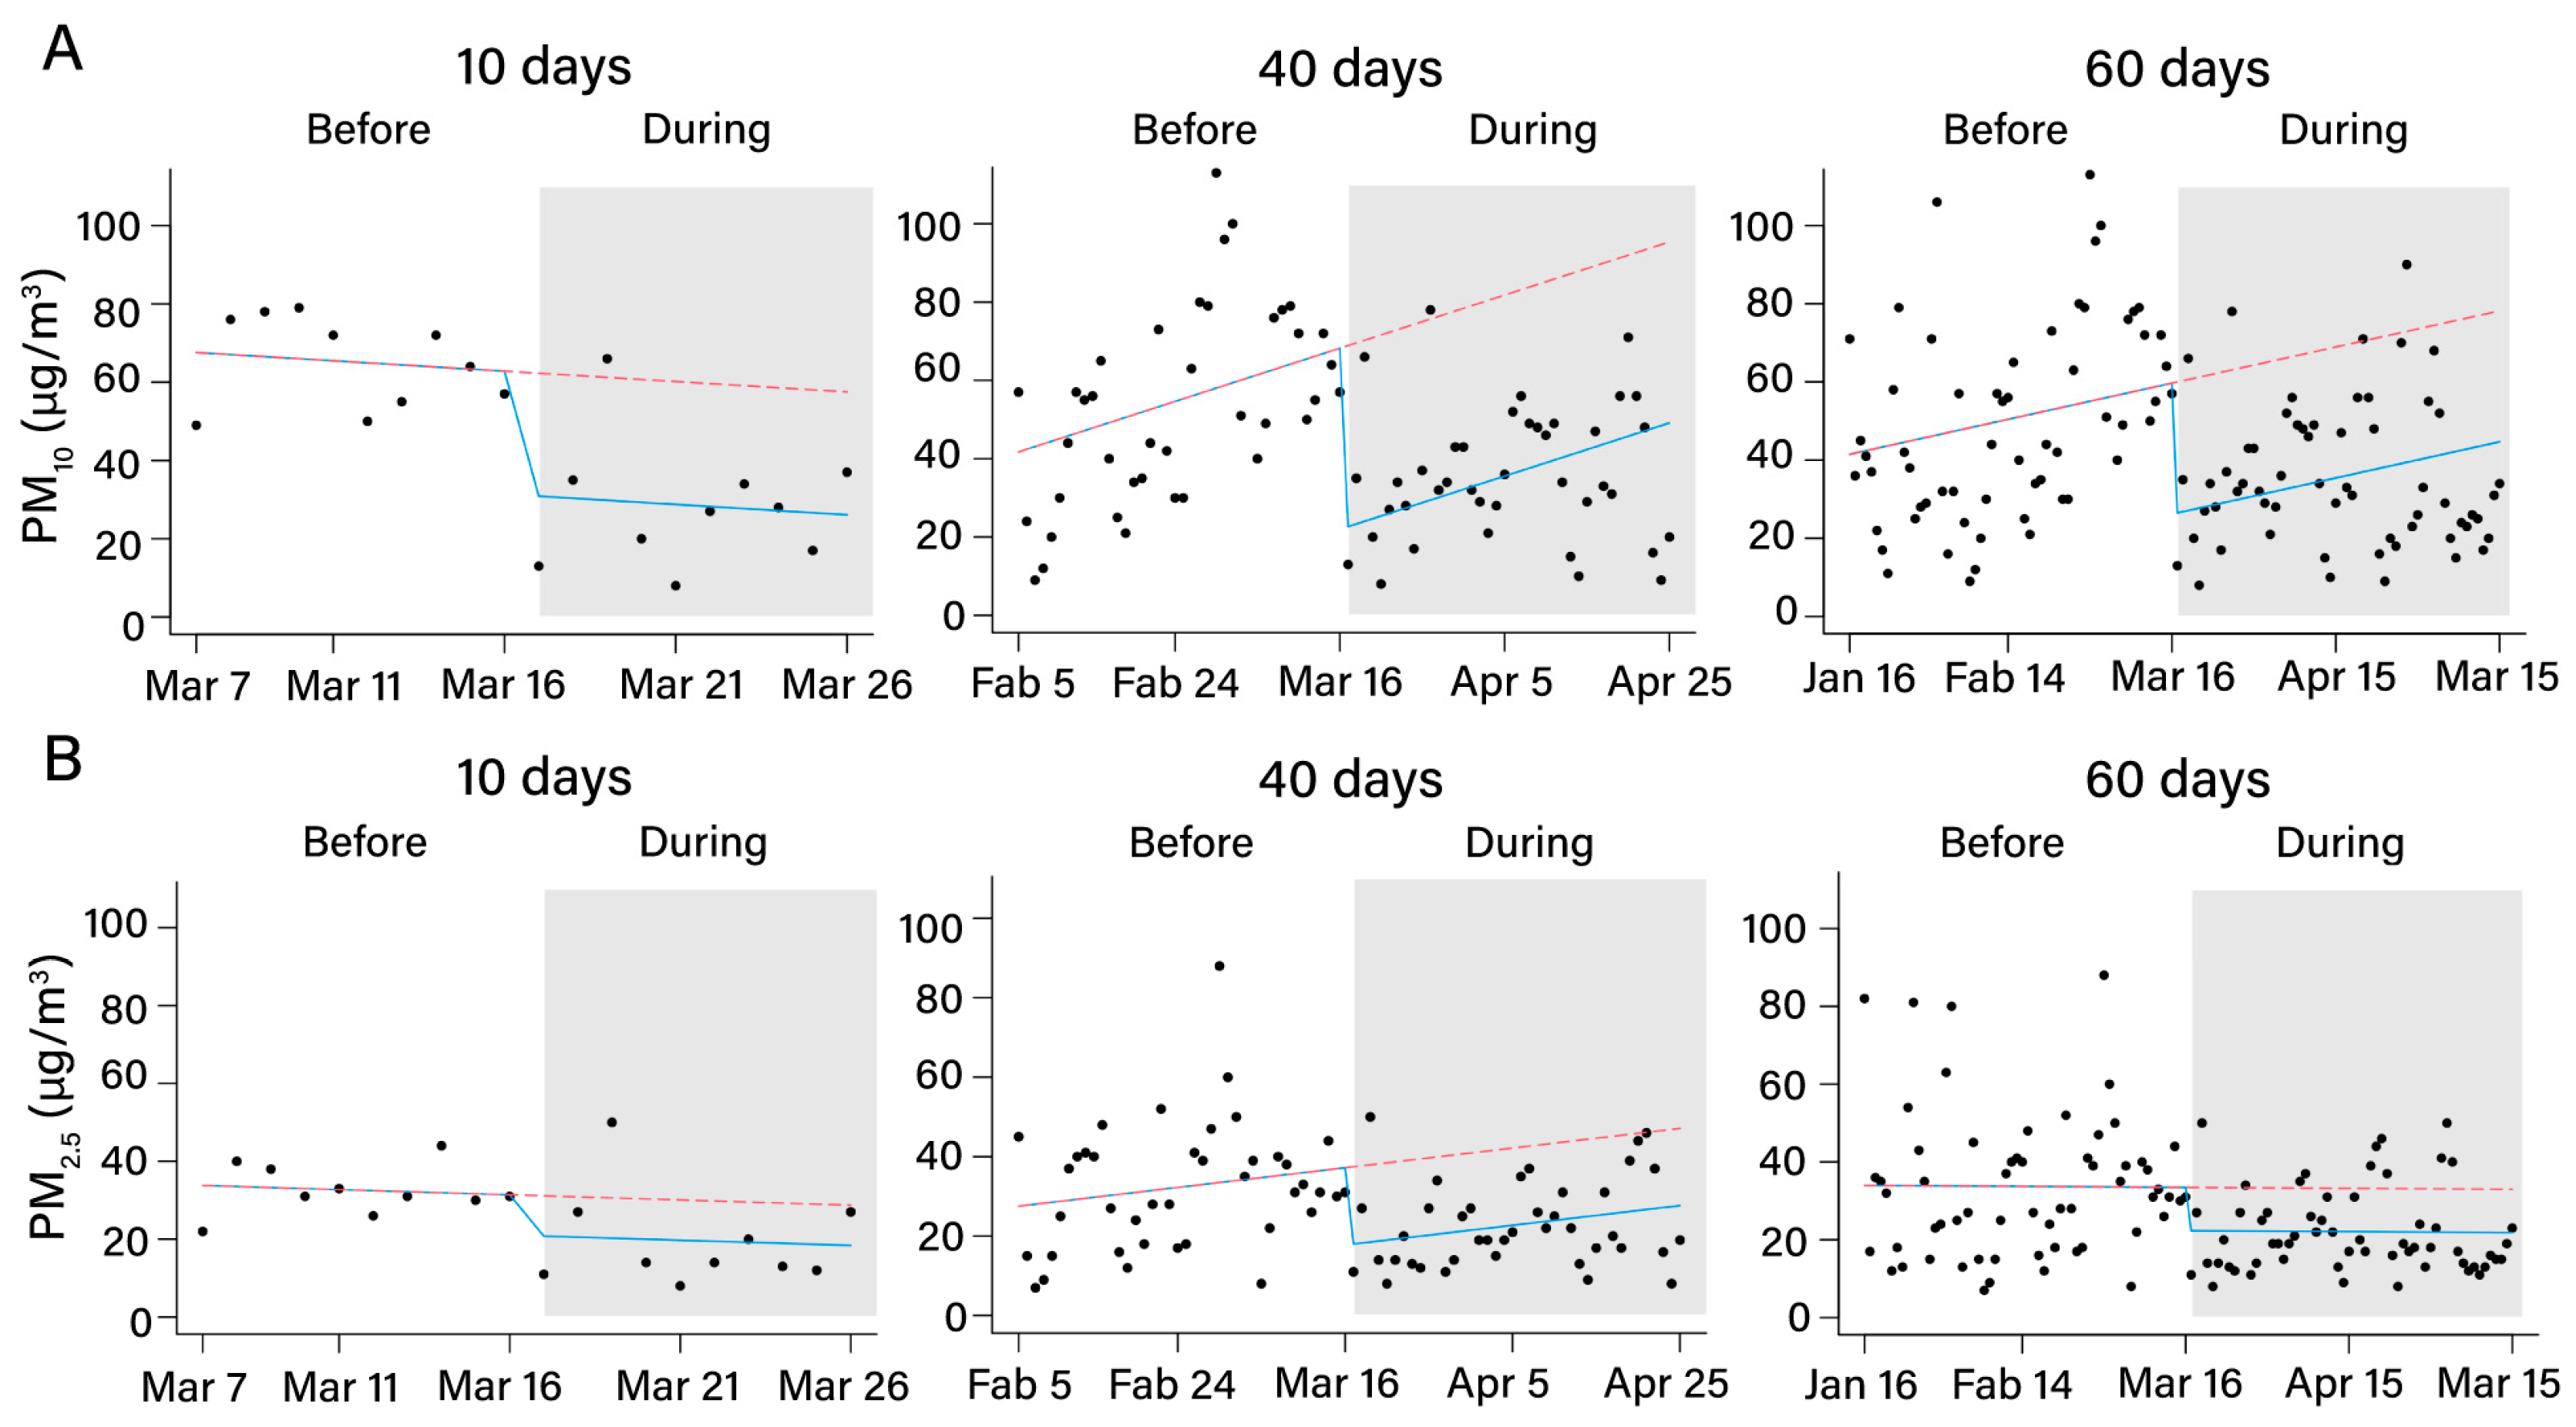
The interrupted-time-series (ITS) analysis is a method that uses segmented linear regression to evaluate the changes in levels and trends before and after the intervention point. This method has been widely used in evaluating public health interventions abroad, such as vaccination, the smoking ban, and cycle-helmet legislation [11,12,13,14]. In this study, an ITS analysis was used to analyze the changes in PM concentrations in Shanghai after the implementation of the home office order for different times, including 10 days, 25 days, 40 days, and 60 days. The regression model was specified as follows:
Yt = β0 + β1X1 + β2X2 + β1β2X3
Yt is the PM concentration; X1 is the time; X2 refers to whether home office order is implemented; X3 is the synthetic effects of X1 and X2; β0 estimates the baseline level of PM concentration before this study; β1 estimates the time trend of intervention; and β2 estimates the changes in PM levels after implementing the home office order.
The Durbin–Watson (DW) statistics indicated no significant autocorrelation in our time series. Since the data did not follow a normal distribution, a generalized linear model was used for regression. In order to maximize statistical power, the Akaike information criterion (AIC) was used to compare with different models and to select the regression terms entering into the equation. The level-change model was found more suitable for analyzing the changes in PM concentrations before and during the implementation of the home office order. The R software 4.3.1 (Auckland, New Zealand) was used for all statistical analyses.

3. Result

Table 1 shows the changes in daily PM10 concentrations before and during the implementation of the home office order. During the implementation of the home office order, the daily PM10 concentrations of 16 districts in Shanghai ranged from 6 to 107 μg/m3, and the average values of each district ranged from 30.27 to 37.56 μg/m3 with the highest of Baoshan District and the lowest of Chongming District. Before and during the implementation of the home office order, the average decrease of daily PM10 concentrations in Shanghai was 12.57 μg/m3 (with 27.06%; p < 0.01). During the implementation of the home office order and the same period last year, the average decrease of daily PM10 concentrations in Shanghai was 26.94 μg/m3 (with 44.29%; p < 0.001). Compared with the period before the implementation of the home office order, the daily average PM10 concentrations of each district dropped from 8.40 to 14.52 μg/m3 during the home office order. The highest reduction was seen in the Putuo District and Huangpu District, with a decrease of 14.52 μg/m3 (p < 0.01) and 14.52 μg/m3 (p < 0.01), respectively, and the lowest reduction was in the Chongming District, where the daily PM10 concentrations only dropped by 8.40 μg/m3 (p < 0.01) during the home office order. Compared with the PM10 concentrations in the same period last year, the daily PM10 concentrations in all districts decreased during the implementation of the home office order. The decrease was in the range of 20.17–30.62 μg/m3, and the highest and the lowest reduction were in the Baoshan District and Fengxian District, respectively.
Table 2 shows the changes in daily PM2.5 concentrations before and during the implementation of the home office order. During the implementation of the home office order, the daily PM2.5 concentrations of 16 districts in Shanghai ranged from 6 to 74 μg/m3, and the average of each district ranged from 19.77 to 26.42 μg/m3, with the highest seen in the Songjiang District and the lowest in the Changning District. The average decrease of daily PM2.5 concentrations in Shanghai before and during the implementation of the home office order was 12.04 μg/m3 (with 34.53%; p < 0.001), and the average decrease of daily PM2.5 concentrations during the implementation of the home office order and the same period last year was 10.90 μg/m3 (with 32.31%; p < 0.01). Compared with the period before the home office order, the average daily PM2.5 concentrations of each district decreased from 8.13 to 16.00 μg/m3 during the implementation of the home office order. The highest reduction was in the Minhang District, and the lowest was in the Chongming District. Compared with the PM2.5 concentrations in the same period last year, the daily PM2.5 concentrations of all districts decreased during the home office order. The decrease was in the range of 6.48–14.28 μg/m3, and the lowest and the highest reduction were in the Chongming District and Changning District, respectively.
In Figure 2, the spatial distribution maps of PM10 and PM2.5 in Shanghai at different periods were displayed. We found that the level of airborne PM in the eastern part of Shanghai is lower than that in the western and central areas, and the concentration of PM in the western part is the highest. During the home office period, the level of airborne PM in Shanghai decreased not only compared with the period before the home office order, but also with the same period last year. The change of airborne PM decreased more obviously in the west and the central areas during the home office period. Figure 3 shows the calendar heatmaps of daily PM concentration in Shanghai from 17 March 2021 to 15 May 2021 and from 16 February to 15 May 2022. It can also be observed that the levels of PM10 and PM2.5 during the implementation of the home office order were lower than before the home office period and the same period last year.
ITS analysis was used to analyze the changes in PM10 and PM2.5 concentrations before and during the implementation of the home office order. As shown in Figure 4, the solid line with white background represented the regression line before the implementation of the home office order. The solid line with a gray background represents the regression line during the implementation of the home office order, and the dotted line with the gray background represents the regression line without intervention. The changes in the regression line during the implementation of the home office order for 10 days, 40 days, and 60 days were visualized in Figure 4. Significant decreases were shown on March 17 that indicated the decline of daily PM10 and PM2.5 concentrations during the intervention. In Table 3, a decrease of 31.40 μg/m3 (p = 0.028), 33.70 μg/m3 (p = 0.014), 46.23 μg/m3 (p < 0.001), and 33.49 μg/m3 (p < 0.001) was found in PM10 concentrations after the intervention for 10 days, 25 days, 40 days, and 60 days, respectively. In addition, a decrease of 10.33 μg/m3 (p = 0.276), 16.35 μg/m3 (p = 0.038), 19.44 μg/m3 (p = 0.002), and 11.12 μg/m3 (p = 0.039) was found in PM2.5 concentrations after the intervention for 10 days, 25 days, 40 days, and 60 days, respectively.

4. Discussion

On 17 Mar 2022, the home office order was implemented in Shanghai to curb the epidemic of COVID-19 effectively. By May 15, the home office order had lasted for 60 days, bringing an opportunity to evaluate the effects of restricting human activities on air pollution. This study focused on quantifying the changes in PM concentrations after the implementation of the home office order and exploring the spatial distribution characteristics and time trend of the impact of the home office order on PM through an interrupted-time-series (ITS) analysis, which could provide some suggestions for policy making on air-quality improvement.
Ambient PM mainly comes from natural sources and human activities such as incomplete fuel combustion, including industrial production, thermal power generation, and vehicle emissions [15]. According to the Global Burden of Disease Study 2015, ambient PM is China’s fifth leading risk factor contributing to 1.1 million deaths in 2015 [6]. Reducing the level of PM remains an important public health task. This study demonstrated that the concentration of PM10 and PM2.5 decreased by an average of 12.57 μg/m3 (27.06%) and 12.04 μg/m3 (34.53%) during the implementation of the home office order for 60 days. However, there are some spatial differences in PM changes in Shanghai. Among them, central areas such as Changning District, Huangpu District, Putuo District, and Yangpu District, and western areas such as Minhang District, Baoshan District, and Qingpu District showed more significant decreases in PM concentrations. In contrast, those in the eastern part of Shanghai, such as Fengxian District and Chongming District, have a slightly lower decrease, which may be related to their high population density and climate factor. In the western area of Shanghai, some industries are closed during the home office period. Notably, one study suggested that when the steel mill was closed, winter PM10 concentrations were half as low as when it was open [16]. In addition, the PM in the western region of Shanghai is also affected by the surrounding area, such as Jiangsu Province and Zhejiang Province, while the PM in the eastern region is easily affected by the wind from the East China Sea. At the same time, the population density of Fengxian District and Chongming District is lower than that of the central area, and less PM is generated due to human activities, and the high greening rate contributed to the adsorption of PM. As a result, restrictions on human activity by implementing the home office order in Fengxian District and Chongming District obtained less PM reduction than in other areas of Shanghai.
Massive research has observed similar trends in atmospheric PM concentrations during lockdown due to the COVID-19 pandemic, but the reduced values were not identical. Susanta Mahato et al. showed a 91.28 μg/m3 (51.85%) and 42.76 μg/m3 (53.11%) decrease in PM10 and PM2.5 concentrations, respectively, during the lockdown amid the COVID-19 pandemic [17]. Samsuri Abdullah et al. showed a decrease in PM2.5 concentration that ranged from 0.6% to 58.5% during the lockdown amid the COVID-19 pandemic [18]. However, He et al. showed a 13.9 μg/m3 (17%) decrease in PM2.5 concentration during the lockdown amid the COVID-19 pandemic [19]. On top of that, Rui Bao et al. showed a 21.79 μg/m3 (13.66%) and 10.30 μg/m3 (5.93%) decrease in PM10 and PM2.5 concentrations, respectively, during the lockdown [20]. These differences are probably caused by the different duration of the lockdown and different baseline concentrations of air pollutants.
It is widely known that PM concentration can be affected by climate factors. Compared with the PM level in the same period last year, the level of PM during the home office period also decreased significantly, which partly excluded the confounding effect of climate factors. At the same time, we also found that the decrease of PM10 between the home office period and the same period last year is more significant than the decrease between before and after the implementation of the home office order, while PM2.5 demonstrated the opposite trend. These results indicated that the improvement of the home office measures on PM10 is more significant than that on PM2.5. This phenomenon seems contrary to Table 1 and Table 2 but consists of the ITS analysis results in Figure 4 and Table 3. We can see from Figure 4 and Table 3 that both PM10 and PM2.5 decreased after the implementation of the home office order, but PM10 decreased more significantly. This difference may be related to the source discrepancy between the two. PM10 mainly comes from direct emissions, but the source of PM2.5 is more complicated.
By analyzing the time trend of PM change, we observed that implementing the home office order for about 10 days can effectively reduce PM10 levels (31.40 μg/m3; p = 0.028). With the increase of time, the reduction effect gradually accumulates. The reduction approaches the maximum value in about 40 days and then enters a dynamic equilibrium state. However, the reduction of PM2.5 appeared later, which occurred about 25 days after the implementation of the home office order. Meanwhile, the reduction of PM2.5 was close to the maximum value in about 40 days. This time trend may be related to the control measures implemented in Shanghai. When the home office order has been implemented for 60 days, the rate of decline in PM levels has eased, and airborne PM10 and PM2.5 levels have significantly decreased by 33.49 μg/m3 and 11.12 μg/m3 (p < 0.001 and p = 0.039). A study by He et al. demonstrated that an increase of 10 μg/m3 in PM10 and PM2.5 was associated with a 4.27 and 2.97 person-years increase for Years of Life Lost (YLL), respectively [21]. Therefore, it can be estimated that implementing a home office order for 60 days in Shanghai may prevent over 10 person-years loss, which has important public health implications.

5. Conclusions

In this study, we explored the spatial distribution characteristics and time trend of the impact of the home office order on airborne PM through ITS analysis. The study indicated that the home office order could effectively reduce the level of airborne PM by 10–40 μg/m3, especially in the central and western areas of Shanghai. In addition, the impact of the home office order on PM10 does not precisely correspond to PM2.5. The decreasing effect on PM10 is more significant than that on PM2.5. Regarding the time trend, the level of airborne PM decreased the fastest in the first 10 days of the home office order, and then it gradually weakened. These conclusions may provide some reference for us to formulate air-improvement measures.

Author Contributions

L.T., conceptualization, methodology, searching, statistics analysis, investigation, visualization, and writing—original draft; Y.L., searching, statistics analysis, and editing; Y.R., editing and data curation; H.X., editing and data curation; F.H., editing, data curation; H.Q. and S.S., conceptualization, funding acquisition, supervision, and writing—review and editing. All authors have read and agreed to the published version of the manuscript.

Funding

This study was funded by the Shanghai 3-year Public Health Action Plan (Grant number: GWV-10.1-XK11).

Institutional Review Board Statement

Not applicable.

Informed Consent Statement

Not applicable.

Conflicts of Interest

The authors declare no conflict of interest.

References

  1. Chilamakuri, R.; Agarwal, S. COVID-19: Characteristics and Therapeutics. Cells 2021, 10, 206. [Google Scholar] [CrossRef] [PubMed]
  2. Zhang, X.; Zhang, W.; Chen, S. Shanghai’s life-saving efforts against the current omicron wave of the COVID-19 pandemic. Lancet 2022, 399, 2011–2012. [Google Scholar] [CrossRef]
  3. Schraufnagel, D.E.; Balmes, J.R.; Cowl, C.T.; De Matteis, S.; Jung, S.H.; Mortimer, K.; Perez-Padilla, R.; Rice, M.B.; Riojas-Rodriguez, H.; Sood, A.; et al. Air Pollution and Noncommunicable Diseases: A Review by the Forum of International Respiratory Societies’ Environmental Committee, Part 1: The Damaging Effects of Air Pollution. Chest 2019, 155, 409–416. [Google Scholar] [CrossRef] [PubMed] [Green Version]
  4. Schraufnagel, D.E.; Balmes, J.R.; Cowl, C.T.; De Matteis, S.; Jung, S.H.; Mortimer, K.; Perez-Padilla, R.; Rice, M.B.; Riojas-Rodriguez, H.; Sood, A.; et al. Air Pollution and Noncommunicable Diseases: A Review by the Forum of International Respiratory Societies’ Environmental Committee, Part 2: Air Pollution and Organ Systems. Chest 2019, 155, 417–426. [Google Scholar] [CrossRef]
  5. Cohen, A.J.; Brauer, M.; Burnett, R.; Anderson, H.R.; Frostad, J.; Estep, K.; Balakrishnan, K.; Brunekreef, B.; Dandona, L.; Dandona, R.; et al. Estimates and 25-year trends of the global burden of disease attributable to ambient air pollution: An analysis of data from the Global Burden of Diseases Study 2015. Lancet 2017, 389, 1907–1918. [Google Scholar] [CrossRef] [Green Version]
  6. GBD Risk Factors Collaborators. Global, regional, and national comparative risk assessment of 79 behavioural, environmental and occupational, and metabolic risks or clusters of risks, 1990–2015: A systematic analysis for the Global Burden of Disease Study 2015. Lancet 2016, 388, 1659–1724. [Google Scholar] [CrossRef] [Green Version]
  7. Chen, D.; Liu, X.; Lang, J.; Zhou, Y.; Wei, L.; Wang, X.; Guo, X. Estimating the contribution of regional transport to PM (2.5) air pollution in a rural area on the North China Plain. Sci. Total Environ. 2017, 583, 280–291. [Google Scholar] [CrossRef]
  8. Fu, S.; Gu, Y. Highway toll and air pollution: Evidence from Chinese cities. Soc. Sci. Electron. Public 2016, 83, 32–49. [Google Scholar]
  9. Cole, M.A.; Elliott, R.; Shimamoto, K. Industrial characteristics, environmental regulations and air pollution: An analysis of the UK manufacturing sector. J. Environ. Econ. Manag. 2005, 50, 121–143. [Google Scholar] [CrossRef]
  10. Lin, C.Y.C.; Zhang, W.; Umanskaya, V.I. The Effects of Driving Restrictions on Air Quality: São Paulo, Bogotá, Beijing, and Tianjin. In Proceedings of the 2011 Annual Meeting, Pittsburgh, PA, USA, 24–26 July 2011. [Google Scholar]
  11. Degli, E.M.; Spreckelsen, T.; Gasparrini, A.; Wiebe, D.J.; Bonander, C.; Yakubovich, A.R.; Humphreys, D.K. Can synthetic controls improve causal inference in interrupted time series evaluations of public health interventions? Int. J. Epidemiol. 2021, 49, 2010–2020. [Google Scholar] [CrossRef] [PubMed]
  12. Dennis, J.; Ramsay, T.; Turgeon, A.F.; Zarychanski, R. Helmet legislation and admissions to hospital for cycling related head injuries in Canadian provinces and territories: Interrupted time series analysis. BMJ 2013, 346, f2674. [Google Scholar] [CrossRef] [PubMed]
  13. Bernal, J.L.; Cummins, S.; Gasparrini, A. Interrupted time series regression for the evaluation of public health interventions: A tutorial. Int. J. Epidemiol. 2017, 46, 348–355. [Google Scholar] [CrossRef]
  14. Wollschläger, D.; Auvinen, A.; Blettner, M.; Zeeb, H. Methodological considerations for interrupted time series analysis in radiation epidemiology: An overview. J. Radiol. Prot. 2021, 41, 609–618. [Google Scholar] [CrossRef]
  15. Niu, Y.; Chen, R.; Kan, H. Air Pollution, Disease Burden, and Health Economic Loss in China. Adv. Exp. Med. Biol. 2017, 1017, 233–242. [Google Scholar]
  16. Schraufnagel, D.E.; Balmes, J.R.; Matteis, S.D.; Hoffman, B.; Wuebbles, D.J. Health Benefits of Air Pollution Reduction. Ann. Am. Thorac. Soc. 2019, 16, 1478–1487. [Google Scholar] [CrossRef]
  17. Mahato, S.; Pal, S.; Ghosh, K.G. Effect of lockdown amid COVID-19 pandemic on air quality of the megacity Delhi, India. Sci. Total Environ. 2020, 730, 139086. [Google Scholar] [CrossRef] [PubMed]
  18. Abdullah, S.; Mansor, A.A.; Napi, N.N.L.M.; Mansor, W.N.W.; Ahmed, A.N.; Ismail, M.; Ramly, Z.T.A. Air quality status during 2020 Malaysia Movement Control Order (MCO) due to 2019 novel coronavirus (2019-nCoV) pandemic. Sci. Total Environ. 2020, 729, 139022. [Google Scholar] [CrossRef] [PubMed]
  19. He, G.; Pan, Y.; Tanaka, T. COVID-19, City Lockdowns, and Air Pollution: Evidence from China. medRxiv 2020. [Google Scholar] [CrossRef] [Green Version]
  20. Bao, R.; Zhang, A. Does lockdown reduce air pollution? Evidence from 44 cities in northern China. Sci. Total Environ. 2020, 731, 139052. [Google Scholar] [CrossRef] [PubMed]
  21. He, T.; Yang, Z.; Liu, T.; Shen, Y.; Fu, X.; Qian, X.; Zhang, Y.; Wang, Y.; Xu, Z.; Zhu, S.; et al. Ambient air pollution and years of life lost in Ningbo, China. Sci. Rep. 2016, 6, 22485. [Google Scholar] [CrossRef]
Figure 1. Location of Shanghai, China.
Atmosphere 13 01659 g001
Figure 2. The spatial distribution maps of daily PM10 and daily PM2.5 concentrations before and during the home office order in all districts of Shanghai: (a) Changning District, (b) Hongkou District, (c) Huangpu District, (d) Jingan District, (e) Putuo District, (f) Xuhui District, and (g) Yangpu District.
Atmosphere 13 01659 g002
Figure 3. The calendar heatmaps of daily PM10 and daily PM2.5 concentrations before and during implementing the home office order in Shanghai.
Atmosphere 13 01659 g003
Figure 4. ITS analysis of daily PM10 and daily PM2.5 concentrations after implementing the home office order for different times. (A): ITS analysis of daily PM10 concentrations after implementing the home office order for different times; (B): ITS analysis of daily PM2.5 concentrations after implementing the home office order for different times. The pink line indicates the trend of PM concentration without intervention and the blue line indicates the trend after intervention.
Atmosphere 13 01659 g004
Table 1. Variation of daily PM10 concentrations after implementing the home office order for 60 days.
DistrictLast Year
μg/m3
Before Home Office Order
μg/m3
During Home Office Order
μg/m3
Variation 1Variation 2
μg/m3%μg/m3%
Baoshan68.1851.4537.56−13.89 **−27.00−30.62 **−44.91
Changning60.5247.0534.23−12.82 **−27.24−26.28 ***−43.43
Chongming56.0838.6730.27−8.40 **−21.72−25.82 ***−46.03
Fengxian52.2742.3532.10−10.25 *−24.20−20.17 ***−38.58
Hongkou61.8248.6236.27−12.35 **−25.40−25.55 **−41.33
Huangpu63.1247.6233.57−14.05 **−29.51−29.55 ***−46.82
Jiading65.6350.0537.48−12.57−25.11−28.15 *−42.89
Jingan59.6045.9333.08−12.85 **−27.98−26.52 **−44.49
Jinshan57.2344.6333.18−11.45 **−25.65−24.05 ***−42.02
Minhang60.1344.1831.92−12.27 **−27.76−28.22 ***−46.92
Pudong New Area56.6746.4032.45−13.95 **−30.06−24.22 **−42.74
Putuo62.4850.8336.32−14.52 **−28.56−26.17 **−41.88
Qingpu64.6547.4334.18−13.25 **−27.93−30.47 ***−47.13
Songjiang60.2546.6833.18−13.50 **−28.92−27.07 **−44.92
Xuhui61.3745.5332.42−13.12 **−28.81−28.95 ***−47.18
Yangpu63.2545.9234.00−11.92 **−25.95−29.25 ***−46.25
Average60.8346.4633.89−12.57 **−27.06−26.94 ***−44.29
Note: 1 Variation of daily PM10 concentrations compared with before home office order; 2 variation of daily PM10 concentrations compared with last year; * p < 0.05, ** p < 0.01, and *** p < 0.001.
Table 2. Variation of daily PM2.5 concentrations after implementing the home office order for 60 days.
DistrictLast Year
μg/m3
Before Home Office Order
μg/m3
During Home Office Order
μg/m3
Variation 1Variation 2
μg/m3%μg/m3%
Baoshan33.6235.0222.67−12.35 **−35.27−10.95 *−32.57
Changning34.0533.2019.77−13.43 ***−40.46−14.28 ***−41.95
Chongming31.4233.0724.93−8.13 **−24.60−6.48 *−20.64
Fengxian31.6534.2322.42−11.82 ***−34.52−9.23 *−29.17
Hongkou31.4230.8321.48−9.35 ***−30.32−9.93 **−31.62
Huangpu33.9734.6022.66−11.94 ***−34.52−11.31 **−33.30
Jiading34.7336.7023.93−12.77 **−34.80−10.81 *−31.11
Jingan34.4734.9523.20−11.75 ***−33.62−11.27 **−32.69
Jinshan35.4236.9323.32−13.62 **−36.87−12.10 ***−34.16
Minhang34.8336.8220.82−16.00 ***−43.46−14.02 ***−40.24
Pudong New Area32.1732.1821.85−10.33 **−32.11−10.32 *−32.07
Putuo34.4035.3021.78−13.52 ***−38.29−12.62 **−36.68
Qingpu36.0737.4824.75−12.73 **−33.97−11.32 *−31.38
Songjiang35.4838.9526.42−12.53 **−32.18−9.07 *−25.55
Xuhui35.1834.9723.02−11.95 ***−34.18−12.17 *−34.58
Yangpu31.0032.9022.42−10.48 **−31.86−8.58−27.69
Average33.7434.8822.84−12.04 ***−34.53−10.90 **−32.31
Note: 1 Variation of daily PM2.5 concentrations compared with before the home office order; 2 variation of daily PM2.5 concentrations compared with last year; * p < 0.05, ** p < 0.01, and *** p < 0.001.
Table 3. Variation of daily PM10 and PM2.5 concentrations after the different duration of the home office order by ITS analysis.
10 Days25 Days40 Days60 Days
VariationpVariationpVariationpVariationp
PM10−31.400.028−33.700.014−46.23<0.001−33.49<0.001
PM2.5−10.330.276−16.350.038−19.440.002−11.120.039
Publisher’s Note: MDPI stays neutral with regard to jurisdictional claims in published maps and institutional affiliations.

