
Spatiotemporal Variations and Causes of Wind/Rainfall Erosion Climatic Erosivity in Qinghai Province, China

Abstract
:1. Introduction
2. Data and Methods
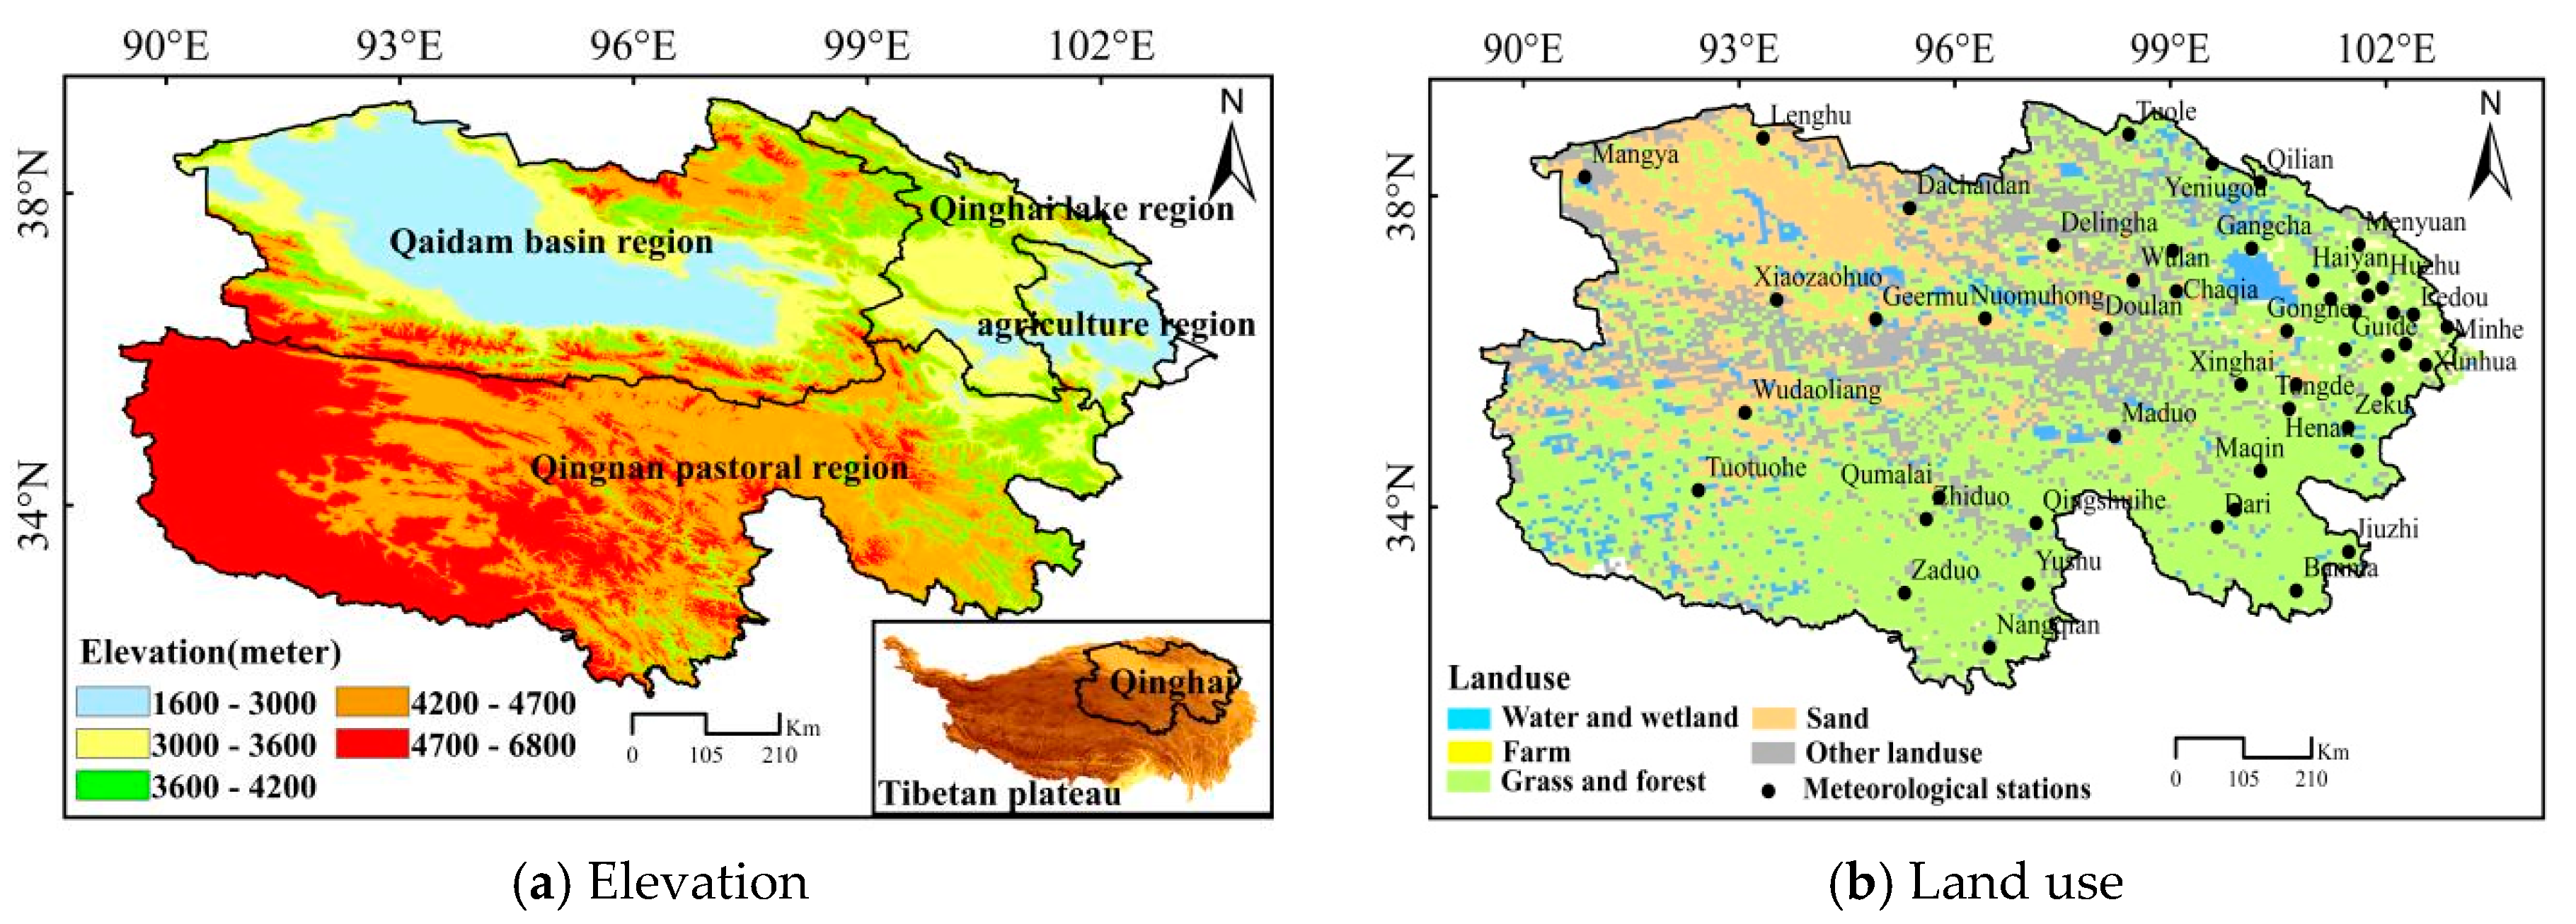
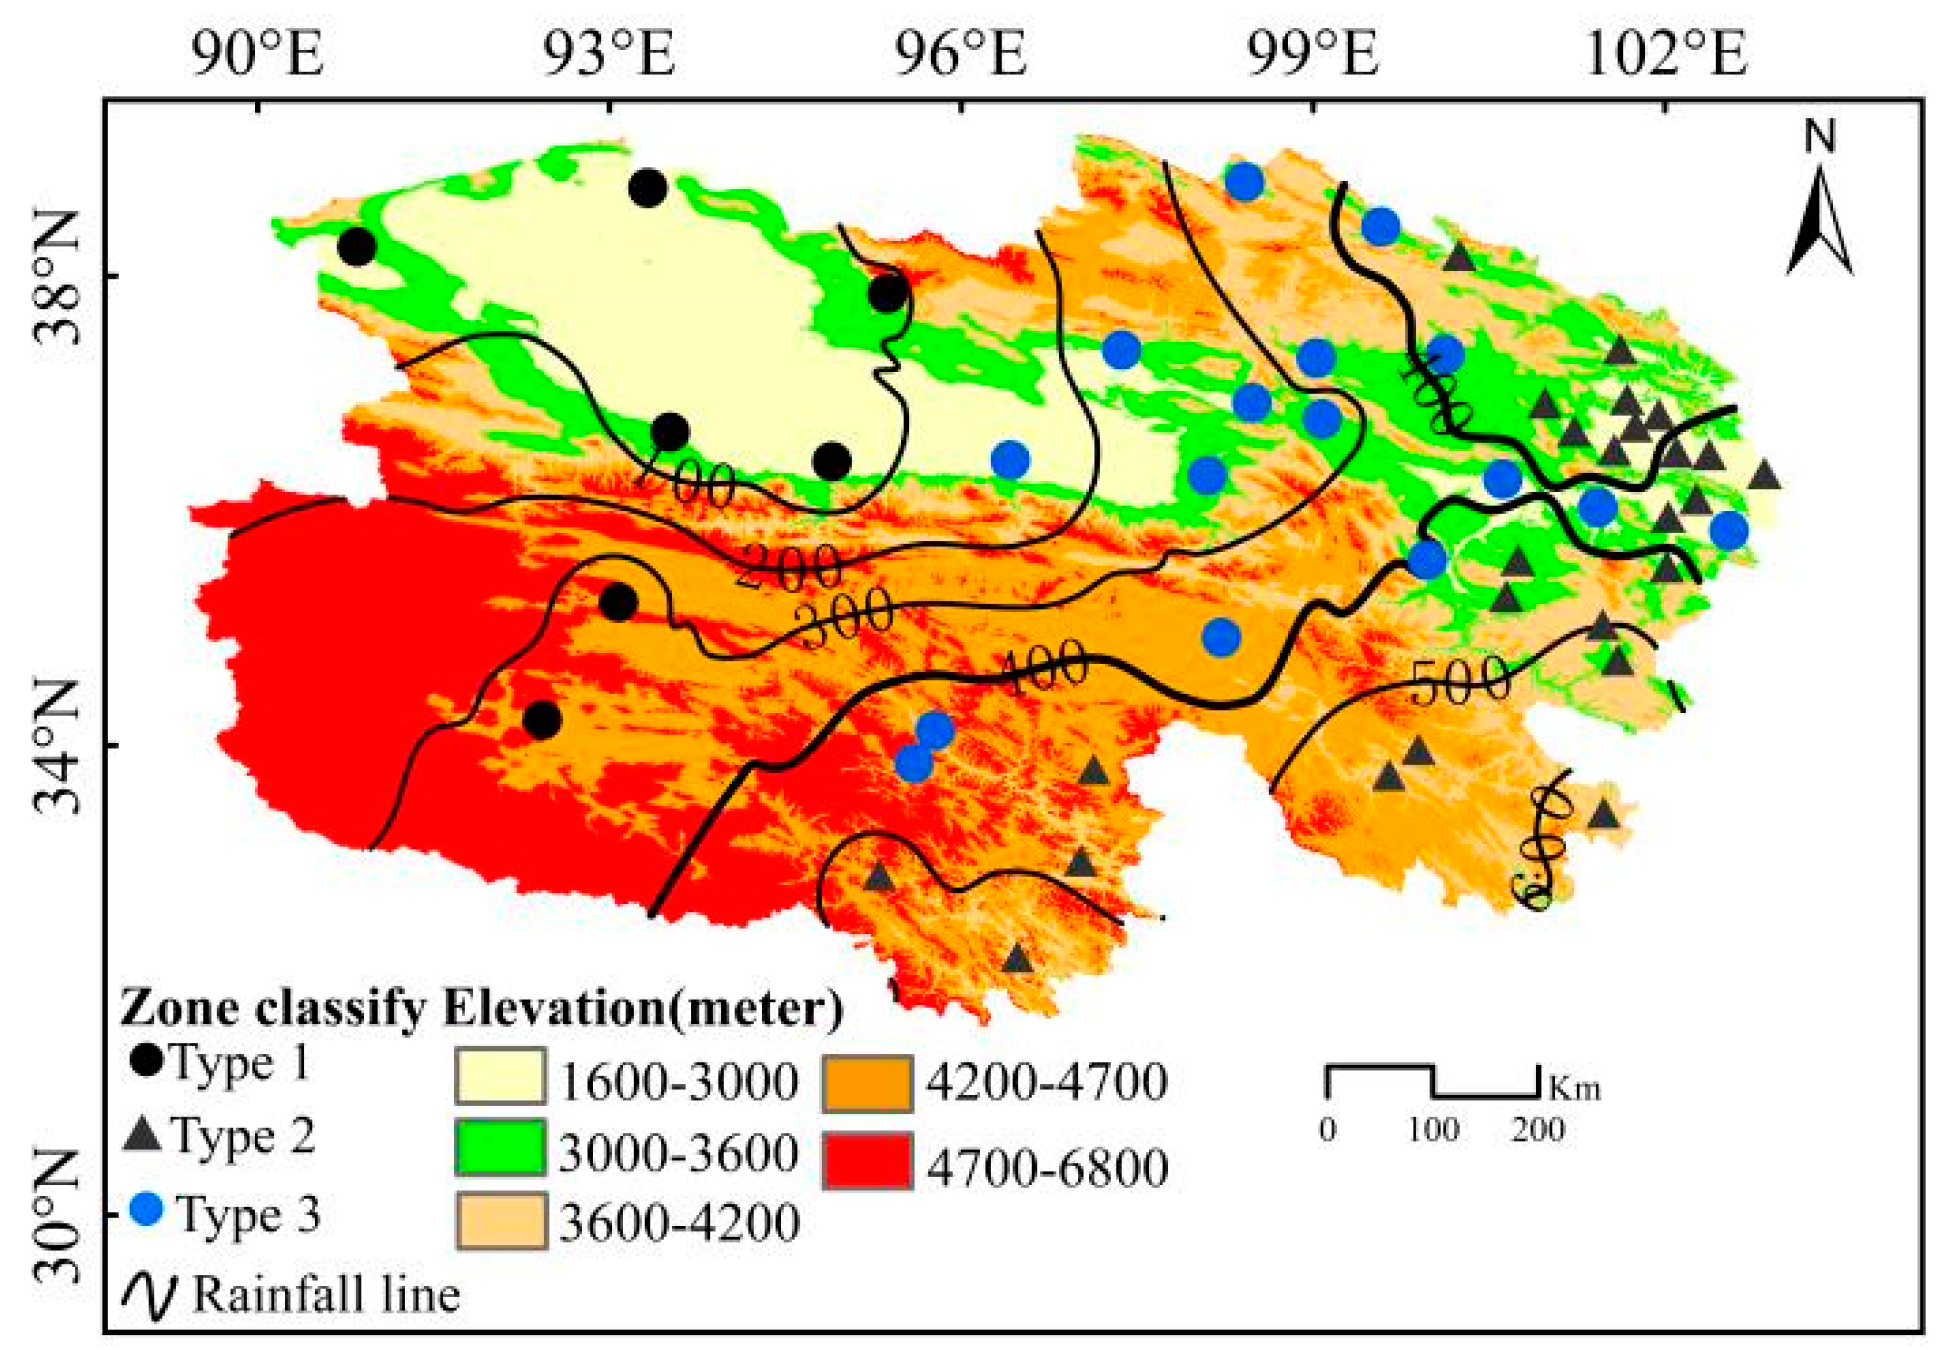
2.1. Study Area
2.2. Data
2.3. Method
2.3.1. Wind-Erosion Climatic Erosivity
2.3.2. Rainfall Erosivity
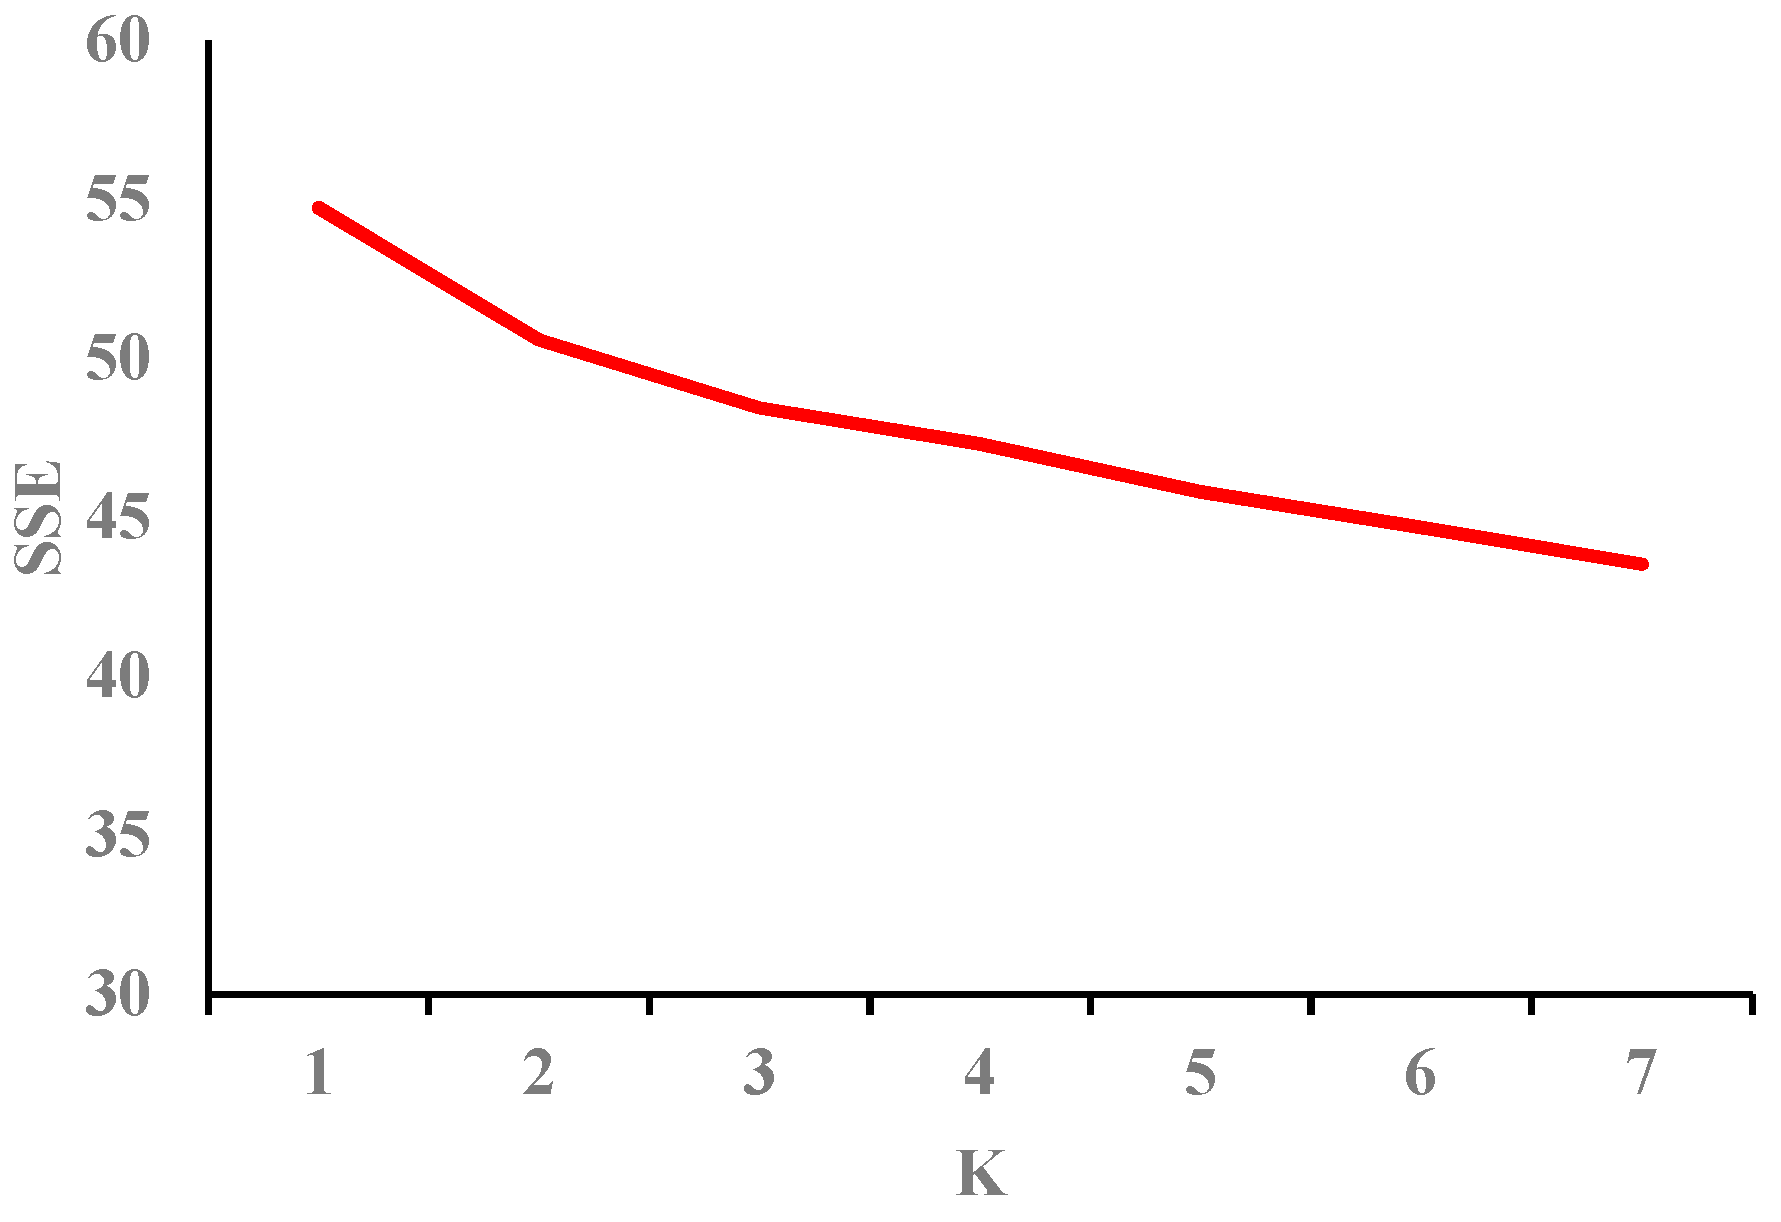
2.3.3. K-Means Clustering Method
2.3.4. Other Methods
3. Results
3.1. Characteristics of Wind/Rainfall Erosion Climatic Erosivity
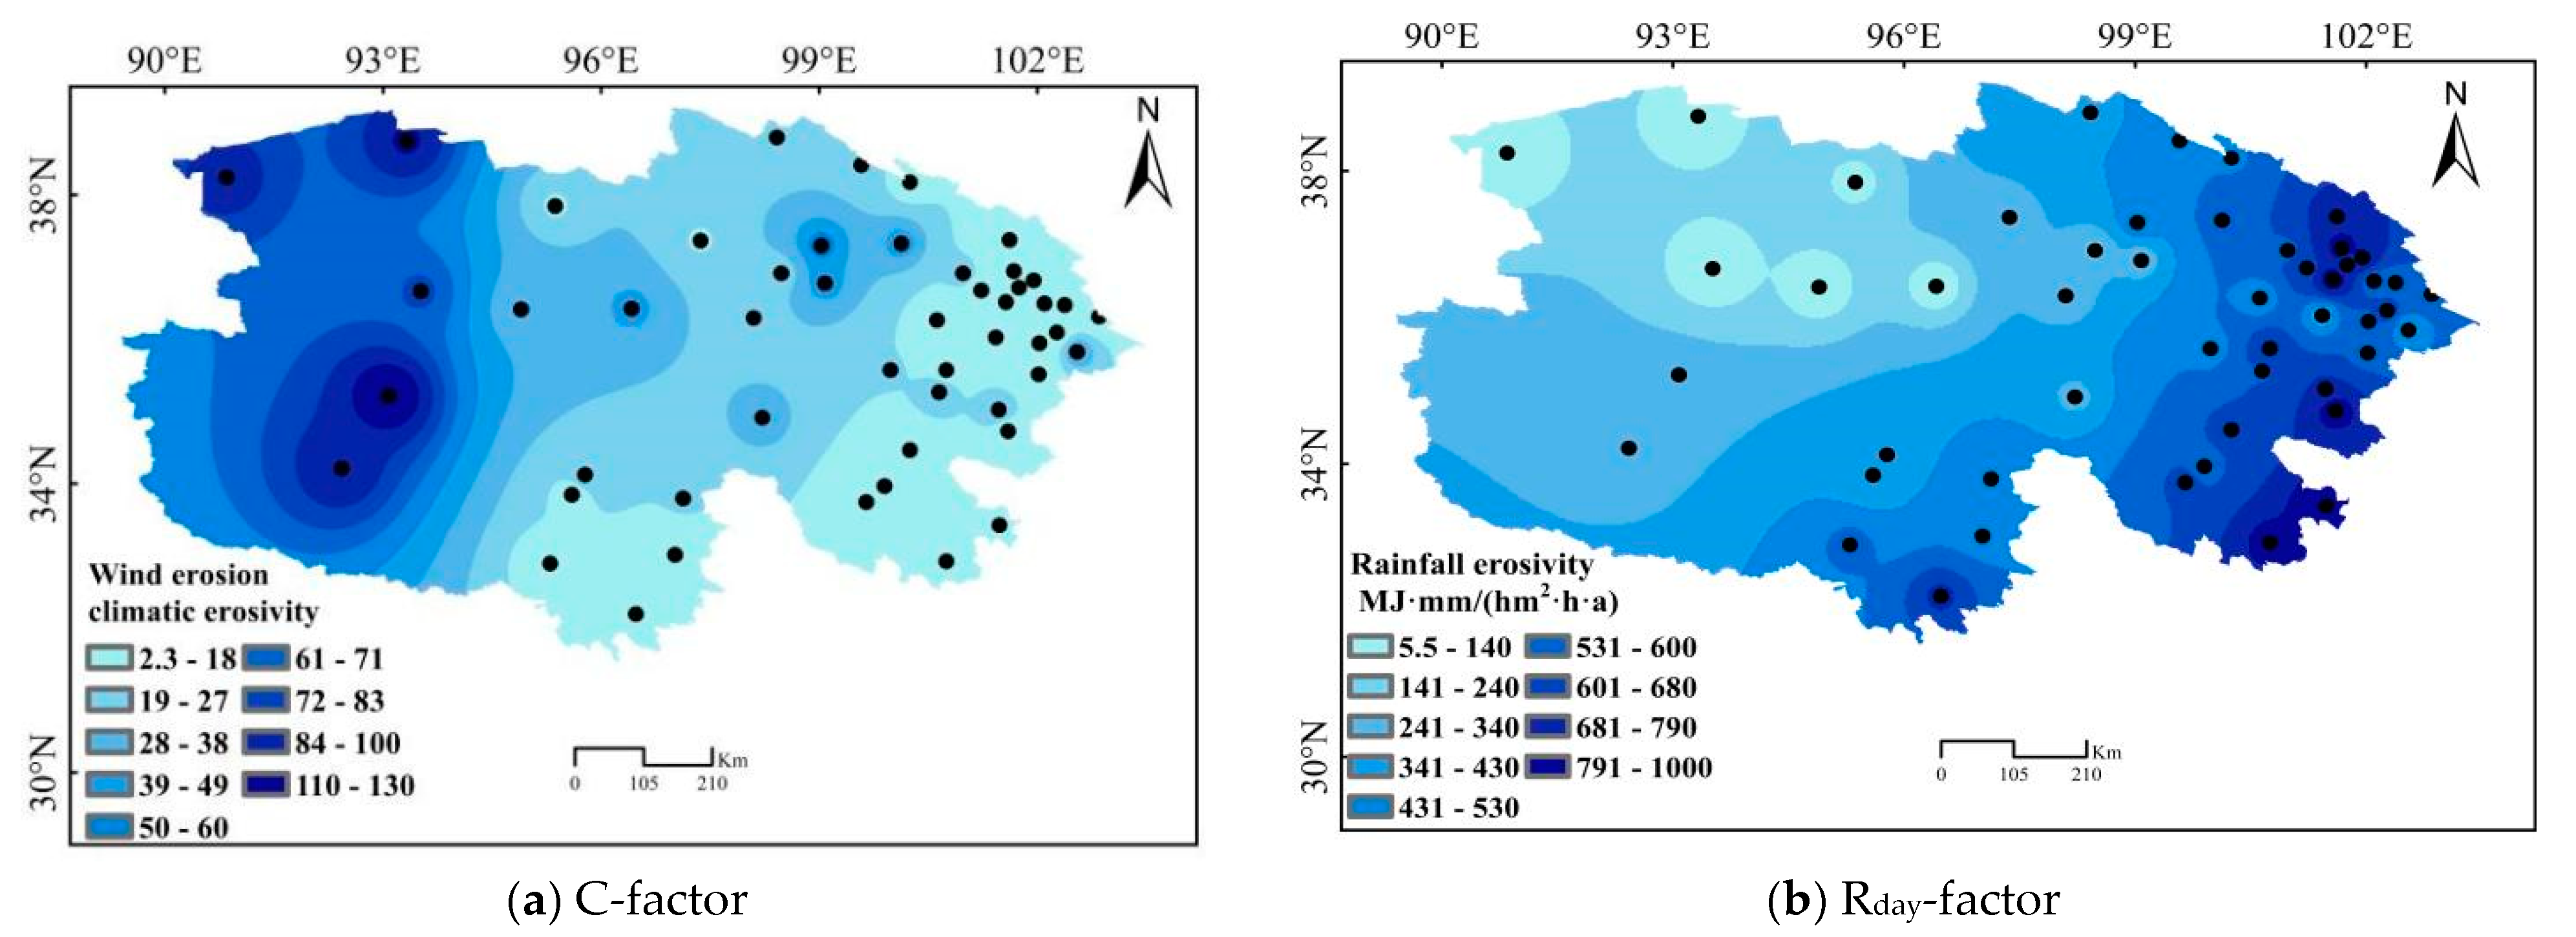
3.1.1. Spatial Distribution of Wind/Rainfall-Erosion Climatic Erosivity
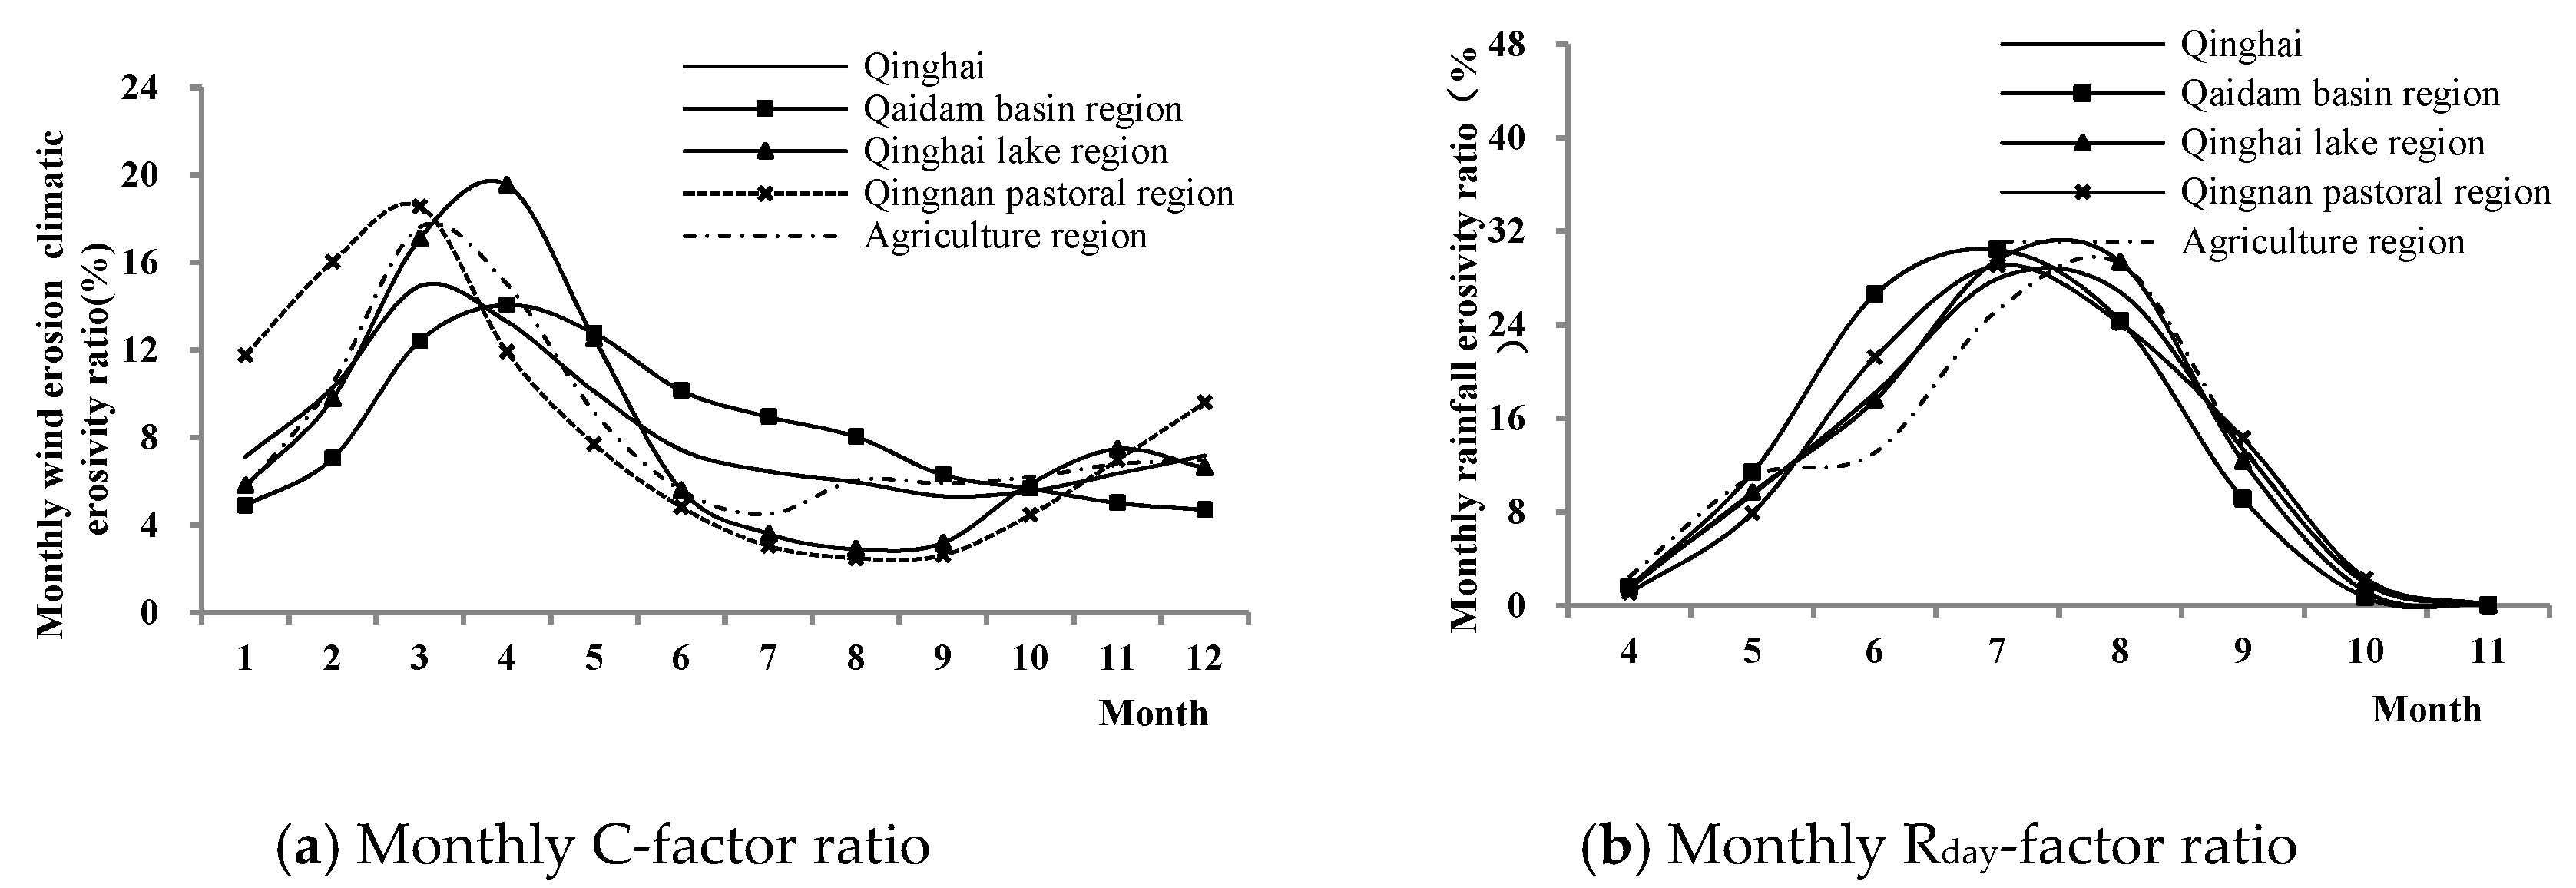
3.1.2. Mean Monthly Variations of Wind/Rainfall-Erosion Climatic Erosivity
3.2. Trend Variation in Wind/rainfall Erosion Climatic Erosivity
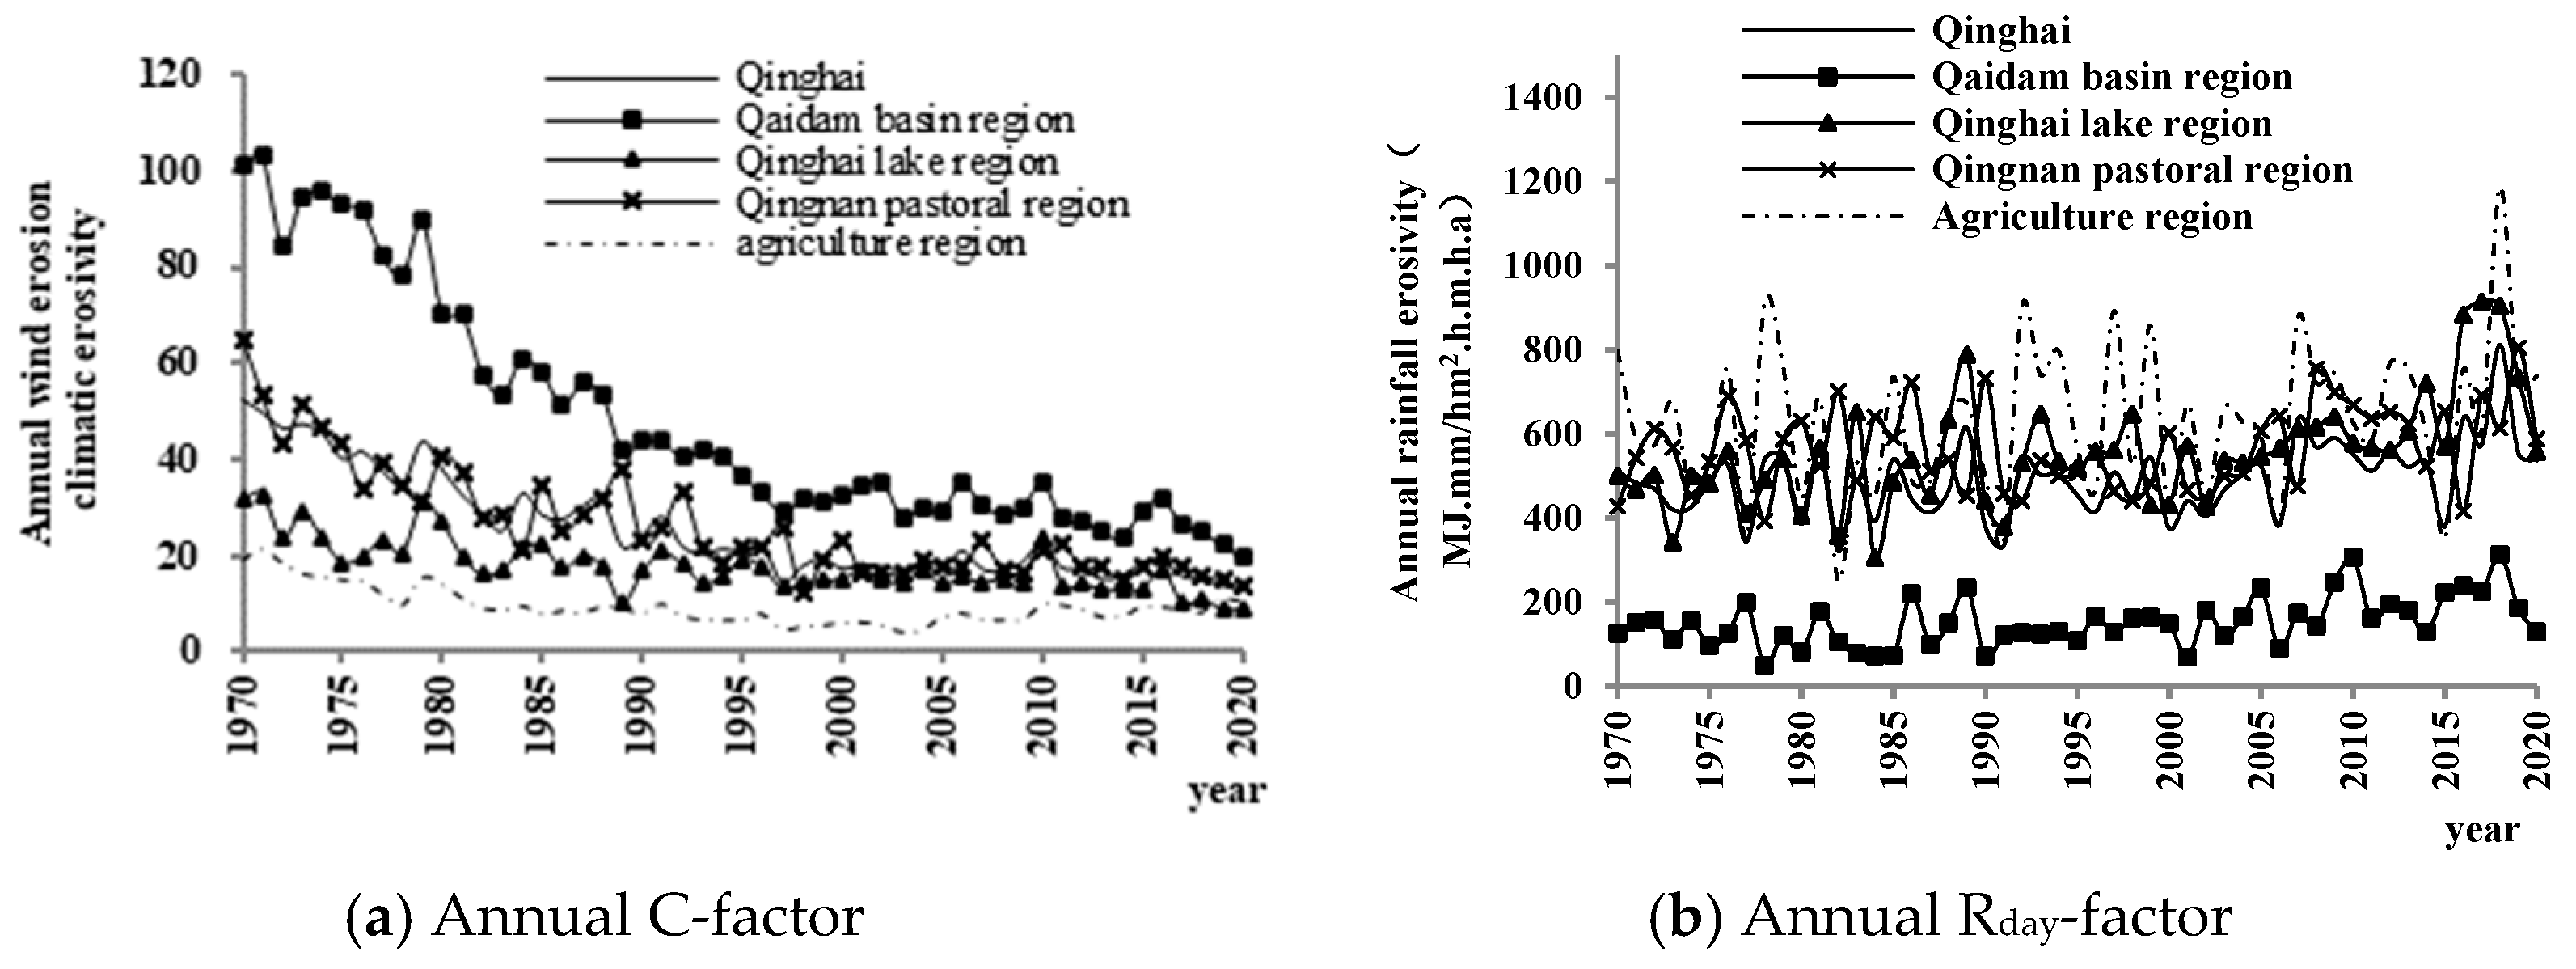
3.2.1. Annual Trend Variation in Wind/Rainfall Erosion Climatic Erosivity
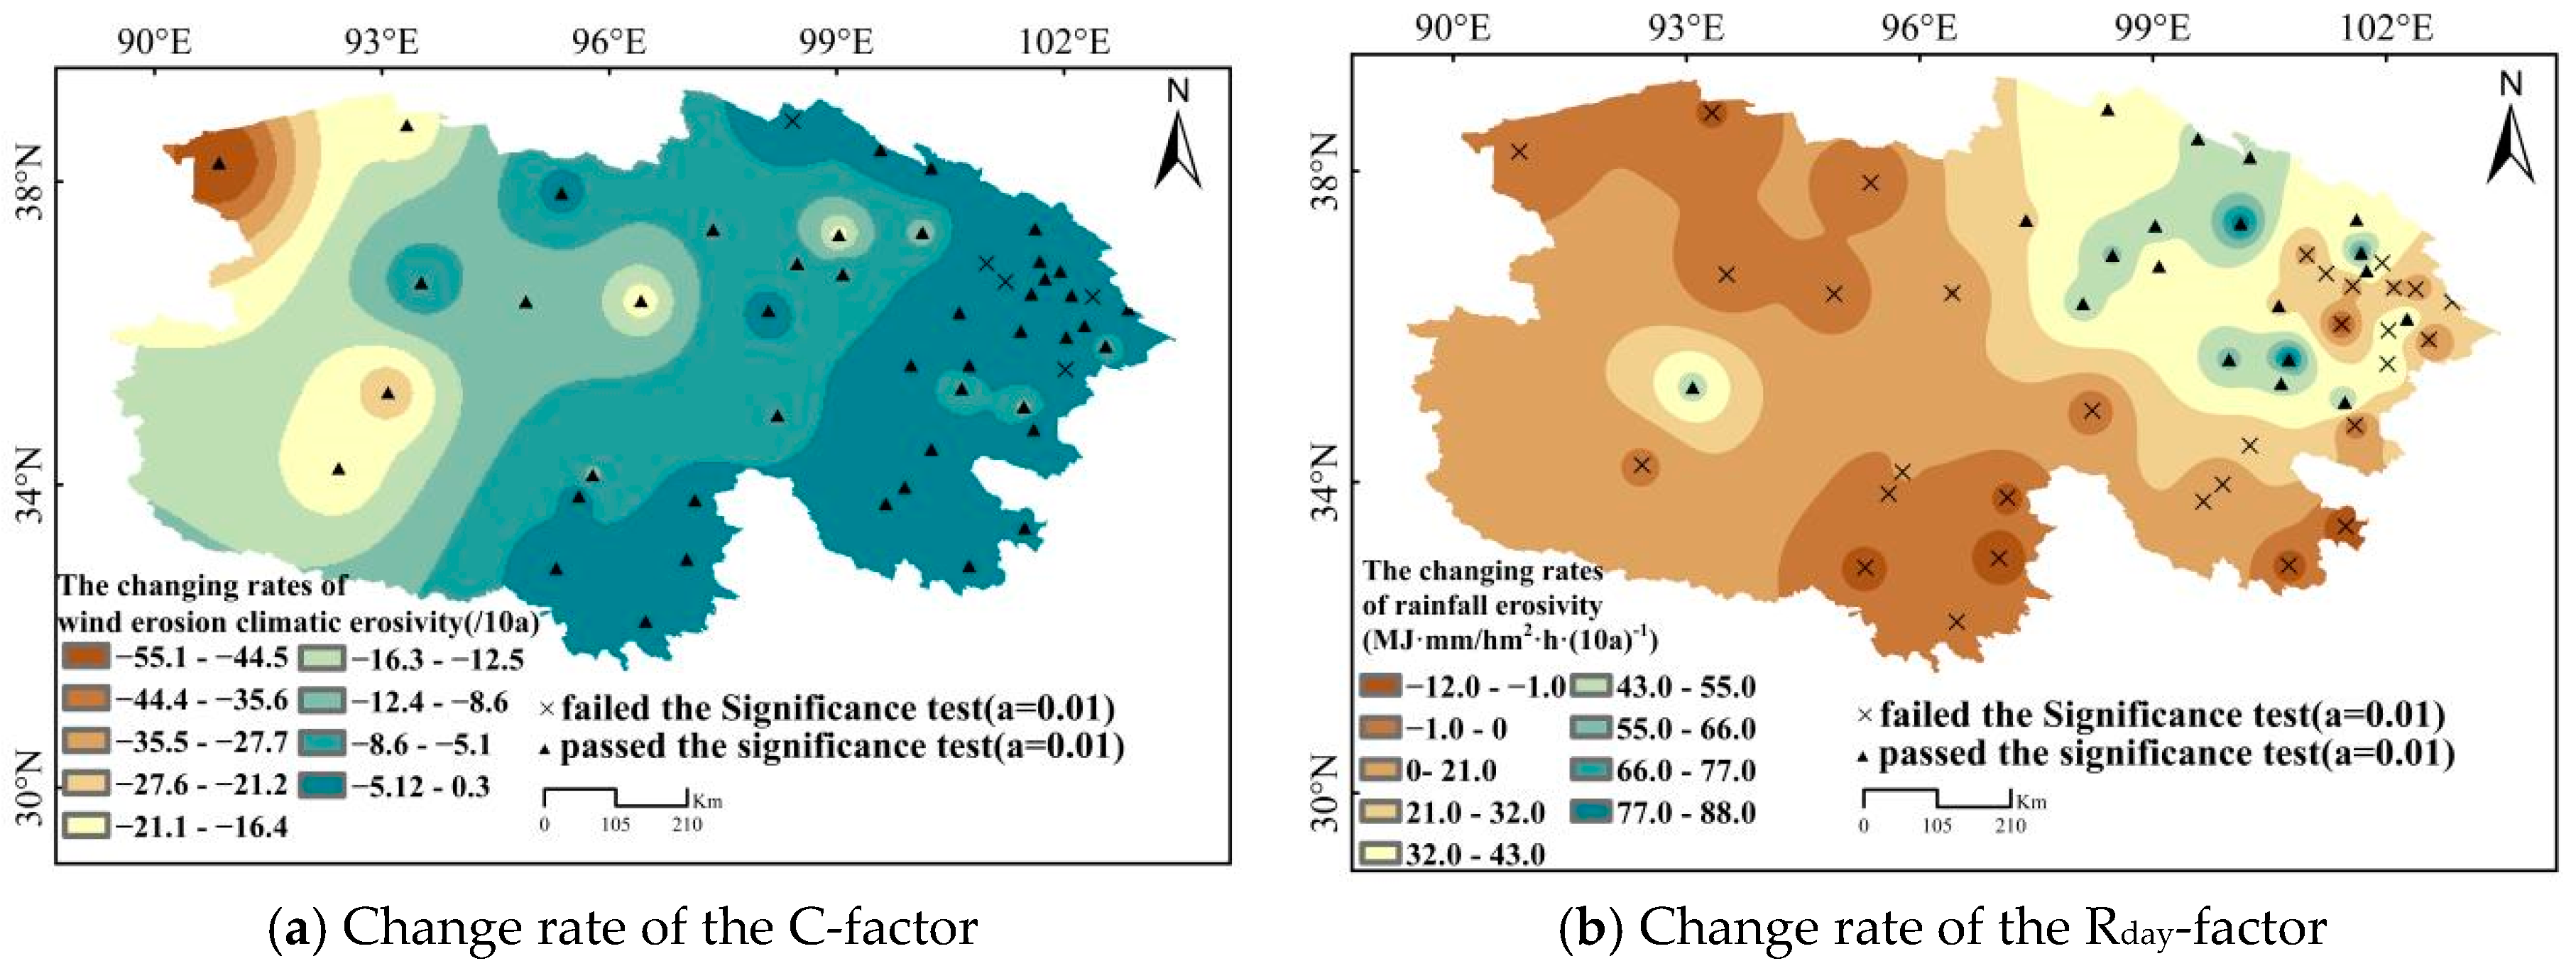
3.2.2. Spatial Change Rates Distribution of Wind/Rainfall Erosion Climatic Erosivity
3.3. Abrupt Change Point Analysis and Periodic Oscillation Analysis
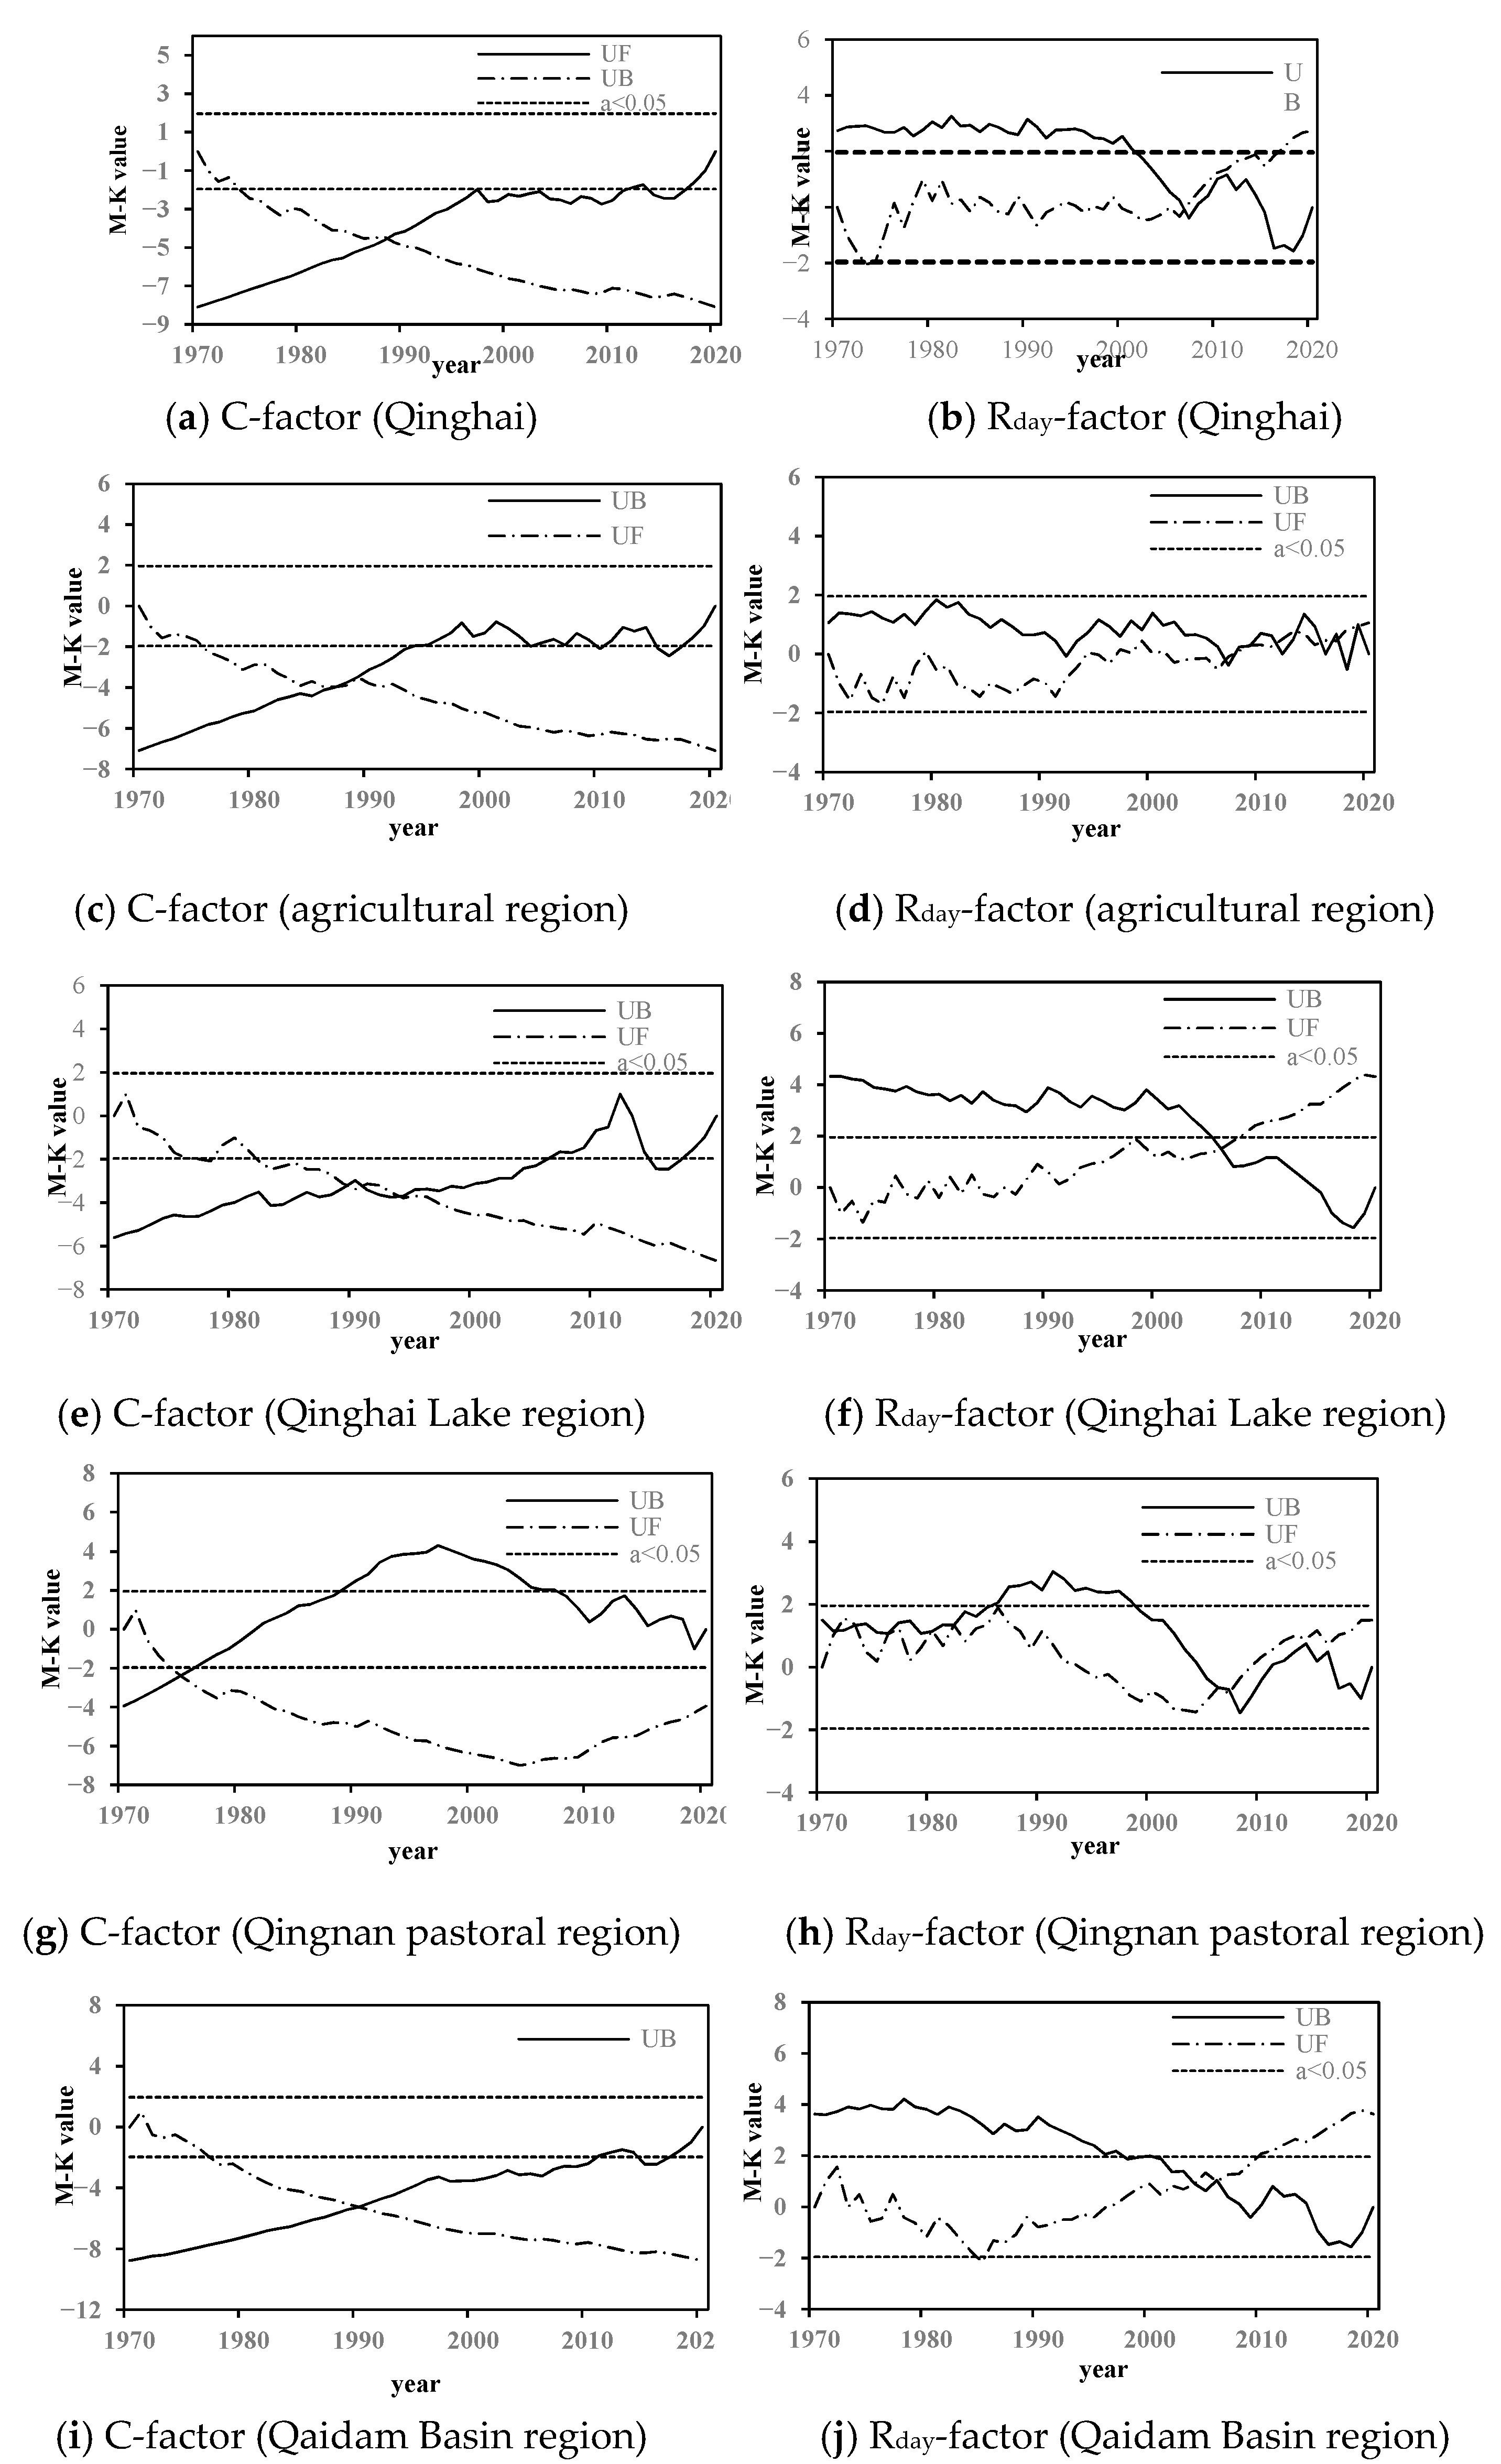
3.3.1. M–K Analysis for Wind/Rainfall Erosion Climatic Erosivity
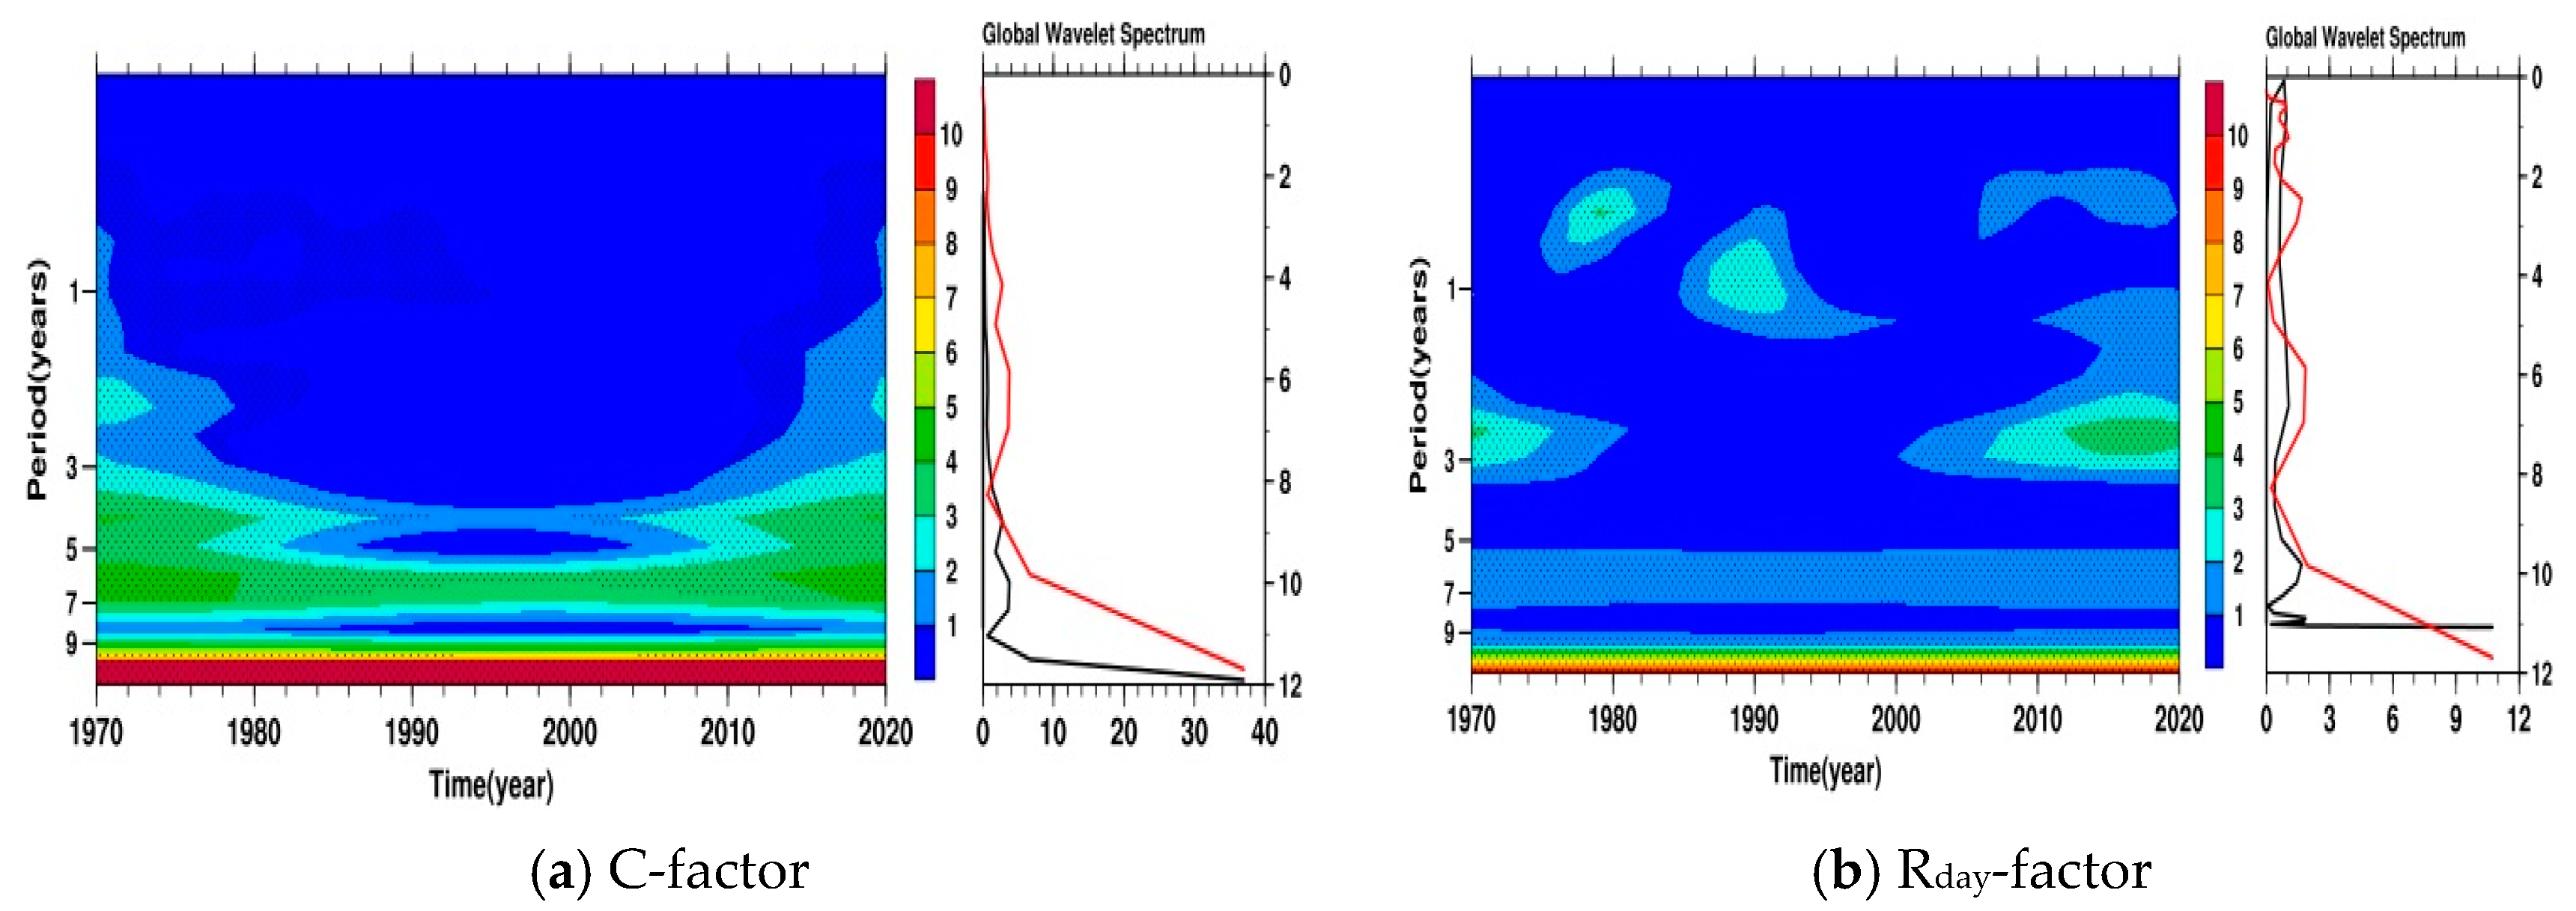
3.3.2. Periodic Oscillation Analysis of the Annual Wind/rainfall Erosion Climatic Erosivity
3.4. Group Division of Wind/Rainfall Erosion Climatic Erosivity
4. Discussion
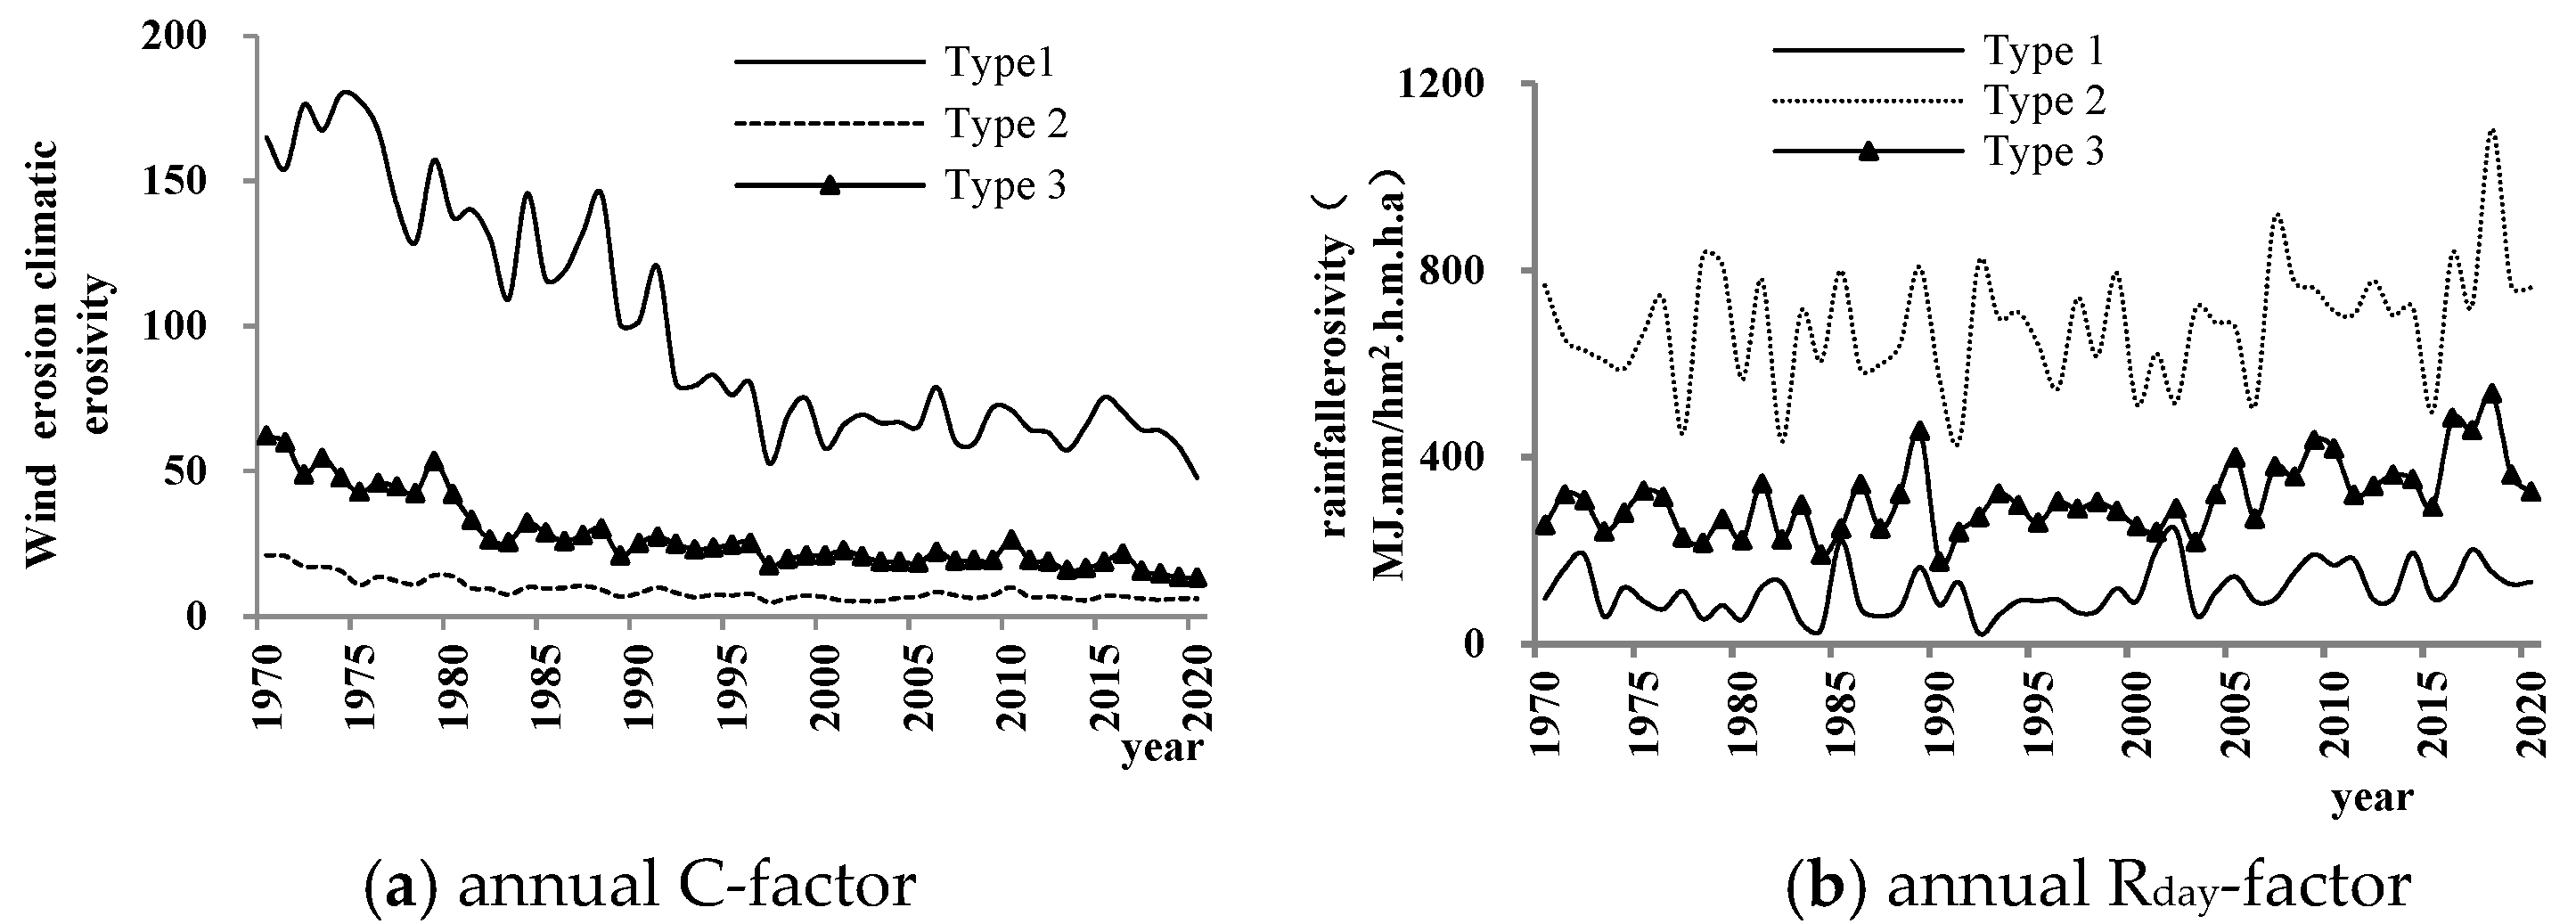
4.1. Temporal Variation in Three Types of Climatic Erosivity
4.2. Cause Analysis
4.3. Influence of Wind/Rainfall Erosion Climatic Erosivity
5. Conclusions
Author Contributions
Funding
Institutional Review Board Statement
Informed Consent Statement
Data Availability Statement
Acknowledgments
Conflicts of Interest
References
- Zhang, G.-H.; Nearing, M.A.; Liu, B.-Y. Potential effects of climate change on rainfall erosivity in the Yellow river basin of China. Trans. ASAE 2005, 48, 511–517. [Google Scholar] [CrossRef] [Green Version]
- Chen, T.; Jiao, J.; Wang, H.; Zhao, C.; Lin, H. Progress in Research on Soil Erosion in Qinghai-Tibet Plateau. Acta Pedol. Sin. 2020, 57, 547–564. (In Chinese) [Google Scholar]
- Wang, X.; Guo, Z.; Chang, C.; Wang, R.; Li, J.; Li, Q.; Qing, L. Spatiotemporal of soil wind erosion modules in the agro-pastoral ecotone of north China. J. Desert Res. 2020, 40, 12–22. [Google Scholar]
- Hai, C.; Shi, P.; Liu, B.; Yan, P. Research status of wind and water double erosion and its main study content in future. J. Soil Water Conserv. 2002, 16, 50–56. (In Chinese) [Google Scholar]
- Zhang, P.; Yao, W.; Liu, G.; Xiao, P. Research progress and prospects of complex soil erosion. Trans. Chin. Soc. Agric. Eng. 2019, 35, 154–161. (In Chinese) [Google Scholar]
- Ma, Q.; Xiao, J.; Yao, Z.; Wei, M.; Wu, Q.; Hong, X. Spatio-temporal evolution of wind erosion climatic erosivity in the Alxa plateau during 1960–2017. Sci. Geogr. Sin. 2021, 24, 19–23. [Google Scholar]
- Yue, S.; Yang, R.; Yan, Y.; Yang, zh.; Wang, D. Spatial and temporal variations of wind erosion climatic erosivity in the farming-pastoral zone of northern China. Theor. Appl. Climatol. 2019, 135, 1339–1348. [Google Scholar] [CrossRef]
- Zhang, J.; Liu, Z.; Yang, M.; Zhang, F.; Wang, Y.; Deng, X. Soil erosion and its influence factors on a slope in the wind-water erosion crisscross region on the loess plateau. J. Soil Water Conserv. 2018, 25, 1–7. (In Chinese) [Google Scholar]
- Song, Y.; Liu, L.; Yan, P. A review on complex erosion by wind and water research. Acta Geogr. Sin. 2006, 1, 77–88. (In Chinese) [Google Scholar] [CrossRef]
- Zhang, Y.; Li, Z.; Zhang, X.; Niu, W.; Tang, S. Landform spatial distribution features of soil erosion in Dongliu valley of inner Mongolia. J. Inn. Mong. Agric. Univ. 2016, 37, 50–58. (In Chinese) [Google Scholar]
- Xie, Y.; Yin, S.; Liu, B.; Nearing, M.; Zhao, Y. Models for estimating daily rainfall erosivity in China. J. Hydrol. 2016, 535, 547–558. [Google Scholar] [CrossRef] [Green Version]
- Yang, H.; Wang, J.; Zou, X.; Shi, P. Progress and prospect of research on wind-water complex erosion. J. Desert Res. 2020, 36, 962–971. (In Chinese) [Google Scholar]
- Yang, Y.; Zhao, R.; Shi, Z.; Viscarra Rossel, R.; Wang, D.; Liang, Z. Integrating multi-source data to improve water erosion mapping in Tibet, China. Catena 2018, 169, 31–45. [Google Scholar] [CrossRef]
- Yue, T.; Yin, S.; Xie, Y.; Yu, B.; Liu, B. Rainfall erosivity mapping over mainland China based on high-density hourly rainfall records. Earth Syst. Sci. Data 2022, 14, 665–682. [Google Scholar] [CrossRef]
- Yue, L.; Zhao, W.; Yan, X. Global rainfall erosivity changes between 1980 and 2017 based on an erosivity model using daily precipitation. Catena 2020, 194, 104768. [Google Scholar]
- Wang, H.; Zhao, W.; Jia, L. Progress and prospect of soil water erosion research over past decade based on the bibliometrics analysis. Sci. Soil Water Conserv. 2021, 25, 1–7. (In Chinese) [Google Scholar]
- Cui, B.; Zhang, Y.; Liu, L.; Xu, Z.; Wang, Z.; Gu, C.; Wei, B.; Gong, D. Spatialtemporal variation in rainfall erosivity and correlation with ENSO on the Tibetan plateau since 1971. Environ. Res. Public Health 2021, 18, 11054. [Google Scholar] [CrossRef]
- Cheng, G.; Wu, T. Responses of permafrost to climate change and their environmental significance, Qinghai-Tibetan plateau. J. Geophys. Res. Earth surf. 2007, 112, F02S03. [Google Scholar] [CrossRef] [Green Version]
- Padulano, R.; Rianna, G.; Santini, M. Datasets and approaches for the estimation of rainfall erosivity over Italy: A comprehensive comparison study and a new method. J. Hydrol. Reg. Stud. 2021, 34, 100788. [Google Scholar] [CrossRef]
- Liu, B.; Tao, H.; Song, C.; Guo, B.; Shi, Z.; Zhang, C.; Kong, B.; He, B. Temporal and spatial variations of rainfall erosivity in China during 1960 to 2009. Geogr. Res. 2013, 32, 245–256. (In Chinese) [Google Scholar]
- Sadeghi, S.H.; Tavangar, S. Development of stational models for estimation of rainfall erosivity factor in different timescales. Nat. Hazards 2015, 77, 429–443. [Google Scholar] [CrossRef]
- Panagos, P.; Borrelli, P.; Poesen, J.; Ballabio, C.; Lugato, E.; Meusburger, K.; Montanarella, L.; Alewell, C. The new assessment of soil loss by water erosion in Europe. Environ. Sci. Policy 2015, 54, 438–447. [Google Scholar] [CrossRef]
- Lin, H.; Zheng, S.; Wang, X. Soil erosion assessment based on the RUSLE model in the three-river headwater area. Qinghai-Tibetan plateau, China. Acta Prataculturae Sin. 2017, 26, 11–22. (In Chinese) [Google Scholar]
- Zhang, W.; Xie, Y.; Liu, B. Rainfall erosivity estimation using daily rainfall amounts. Sci. Geogr. Sin. 2002, 22, 705–711. (In Chinese) [Google Scholar]
- Chen, Y.; Xu, M.; Wang, Z.; Chen, W.; Lai, C. Reexamination of the Xie model and spatiotemporal variability in rainfall erosivity in mainland China from 1960 to 2018. Catena 2020, 195, 104837. [Google Scholar] [CrossRef]
- Yin, S.; Xue, X.; Yue, T.; Xie, Y.; Gao, G. Spatiotemporal distribution and return period of rainfall erosivity in China. Trans. Chin. Soc. Agric. Eng. 2019, 35, 105–113. (In Chinese) [Google Scholar]
- Gao, G.; Yin, S.; Chen, T.; Huang, D.; Wang, W. Spatiotemporal variation and cause analysis of rainfall erosivity in the Yangtze River Basin of China. Trans. Chin. Soc. Agric. Eng. 2022, 38, 84–92. (In Chinese) [Google Scholar]
- Chen, S.; Dong, Y. A review of the research on wind erosion climatic erosivity. J. Desert Res. 2020, 40, 65–73. (In Chinese) [Google Scholar]
- Allafta, H.; Opp, C. Soil erosion assessment using the RUSLE model, remote sensing, and GIS in the Shatt Al-Arab basin(Iraq-Iran). Appl. Sci. 2022, 12, 7776. [Google Scholar] [CrossRef]
- Qi, D.; Li, X.; Su, W.; Zhou, W.; Xiao, H. Tendency of spatiotemporal evolution of wind erosion climatic erosivity in Qinghai province in recent 50 years. Res. Soil Water Conserv. 2019, 26, 23–30. (In Chinese) [Google Scholar]
- Lou, J.; Wang, X.; Cai, D. Spatial and temporal variation of wind erosion climatic erosivity and its response to ENSO in the Otindag desert, China. Atmosphere 2019, 10, 614. [Google Scholar] [CrossRef] [Green Version]
- Liu, J.; Wang, X.; Zhang, L.; Guo, Z.; Chang, C.; Du, H.; Wang, H.; Wang, R.; Li, J.; Li, Q. Regional potential wind erosion simulation using different models in the agro-pastoral ecotone of northern China. Int. Environ. Res. Public Health 2022, 19, 9538. [Google Scholar] [CrossRef] [PubMed]
- Jia, L.; Gao, H.; Fan, B.; Li, Z. Spatiotemporal characteristic of water-wind erosion dynamics over Northern China. Res. Soil Water Conserv. 2017, 4, 19–23. (In Chinese) [Google Scholar]
- Zhao, H.; Zhang, F.; Yu, Z.; Li, J. Spatiotemporal variation in soil degradation and economic damage caused by wind erosion in Northwest China. J. Environ. Manag. 2022, 314, 115121. [Google Scholar] [CrossRef] [PubMed]
- Chepil, W.S.; Siddoway, F.H.; Armbrust, D.V. Climatic factor for estimating wind erodibility of farm fields. J. Soil Conserv. 1962, 17, 162–165. [Google Scholar]
- FAO. A Provisional Methodology for Soil Degradation Assessment; Food and Agriculture Organization of the United Nations: Rome, Italy, 1979. [Google Scholar]
- Guo, Z.; Shi, Y.; Huang, F.; Fan, X.; Huang, J. Landslide susceptibility zonation method based on C5.0 descision tree and K-means cluster algorithms to improve the efficiency of management. Geosci. Front. 2021, 12, 101249. [Google Scholar] [CrossRef]
- Li, N.; Lu, H. Regionalization method for water resources utilization based on cluster analysis. J. Shenyang Univ. Technol. 2021, 29, 575–588. (In Chinese) [Google Scholar]
- Rehman, S. Long-term wind speed analysis and detection of its trends using Mann–Kendall test and linear regression method. Arab. J. Sci. Eng. 2013, 38, 421–437. [Google Scholar] [CrossRef]
- Xie, J.; Yu, Y.; Liu, C.; Ge, J. Characteristics of surface sensible heat flux over the Qinghai-Tibetan Plateau and its response to climate change. Plateau Meteorol. 2018, 37, 28–42. (In Chinese) [Google Scholar]
- Zhang, L.; Wang, H.; Shi, X.; Li, D. Characteristics and Causes of surface sensible heat trend Transition in central and Eastern Qinghai-Xizang Plateau. Plateau Meteorol. 2020, 39, 912–924. (In Chinese) [Google Scholar]
- Li, L.; Li, H.; Shen, H.; Liu, C.; Ma, Y.; Zhao, Y. The truth and inter-annual oscillation causes for climate change in the Qinghai-Tibet Plateau. J. Glaciol. Geocryol. 2018, 40, 1079–1089. (In Chinese) [Google Scholar]
- Liu, Y.; Ma, Y.; Yang, Y.; Li, B.; Zhu, B. Research of the spatio-temporal variation characteristics of daytime and nighttime precipitation in the Qinghai plateau from 1961 to 2018. J. Glaciol. Geocryol. 2020, 42, 996–1006. (In Chinese) [Google Scholar]
- Li, F.; Xue, W. Spatial and temporal variation of NDVI in different functional areas of Qinghai from 2000 to 2015. Acta Agrestia Sin. 2017, 25, 701–710. (In Chinese) [Google Scholar]
- Zhao, H.; Li, X.; Zhao, D.; Xiao, R. Above ground biomass in grassland in Qinghai estimated from MODIS data and its influencing factor. Acta Prataculturae Sin. 2020, 29, 5–16. (In Chinese) [Google Scholar]
- Qinghai Water Resources Department. Qinghai Bulletin of Soil and Water Conservation. 2005; p. 12. Available online: http://www.doc88.com/p-6691320584305.html (accessed on 22 August 2022).
- Qinghai Water Resources Department. Qinghai Bulletin of Soil and Water Conservation. 2020; p. 12. Available online: http://slj.haixi.gov.cn/info/1037/25916.html (accessed on 22 August 2022).


| Classify | Stations |
|---|---|
| Type 1 | Lenghu,Mangya,Xiaozaohuo,Wudaoliang,Tuotuohe |
| Type 2 | Xining,Ledou,Minhe,Huangyuan,Datong,Huangzhong,Hualong,Huzhu,Tongren,Pingan,Jianzha,Menyuan,Qilian,Guinan,Zeku,Maqin,Dari,Jiuzhi,Yushu,Nangqian,Qingshuihe,Zaduo,Banma,Henan,Gande,Tongde |
| Type 3 | Yeniugou,Gangcha,Tianjun,Xinghai,Xunhua,Guide,Tuole,Gonghe,Delingha,Wulan,Doulan,Chaqia,Qumalai,Zhiduo,Maduo,Nuomuhong,Haiyan,Geermu,Dachaidan |
| Meteorological Elements | C-Factor | Rday-Factor | ||||
|---|---|---|---|---|---|---|
| Type 1 | Type 2 | Type 3 | Type 1 | Type 2 | Type 3 | |
| Annual temperature | −0.492 * | −0.484 * | −0.523 * | 0.296 * | 0.220 | 0.506 * |
| Annual rainfall | −0.382 * | −0.279 * | −0.440 * | / | / | / |
| Sunshine duration | 0.256 * | 0.335 * | 0.367 * | −0.346 * | −0.385 * | −0.559 * |
| Wind speed | 0.979 * | 0.881 * | 0.844 * | −0.232 | −0.011 | −0.419 * |
| Humidity | −0.167 | 0.026 | −0.193 | 0.134 | −0.039 | 0.160 |
| Evapotranspiration | 0.468 * | 0.157 | 0.237 * | −0.065 | −0.099 | −0.240 * |
| Annual cumulative numbers of wind speed (wind speed not smaller than 5 m/s) | 0.989 * | 0.963 * | 0.985 * | / | / | / |
| Rainfall intensity | / | / | / | 0.509 * | 0.232 | 0.322 * |
| Annual erosive rainfall | / | / | / | 0.961 * | 0.675 * | 0.567 * |
| Rainy days (rainfall amount not smaller than 10 mm) | / | / | / | 0.864 * | 0.891 * | 0.910 * |
| Annual cumulative times of rainfall (rainfall amount not smaller than 25mm) | / | / | / | 0.283 * | 0.808 * | 0.801 * |
| Meteorological Elements | Subregions | ||
|---|---|---|---|
| Type 1 | Type 2 | Type 3 | |
| Changing rate in annual temperate (°C·10a−1) | 0.52 * | 0.45 * | 0.41 * |
| Changing rate in annual rainfall (mm·10a−1) | 9.40 * | 9.10 * | 13.10 * |
| Changing rate in annual sunshine duration (h·10a−1) | −45.3 * | −39.2 * | −42.9 * |
| Changing rate in annual wind speed (m/s·10a−1) | −0.30 * | −0.10 * | −0.13 * |
| Changing rate in annual humidity (%·10a−1) | −0.02 | −0.80 * | −0.10 |
| Changing rate in annual cumulative numbers of wind speed (time·10a−1) | −54.2 * | −14.7 * | −56.2 * |
| Changing rate in annual evapotranspiration (mm·10a−1) | −86.70 * | −5.60 | −10.30 |
| Changing rate in annual rainfall intensity (mm·d·10a−1) | −0.31 | −0.37 | 0.40 |
| Changing rate in annual erosive rainfall (mm·10a−1) | 4.00 * | 8.00 * | 6.20 * |
| Changing rate in annual rainy days (≥ 10 mm) (d·10a−1) | 0.30 * | 0.50 * | 0.60 * |
| Changing rate in annual cumulative times of rainfall (rainfall amount not smaller than 25 mm) (time·10a−1) | −0.10 | 3.24 * | 2.23 * |
Publisher’s Note: MDPI stays neutral with regard to jurisdictional claims in published maps and institutional affiliations. |
© 2022 by the authors. Licensee MDPI, Basel, Switzerland. This article is an open access article distributed under the terms and conditions of the Creative Commons Attribution (CC BY) license (https://creativecommons.org/licenses/by/4.0/).
Share and Cite
Liu, Y.; Gao, G.; Li, H.; Liu, L.; Fan, Z.; Wen, T. Spatiotemporal Variations and Causes of Wind/Rainfall Erosion Climatic Erosivity in Qinghai Province, China. Atmosphere 2022, 13, 1649. https://doi.org/10.3390/atmos13101649
Liu Y, Gao G, Li H, Liu L, Fan Z, Wen T. Spatiotemporal Variations and Causes of Wind/Rainfall Erosion Climatic Erosivity in Qinghai Province, China. Atmosphere. 2022; 13(10):1649. https://doi.org/10.3390/atmos13101649
Chicago/Turabian StyleLiu, Yihua, Ge Gao, Hongmei Li, Lüliu Liu, Zong Fan, and Tingting Wen. 2022. "Spatiotemporal Variations and Causes of Wind/Rainfall Erosion Climatic Erosivity in Qinghai Province, China" Atmosphere 13, no. 10: 1649. https://doi.org/10.3390/atmos13101649