

Climate Change Impact on the Duration of Great Vegetation Period and Vegetation Period of Beetroot and Watermelon in Slovakia
 , ,
, ,  , ,
, ,
Abstract
:1. Introduction
2. Materials and Methods
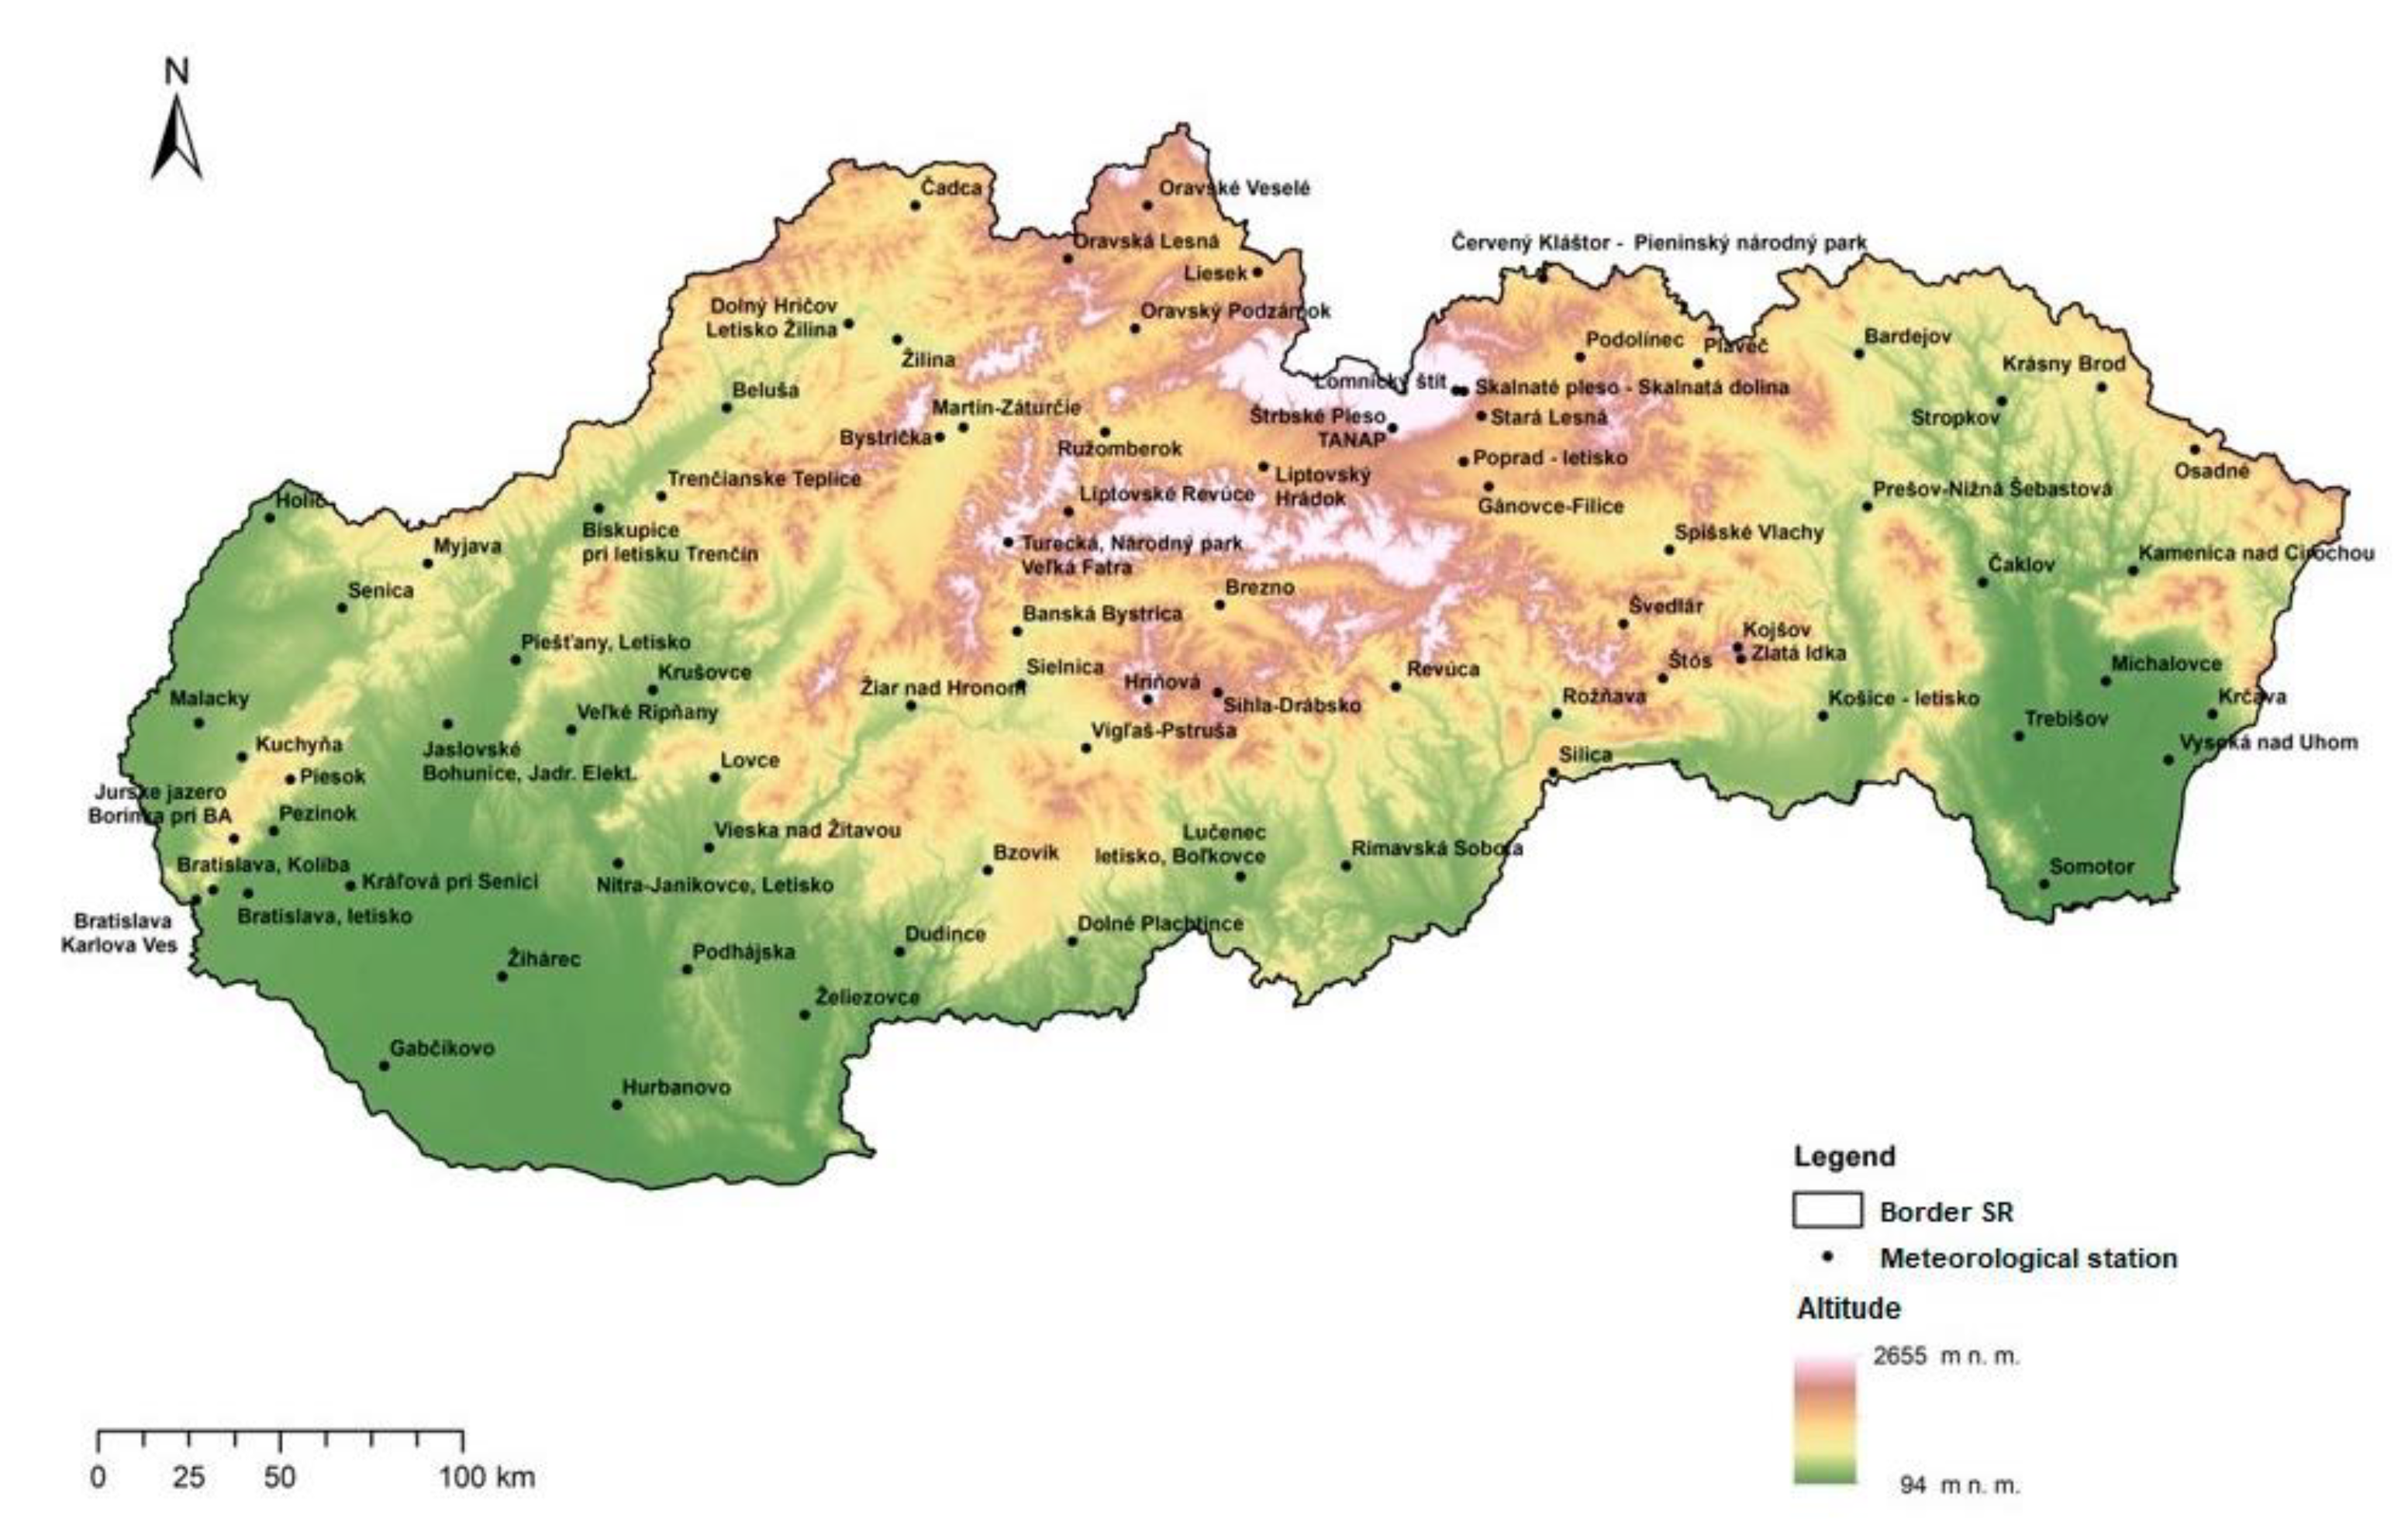
2.1. Climate Conditions
2.2. Data Analysis
- watermelon (Citrullus lanatus Thunb.),
- beetroot (Beta vulgaris L. var. vulgaris).
- rv—difference between middle of month with temperature T2 and date when Tn was reached [days],
- rp—difference between middle of month with temperature T1 and date when Tu was reached [days],
- Tn—the starting temperature [°C],
- Tu—the ending temperature [°C],
- T1—the nearest monthly average temperature above Tn or Tu [°C],
- T2—the nearest monthly average temperature below Tn or Tu [°C],
- R—difference between midst of months with average temperature T2 and average temperature T1; it can be expressed as R = 30 [days].
- b—slope of a trendline,
- a—y-intercept, which is the expected mean value of y when all x variables are equal to 0.
2.3. Map Outputs Creation
3. Results
4. Discussion
5. Conclusions
Author Contributions
Funding
Institutional Review Board Statement
Informed Consent Statement
Data Availability Statement
Acknowledgments
Conflicts of Interest
References
- Porter, J.R.; Xie, L.; Challinor, A.J.; Cochrane, K.; Howden, M.S.; Iqbal, M.M.; Lobell, D.B.; Travasso, M.I. Food Security and Food Production Systems. In Climate Change 2014: Impacts, Adaptation, and Vulnerability. Part A: Global and Sectoral Aspects. Contribution of Working Group II to the Fifth Assessment Report of the Intergovernmental Panel on Climate Change; Field, C.B., Barros, V.R., Dokken, D.J., Mach, K.J., Mastrandrea, M.D., Bilir, T.E., Chatterjee, M., Ebi, K.L., Estrada, Y.O., Genova, R.C., et al., Eds.; Cambridge University Press: Cambridge, UK ; New York, NY, USA, 2014; pp. 485–533. [Google Scholar]
- Qiu, X.; Tang, L.; Zhu, Y.; Cao, W.; Liu, L. Quantification of cultivar change in double rice regions under a warming climate during 1981–2009 in China. Agronomy 2019, 9, 794. [Google Scholar] [CrossRef] [Green Version]
- OECD. The Climate Challenge: Achieving Zero Emissions. Available online: https://www.oecd.org/about/secretary-general/the-climate-challenge-achieving-zero-emissions.htm (accessed on 20 August 2022).
- IPCC. Climate Change: Impacts, Adaptation and Vulnerability; Cambridge University Press: New York, NY, USA, 2007. [Google Scholar]
- Drbal, K.; Dumbrovský, M.; Muchová, Z.; Sobotková, V.; Štepanková, P.; Šarapatka, B. Mitigation of flood risks with the aid of the critical points method. Agronomy 2022, 12, 1300. [Google Scholar] [CrossRef]
- Čimo, J.; Špánik, F. The agro climatic analysis production Salix (Salix vilimalis). In Proceedings of the Sustainable Development and Bioclimate: Reviewed Conference Proceedings, Stará Lesná, Slovakia, 5–8 October 2009; ISBN 978-80-900450-1-9. [Google Scholar]
- Čimo, J.; Šinka, K.; Novotná, B.; Tárník, A.; Aydin, E.; Toková, L.; Kišš, V.; Kotuš, T. Change in temperature conditions of Slovakia to the reference period 1961–2010 and their expected changes to time horizons years 2035, 2050, 2075 and 2100 under the conditions of changing climate. J. Ecol. Eng. 2020, 21, 232–240. [Google Scholar] [CrossRef]
- Bakkenes, M.; Alkemade, R.M.; Ihle, F.; Leemans, R.; Latour, J.B. Assessing effects of forecasted climate change on the diversity and distribution of European higher plants for 2050. Glob. Change Biol. 2020, 8, 390–407. [Google Scholar] [CrossRef]
- Van Vuuren, D.P.; Meinshause, M.; Plattner, G.K.; Joos, F.; Strassmann, K.M.; Smith, S.J.; Wigley, T.M.L.; Raper, S.C.B.; Riahi, K.; de la Chesnaye, F.; et al. Temperature increase of 21st century mitigation scenarios. Proc. Natl. Acad. Sci. USA 2008, 105, 15258–15262. [Google Scholar] [CrossRef] [Green Version]
- Minďaš, J.; Páleník, V.; Nejedlík, P. Dôsledky Klimatickej Zmeny a Možné Adaptačné Opatrenia v Jednotlivých Sektoroch [The Impacts of Climate Change and Possible Adaptation Measures in the Individual Sectors]; EFRA-Vedecká agentúra pre lesníctvo a ekológiu: Zvolen, Slovakia, 2011. (In Slovak) [Google Scholar]
- Sabella, E.; Aprile, A.; Negro, C.; Nicoli, F.; Nutricati, E.; Vergine, M.; Luvisi, A.; De Bellis, L. Impact of climate change on durum wheat yield. Agronomy 2020, 10, 793. [Google Scholar] [CrossRef]
- Kovalenko, P.; Rokochinskiy, A.; Jeznach, J.; Koptyuk, R.; Volk, P.; Prykhodko, N.; Tykhenko, R. Evaluation of climate change in Ukrainian part of Polissia region and ways of adaptation to it. J. Water Land Dev. 2019, 41, 77–82. [Google Scholar] [CrossRef] [Green Version]
- Olesen, J.E.; Bindi, M. Consequences of climate change for European agricultural productivity, land use and policy. Eur. J. Agron. 2002, 16, 239–262. [Google Scholar] [CrossRef]
- Lobell, D.B.; Schlenker, W.; Costa-Roberts, J. Climate trends and global crop production since 1980. Science 2011, 333, 616–620. [Google Scholar] [CrossRef] [Green Version]
- Prejavy Klimatickej Zmeny na Globálnej Úrovni [Manifestations of Climate Change at the Global Level]. Available online: https://www.shmu.sk/sk/?page=1379 (accessed on 19 July 2022). (In Slovak).
- Markovič, L.; Faško, P.; Bochníček, O.; Pecho, J. Rok 2021 Bol Jedným zo Siedmich Najteplejších Rokov v Histórii Meraní [The year 2021 Was One of the Seven Warmest Years in the History of Measurements]. Available online: https://www.shmu.sk/sk/?page=2049&id=1199 (accessed on 20 September 2022). (In Slovak).
- Peterová, E.; Garčár, I. Klimatická Zmena a Jej Vplyv na Zdravie a Majetok na Slovensku [Climate Change and Its Impact on Health and Property in Slovakia]. Available online: https://www.shmu.sk/sk/?page=2049&id=927 (accessed on 19 July 2022). (In Slovak).
- Ertunç, E.; Muchová, Z.; Tomić, H.; Janus, J. Legal, procedural and social aspects of land valuation in land consolidation: A comparative study for selected Central and Eastern Europe countries and Turkey. Land 2022, 11, 636. [Google Scholar] [CrossRef]
- Bilčík, M.; Božiková, M.; Čimo, J. Influence of roof installation of PV modules on the microclimate conditions of cattle breeding objects. Appl. Sci. 2021, 11, 2140. [Google Scholar] [CrossRef]
- Klimatické Pomery Slovenskej Republiky [Climatic Conditions of the Slovak Republic]. Available online: https://www.shmu.sk/sk/?page=1064 (accessed on 15 September 2022). (In Slovak).
- Čimo, J.; Aydin, E.; Šinka, K.; Tárník, A.; Kišš, V.; Halaj, P.; Toková, L.; Kotuš, T. Change in the length of the vegetation period of tomato (Solanum lycopersicum L.), white cabbage (Brassica oleracea L. var. capitata) and carrot (Daucus carota L.) due to climate change in Slovakia. Agronomy 2020, 10, 1110. [Google Scholar] [CrossRef]
- Sar, T.; Avci, S.; Avci, M. Evaluation of the vegetation period according to climate change scenarios: A case study in the inner west Anatolia subregion of Turkey. J. Geogr. 2019, 39, 29–39. [Google Scholar] [CrossRef] [Green Version]
- Olszewski, K.; Żmudzka, E. Variability of the vegetative period in Poland. Misc. Geogr. 2000, 9, 59–70. [Google Scholar] [CrossRef] [Green Version]
- Čimo, J.; Špánik, F.; Šiška, B.; Tomlain, J.; Horák, J. Praktická Biometeorológia [Practical Biometeorology]; SPU: Nitra, Slovakia, 2012; 201p, ISBN 978-80-552-0771-1. (In Slovak) [Google Scholar]
- Šiška, B.; Špánik, F.; Repa, Š.; Gálik, M. Praktická Biometeorológia [Practical Biometeorology]; SPU: Nitra, Slovakia, 2005; 144p, ISBN 80-8069-486-9. (In Slovak) [Google Scholar]
- Pecho, J.; Markovič, L. Pravdepodobnosť, Že Globálna Teplota do Roku 2026 Prekročí Oteplenie +1.5 °C Sa Zvýšila na Takmer 50 % [The Probability that the Global Temperature Will Exceed +1.5 °C by 2026 Has Increased to Almost 50 %]. Available online: https://www.shmu.sk/sk/?page=2049&id=1219 (accessed on 19 July 2022). (In Slovak).
- Global and European Temperatures. Available online: https://www.eea.europa.eu/ims/global-and-european-temperatures (accessed on 19 July 2022).
- Satyamurty, P.; de Castro, A.A.; Tota, J.; da Silva Gularte, L.E.; Ocimar Manzi, A. Rainfall trends in the Brazilian Amazon Basin in the past eight decades. Theor. Appl. Climatol. 2010, 99, 139–148. [Google Scholar] [CrossRef]
- Pipíšková, P.; Muchová, Z.; Dežerický, D. Map based information support system on land use: Case of Horná Nitra, Slovakia. J. Ecol. Eng. 2022, 23, 162–173. [Google Scholar] [CrossRef]
- Gacko, I.; Muchová, Z.; Jurík, Ľ.; Šinka, K.; Fabian, L.; Petrovič, F. Decision making methods to optimize new dam site selections on the Nitra River. Water 2020, 12, 2042. [Google Scholar] [CrossRef]
- Rozpondek, R.; Wancisiewicz, K.; Kacprzak, M. GIS in the studies of soil and water environment. J. Ecol. Eng. 2016, 17, 134–142. [Google Scholar] [CrossRef]
- Halva, J.; Kisová, A. The effect of input parameters in the modelling of DMR. Sci. Youth 2018, 13, 56–63. [Google Scholar]
- Trnka, M.; Olesen, J.E.; Kersebaum, K.C.; Skjelvĺg, A.O.; Eitzinger, J.; Seguin, B.; Peltonen-Sainio, P.; Rötter, R.; Iglesias, A.; Orlandini, S.; et al. Agroclimatic conditions in Europe under climate change. Glob. Change Biol. 2011, 17, 2298–2318. [Google Scholar] [CrossRef] [Green Version]
- Linderholm, H.W. Growing season changes in the last century. Agric. For. Meteorol. 2006, 137, 1–14. [Google Scholar] [CrossRef]
- Chervenkov, H.M.; Slavov, K.S. Thermal Growing Season Characteristics over Central and Southeast Europe in the Changing Climate 1950–2019. Ecol. Balk. 2021, 13, 245–255, ISSN 1313-9940. [Google Scholar]
- Ruosteenoja, K.; Räisänen, J.; Venäläinen, A.; Kämäräinen, M. Projections for the duration and degree days of the thermal growing season in Europe derived from CMIP5 model output. Int. J. Climatol. 2016, 36, 3039–3055. [Google Scholar] [CrossRef]
- Ruosteenoja, K.; Räisänen, J.; Pirinen, P. Projected changes in thermal seasons and the growing season in Finland. Int. J. Climatol. 2011, 31, 1473–1487. [Google Scholar] [CrossRef]
- Grusson, Y.; Wesström, I.; Joel, A. Impact of climate change on Swedish agriculture: Growing season rain deficit and irrigation need. Agric. Water Manag. 2021, 251, 106858. [Google Scholar] [CrossRef]
- Mesterházy, I.; Mészáros, R.; Pongrácz, R. The effects of climate change on grape production in Hungary. Időjárás 2014, 118, 193–206. [Google Scholar]
- Nieróbca, A.; Kozyra, J.; Mizak, K.; Wróblewska, E. Changing length of the growing season in Poland. Woda Sr. Obsz. Wiej. 2013, 13, 81–94. [Google Scholar]
- Valšíková-Frey, M.; Čimo, J.; Špánik, F. Zeleninártvo v podmienkach zmeny klímy [Horticulture in the Conditions of Climate Change]. Meteorol. J. 2011, 14, 69–72. (In Slovak) [Google Scholar]
- Špánik, F.; Valšíková-Frey, M.; Čimo, J. Zmena teplotnej zabezpečenosti základných druhov zelenín v podmienkach klimatickej zmeny (Changes of the Temperature Security of Basic Species of Vegetables under Climate Change Conditions). Acta Hortic. Et. Regiotect. 2007, 10, 42–45. (In Slovak) [Google Scholar]
- Čimo, J.; Šinka, K.; Tárník, A.; Aydin, E.; Kišš, V.; Toková, L. Impact of climate change on vegetation period of basic species of vegetables in Slovakia. J. Water Land Dev. 2020, 47, 38–46. [Google Scholar] [CrossRef]


| Vegetable Species | Starting Temperature [°C] | Ending Temperature [°C] |
|---|---|---|
| Watermelon (Citrullus lanatus Thunb.) | 13.0 °C | 12.5 °C |
| Beetroot (Beta vulgaris L. var. vulgaris) | 3.0 °C | 7.5 °C |
| Duration of the Vegetation Period [Days] | 1971–1980 Area [km2] | 2011–2020 Area [km2] | 2041–2050 Area [km2] | 2071–2080 Area [km2] | 2091–2100 Area [km2] |
|---|---|---|---|---|---|
| <190 | 1711 | 0 | 0 | 0 | 0 |
| 190–200 | 87,138 | 159,269 | 213,355 | 260,751 | 49,883 |
| 200–210 | 402,372 | 456,812 | 420,869 | 389,904 | 396,520 |
| 210–220 | 1,093,161 | 586,435 | 474,318 | 409,143 | 387,792 |
| 220–230 | 1,426,159 | 1,136,775 | 1,020,594 | 873,531 | 787,553 |
| 230–240 | 1,319,145 | 1,295,869 | 1,253,355 | 1,181,744 | 1,177,852 |
| 240–250 | 545,512 | 888,637 | 811,493 | 865,979 | 847,876 |
| 250–260 | 26,804 | 378,117 | 461,193 | 471,288 | 497,069 |
| 260–270 | 0 | 88 | 246,817 | 259,146 | 250,842 |
| 270–280 | 0 | 0 | 8 | 190,516 | 207,314 |
| 280–290 | 0 | 0 | 0 | 0 | 97,265 |
| Duration of the Vegetation Period [Days] | 1971–1980 Area [km2] | 2011–2020 Area [km2] | 2041–2050 Area [km2] | 2071–2080 Area [km2] | 2091–2100 Area [km2] |
|---|---|---|---|---|---|
| <100 | 2263 | 0 | 0 | 0 | 0 |
| 100–110 | 6063 | 6245 | 4654 | 3538 | 2590 |
| 110–120 | 10,454 | 9459 | 9501 | 8737 | 8680 |
| 120–130 | 12,839 | 11,552 | 11,215 | 11,138 | 10,274 |
| 130–140 | 14,645 | 8575 | 8557 | 8964 | 7075 |
| 140–150 | 2756 | 4808 | 4322 | 3706 | 3734 |
| 150–160 | 0 | 5986 | 3698 | 3368 | 3145 |
| 160–170 | 0 | 2216 | 4040 | 3547 | 2545 |
| 170–180 | 0 | 0 | 2388 | 2361 | 3176 |
| 180–190 | 0 | 0 | 645 | 3460 | 4800 |
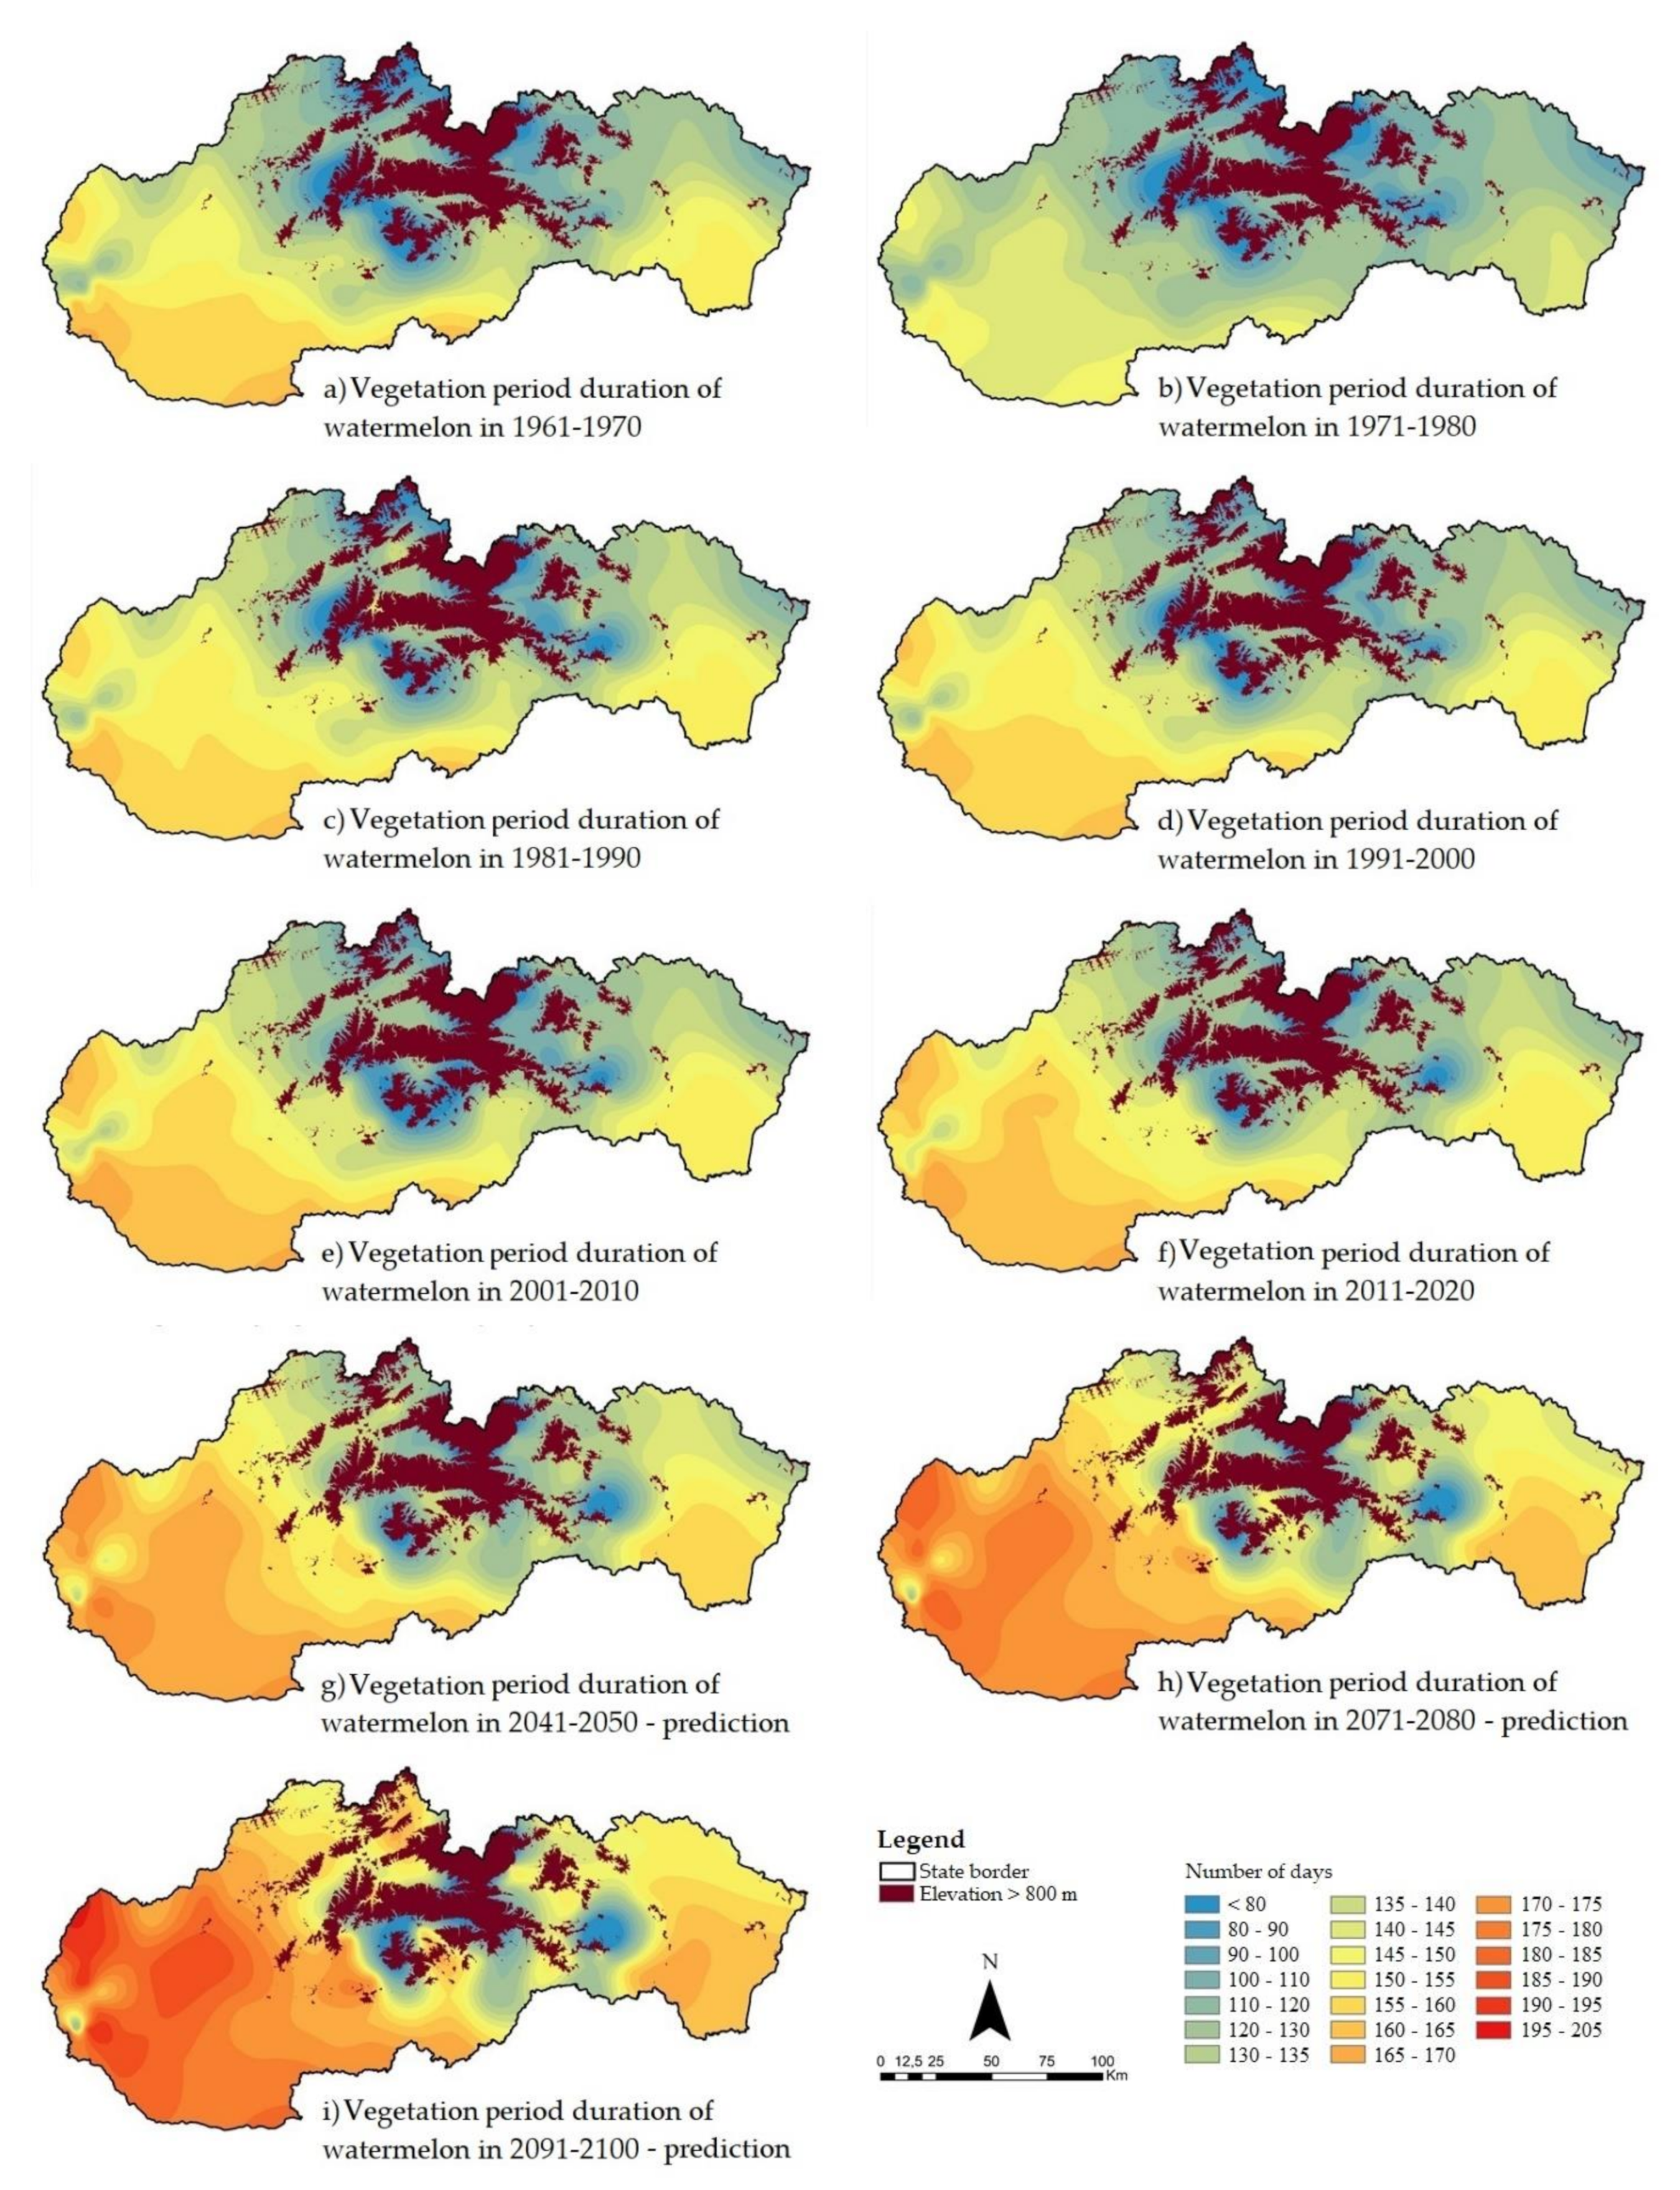
| Duration of the Vegetation Period [Days] | 1971–1980 Area [km2] | 2011–2020 Area [km2] | 2041–2050 Area [km2] | 2071–2080 Area [km2] | 2091–2100 Area [km2] |
|---|---|---|---|---|---|
| <80 | 331 | 0 | 0 | 0 | 0 |
| 80–90 | 825 | 0 | 0 | 0 | 0 |
| 90–100 | 3476 | 0 | 0 | 0 | 0 |
| 100–110 | 6078 | 1632 | 0 | 0 | 0 |
| 110–120 | 7191 | 3772 | 2368 | 0 | 0 |
| 120–130 | 10,506 | 7276 | 4093 | 3531 | 0 |
| 130–140 | 10,613 | 9595 | 9316 | 4876 | 5848 |
| 140–150 | 10,001 | 10,549 | 11,014 | 10,390 | 8189 |
| 150–160 | 0 | 9156 | 10,042 | 11,963 | 10,466 |
| 160–170 | 0 | 7039 | 10,280 | 7346 | 10,628 |
| 170–180 | 0 | 0 | 1908 | 10,337 | 8526 |
| 180–190 | 0 | 0 | 0 | 579 | 5188 |
| >190 | 0 | 0 | 0 | 0 | 174 |
Publisher’s Note: MDPI stays neutral with regard to jurisdictional claims in published maps and institutional affiliations. |
© 2022 by the authors. Licensee MDPI, Basel, Switzerland. This article is an open access article distributed under the terms and conditions of the Creative Commons Attribution (CC BY) license (https://creativecommons.org/licenses/by/4.0/).
Share and Cite
Čimo, J.; Kišš, V.; Aydın, E.; Pagáč, J.; Božiková, M.; Bilčík, M.; Minárik, M. Climate Change Impact on the Duration of Great Vegetation Period and Vegetation Period of Beetroot and Watermelon in Slovakia. Atmosphere 2022, 13, 1641. https://doi.org/10.3390/atmos13101641
Čimo J, Kišš V, Aydın E, Pagáč J, Božiková M, Bilčík M, Minárik M. Climate Change Impact on the Duration of Great Vegetation Period and Vegetation Period of Beetroot and Watermelon in Slovakia. Atmosphere. 2022; 13(10):1641. https://doi.org/10.3390/atmos13101641
Chicago/Turabian StyleČimo, Ján, Vladimír Kišš, Elena Aydın, Jakub Pagáč, Monika Božiková, Matúš Bilčík, and Martin Minárik. 2022. "Climate Change Impact on the Duration of Great Vegetation Period and Vegetation Period of Beetroot and Watermelon in Slovakia" Atmosphere 13, no. 10: 1641. https://doi.org/10.3390/atmos13101641