Article

Ionospheric Disturbances after the 2022 Hunga Tonga-Hunga Ha’apai Eruption above Indonesia from GNSS-TEC Observations

1
Faculty of Earth Sciences (FITB), Institut Teknologi Bandung (ITB), Bandung 40116, Indonesia
2
Department Survey and Mapping, Politeknik Sinar Mas Berau Coal, Kecamatan Tanjung Redeb, Berau 77315, Indonesia
3
Shanghai Astronomical Observatory, Chinese Academy of Sciences, Shanghai 200030, China
4
Department of Earth and Planetary Sciences, Hokkaido University, N10 W8, Kita-ku, Sapporo 060-0810, Japan
*
Author to whom correspondence should be addressed.
Atmosphere 2022, 13(10), 1615; https://doi.org/10.3390/atmos13101615
Submission received: 13 September 2022 / Revised: 28 September 2022 / Accepted: 30 September 2022 / Published: 3 October 2022
(This article belongs to the Special Issue Recent Advances in Ionosphere Observation and Investigation)

Abstract

:
On 15 January 2022, a VEI 5 eruption occurred at the submarine Hunga Tonga-Hunga Ha’apai (HTHH) Volcano in the Southwest Pacific, causing an ash plume reaching a height of 50–55 km. The eruption generated strong acoustic-gravity waves in the near-field and stations all over the world recorded Lamb waves (LW) that travelled around the earth multiple times at a speed of ~0.3 km/s. Here we report ionospheric anomalies due to the LW over Indonesian islands, 5000–10,000 km away from the volcano, in terms of changes in total electron contents (TEC) using the nationwide network of GNSS stations. We detected ionospheric anomalies travelling above Indonesia several times both westward and eastward. The first passage of LW over Java caused strong TEC increases of >12 TECU. The wave circled the earth and returned to Java on subsequent days. The second passage was recorded early 1/17, the anomaly decayed to 6 TECU. We also detected the passage of long-path waves propagating from west to east. In addition to such anomalies, we examined the existence of ionospheric disturbances apparently propagating from the geomagnetic conjugate point of the volcano that could possibly emerge in Indonesia. However, their signatures in Indonesia were not clear.

1. Introduction

The 15 January 2022 eruption of the submarine volcano Hunga Tonga-Hunga Ha’apai (HTHH), in the Southwest Pacific, was the first VEI 5 explosion of this century. It caused many researchers to study its impact using various geophysical sensors. Carr et al. [1] reported that the ash plume from this eruption reached a height of 50–55 km from satellite imagery. The event triggered the propagation of Lamb waves propagating radially across the earth at a speed of ~0.3 km/s [2]. A dense network of barometer stations in Japan (~8000 km from the HTHH) recorded temporary increases in air pressure of ~1.5 hPa approximately 7 h after the eruption [3]. The HTHH eruption also caused tsunami waves to spread throughout the world, as recorded by tide gauges in various regions of the world [4,5,6].
In addition, the HTHH eruption disturbed the upper atmosphere [7,8]. Past observations of ionospheric total electron content (TEC) via global navigation satellite systems (GNSS) showed that large volcanic eruptions cause different types of ionospheric disturbances (Heki, under review) [9], e.g., temporary TEC changes with N-shape waveforms ~10 min after Vulcanian explosions [10,11,12] and TEC oscillations in atmospheric resonance frequencies during the continuous Plinian eruptions [13]. Astafyeva et al. [14] analysed the ionospheric response to the HTHH eruption based on near-field observations and clarified the detailed eruption sequence. Ionospheric disturbances associated with the propagation of Lamb waves (LW) in the lower atmosphere were observed to have travelled around the earth several times (e.g., [3]). Such ionospheric disturbances are believed to be caused by the upward leakage of energy from LW [8].
The ionospheric disturbance caused by the HTHH eruption was studied using dense networks of GNSS receivers in several countries, such as New Zealand, Australia, South Africa, USA, China, and Japan, together with sparse stations distributed all over the world [7,13,15]. These data show a consistent propagation speed of ~0.3 km/s. Heki [3] used a geostationary satellite providing Quasi-Zenith Satellite System (QZSS) data from GNSS stations in Japan and showed that the disturbance passed over the country in two directions, twice from southeast to northwest (short path) and twice from northwest to southeast (long path). The repeated passages of LW were also recorded by air pressure measurements in Japan [3,6] and worldwide [16].
Apart from the disturbances directly caused by the LW propagating near observing stations, Lin et al. [17] found that disturbances with the same spatial structure as those in the southern hemisphere appeared simultaneously in the northern hemisphere. These were anomalies that appeared as mirror images of those in the geomagnetic conjugate regions in the other hemisphere, being linked through the geomagnetic fields. Shinbori et al. [18] emphasised that electric fields generated in the E region of the ionosphere played an important role in such simultaneous emergences of conjugated ionospheric disturbances.
Such ionospheric disturbances would have occurred in Indonesia, located 5000–10,000 km away from HTHH. However, there has not been a detailed report, except for a few IGS stations analysed in Themens et al. [7]. Here, we report the detection of ionospheric disturbances triggered by the atmospheric LW in Indonesia using stations in and around Java and Sumatra using regional GNSS networks. We discuss data over the four-day period to show repeated passage of the disturbances, similar to Japan [3]. We also looked for signatures of possible conjugated disturbances of LW travelling in the northern hemisphere.

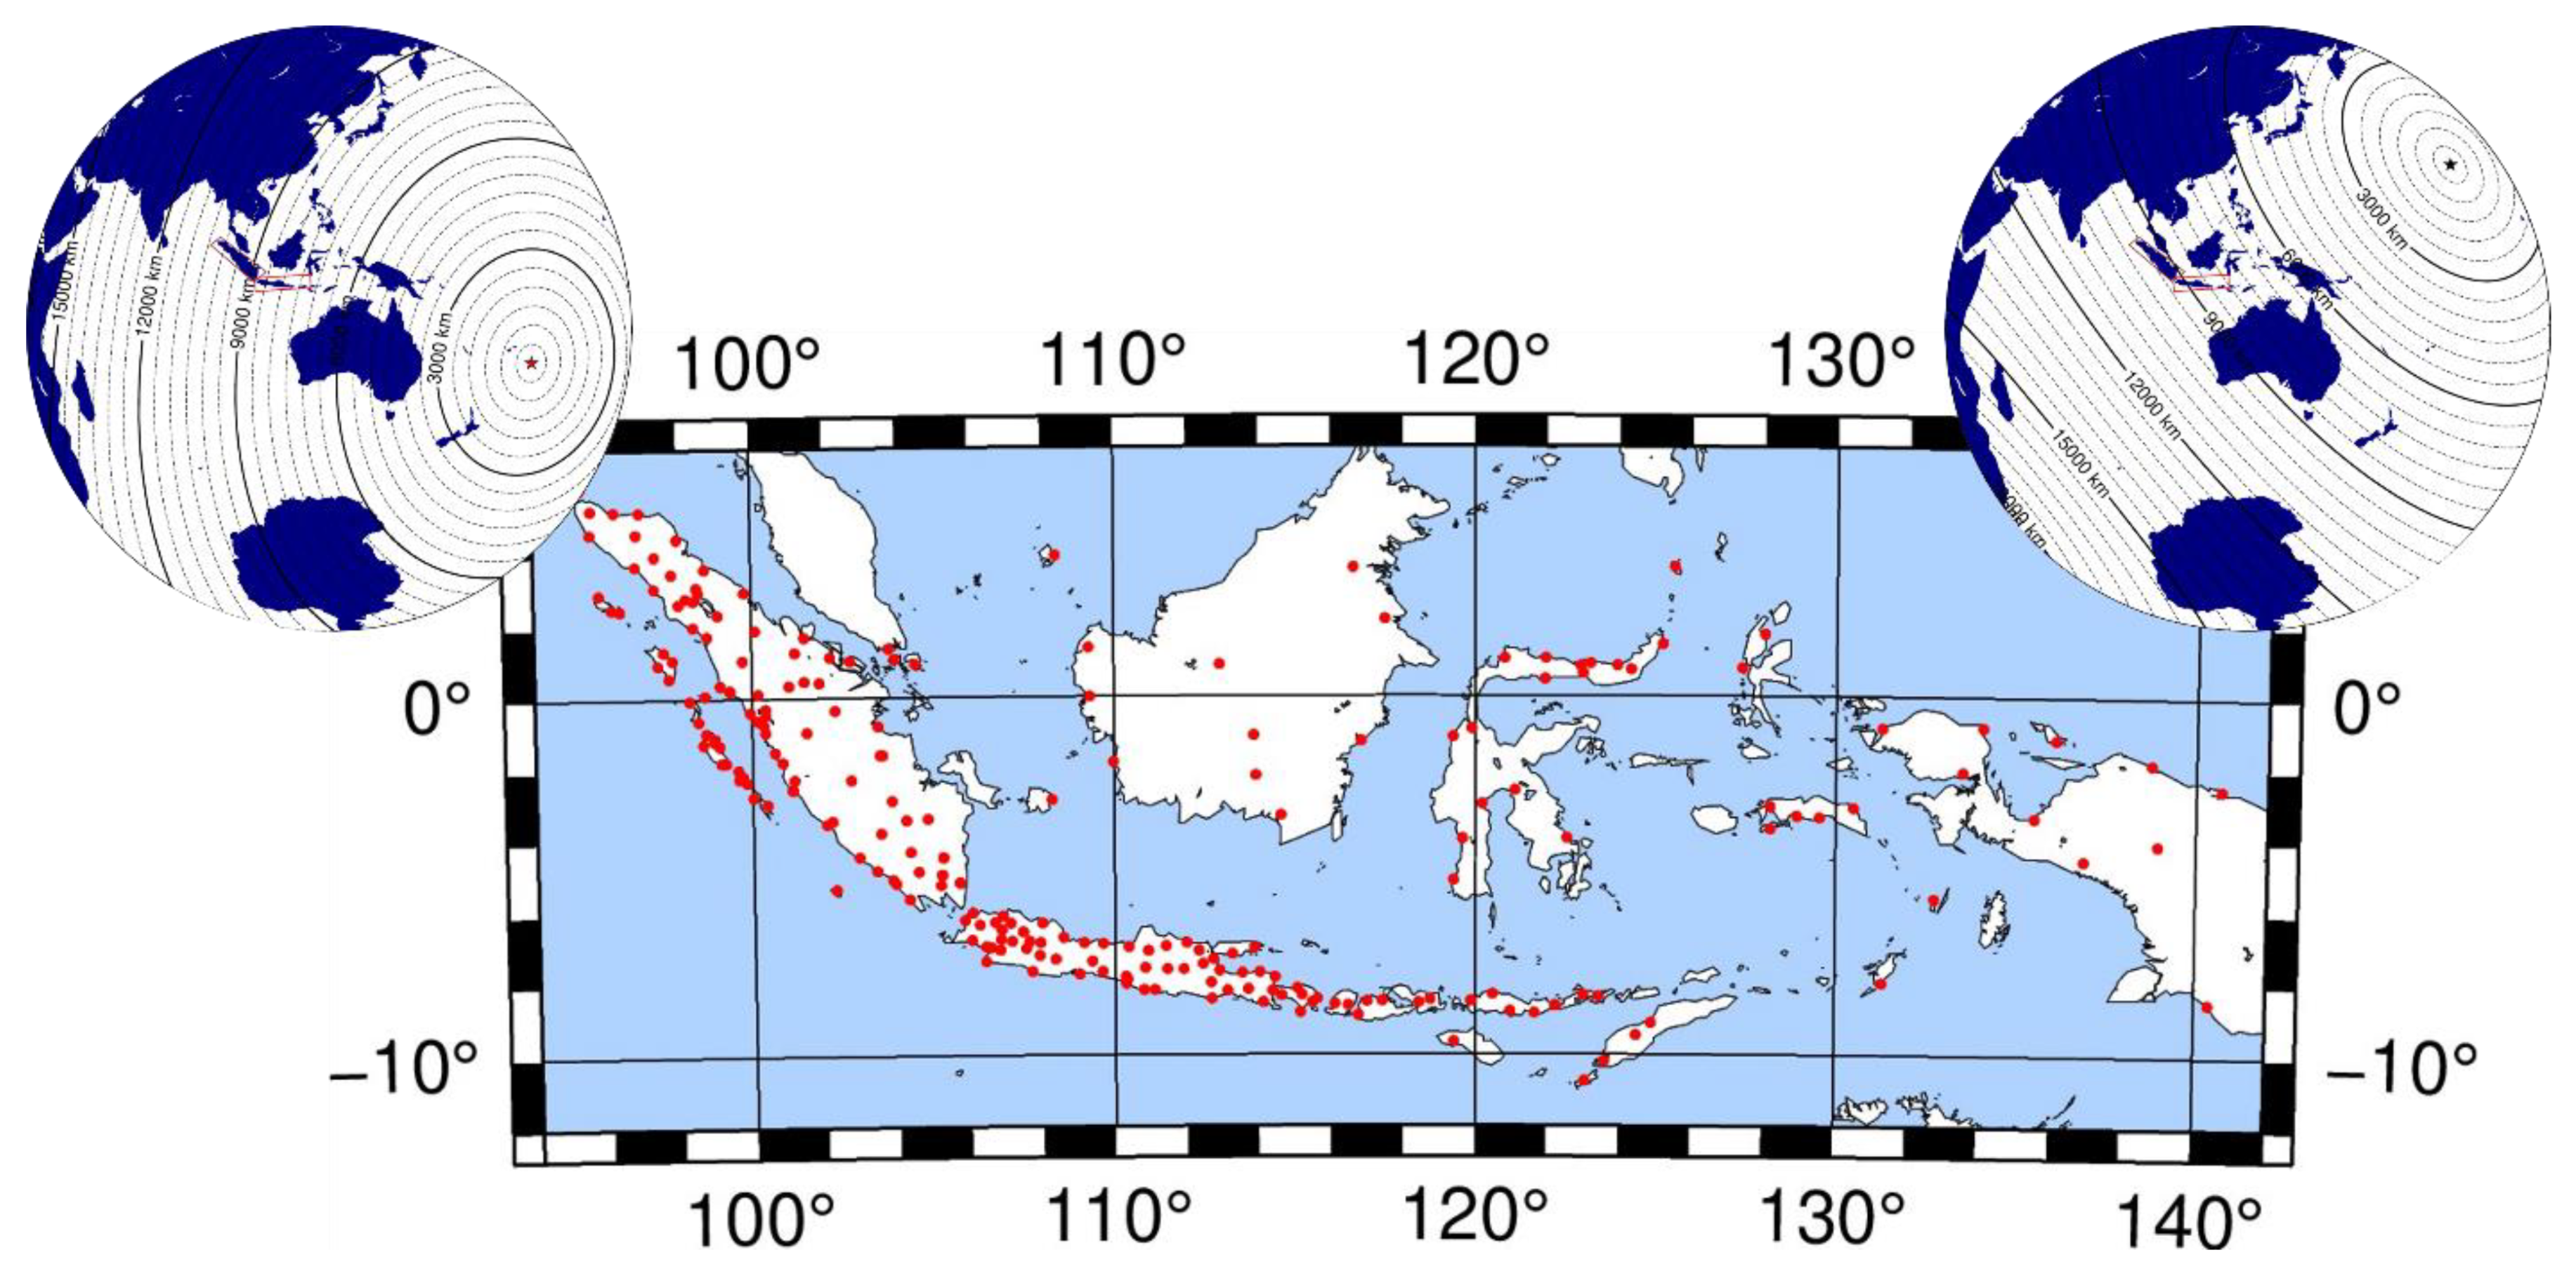
2. Dataset and Methods

We used RINEX raw data files with a 30-s sampling rate from 170 GNSS stations, mainly in Java and Sumatra, Indonesia, operated by Badan Informasi Geospasial (BIG), and from 35 stations in Sumatra, run by Earth Observation of Singapore (EOS) and Badan Riset dan Inovasi Nasional (BRIN) (Figure 1). The derivation of slant TEC (STEC) and TEC along the line-of-sight (LoS) was performed based on the phase difference between the two L-band carrier signals (L1 and L2). TEC is expressed using the unit TECU (TEC unit), which corresponds to 1016 el/m2. Differential code biases of GPS satellites were obtained from the header information of the Global Ionosphere Maps (GIM) file downloaded from the University of Berne (aiub.unibe.ch/CODE, accessed on 29 June 2022). Receiver biases were determined using the minimum scalloping method [19]. For GLONASS data, we removed ambiguities by minimising the obtained VTEC and those calculated from GIM.
We assumed a thin layer at 300 km altitude in calculating the intersection between LoS and the ionosphere, the ionospheric pierce point (IPP), and we showed its surface projection, the sub-ionospheric point (SIP), to indicate the location of the ionosphere measured by satellite–receiver pairs [20]. We used only GPS and GLONASS in this study.
Next, we calculated the estimated range of arrival times of the LW to Indonesia (time from the LW arrival at the easternmost station in Java to the westernmost station in Sumatra) considering the position of the HTHH (175.385 W; 20.550 S), assuming the speed of 0.3 km/s. Heki [3] identified passage of the anomalies in two opposite directions, from SW to NE and from NE to SW, corresponding to LW propagating along the short and long paths, respectively, in Japan. Therefore, we also estimated arrival times for all these LW in two opposite directions, as well as repeated passages. Table 1 describes the estimated arrival times of LW in Indonesia (Java and Sumatra regions).
Table 1 also shows the estimated arrival times of possible conjugated LW in Indonesia, derived from the conjugated point of HTHH in the northern hemisphere (166.85 W; 26.22 N), propagating in the southern hemisphere at the same speed as LW [17,18].

3. Ionospheric Disturbances Due to the HTHH Eruption

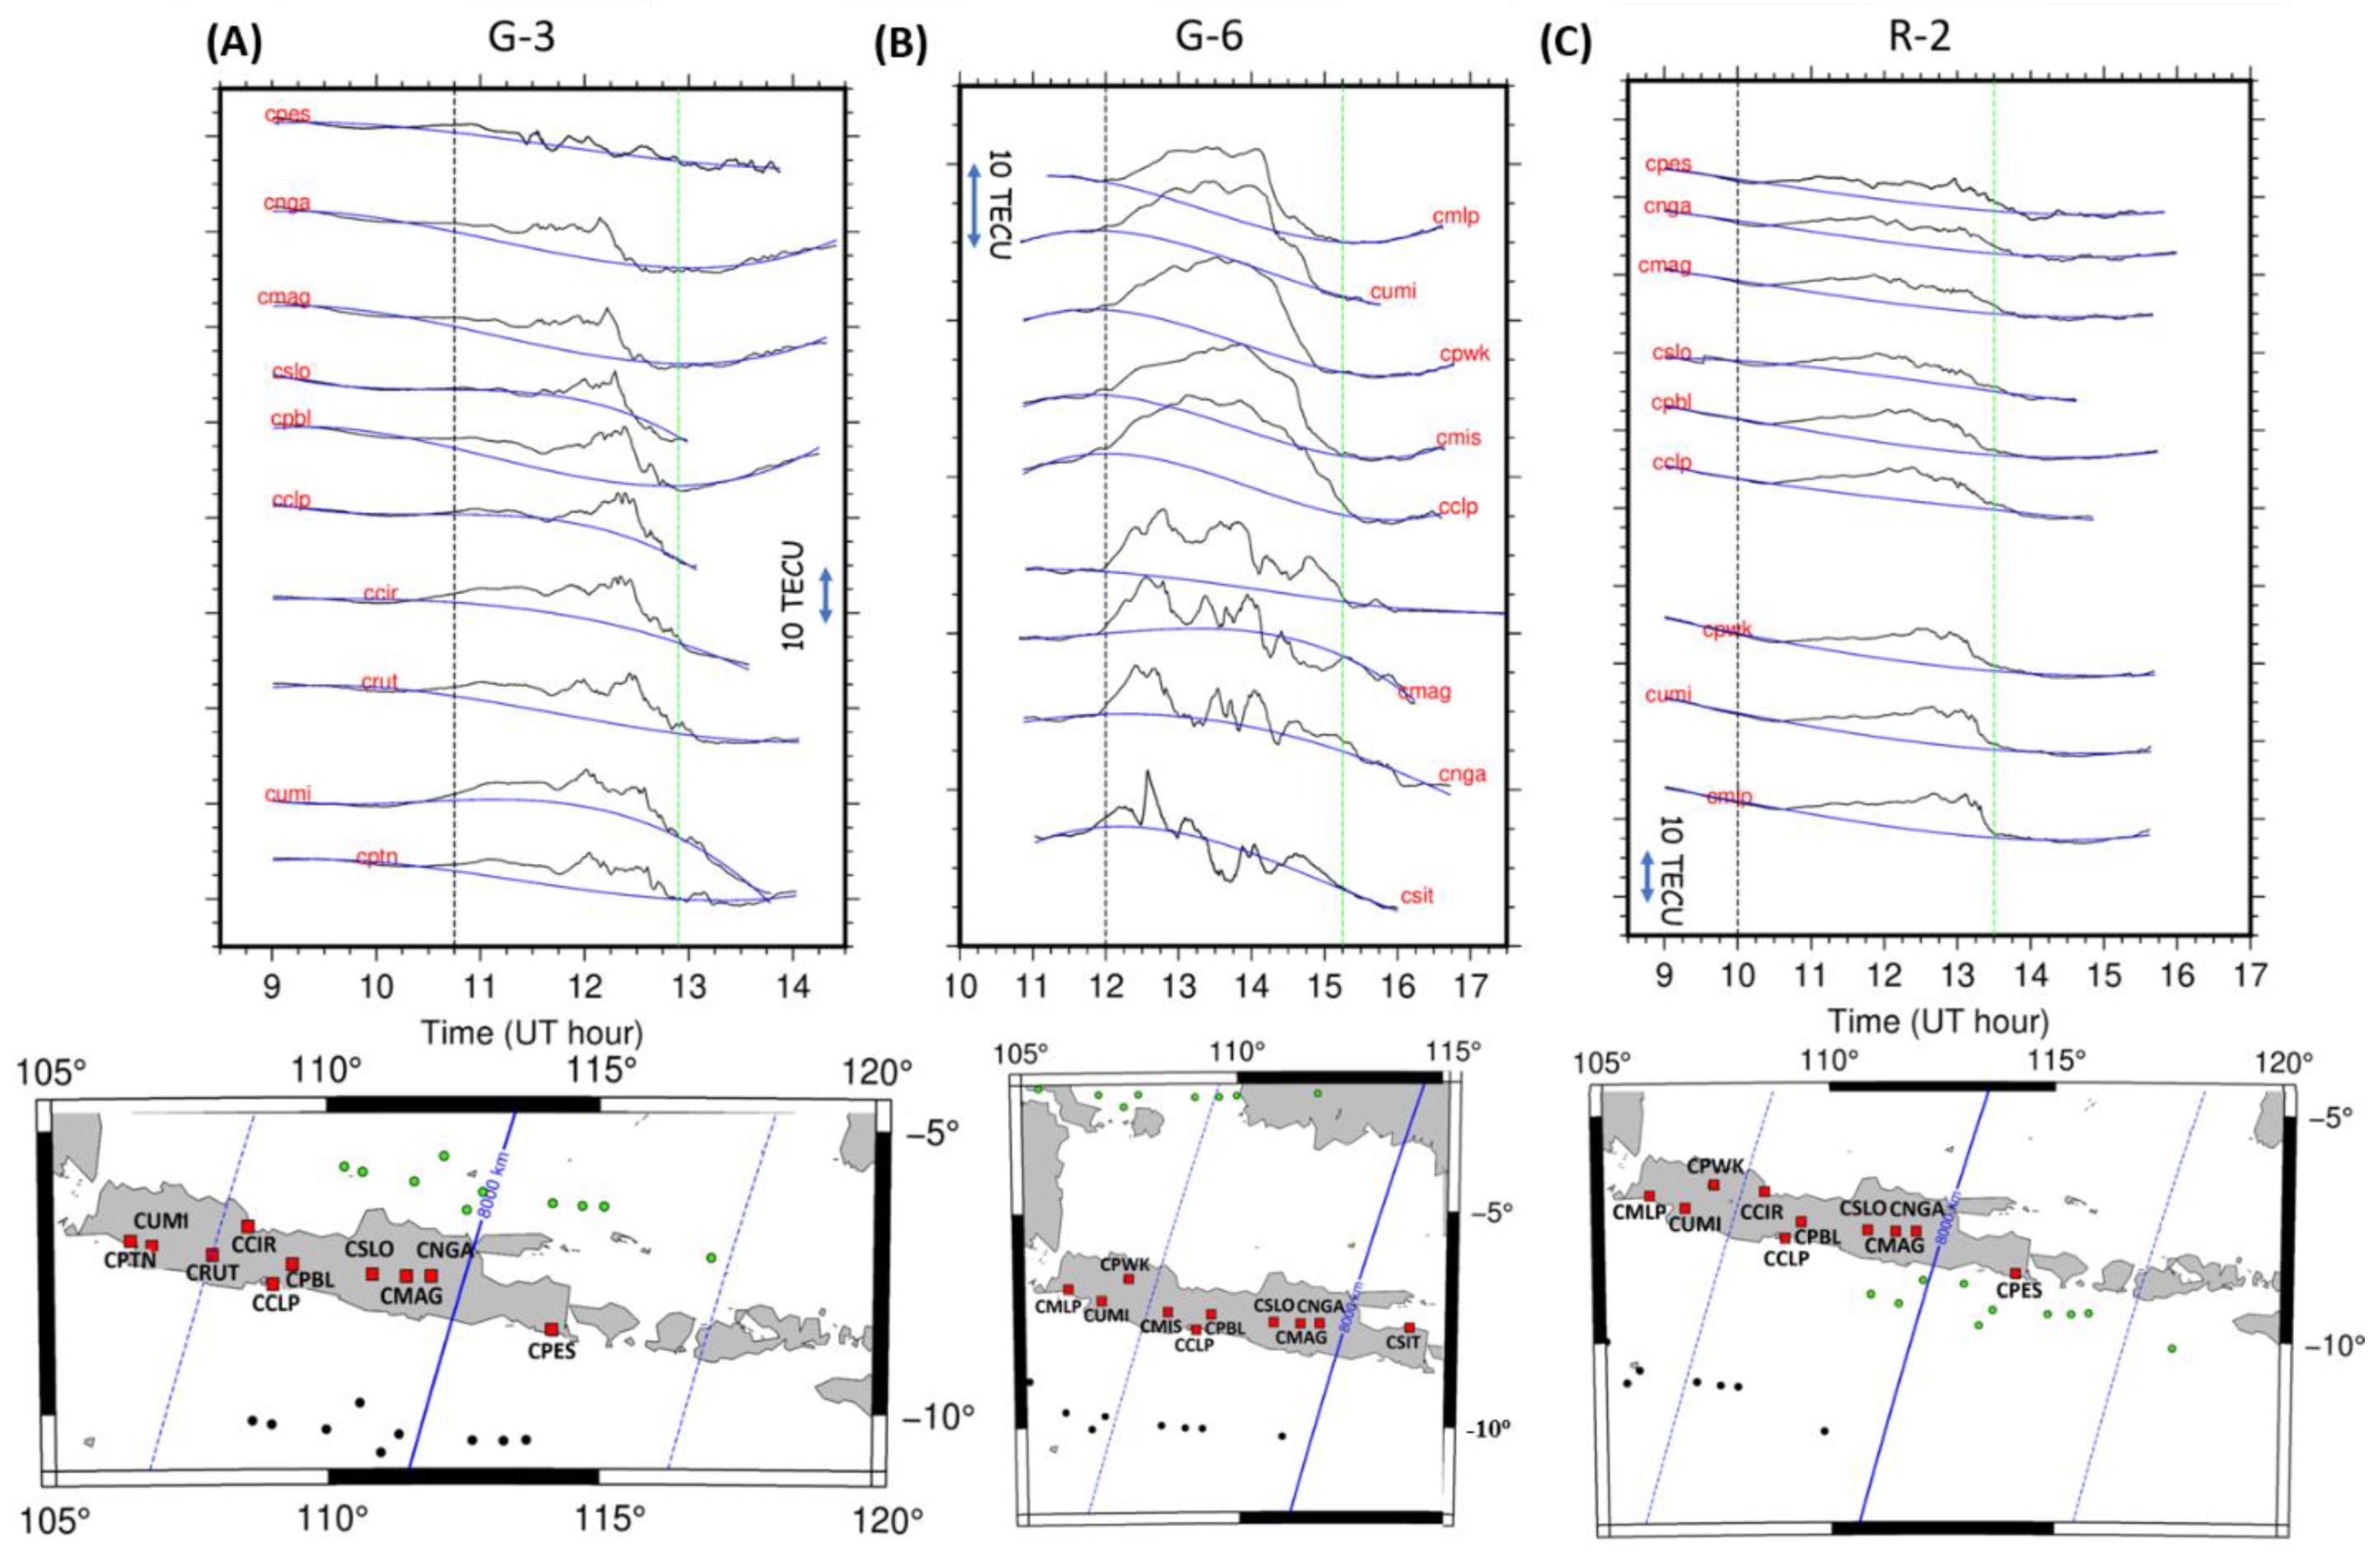
3.1. Observations in Java

On the day of the HTHH eruption (15 January 2022), the six GPS (G1, G3, G6, G7, G30, G9) and one GLONASS (R2) satellites clearly captured disturbance signals induced by LW passages between 11:10 UT (signal arrival in Java) and 13:35 UT (signal leaving Sumatra) (Figure 2, Figure 3, Figure A1 and Figure A2). These can be seen, e.g., at ~11:10 UT (Figure 2A) as the TEC increased to ~10 TECU, lasting for a few tens of minutes. The background VTEC in this period above Java was ~20 TECU (Figure A3). The arrival times of the TEC increases were earlier and later in eastern and western stations, respectively, reflecting the westward propagation of the disturbance. To confirm the reality of the LW signatures, we compared the TEC behaviour with that on days without large volcanic eruptions or strong geomagnetic activities. Following Astafyeva et al. [14], we used January 10, 11 and 12 as the reference days. Figure A4A shows that the VTEC observed with G1 on the reference days did not show significant disturbances.
In Figure 2A, VTEC peaks continued to appear after ~12:10 UT, although LW left this region by this time. We suspect that this peak may correspond to the arrival of the conjugate disturbances, i.e., the mirror image of the disturbances occurring in the northern hemisphere associated with the passage of LW there. Such conjugated signatures would be expected to arrive in Java at ~12:40 UT (Table 1). We will discuss this possibility in the next chapter.
The VTEC time series in Figure A2A shows similarity in VTEC changes at pairs of stations close to each other (Java, G9 satellite). For example, CPWK and CLBG stations had similar waveforms when the LW signature arrived in the Southern part of Java at ~12:00 UT (conjugated signatures at ~13:20 UT were also seen in both stations). The same was also found in other neighbouring pairs such as CBTL–CSLO, CMLG–CPAS, and CPES–CNYU. At the same time, waveforms were significantly different between distant stations, suggesting their evolution associated with propagation. Next, we will see the TEC variation over the Sumatra region.

3.2. Observations in Sumatra

The propagation of the disturbance in the Sumatra region, from east to west, is clearly seen in the TEC time series as the sudden increase around 12 UT in Figure 3A. A map of the stations and SIP positions, together with the LW wavefronts (red lines) calculated assuming 0.3 km/s velocity, is shown along with the G30 SIPs in Figure 3B. VTEC increases were found only after the calculated LW wavefront passage over the Sumatra Island. We see that the TEC disturbance amplitude in Sumatra (~6 TECU) was smaller than in Java. This would be because the LW reached the Sumatra Island after sunset, when the background VTEC also decreased to ~10 TECU in the studied time window (Figure A3).
We also looked for signals of possible conjugated anomalies over Sumatra caused by LW travelling in the northern hemisphere. From Table 1, conjugated LW would be expected to leave the northern part of Sumatra at ~14:00 UT. By that time, the background VTEC had decreased to 10 TECU (Figure A3), and we will discuss this point in the next chapter. Figure A4b shows that there were no significant disturbances in VTEC in the Sumatra region on the reference days (same as in Java).

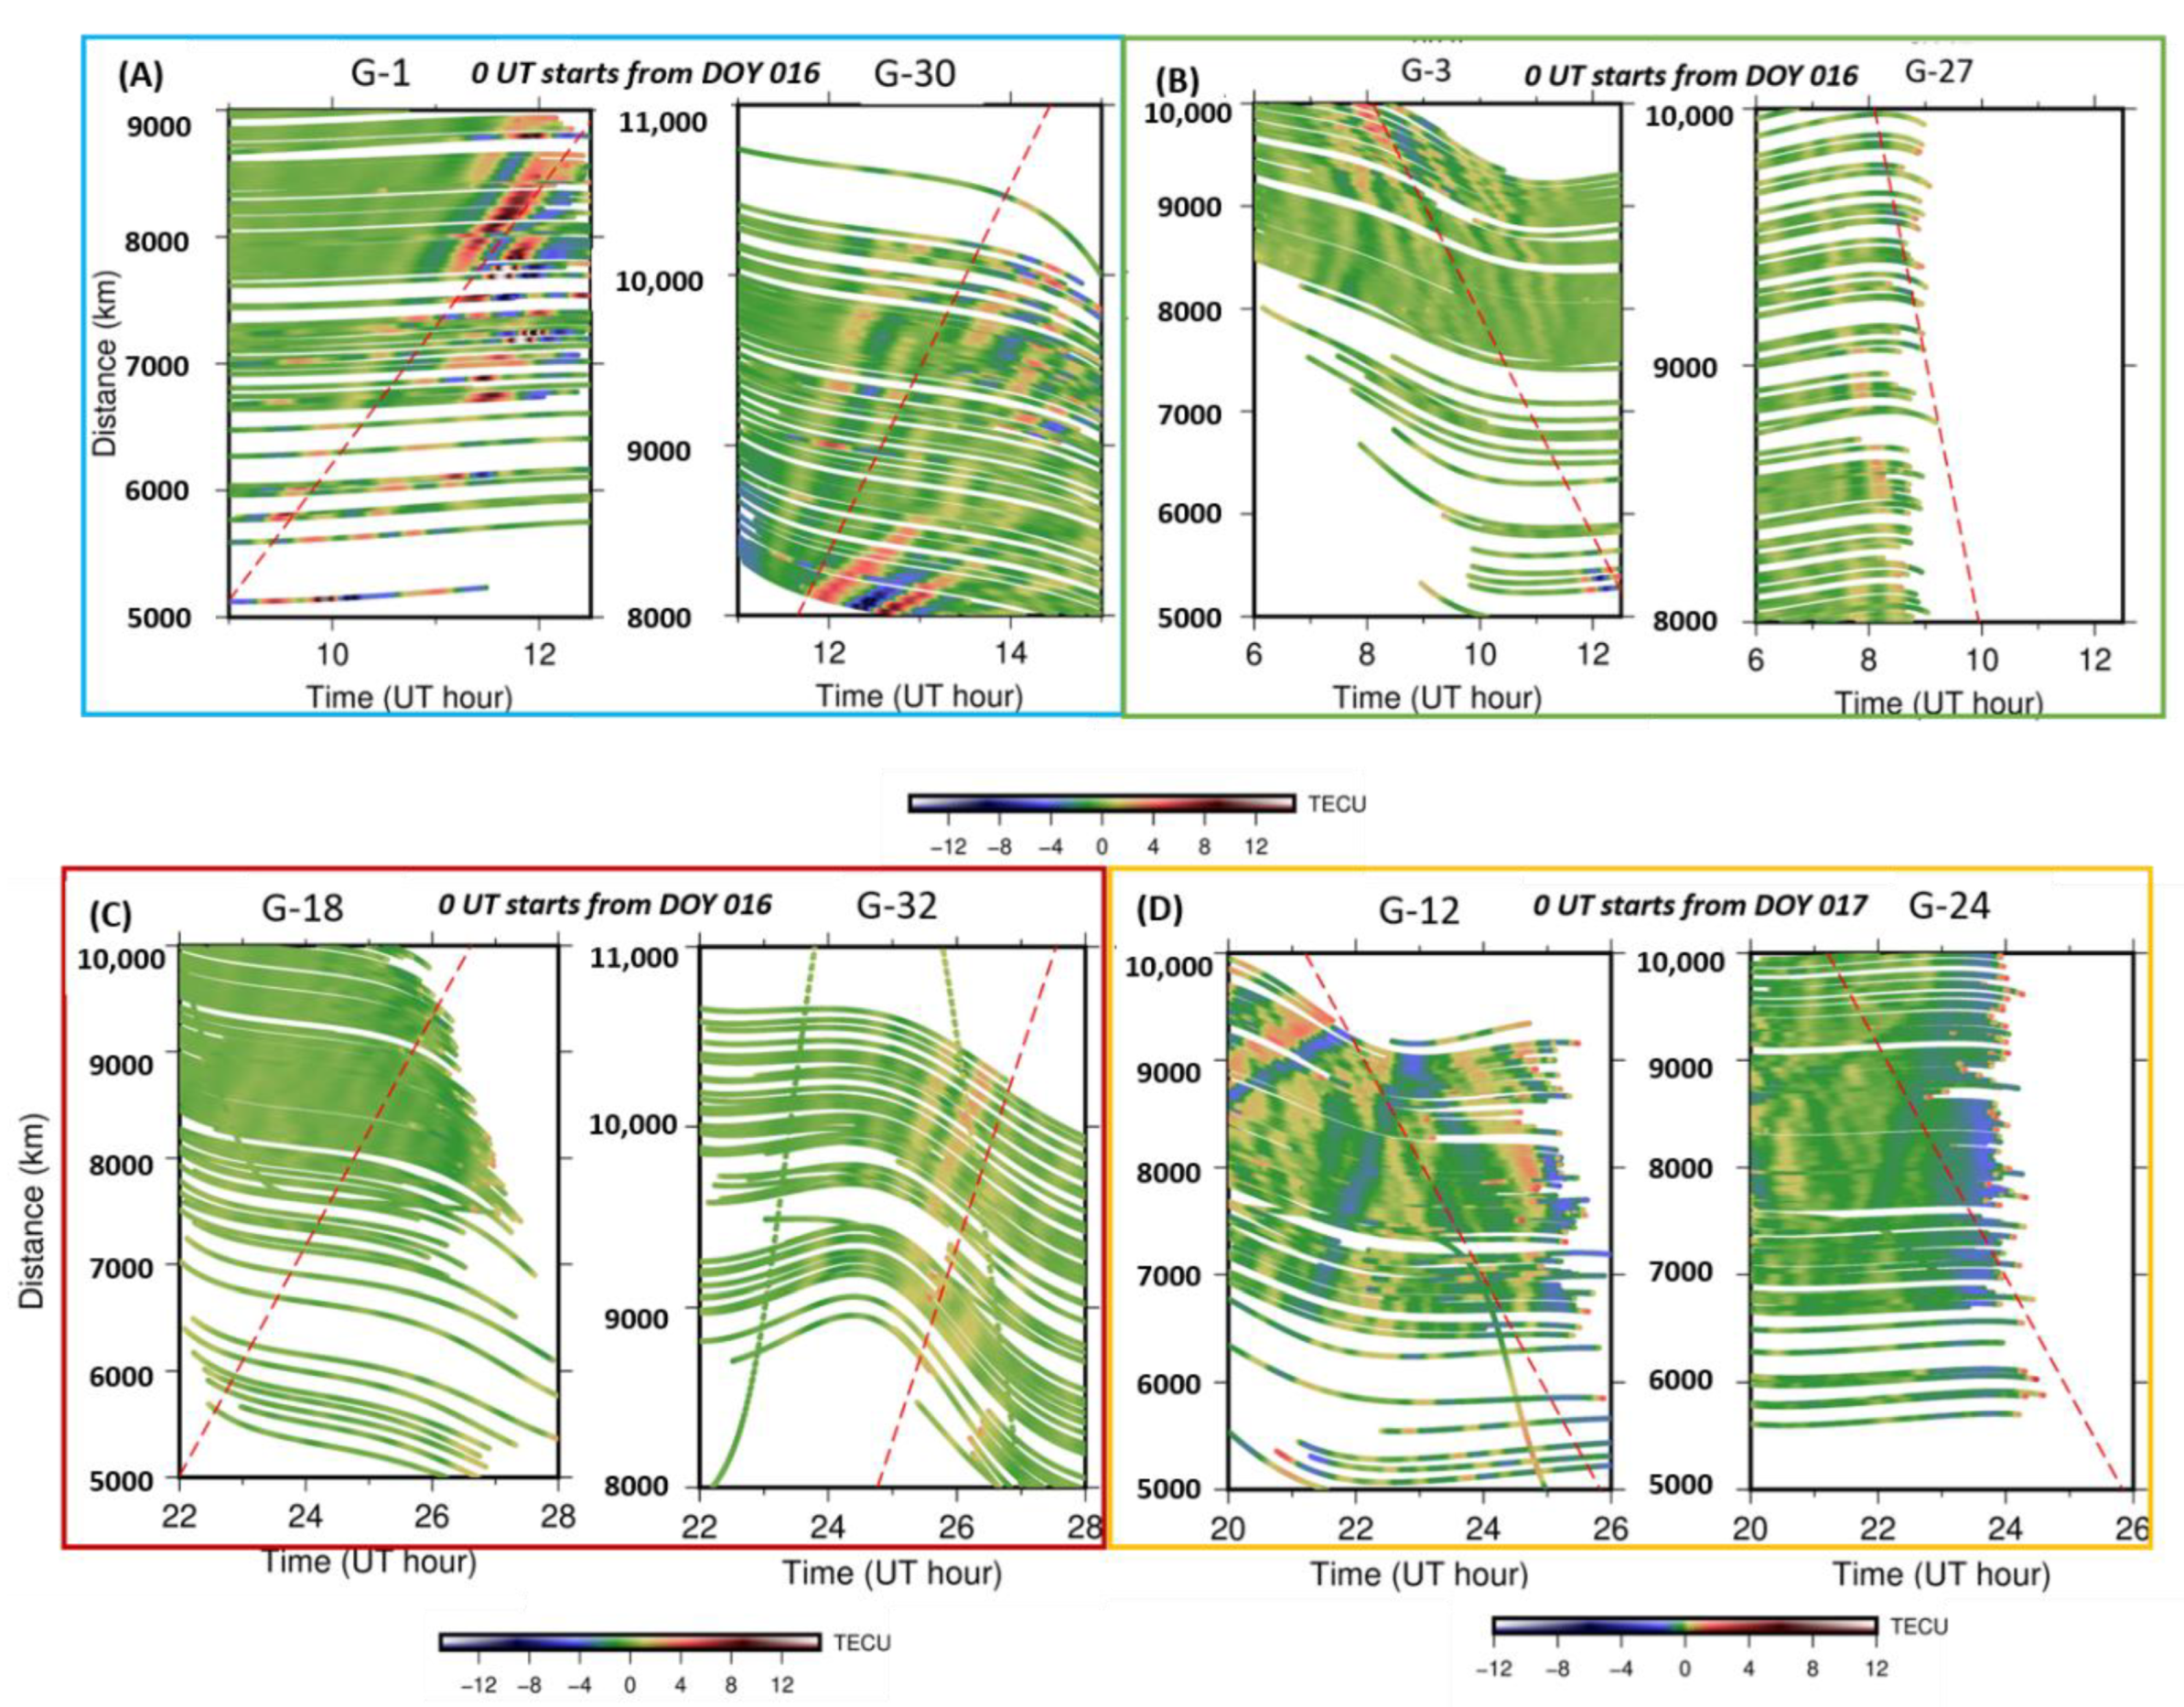
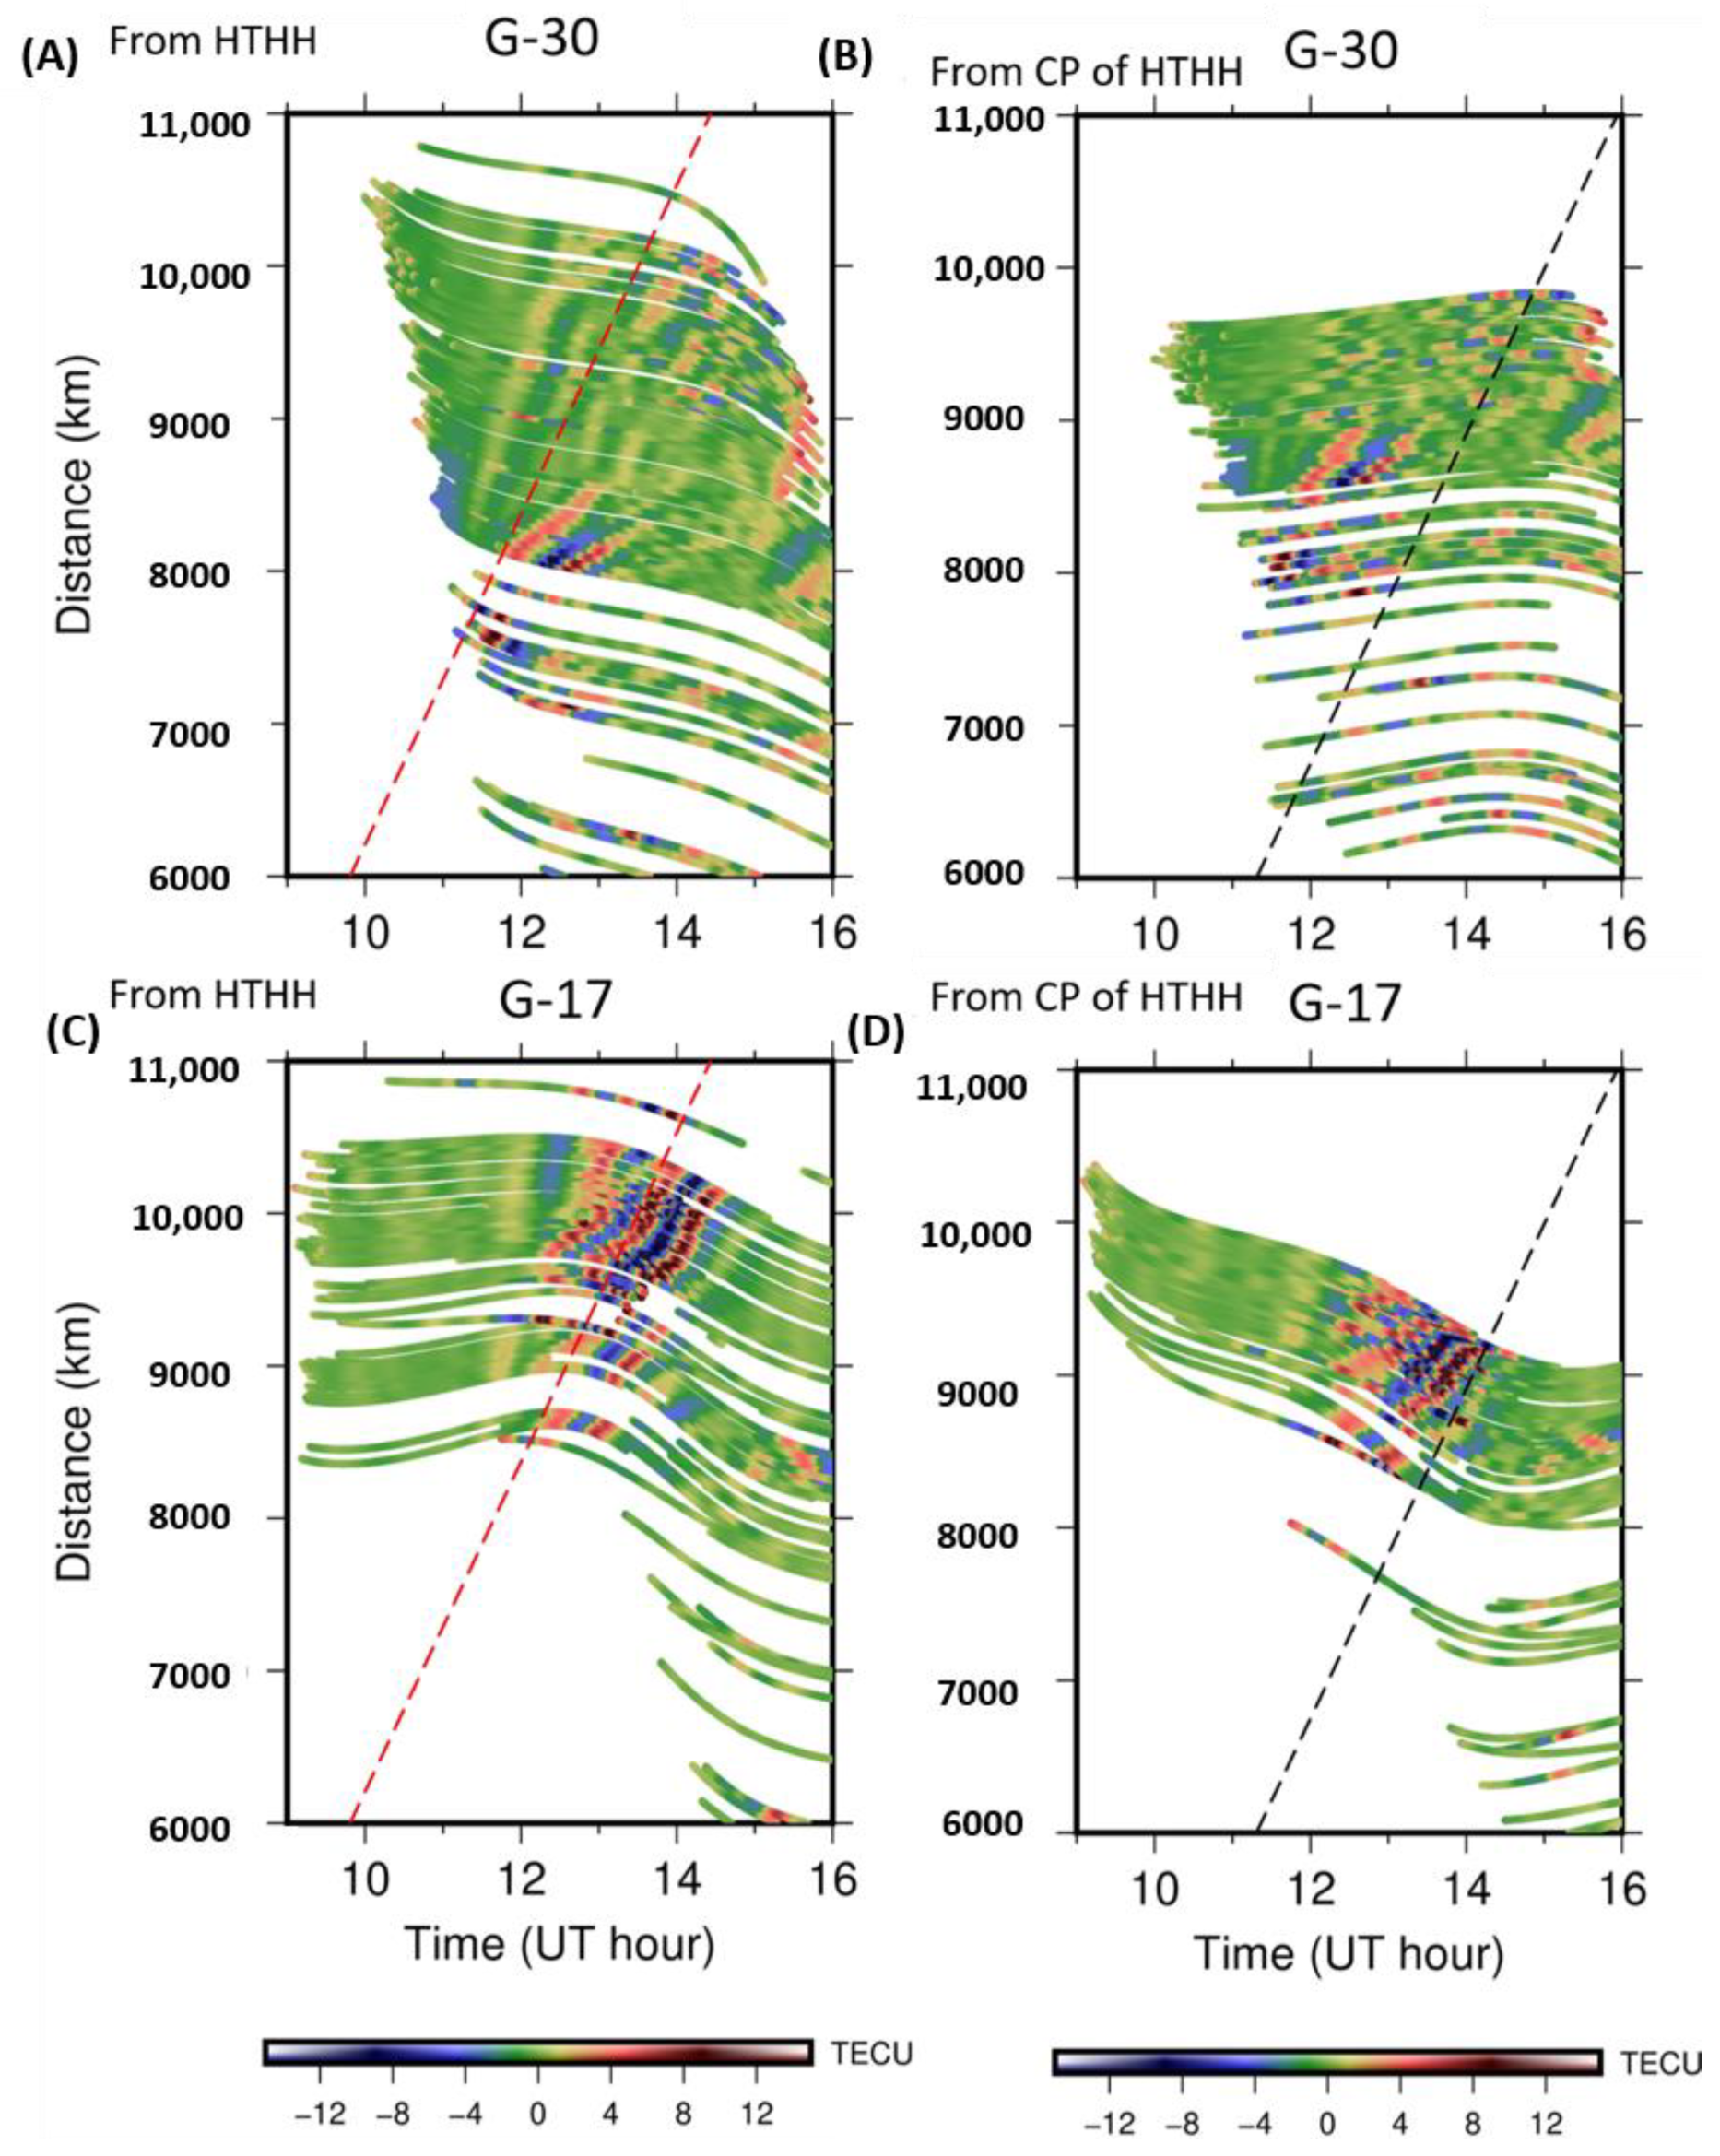
4. TEC Signatures of Repeated Passages of LW

Ionospheric disturbances for the target events listed in Table 1 in Java and Sumatra were extracted using wavelet transformation [21] to isolate components with periods of approximately 30 min to see the disturbances associated with LW passage as performed by Heki [3]. The left and right panels of Figure 4A show the wavelet transformed STEC on Jan. 15 as a function of distance from the volcano and time for the Java and the Sumatra regions using satellites G1 and G30, respectively. The data from the G1 satellite show vivid red, indicating an increase in TEC of >10 TECU. This signature lines up along the red dashed line, indicating the expected passage of LW assuming the speed of 0.3 km/s.
In Figure A5, we also show the same figure using a 12-min wavelet extracting shorter period components. There, owing to better temporal resolution, we see lots of shorter-period internal gravity waves following the long-period main anomaly. The signal in Sumatra (Figure 4A-right) was approximately half as strong as that in Java, which could reflect the difference in background TEC (Figure A3) and/or decay in LW energy associated with propagation. Nevertheless, the signature coincides well with the positive slope, indicating the propagation speed of 0.3 km/s (dashed red line).
The second passage of LW along the long path propagating from west to east in Indonesia was detected using wavelet analysis based on G3 and G27 data (Figure 4B) in the local afternoon on Jan. 16, the day after the eruption. The background VTEC over Sumatra Island at the LW passage time was ~20 TECU (Figure A3), more than during the first passage. However, the observed signal amplitudes were weaker than those of the first passage (Figure 4A), possibly reflecting decay after travelling a longer distance across the long path before arriving in Indonesia. The velocity of the second component well coincides with the assumed speed of −0.3 km/s (dashed red line), but the arrival times were somewhat earlier than expected. Here, we expressed the velocity as a negative value because the propagating direction was opposite (from west to east). Such a difference in arrival time was also found in Japan [3] and is considered to originate from various factors, including differences in atmospheric temperature profiles and winds.
The third passage of LW from east to west was detected in the local morning of 17 January, two days after the eruption (day boundary between 16 and 17 January in UT), as an increase in TEC (Figure 4C). The signatures in Java (Figure 4C, left) become clearer when using a shorter wavelet (Figure A5). The signature was much weaker than that of the first passage, although the background VTEC around Sumatra Island was stronger (Figure A3). This would reflect continuous decay in the disturbance amplitudes, suggesting that the signatures of later LW passages become increasingly difficult to detect. Again, the arrival time and the propagating velocity were not very different from those expected based on the speed of 0.3 km/s.
The fourth passage of the LW was expected to occur in the local morning, three days after the eruption (18 January), from west to east. Figure 4D shows that G12 found clear signals with a negative slope ~2 h after the expected passage time, although G24 did not show any signatures. The expected signatures could be better recognised by using shorter wavelet periods. Figure A5D seems to include lots of weak short period signatures passing over Indonesia at times and velocities consistent with the LW.
In Japan [3], ionospheric LW sometimes arrived earlier than the expected time (~1 h too early for the second passage) but sometimes later (~2 h delay for the third passage). In Indonesia, however, the ionospheric LW arrived almost on time. Such differences might be due to winds and/or differences in atmospheric properties from place to place. In the Japanese case, the LW had to travel through tropical, mid-latitude, and polar regions, while the LW travelled mostly within tropical regions for the Indonesian case, resulting in a uniform travel velocity of ~0.3 km/s.

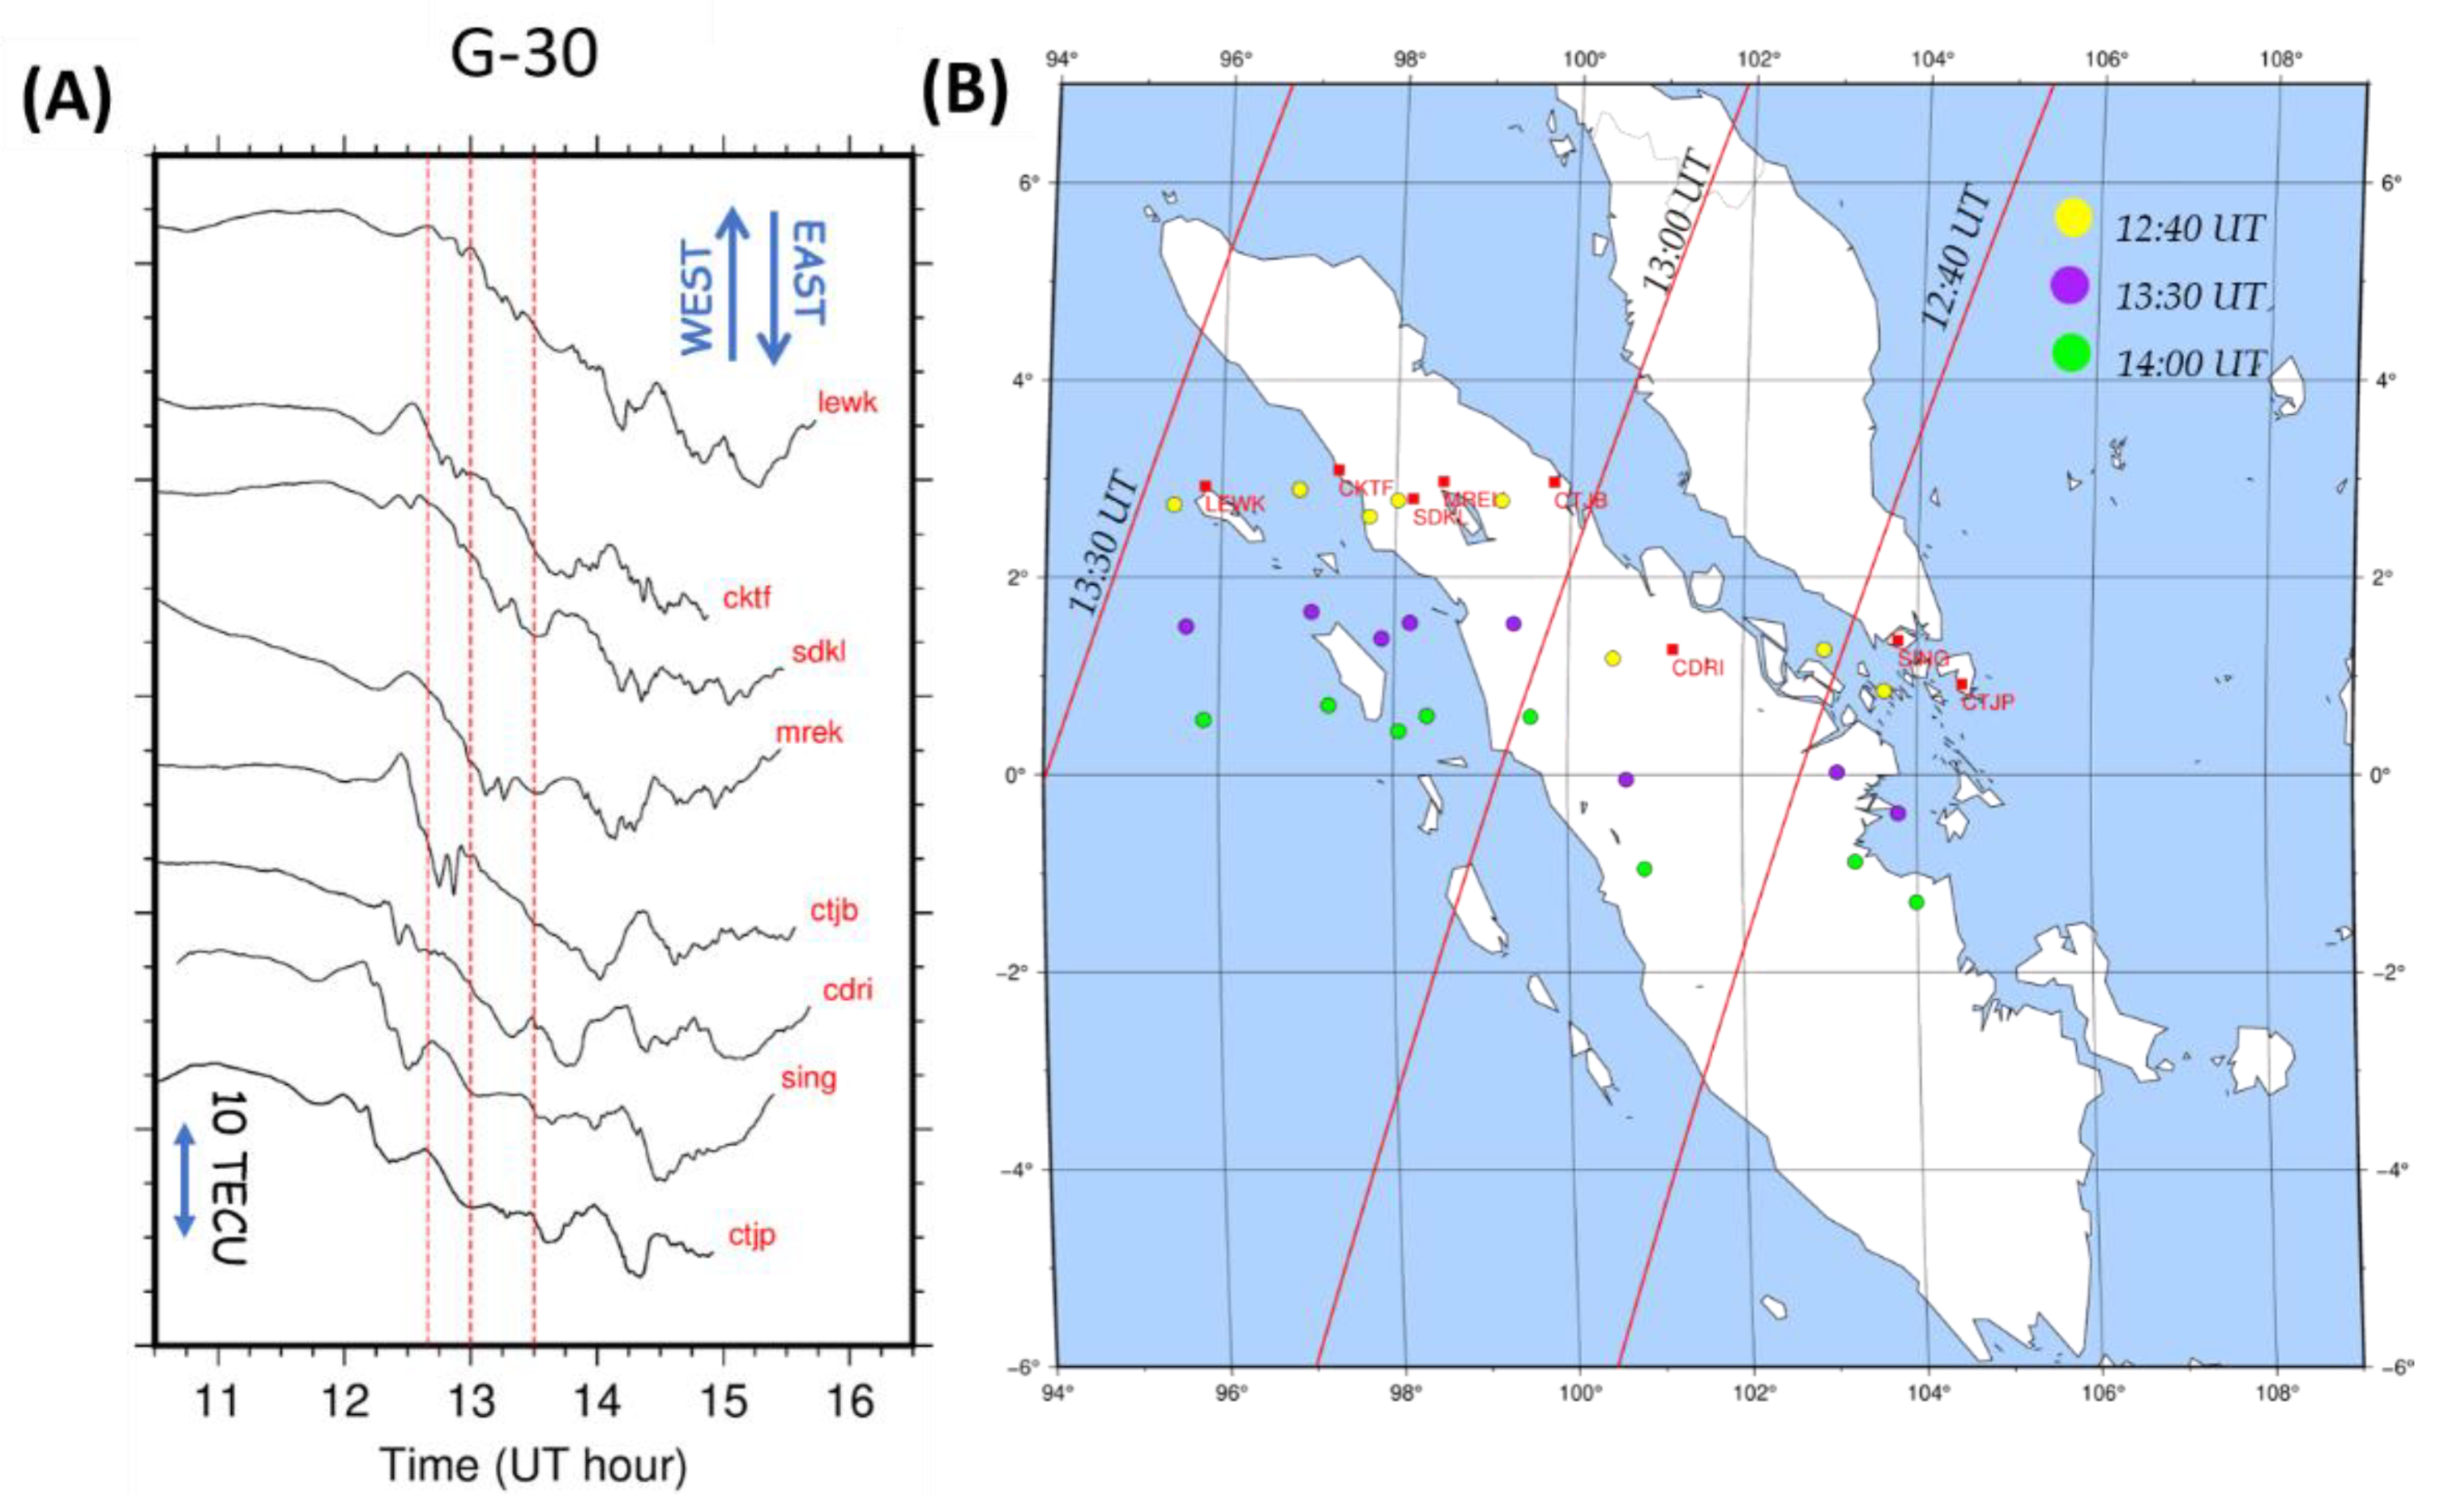
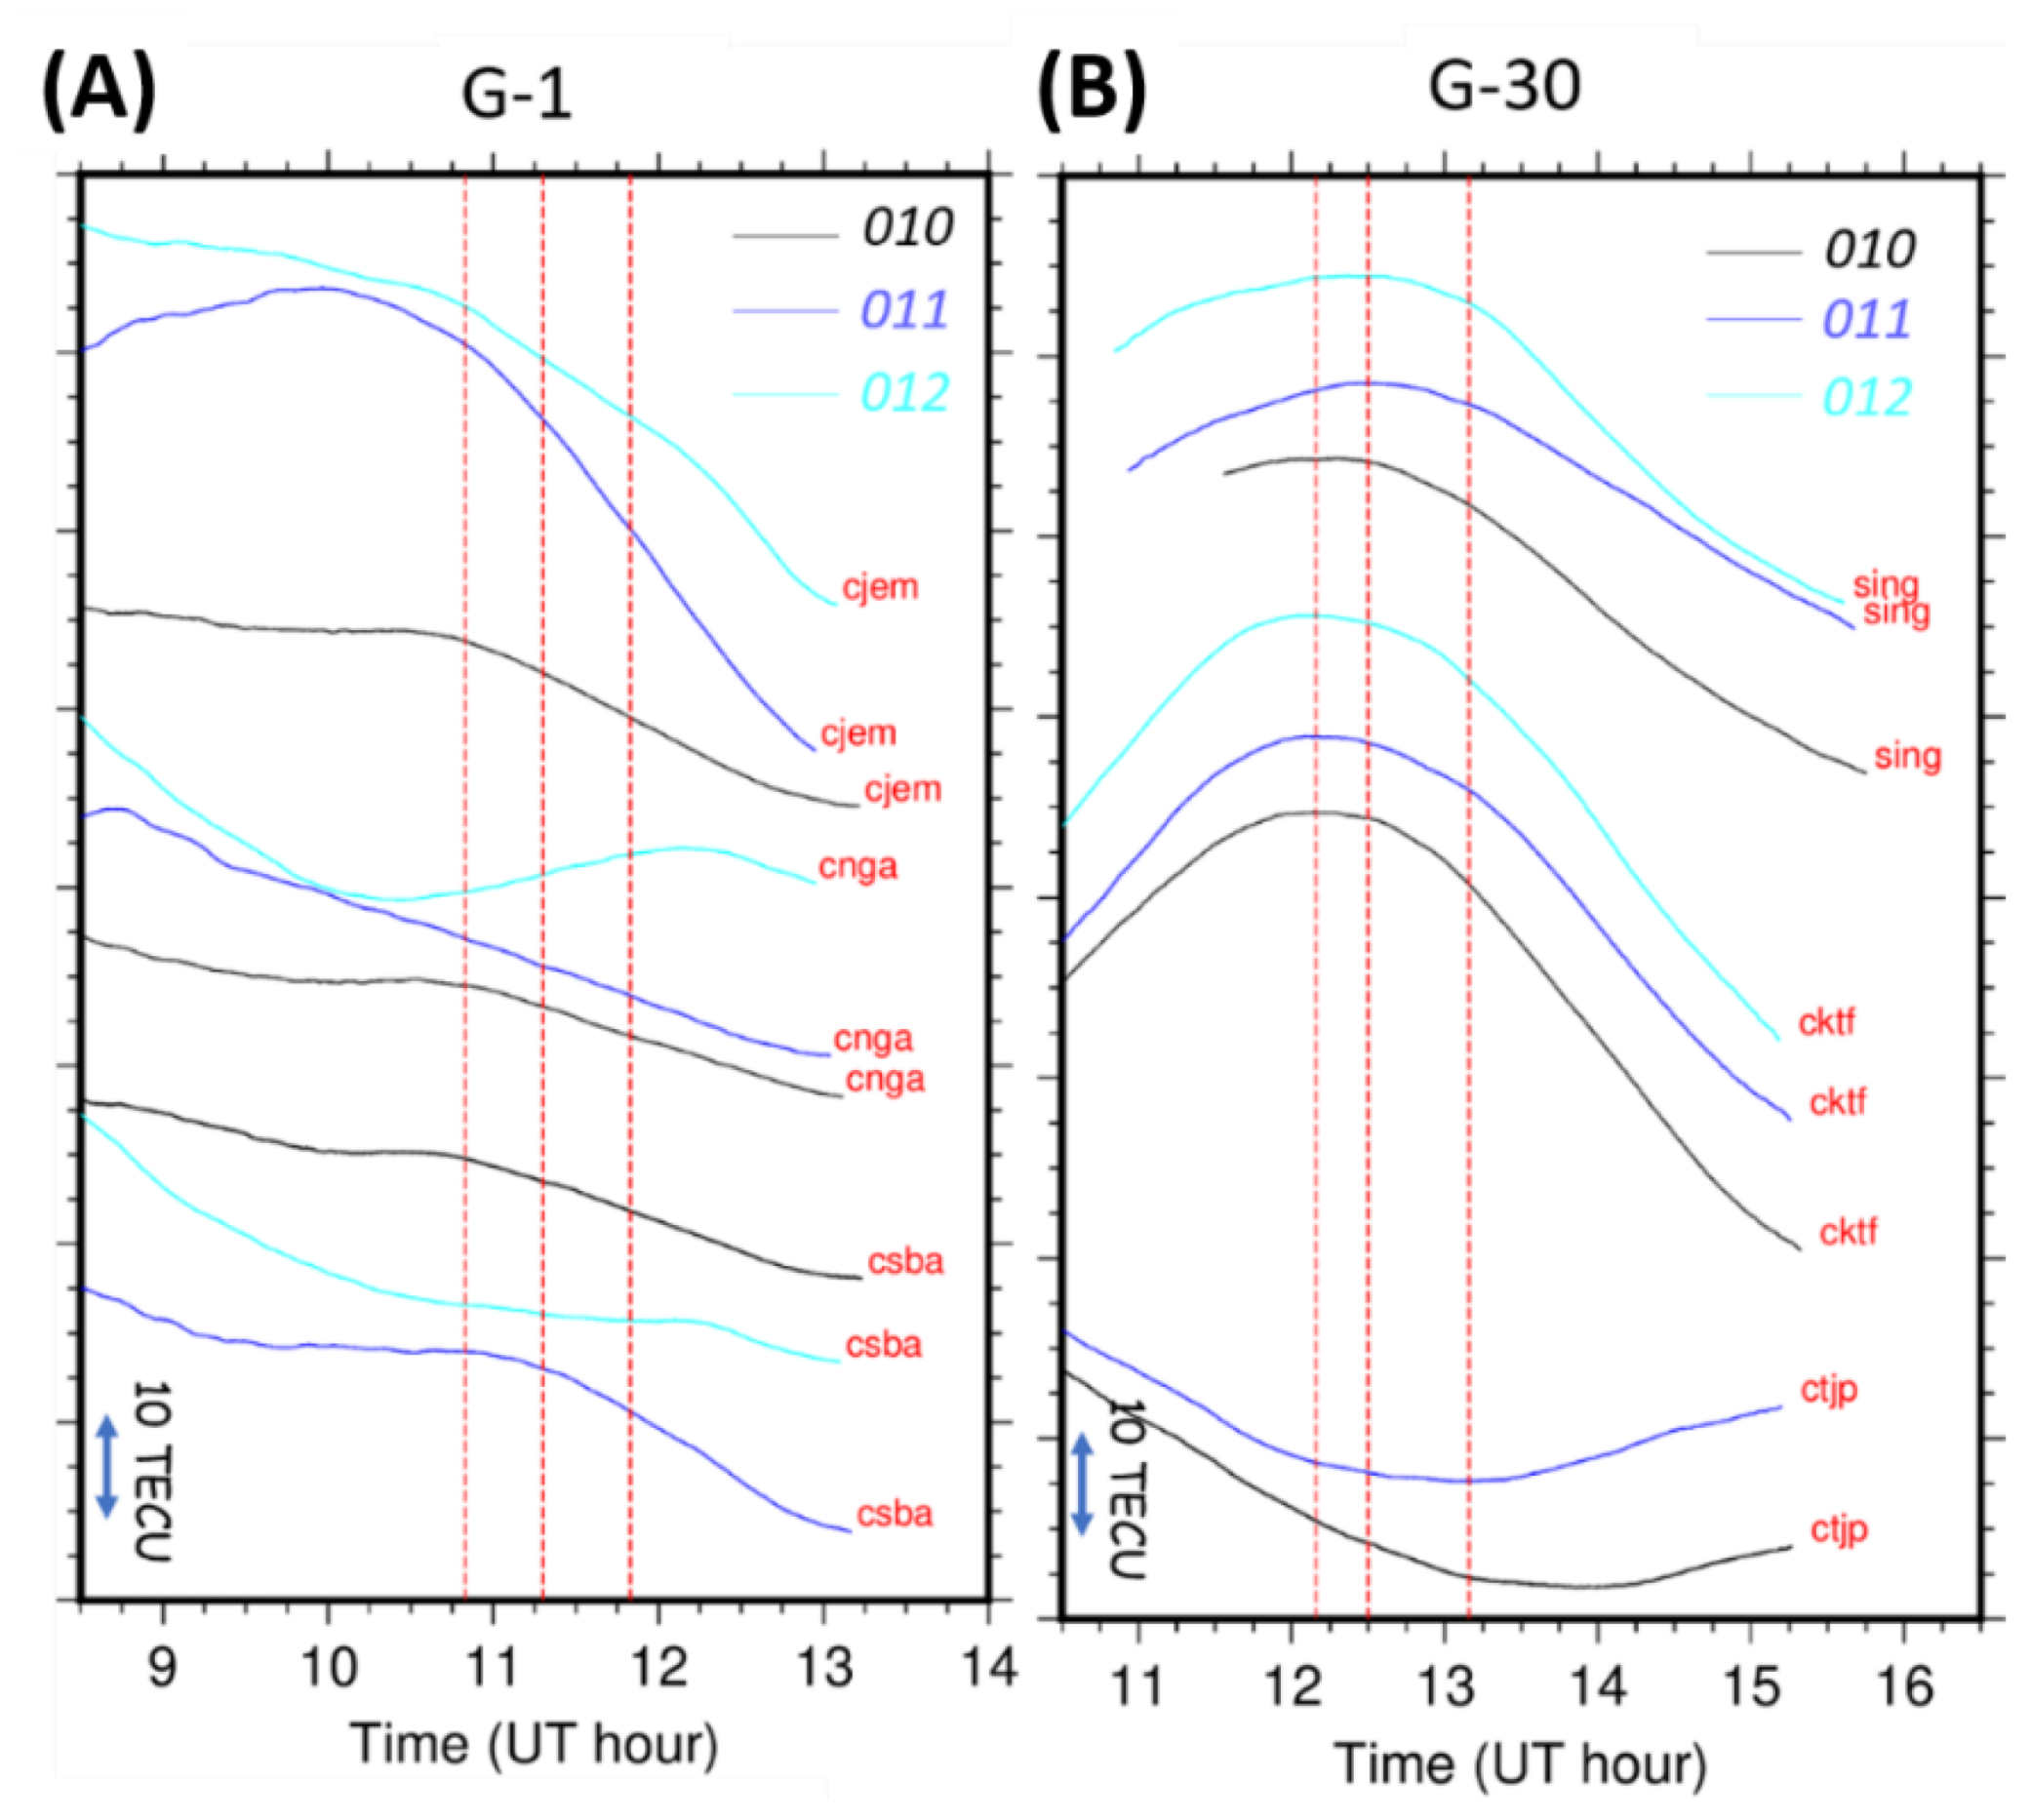
5. Signatures of Conjugated Disturbances over Java and Sumatra

Lin et al. [17] found that conjugated anomalies occurred in the northern hemisphere as a mirror image of the ionospheric disturbances, due to the LW passage in the southern hemisphere. Shinbori et al. [18] proposed a physical mechanism to explain this. They emphasised that LW need to propagate in the daytime region, when sufficient electrons exist in the E region of the ionosphere, to create conjugated anomalies in the other hemisphere through geomagnetic fields. Heki [3] also showed that conjugated anomalies arrived earlier than the main passage of LW in Japan as the mirror image of disturbances propagating in Australia [17]. Here we examine the possibility of occurrences of conjugated anomalies in Indonesia (southern hemisphere) as a mirror image of the disturbances occurring in the northern hemisphere associated with the passage of LW from HTHH.
Table 1 suggests that the passage of the conjugated disturbances occurred ~1.5 h later than the passage of the real LW over Java and Sumatra. This situation is quite different from Japan, where the arrival of the conjugated disturbances was ~3 h earlier than the real LW from HTHH. In other words, Indonesia is a unique region where disturbances due to real LW and conjugated disturbances arrived almost simultaneously.
Our data suggest that such conjugated anomalies did not occur in Indonesia. Figure 5A–D compare the distance–time plots of the STEC anomalies from satellites G17 and G30 via wavelet transformed STEC, calculating distances from the real HTHH and from its geomagnetic conjugate point (CP), respectively. The expected arrival times and velocities from HTHH and its CP are given as red and black dashed lines in Figure 5A,C and Figure 5B,D, respectively. From these figures we find that the anomalies lay better along the prescribed lines in Figure 5A,C than in Figure 5B,D, showing that these anomalies propagated from HTHH rather than its CP. Hence, we think it unlikely that the observed disturbances included those related to conjugated anomalies occurring as mirror images of those in the northern hemisphere. This supports Shinbori et al. [18], who proposed that LW need to propagate in the daylight region, when enough electrons exist in the E region, to generate conjugate anomalies in the other hemisphere.

6. Conclusions

We detected ionospheric disturbances excited by repeated passages of atmospheric LW propagating from the HTHH sub-marine volcano in the Southwest Pacific, following the eruption on 15 January 2022, using GNSS-TEC observations. They showed amplitudes reflecting differences in background VTEC and decay of LW energy. The disturbances propagated twice from east to west and twice from west to east with the time (starting ~4:15 UT) and speed (~0.3 km/s) consistent with LW.
We also discussed the arrival times of the disturbances and found that they mostly arrived “on time” in Indonesia, in contrast to Japan [3], where the arrival times often deviated from the expected times due to atmospheric dynamics (e.g., winds) and atmospheric structure (tropospheric temperature and sound velocity). Future studies on physical models of ionospheric disturbances due to LW passage over Indonesia would be essential to further understand the observed data. Investigations of short-term TEC changes using high-frequency observation data would also enable us to understand the details of the disturbance waveforms.
We looked for signatures of conjugated anomalies caused as the mirror image of disturbances in the northern hemisphere connected through the geomagnetic field. We, however, could not identify such TEC anomalies in Indonesia. This supports the model that the nighttime passage of LW does not cause conjugate anomalies.

Author Contributions

Conceptualisation, K.H., I.N.M., I.M., D.D.W.; methodology and software, K.H.; formal analysis and investigation I.N.M.; supervision and funding acquisition, I.M., D.D.W., K.A.N.; visualisation, I.N.M. All authors have read and agreed to the published version of the manuscript.

Funding

This work is supported by the Institut Teknologi Bandung (ITB) under Post-Doctoral Program of Fakultas Ilmu Teknologi Kebumian (FITB). INM is supported by FITB and Politeknik Sinar Mas Berau Coal. KH is supported by Chinese Academy of Sciences, President’s International Fellowship Initiative (Grant number 2022VEA0014). IM is supported by Indonesia Endowment Fund for Education (LPDP) (Grant number PRJ-102/LPDP/2021).

Data Availability Statement

GNSS data in and around Indonesia are available from Geospatial Information Agency (BIG) (https://srgi.big.go.id) accessed on 29 June 2022, and EOS-LIPI (eos.ntu.edu.sg) accessed on 29 June 2022.

Acknowledgments

The authors thank BIG (https://srgi.big.go.id) and EOS-LIPI (eos.ntu.edu.sg) for operating networks of GNSS receivers in and around Indonesia. The authors also thank the University of Berne (aiub.unibe.ch/CODE) for GIM data. The authors also thank the three anonymous reviewers for constructive reviews.

Conflicts of Interest

The authors declare no conflict of interest.

Appendix A

Figure A1. Time series of VTEC data showing diversity in the waveforms (black curves) of disturbances due to LW propagating from the HTHH volcano following its eruption on Jan. 15, observed using G3 (A), G6 (B) and R2 (C) at stations in Indonesia. They are plotted in sequence (top to bottom) following station position (red squares) from east to west. SIP positions are shown in black and green dots on maps at the times marked by black and green dashed lines on the GNSS-TEC time series. Blue curves are low-degree best-fit polynomials of the VTEC data with the exclusion window (data within this window are not used to estimate the polynomials) between dashed lines.
Atmosphere 13 01615 g0a1
Figure A2. Pairs of GNSS-TEC time series showing similar waveforms (black curves) of ionospheric disturbances caused by LW from the HTHH eruption on Jan. 15, observed at nearby stations in and around Java (G9) (A) and Sumatra (G7) (B). The vertical red dashed lines indicate the epochs shown in Figure 2 and Figure 3.
Atmosphere 13 01615 g0a2
Figure A3. VTEC from GIM above stations in Java (CNGA, purple) and around Sumatra (SING, blue), including the LW passage times indicated as yellow bands over three and a half consecutive days after the HTHH eruption on January 15. Horizontal axis shows time in hours counted from 0 UT of 15 January.
Atmosphere 13 01615 g0a3
Figure A4. GNSS-TEC time series on reference days shown in black (10 January), blue (11 January) and cyan (12 January) curves from stations in and around the Java (G1, A) and Sumatra (G30, B) regions. The vertical red dashed lines indicate the epochs shown in Figure 2 and Figure 3. We did not see any anomalous TEC behaviours on these reference days.
Atmosphere 13 01615 g0a4
Figure A5. Wavelet-transformed STEC time series (period of ~12 min.) expressed as a function of time (horizontal axis) and distance from the volcano (vertical axis) for G1 and G30 (A) for the first LW passage in Table 1. (BD) show results of the wavelet transformation for detecting the second, third, and fourth LW passages, respectively. Lots of short-period disturbances propagating at ~0.3 km/s are seen.
Atmosphere 13 01615 g0a5

References

  1. Carr, J.L.; Horváth, Á.; Wu, D.L.; Friberg, M.D. Stereo Plume Height and Motion Retrievals for the Record-Setting Hunga Tonga-Hunga Ha’apai Eruption of 15 January 2022. Geophys. Res. Lett. 2022, 49, e2022GL098131. [Google Scholar] [CrossRef]
  2. Kubota, T.; Saito, T.; Nishida, K. Global fast-traveling tsunamis driven by atmospheric Lamb waves on the 2022 Tonga eruption. Science 2022, 377, 91–94. [Google Scholar] [CrossRef] [PubMed]
  3. Heki, K. Ionospheric signatures of repeated passages of atmospheric waves by the 2022 Jan. 15 Hunga Tonga-Hunga Ha’apai eruption detected by QZSS-TEC observations in Japan. Earth Planets Space 2022, 74, 112. [Google Scholar] [CrossRef]
  4. Carvajal, M.; Sepúlveda, I.; Gubler, A.; Garreaud, R. Worldwide Signature of the 2022 Tonga Volcanic Tsunami. Geophys. Res. Lett. 2022, 49, e2022GL098153. [Google Scholar] [CrossRef]
  5. Ortiz-Huerta, L.G.; Ortiz, M. On the Hunga-Tonga Complex Tsunami as Observed Along the Pacific Coast of Mexico on January 15, 2022. Pure Appl. Geophys. 2022, 179, 1139–1145. [Google Scholar] [CrossRef]
  6. Imamura, F.; Suppasri, A.; Arikawa, T.; Koshimura, S.; Satake, K.; Tanioka, Y. Preliminary Observations and Impact in Japan of the Tsunami Caused by the Tonga Volcanic Eruption on January 15, 2022. Pure Appl. Geophys. 2022, 179, 1549–1560. [Google Scholar] [CrossRef]
  7. Themens, D.R.; Watson, C.; Žagar, N.; Vasylkevych, S.; Elvidge, S.; McCaffrey, A.; Prikryl, P.; Reid, B.; Wood, A.; Jayachandran, P.T. Global Propagation of Ionospheric Disturbances Associated With the 2022 Tonga Volcanic Eruption. Geophys. Res. Lett. 2022, 49, e2022GL098158. [Google Scholar] [CrossRef]
  8. Zhang, S.-R.; Vierinen, J.; Aa, E.; Goncharenko, L.P.; Erickson, P.J.; Rideout, W.; Coster, A.J.; Spicher, A. 2022 Tonga Volcanic Eruption Induced Global Propagation of Ionospheric Disturbances via Lamb Waves. Front. Astron. Space Sci. 2022, 9, 871275. [Google Scholar] [CrossRef]
  9. Heki, K. Ionospheric seismology and volcanology, from GNSS Monitoring of the Terrestrial Environment: Earthquakes, Volcanoes, and Climate Changes, Part I Monitoring Earthquakes and Volcanoes; Aoki, Y., Kreemer, C., Eds.; Elsevier: Hoboken, NJ, USA, 2022. [Google Scholar]
  10. Heki, K. Explosion energy of the 2004 eruption of the Asama Volcano, central Japan, inferred from ionospheric disturbances. Geophys. Res. Lett. 2006, 33, L14303. [Google Scholar] [CrossRef] [Green Version]
  11. Dautermann, T.; Calais, E.; Mattioli, G. Global Positioning System detection and energy estimation of the ionospheric wave caused by the 13 July 2003 explosion of the Soufrière Hills Volcano, Montserrat. J. Geophys. Res. Earth Surf. 2009, 114, B02202. [Google Scholar] [CrossRef]
  12. Cahyadi, M.N.; Handoko, E.Y.; Rahayu, R.W.; Heki, K. Comparison of volcanic explosions in Japan using impulsive ionospheric disturbances. Earth Planets Space 2021, 73, 228. [Google Scholar] [CrossRef]
  13. Heki, K.; Fujimoto, T. Atmospheric modes excited by the 2021 August eruption of the Fukutoku-Okanoba volcano, Izu–Bonin Arc, observed as harmonic TEC oscillations by QZSS. Earth Planets Space 2022, 74, 27. [Google Scholar] [CrossRef]
  14. Astafyeva, E.; Maletckii, B.; Mikesell, T.D.; Munaibari, E.; Ravanelli, M.; Coisson, P.; Manta, F.; Rolland, L. The 15 January 2022 Hunga Tonga Eruption History as Inferred from Ionospheric Observations. Geophys. Res. Lett. 2022, 49, e2022GL098827. [Google Scholar] [CrossRef]
  15. Chen, C.-H.; Zhang, X.; Sun, Y.-Y.; Wang, F.; Liu, T.-C.; Lin, C.-Y.; Gao, Y.; Lyu, J.; Jin, X.; Zhao, X.; et al. Individual Wave Propagations in Ionosphere and Troposphere Triggered by the Hunga Tonga-Hunga Ha’apai Underwater Volcano Eruption on 15 January 2022. Remote Sens. 2022, 14, 2179. [Google Scholar] [CrossRef]
  16. Amores, A.; Monserrat, S.; Marcos, M.; Argüeso, D.; Villalonga, J.; Jordà, G.; Gomis, D. Numerical Simulation of Atmospheric Lamb Waves Generated by the 2022 Hunga-Tonga Volcanic Eruption. Geophys. Res. Lett. 2022, 49, e2022GL098240. [Google Scholar] [CrossRef]
  17. Lin, J.; Rajesh, P.K.; Lin, C.C.H.; Chou, M.; Liu, J.; Yue, J.; Hsiao, T.; Tsai, H.; Chao, H.; Kung, M. Rapid Conjugate Appearance of the Giant Ionospheric Lamb Wave Signatures in the Northern Hemisphere After Hunga-Tonga Volcano Eruptions. Geophys. Res. Lett. 2022, 49, e2022GL098222. [Google Scholar] [CrossRef]
  18. Shinbori, A.; Otsuka, Y.; Sori, T.; Nishioka, M.; Perwitasari, S.; Tsuda, T.; Nishitani, N. Electromagnetic conjugacy of ionospheric disturbances after the 2022 Hunga Tonga-Hunga Ha’apai volcanic eruption as seen in GNSS-TEC and SuperDARN Hokkaido pair of radars observations. Earth Planets Space 2022, 74, 106. [Google Scholar] [CrossRef]
  19. Rideout, W.; Coster, A. Automated GPS processing for global total electron content data. GPS Solut. 2006, 10, 219–228. [Google Scholar] [CrossRef]
  20. Muafiry, I.N.; Heki, K.; Maeda, J. 3D tomography of midlatitude sporadic-E in Japan from GNSS-TEC data. Earth Planets Space 2018, 70, 45. [Google Scholar] [CrossRef] [Green Version]
  21. Heki, K.; Ping, J. Directivity and apparent velocity of the coseismic ionospheric disturbances observed with a dense GPS array. Earth Planet. Sci. Lett. 2005, 236, 845–855. [Google Scholar] [CrossRef]
Figure 1. Indonesian GNSS networks run by BIG and EOS/BRIN of Sumatran GPS Array in Indonesia and around Sumatra Islands (red circle). The globes indicate contour of distance from HTHH (red star, in upper left area of globe) and from its conjugated point (black star in the upper right globe).
Atmosphere 13 01615 g001
Figure 2. (A) Time series of VTEC from G1 satellite on 15 January 2022, at eight GNSS stations in Java, Bali, and Nusa Tenggara Timur. They show significant disturbance signatures, reflecting passages of LW from the HTHH volcano. Red broken lines correspond to times for which wavefronts of LW are given in the map. (B) A map showing the station positions, and SIPs (coloured circles) and LW wavefronts (red lines) at four epochs shown as vertical lines in the time series.
Atmosphere 13 01615 g002
Figure 3. (A) Time series of VTEC from G30 satellite on 15 January 2022, at eight GNSS stations in Sumatra and nearby islands. They show significant disturbance signatures, reflecting passages of LW from the HTHH volcano. Red broken lines correspond to times for which wavefronts of LW are given in the map. (B) A map showing the station positions, and SIPs (coloured circles) and LW wavefronts (red lines) at three epochs shown with vertical lines in (A).
Atmosphere 13 01615 g003
Figure 4. Wavelet-transformed STEC time series expressed as a function of time (horizontal axis) and distance from the volcano (vertical axis) for G1 and G30 (A) for the first LW passage in Table 1. (BD) show results of the wavelet transformation for detecting the second, third, and fourth LW passages, respectively. All passages are consistent with expected passage times and velocities of LW (0.3 km/s), given as red dashed lines. We used a wavelet period of ~30 min here. See Figure A5 for the same figure drawn using a shorter wavelet period (~12 min).
Atmosphere 13 01615 g004
Figure 5. Wavelet analysis of STEC data time–distance (relative to conjugated point of HTHH) plot of G17 (A,B) and G30 (C,D) to find signatures of the possible passage of conjugated disturbances. In (A,C), distances are calculated from the HTHH volcano, while in (B,D), distances are calculated from the conjugate point (CP) of the volcano. The expected arrival times and velocities from HTHH and its CP are given as red and black dashed lines in (A,C), and (B,D), respectively.
Atmosphere 13 01615 g005
Table 1. Expected passage time ranges of LW (0.3 km/s) from HTHH.
#LW PassagePropagation DirectionDay (January)LW Passage Time over JavaLW Passage Time over Sumatra
1.First short-path LWEast-to-West1511:10–12:10 UT12:15–13:35 UT
2.Second short-path LWEast-to-West1700:10–01:10 UT01:15–02:45 UT
3.First long-path LWWest-to-East1609:20–10:20 UT07:50–09:10 UT
4.Second long-path LWWest-to-East1722:20–23:20 UT21:00–22:10 UT
1.5Conjugated LWNortheast-to Southwest1512:40–13:30 UT13:20–14:00 UT
Publisher’s Note: MDPI stays neutral with regard to jurisdictional claims in published maps and institutional affiliations.

