Article

Effects of the COVID-19 Pandemic on the Air Quality of the Metropolitan Region of São Paulo: Analysis Based on Satellite Data, Monitoring Stations and Records of Annual Average Daily Traffic Volumes on the Main Access Roads to the City

by
Pedro José Pérez-Martínez
1,*,
Tiago Magalhães
1,
Isabela Maciel
1,
Regina M. de Miranda
2 and
Prashant Kumar
3
1
School of Civil Engineering, Architecture and Urban Design, University of Campinas, Rua Saturnino de Brito, 224, Campinas 13083-889, Brazil
2
School of Arts, Sciences and Humanities, University of São Paulo, Rua Arlindo Béttio, 1000, Ermelino Matarazzo, São Paulo 03828-000, Brazil
3
Global Centre for Clean Air Research (GCARE), Department of Civil and Environmental Engineering, University of Surrey, Guildford, Surrey GU2 7XH, UK
*
Author to whom correspondence should be addressed.
Atmosphere 2022, 13(1), 52; https://doi.org/10.3390/atmos13010052
Submission received: 24 November 2021 / Revised: 23 December 2021 / Accepted: 25 December 2021 / Published: 29 December 2021
(This article belongs to the Special Issue Coronavirus Pandemic Shutdown Effects on Urban Air Quality)

Abstract

:
This paper presents an analysis of the effects of the COVID-19 pandemic on the air quality of the Metropolitan Region of São Paulo (MRSP). The effects of social distancing are still recent in the society; however, it was possible to observe patterns of environmental changes in places that had adhered transportation measures to combat the spread of the coronavirus. Thus, from the analysis of the traffic volumes made on some of the main access highways to the MRSP, as well as the monitoring of the levels of fine particulate matter (PM2.5), carbon monoxide (CO) and nitrogen dioxide (NO2), directly linked to atmospheric emissions from motor vehicles–which make up about 95% of air polluting agents in the region in different locations–we showed relationships between the improvement in air quality and the decrease in vehicles that access the MRSP. To improve the data analysis, therefore, the isolation index parameter was evaluated to provide daily information on the percentage of citizens in each municipality of the state that was effectively practicing social distancing. The intersection of these groups of data determined that the COVID-19 pandemic reduced the volume of vehicles on the highways by up to 50% of what it was in 2019, with the subsequent recovery of the traffic volume, even surpassing the values from the baseline year. Thus, the isolation index showed a decline of up to 20% between its implementation in March 2020 and December 2020. These data and the way they varied during 2020 allowed to observe an improvement of up to 50% in analyzed periods of the pollutants PM2.5, CO and NO2 in the MRSP. The main contribution of this study, alongside the synergistic use of data from different sources, was to perform traffic flow analysis separately for light and heavy duty vehicles (LDVs and HDVs). The relationships between traffic volume patterns and COVID-19 pollution were analyzed based on time series.

1. Introduction

The COVID-19 pandemic has so far impacted the entire world with more than 160 million confirmed cases and 3.5 million deaths according to data from the World Health Organization (WHO) until 30 May 2021 [1,2,3]. In Brazil, according to the Ministry of Health, about 16.5 million cases and more than 460,000 deaths from COVID-19 have been confirmed in the country also until 30 May 2021 [4,5,6]. The unprecedented impact of this global pandemic took place in different spheres of every day’s society. The social distancing measures were taken in order to quarantine the population and thus reduce the levels of transmission of the virus worldwide [7,8]. More specifically in the state of São Paulo, on 22 March 2020, the local Government, through the Decree No. 64,881 [9], established a statewide quarantine, which restricted activities to prevent the spread of the coronavirus [1,10].
From the beginning of the quarantine in the State of São Paulo, there was a decrease in the movement of people and vehicles on the streets, caused by the closing of several public establishments such as parks, shopping malls, bars, restaurants and by the implementation of remote work in several companies [11]. Improvements on air quality were observed in several urban centers around the world caused by the closing of non-essential activities [12,13,14]. This situation offered an unprecedent opportunity to analyze the relationship between the social isolation, measures applied to contain the transmission of the new Coronavirus, and the air quality of the Metropolitan Region of São Paulo (MRSP).
In Brazil, air quality index is determined by Conama Resolution No. 491 of 19 November 2018 [15,16], based on WHO air quality index. These standards were updated on September 2021 [1,2,3]. Thus, parameters of air pollutants could be observed for a deep analysis that establishes the relationship between social isolation during quarantine and the differences in air quality in the MRSP [17].
It is possible to determine that the air pollutants most related to the circulation of motor vehicles are fine inhalable particulate matter (which passes through a size selected inlet with a efficiency cut-off at 2.5 µm aerodynamic diameter; PM2.5), coming from burning fuel in motor vehicles and also from industrial activities, carbon monoxide (CO), mostly formed by incomplete combustion of fuel in motor light vehicles such as passenger cars and motorcycles and nitrogen dioxide (NO2), mostly related to the combustion of heavy commercial vehicles and burning of diesel fuels [18]. In a scenario of decreasing volumes of passenger cars, commercial vehicles and motorcycles, declining concentration rates of PM2.5, CO and NO2 are expected, establishing evident relationship between air quality and social isolation index in the MRSP [12].
PM2.5 particles are harmful to health because of their smaller diameter and may reach the bronchi when inhaled; CO is a colorless, odorless and tasteless gas; NO2 is characterized by a reddish brown gas which secondary products are nitric acid and nitrates, which may contribute to the increase of inhalable particles that are harmful to health. NO2 is mainly formed by combustion processes that use oil or gas and can contribute to the formation of acid rain at the locations according to data from the vehicle pollution control plan [18,19]. The presence of these pollutants is regulated and monitored by the São Paulo Environmental Company (CETESB). After the State Decree No. 59,113 of 23 April 2013 [20], new air quality standards were established taking into account the concentration of these gases in the atmosphere [15]: 20 µg/m3 (annual mean), 9 ppm (8 h mean) and 60 µg/m3 (annual mean), for PM2.5, CO and NO2, respectively. The current acceptable air quality standards, with the exception of CO, which is already in the final stage, are becoming more stringent as new phases will be planned within next year’s [21]. It is important to emphasize that the evolution of technology has made it possible to considerably improve CO parameters to the point of achieving a significant reduction in the atmosphere of large conurbations [12,22,23]. The São Paulo State Decree is more restrictive than the Conama Resolution for SO2.
Based on data from the vehicle emission report [18], the fleet circulating in São Paulo State in 2019 was composed of ~15.4 million vehicles: 10.4 million cars (68% of the total fleet), 1.9 million light commercial vehicles (12%), 440 thousand trucks (2%), 107 thousand buses (0.7%) and 2.5 million motorcycles (16%). Similarly, the fleet circulating in the Metropolitan Region of São Paulo in 2019 was composed of ~7.3 million vehicles: 5.3 million cars (73% of the total fleet), 900 thousand light commercial vehicles (12%), 170 thousand trucks (2%), 55 thousand buses (0.7%) and 900 thousand motorcycles (12%). It is possible to observe that there is a proportion between the volume of each type of vehicle, considering that they do not have large percentage variations between the MRSP and the State. From the distribution of vehicle types according to the vehicle control plan [18], it is observed that cars and motorcycles are predominantly responsible for CO emissions, while heavy vehicles such as trucks and urban buses stand out more for emissions of PM2.5 and NO2. Most cars and motorcycles are powered by gasoline and ethanol, in a mixture of 15% ethanol, which have CO and less particulate emissions as a by-product of their incomplete burning, while heavy vehicles that are mostly diesel powered release NO2 and more PM2.5 into the atmosphere as a result of combustion [24]. The low volume of new vehicle sales in recent years revealed that the fleet circulating in the state has remained almost unchanged from 2015 to 2019 (the only type of vehicle that had a decrease in the volume of the circulating fleet was light commercial vehicles with a reduction of 0.9% in 2019).
It is noted that cars were responsible for 60% of CO emissions in 2019, while motorcycles account for 22%, light commercial vehicles for 10%, trucks for 6% and buses for only 2% in the state of São Paulo. Trucks represent 65% of NO2 emissions, cars 12%, urban buses 10%, light commercial vehicles 6% and motorcycles and minibuses 1% each [18]. PM2.5 had a distribution similar to that observed in relation to NO2: trucks represent 70%, urban buses 10%, road buses 6%, light commercial vehicles 7%, motorcycles 4% and automobiles 2% of the total emissions in the State of São Paulo. These data reveal a distribution of inhalable particles and nitrogen oxides more linked to heavy duty vehicles (HDVs), while the emission of carbon monoxide is more dependent on the circulation of light duty vehicles (LDVs). This finding makes it possible, in the analysis of the highways, to relate the volumes of HDVs to the levels of NO2 and PM2.5 and the volumes of LDVs to the level of CO [25].
The recent change in the way of life of the population São Paulo to adapt to the impositions caused by the emergence of COVID-19 had different effects that need to be better understood. The improving air quality, observed worldwide, related to the implementation of social isolation measures, can help society to understand ways to deal with everyday life and reduce air pollution in large urban centers, even in periods when there is no need for social isolation [26,27]. This work aims to analyze the atmospheric concentrations of PM2.5, CO and NO2 in the MRSP, evaluating the monthly levels of these pollutants measured by CETESB’s air quality stations between the years 2019 and 2020; this work investigates the NO2 columns in the atmosphere, observed by satellite images at the end of each quarter of the two years, and the annual average daily traffic volume of vehicles (AADT) on the main access roads to the MRSP. Finally, the study also compares these data relating to the region’s isolation index measured since the beginning of March 2020, seeking to understand the influence of the quarantine decreed to contain COVID-19 transmission on the level of these atmospheric pollutants. We call attention to two aspects that need particular attention: the evolution of air quality improvement during the seasons, since pollution is greater during winter months and atmospheric conditions could affect air quality more than isolation measures, and the differential behavior of vehicle types, HDVs are less affected than LDVs by isolation measures.

2. Materials and Methods

2.1. Study Location (MRSP) and Main Access Highways

The case study elaborated in this paper consider the MRSP as the key urban observatory, as well as the main access roads to this region: namely Ayrton Senna (SP-70), Raposo Tavares (SP-270), Castello Branco (SP-280), Anhanguera (SP-330) and Bandeirantes highways (SP-348) (Figure 1 and Table 1), the main highways connecting São Paulo to other Brazilian States. The study of the air quality in the MRSP was carried out by observing the levels of PM2.5, CO and NO2 based on data from the CETESB stations spread over different municipalities (Figure 1 and Table 2). For the NO2 parameter, concentration values obtained by satellite images in the area were also be analyzed [28,29].
For the analysis of the Annual Average Daily volume of Traffic (AADT) in the chosen access roads, it was necessary to select radar spots. We obtained AADT between the two radars closest to the main accesses in the MRSP. Figure 1 and Table 1 show the locations of each of the selected radars, according to data provided by the São Paulo Department of Highways (DER/SP) [30].
The Ayrton Senna highway (SP-070) has an extension of 48.3 km. For the analysis of the AADT in the access section of SP-070, radars positioned at 51 km and 66 km were used. With a length of 654 km, the Raposo Tavares highway (SP-270) connects the interior to the capital. For the analysis of the AADT, traffic data on radars positioned at 38 km and 84 km of the highway were observed, on the way to the municipality of Cotia. Castello Branco highway (SP-280) is 315 km long and connects the capital to the western region of the state, close to the radars located at 35 km and 52 km. Finally, the Bandeirantes (SP-348) and the Anhanguera (SP-330) highways go to the northern part of the state. Therefore, radars at 44 km and 61 km of the highway were chosen for the evaluation of AADT (Figure 1).

2.2. Isolation Index

The State Government of São Paulo, since the beginning of the adopted measures of social distancing, started to disclose the isolation index, prepared from the Information and Intelligent Monitoring System (SIMI-SP), with performance of the Institute of Technological Research (IPT) [31]. The isolation index is a semi-empirical dimensionless measurement of the mobility activities of multiple populations, ranging from 0%, active moving people, to 100%, total confinement. According to state decree no. 64,963 of 5 May 2020, SIMI-SP was defined as the official mechanism for combating the COVID-19 pandemic in the state of São Paulo [32]. In this way, the State Government was able to consult mainframe information aggregated by a centralized system with data on citizens’ mobility [33]. The isolation index is one of the resources included in SIMI-SP, being made available mainly by telecommunication companies, with their data managed by the Brazilian Association of Telecommunication Resources (ABR Telecom). Telecommunication service providers base the isolation index on the location of cell phone antennas considering 200 m radius tolerance.
The isolation index has been calculated and made available daily to the population since 27 March 2020, with information from municipalities in the state with more than 50 thousand inhabitants. The isolation index data are essential to establish comparisons between the percentage of the population practicing isolation, the decrease in the average daily volume of traffic and the consequent improvement in air quality throughout the region.

2.3. Air Quality Monitoring and Sentinel Satellite Data

For this study, the air quality in the MRSP will be monitored using the concentration levels of PM2.5, CO and NO2 and their daily peak data from CETESB air quality monitoring stations [21]. The choice of these three pollutants was made considering the objective of relating the air quality of the MRSP to the quarantine (set up to fight the COVID-19 pandemic). As these pollutants come mostly from the burning of motor vehicle fuels, it will be possible to observe the relationship between the lower volume of vehicles on the highways and the improvement of air quality in the MRSP [18,34].
CETESB has standard air quality monitoring stations spread across several municipalities in the MRSP. Among these stations, five locations were analyzed. All the stations chosen measured PM2.5, CO and NO2 concentrations: one in the capital and the other four in different municipalities of the MRSP (Figure 1 and Table 1). It was noted that the stations were close to the main access roads (Table 2). The data collected for the construction of monthly averages were the daily concentration values available by the air quality system (QUALAR) of CETESB [21]. These values were determined differently for each of the analyzed parameters. In the case of the CO parameter, daily values represented the maximum average of an eight-hour period of a day, while for the NO2 parameter, the daily values were obtained from the maximum average of one hour of the day and for PM2.5 the values obtained were the average of the day. From the coordinates provided by CETESB in Table 1, it was possible to screen the traffic radar stations within the MRSP, as shown in Figure 1.
According to the European Space Agency (ESA), the Sentinel 5P satellite is a satellite currently in orbit dedicated exclusively to monitor the Earth’s atmosphere. Using a Tropomi spectrometer, the Sentinel 5P is able to map various gases present in the atmosphere, including NO2. Every day, the Tropomi spectrometer maps the global atmosphere with a resolution that can reach up to 7 × 3 km, according to ESA, making possible to detect pollution in urban centers [35,36,37]. In this way, it was possible to use the Sentinel 5P mapping data to observe NO2 columns in the MRSP and established comparisons between 2019 and 2020. We studied equivalent days in the two years to determine the influence of the COVID-19 pandemic on air quality.
For this study, NO2 levels were observed every 3 months, on the 4th Wednesday of March, June and September 2019 and 2020, as well as on the 3rd Wednesday of December 2019 and 2020 (not to use dates that might coincide with the Christmas holidays which may reduce the flow of vehicles on the streets). This analysis was done quarterly in order to complement the analysis of the CETESB’s stations, which were carried out monthly. Therefore, it was possible to compare equivalent days between 2019 and 2020 with the isolation indices during the analyzed period.

2.4. COVID-19 Scenarios

We looked at the mobility patterns across the studied region during the months since the beginning of the epidemic’s initial wave in March 2020. Consequently, we estimated monthly deviations in vehicle trips and flows on the main access highways of Figure 1. Deviations from month i (January 2020 to December 2020) were estimated using 2019 baseline records:
    d i = ( m o n t h i m o n t h i , 2019 ) m o n t h i , 2019 ,
The total number of vehicles per month were obtained from transport operators and managed by the DER/SP [30,38]. Light and heavy-duty vehicle flows (LDVs and HDVs) and monthly averages of daily traffic in both egress/access directions from/to São Paulo matched the vehicle counts for the main highways in the region (as the Bandeirantes SP-348). In 2019, the Bandeirantes highway registered an AADT of ~110 × 103 vehicles per day, 18% of which were HDVs [30]. The congested kilometers, expressed as total length of busy roads, represented monthly averages of daily congestion rates [39,40]. In the MRSP, ~90 km of congested roads were estimated every day in 2019. It was expected that the reduction of congestion during COVID-19 months due to confinement measures may affect the air quality significantly [41,42,43,44].
We estimated the monthly average NO2 concentrations to evaluate the direct impact of transport activities. These values, expressed in μg/m3, corresponded to CETESB’s air quality network which covers the whole MRSP [15]. In this case, the monthly concentrations were compared with the mean values of the preceding year. During this period, the average NO2 in the region was 36.4 μg/m3. Finally, the former deviations were compared with the isolation index registered in São Paulo since March 2020.
In the Municipality of São Paulo, more than 27 × 103 people have died from COVID-19 (sum of confirmed and suspected deaths) since the beginning of the epidemic’s initial rate of 64 deaths per day [1,10]. We related the COVID-19 data with the transit occupation and isolation rates during these months [32]. Occupation rates, expressed as passengers per operated bus, represent how transit operators are adapted to COVID-19 scenarios [45]. An average of ~34 passengers travelled in every bus under normal conditions [1,10,46]. It was expected a decrease of the occupation rates during the pandemic.
Isolation rates, expressed as the percentage of people with restricted mobility, represented georeferenced data from telecommunication records (respecting the privacy of users, the information is aggregated and anonymized). Georeferenced data were grouped to develop public policies that improve measures of social isolation to confront the coronavirus. 18 to 29% of population had restricted mobility under normal conditions [32,38].

3. Results and Discussion

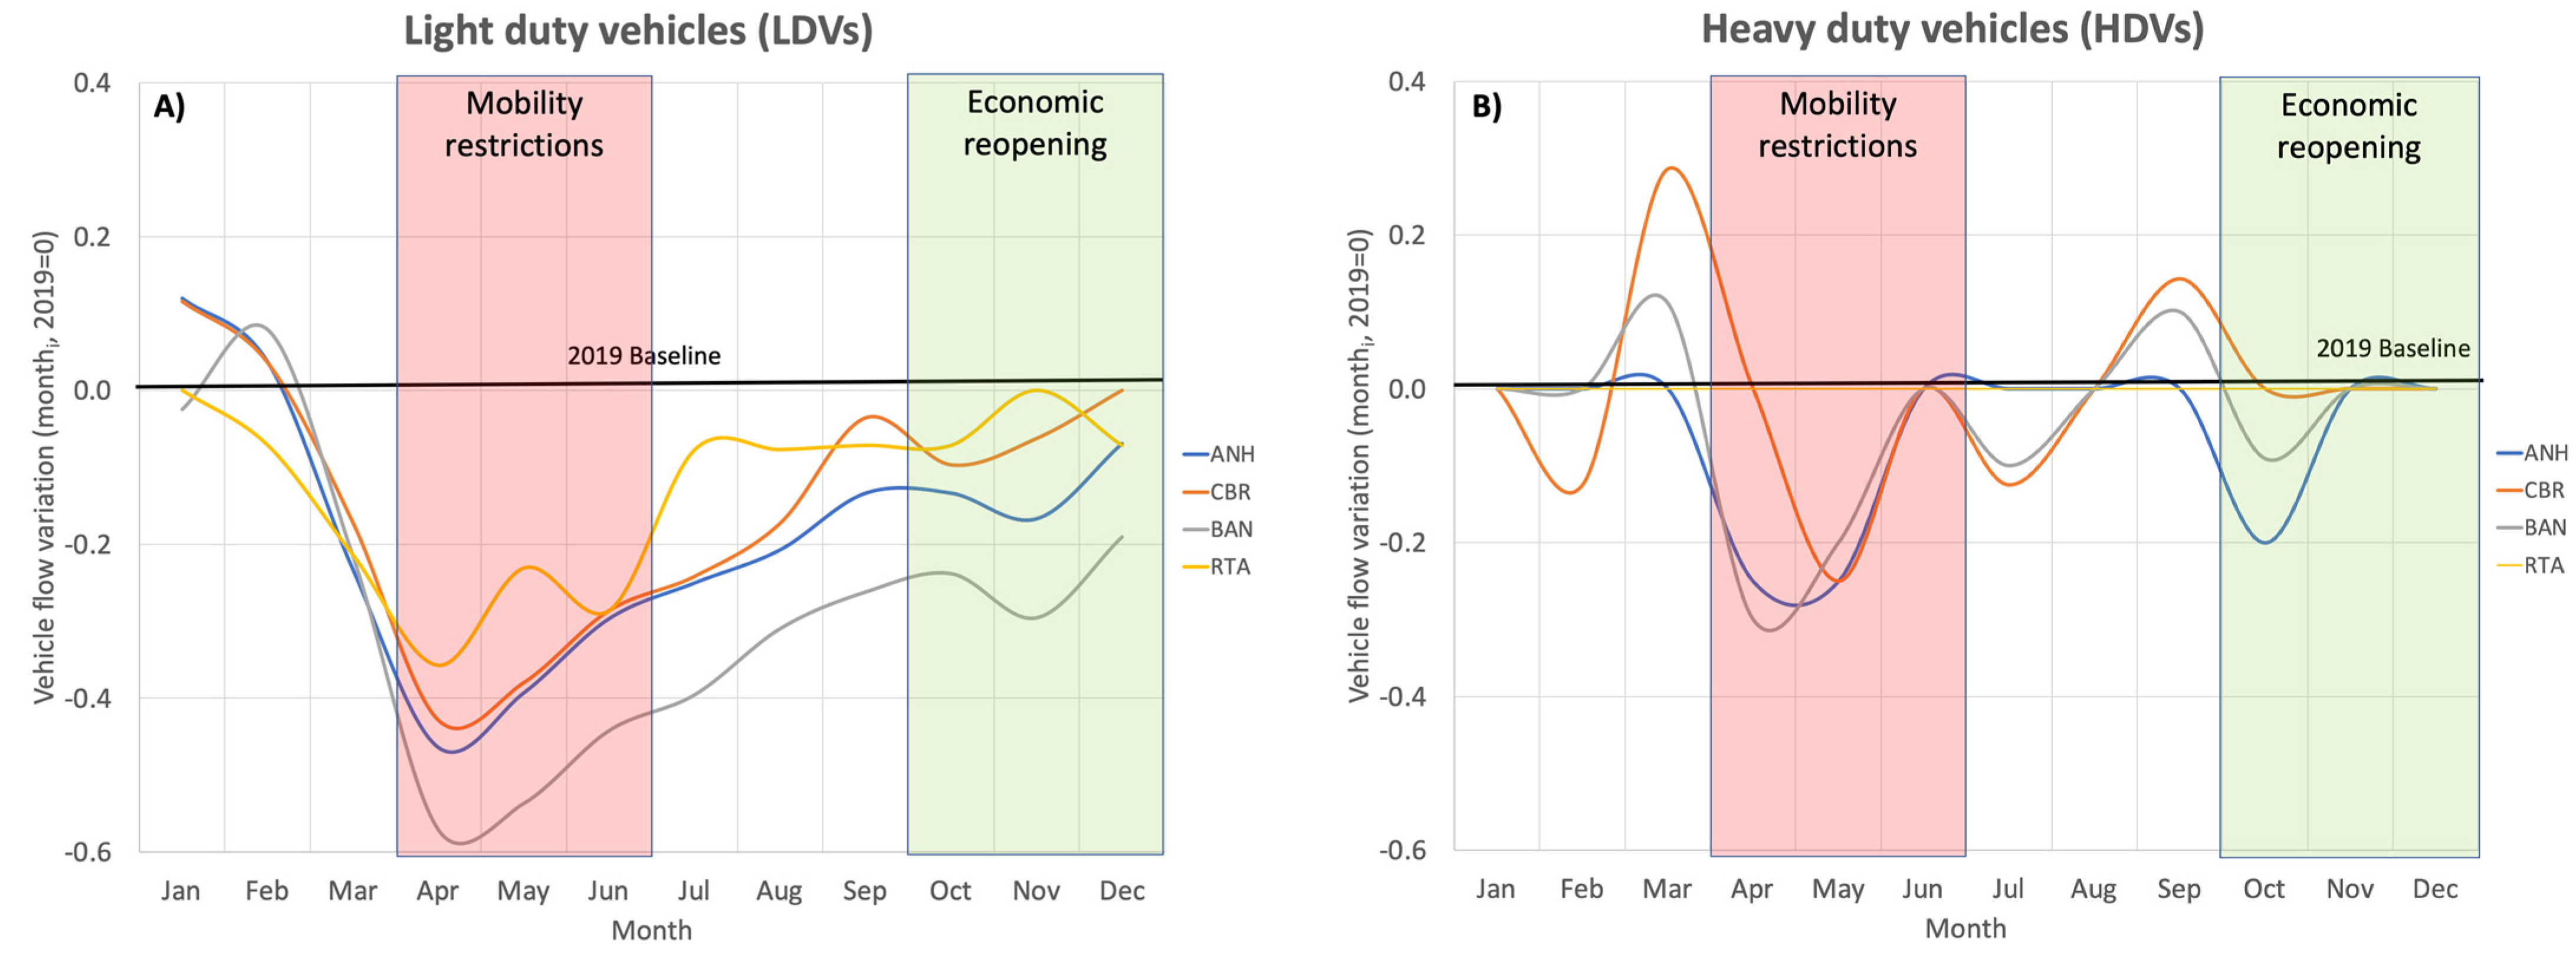
3.1. Traffic Volumes at Main Access Highways

Time series of AADT were analyzed, using data of the two radars closest to the MRSP for each of the access highways chosen in this study (Figure 1). It was possible to study separately how the pandemic affected the use of each type of vehicle: passenger, motorcycles and commercial vehicles [47]. Figure 2, Figure 3 and Figure 4 show the AADT variation of passenger cars, motorcycles and heavy vehicles during the years 2019 and 2020. It was possible to observe a large decrease in the passenger private vehicles between the years 2019 and 2020, especially after the month of March 2020, when quarantine was decreed in the State of São Paulo on 22 March.
The Raposo Tavares (SP-270) and Castelo Branco (SP-280) highways showed both a decline of about 5 thousand cars per day at the end of March. The traffic slowly raised again over the following months in order to follow the activities of the population through the second half of September due to the economic reopening (Figure 5). Observing the AADT of motorcycles and commercial vehicles on the selected highways, it was not possible to detect a large variation between the years 2019 and 2020. The fact that the Anhanguera (SP-330) and Bandeirantes (SP-348) highways showed similar patterns, strengthened the idea that the economic activities carried out by commercial vehicles and motorcycles were not significantly impacted by the pandemic. While there was a decrease of 20 to 30 thousand cars/day between April and June at the researched highways (Figure 2), commercial vehicles slightly lost volumes and there were even traffic increases after September 2020 (Figure 4). Also motorcycles did not show a large variation (Figure 3). Although there was a recovery in the volume during the second half of the year, and despite the increase was continuously observed after this period, passenger private vehicles on these highways were finally ~5 thousand vehicles/day below the average volume measured in the same period of 2019.
The volumes varied according to the days of the week. Peaks in the traffic flows occurred during working days. Understanding the behavior of residents in the MRSP, it was possible to relate traffic data with air quality and the isolation index [48]. In the case of the Ayrton Senna highway (SP-70), we observed a great inconsistency of the observed data: there were periods with the measurement radars turned off especially in 2020. Even though, we decided to keep the time series in Figure 2 to confirm the above trends. Seeking to condense the data from the former AADT and eliminating the Ayrton Senna highway due to the inconsistencies presented above, it was possible to create graphs that summarized the overall trend of the access highways according to the monthly averages, for light duty (LDVs, sum of passenger vehicles and motorcycles) and heavy commercial duty vehicles (HDVs) separately, and by comparing with 2019 baseline data (Figure 5). For instance, related to 2019, the Bandeirantes highway (SP-348) decreased the traffic of LDVs by more than 40% during the three months with mobility restrictions. In the first months of the year, before the decree of social isolation measures, the SP-348 presented ~40 thousand LDVs/day per direction, similar to the records in 2019 months. At the end of April 2020 there was a decrease of 60% (~24 thousand vehicles/day). In the case of HDVs, there was a decrease of ~30% at the end of April, half of the rate of LDVs and similar to the ratios presented at the other highways.
Among the months of July, August and September 2020, third year quarter, an increase in the AADT for LDVs in the Bandeirantes highway in relation to the previous quarter was already evident. In July 2020, the AADT for LDVs was 26,000 vehicles/day, while the following month AADT rose to 27,000 and then to 31,000 vehicles/day. Thus, there was an increase of ~20% in the AADT of LDVs from July to September 2020; however, even with this increase, the AADT was still 26% lower at the end of the third quarter of 2020 compared to the same period of 2019; despite the recovery of the volume of LDVs, the impact of COVID-19 on private mobility was still present. Conversely, HDVs during the third quarter of 2020 exceeded the AADT at the end of the period compared to 2019, ~1000 vehicles/day (10% increase), revealing that commercial activities were not as impacted as the movement of people in private vehicles as happened in other emerging economies [49].
Finally, the last quarter of 2020 confirmed the recovery of AADT in LDVs, which fluctuated from 32,000 in October to 41,000 vehicles/day in December, representing a growth of almost 30% during these 3 months, returning to the levels of vehicles presented on the highway in 2019. HDVs had shown a stabilization since the third quarter of 2020 and varied only between 11,000 and 9000 vehicles/day in this period, with volumes similar to those observed in 2019. At the end of 2020, there was a noticeable reopening of activities and movement of people close to what was experienced before the quarantine period. With the analysis of the data observed in the trends of Figure 5, it was possible to summarize that all highways followed similar patterns, even with different levels of AADT. Due to this fact, it was possible to extrapolate from the analysis of the Bandeirantes highway, the performance of the other three corridors (we had chosen the Bandeirantes highway as presents higher AADT than the other highways).
The selection of level of single one year (2019) in equation 1, as reference of the pre-epidemic traffic flows, was chosen because the variations were similar when comparing to other periods. For instance, in the Bandeirantes highway the variation of LDVs was −25% in 2019 and −23% in 2017–2019 period (−2.4 and −1.8% for HDVs, respectively).

3.2. Atmospheric Pollutants (PM2.5, CO, NO2)

PM2.5, CO and NO2 concentrations were measured in the CETESB monitoring stations next to the main highways. Figure 6 shows daily data time series of average concentrations comparing the evolution between the years 2019 and 2020. Even though located in different points of the MRSP, pollutant concentrations presented similar distributions due to the relation between the seasons of the year and the local air quality. In the winter months (June to August) meteorological conditions do not favor the dispersion of pollutants, precipitation indices are lower, less cold fronts, thermal inversions and a more stable atmosphere [50]. In São Paulo, more than 80% of pollutants come from vehicles [18]. To analyze the year 2020, other factors as Coronavirus pandemic shutdown effects came into consideration. Public health measures to combat the spread of COVID-19 (initiated in the State of São Paulo in March 2020) demonstrated that, compared to the previous year, there was a general decrease of pollutant concentrations between April and June 2020; therefore, all stations showed peaks of increasing concentrations from September onwards, coinciding with the economic re-opening (Figure 5). These increasing concentrations were coupled with observed traffic flows (in terms of analyzed AADT), which had a resumption in the number of vehicles at the same time. Similar patterns were found in other countries [8,51].
The station located inside the city, by the Marginal Tietê highway, presented the highest concentration values of PM2.5 in 2020, similar to 2019. Even though −10 to −20 µg/m3 declines were observed in the station during the months of April and May, corresponding to the period with mobility restrictions, new peaks of ~30 µg/m3 by the end of 2020 appeared (even surpassing the levels of 2019). In the other monitoring stations, located in more peripheral regions of the MRSP, there were also variations between −10 to 30 µg/m3 compared to 2019. Firstly, there was a decrease of concentrations in the first half of 2020 until the end of winter and secondly, there was an increase during September and October months. These increasing concentrations were coupled with increasing volumes of mainly commercial vehicles, which represent more than 77% of the emission of this pollutant according to the São Paulo Vehicle Emission Report [18]. According to this analyses, it was possible to infer that the vehicle flows in the MRSP may had a significant impact on PM2.5 year variations [33]. Overall, the concentration values in the region did not experience visible changes during the entire year.
CO concentrations in parts per million (ppm) slightly differed compared to what was observed in the analysis of PM2.5. CO concentrations showed greater differences between the values measured in 2019 and 2020. For most of 2020, the concentrations of CO remained lower than in 2019, but during the months of September and October there was an increase in all stations, reaching up to 5 ppm in the case of the São Caetano do Sul station, for instance. These increasing concentrations were coupled with increasing volumes of mainly light duty vehicles and motorcycles, which represent more than 80% of the emission of this pollutant [24]. Together with increasing AADT of LDVs, the daily concentrations of CO also coupled the decreasing isolation index. It was noteworthy that with the loosening of social isolation measures that took place mainly in the second half of 2020, several values came close to those observed in 2019 (Figure 6) and in some cases even surpassed them, confirming the relationship between the measures to combat the COVID-19 pandemic and changes in air quality in the MRSP as faced in other regions [52,53].
For the NO2 parameter, daily concentrations were analyzed based both on data from CETESB monitoring stations and satellite images (as it is shown in the next section). Consequently, we could analyze and compare the NO2 column on equivalent days in 2019 and 2020 using data from the European satellite Sentinel 5P for the months of March, June, September and December, representing the quarters of the two investigated years (Figure 7). The average daily NO2 concentrations in 2020 exceeds those in 2019 only in the months of September, October and November, indicating the increase in the volume of mainly commercial HDVs which, according to CETESB study, are responsible for more than 60% of the emissions of this pollutant. According to the AADT charts analyzed in Figure 4, there was an increase in these type of vehicles on the main access highways during the last months of the year by ~10% (more than in 2019). Thus, NO2 concentrations in the last months of 2020 exceeded the concentrations of the same period of 2019 by up to 50 µg/m3, strengthening the result that the commercial activity of vehicles was the first managing to recover and return to the economical levels it had in years prior to the COVID-19 pandemic, compared to passenger cars and motorcycles which delayed returning to circulate on the streets and roads (Figure 2 and Figure 3).

3.3. Satellite Images and Isolation Index

In addition to the previous analysis of daily NO2 concentrations, we also used Sentinel 5P satellite data. By means of the concentration of the NO2 column in the atmosphere (expressed in µmol/m2) and by comparing equivalent days in each quarter of years 2019 and 2020, Figure 7 clearly shows the effects of quarantine on air quality in the MRSP. The choice of dates in 2020 and 2019, that should be compared with each other in order to understand the effects of the COVID-19 pandemic on air quality, was made with the support of the isolation index (Figure 8). In order to look for dates that were equivalent in the two analyzed years, it was necessary to assume a day of the week, Wednesdays, and later on identify which day of each month would be adopted. Based on this premise and considering that the months analyzed were March, June, September and December (the final months of each quarter of the year), we finally had chosen the following dates: first date on 25 March 2020 (3 days after the quarantine was decreed by the government of the State of São Paulo, 27 March 2019), second date on 24 June 2020 (26 June 2019), third date on 23 September 2020 (25 September 2019) and fourth date on 16 December 2020 (18 December 2019). In December, in order not to select a date that would be in the Christmas holiday week, the 3rd Wednesday of the month was chosen.
Figure 8 presents the isolation indexes corresponding to the chosen dates of Figure 7, among the full time series related to the year 2020, starting from a permanent immobility of 29% at the beginning of the year and reaching 55–45% during the period with mobility restrictions and lockdown measures (~50% increment from the baseline year). Afterwards, the isolation index decreased from 41% (23 September 2020) to 38% (16 December 2020) during the period of the economic reopening (~25% increment from the baseline year).
The isolation index data for the State of São Paulo, before the quarantine period, was used to infer the percentage of the permanently isolated population. The origin and destination (OD) mobility survey of the MRSP (1977–2017), held by the São Paulo Metrô and carried out every 10 years since 1977, characterizes the immobility of the population from the analysis of people who do not move (mostly children, elderly and people with disabilities). Therefore, ~29% citizens according to the 2017 OD survey were in permanent isolation even without measures to restrict the movement of people. During the pandemic after March 2020, the isolation index was calculated for all municipalities in the state with a population greater than 50,000 inhabitants and made available by the state government [32].
Thus, from the daily data available by municipality, it was possible to develop the isolation index for the entire MRSP. Figure 8 shows the variation in percentage of people who continue to respect isolation in the MRSP on a daily basis. It was possible to infer some conclusions about the behavior of the population in the MRSP during quarantine. The biggest peak was noted at the time of the quarantine decree, just after 22 March 2020. Afterwards, there was a slow decline, so that by the end of 2020 the isolation rate remained ~40%, 38% above than it was before the quarantine decree (~29%). In addition, there was also a periodical cycle throughout the year, corresponding to weekends and working weekdays. There were constant declines that reduce isolations during weekdays by ~10% in relation to weekends (the population of the MRSP stayed more at home on weekends but had commitments during weekdays that do not allow full isolation). The same pattern was observed by the AADT data of the analyzed highways (Figure 2), in which passenger vehicles and motorcycles behaved in the same way while commercial vehicles did the opposite.
The isolation index presented a gradual reduction in the percentage of people in isolation in the region. This was also observed in the AADT of passenger vehicles in Figure 2, with a similar trend in the period analyzed. In addition, the isolation index, despite following a constant fall, never reached the value of permanent immobility of the population; even in periods when there was an increase in vehicle circulation and a decrease in the isolation index, the percentage of people who remain isolated was still ~40%, higher than the percentage of permanent immobility of the population [38].
Studying the satellite images of the tropospheric NO2 column, it was expected that there would be a gradual deterioration of air quality levels by the end of the year 2020. After just three days of the quarantine decree in the State of São Paulo, NO2 column dropped related to the decrease of internal vehicle flows at the MRSP (drastic reduction of the red areas throughout the region and concentrated to areas within the capital of São Paulo). During the month of June, however, it was not possible to observe such a significant variation between years as observed in March. According to CETESB, there is a natural deterioration in air quality during the winter months [15], a fact that could easily explain the small variation between the images and years above (column concentrations were similar reaching 120 µmol/m2). In addition, the isolation index of June 2020 was ~10% lower compared to end March 2020 (it can be observed a constant fall along the year) and ~15% higher compared to the same month in the previous year.
By the end of September, there was a clear decrease in the levels of NO2, with an isolation index in the atmosphere ~10% higher compared to September of the previous year (15% lower compared to March 2020). As the NO2 concentration is mostly affected by the volume of HDVs, it was expected that this reduction was coupled with a decrease of the commercial economic activity in the region before the start of the economic reopening (Figure 5). Finally, the difference in the concentration of the NO2 column between the months of December was lower than what was observed in March and September, coinciding with the lowest isolation index after the epidemic burst (38% and ~10% above pre-pandemic isolation rates respectively). The beginning of the summer season and Christmas holidays could contribute to the reduction of pollutants as well as low recovering of LDV flows and adherence of MRSP citizens to isolation measures (Figure 5). Therefore, even with the gradual reduction in the isolation index in that period, the reduction of the NO2 column in the region was still remarkable. Furthermore, the end of the winter period and the beginning of the wet season could be another factor that could also impact the improvement of the air in 2020 compared to 2019. However, as there are other factors that interfere in the column of NO2 in the atmosphere, additional meteorological factors could had interfered in the result observed by the satellite images of Figure 7.

3.4. Coronavirus Pandemic Shutdown Effects on Urban Air Quality

In order to compare the air quality and vehicle flow data together, quarterly year averages of each combination of the analyzed parameters (in percentage terms) and for the air quality and traffic stations of Figure 1 were calculated. It was possible to quantify the averages of change that had occurred in air quality (Table 3) and traffic flows (Table 4) between the last two years and therefore numerically estimate the effects of the COVID-19 pandemic on these sites. In order to include these data in a more robust analysis, in addition to the data that had been evaluated, variation rates were also estimated for the volume of traffic on the highways based on the quarterly averages obtained from the AADT data discussed above. A pattern emerged when observing simultaneously the variation in the parameters of pollutants and traffic volumes at all stations and highways together. As observed in the pollutant concentrations of Figure 6 and in the monthly traffic flow graphs of LDVs of Figure 2, the first quarter of 2020 showed a decline in the concentration of all observed pollutants coupling the decreasing mobility.
Table 5 shows the rates of variation of these parameters between 2019 and 2020 in each quarter of the year for LDVs and HDVs. For the first quarter of the year 2020, which includes a period mostly prior to the establishment of social isolation measures to contain the evolution of COVID-19, a decrease in the mean concentration of all analyzed atmospheric pollutants and in the volume of LDVs on the highways had already been noted: 16% (PM2.5), 21% (CO), 22% (NO2) and 5% (LDVs). While there was a reduction in the volume of LDVs ~2–7% (Table 4), CO, the main parameter linked to the emission of pollutants of this type of vehicles, had a decrease ranging between 14 and 25%; while PM2.5 had a decrease ranging from 4 to 26% and NO2 between 17% and 29% (Table 3).
In the case of HDVs, that are mainly responsible for the contribution of PM2.5 and NO2, despite showing a decrease in traffic volume for the period of 0.5% in the Castello Branco highway, they presented for the other three analyzed highways a percentage volume increase ranging between 1.5% and 4%; despite not being a large increase, this demonstrated that the behavior of HDVs did not follow the same pattern as LDVs (Table 4). Even with these slight increases, the rates of PM2.5 and NO2 did not behave in the same way as observed in the air quality stations: 3–27% and 17–29% decreases in PM2.5 and NO2 concentrations respectively (Table 3). The decrease in the three pollutants was linked to the decrease in the circulation of LDVs, since they represent 85% of the vehicle fleet in the MRSP. Despite producing PM2.5 and NO2 in less quantity in terms of vehicle kilometer travelled, a decrease in the circulation of LDVs characterizes an expressive number of absolute vehicles. Therefore, the percentage of LDVs related to HDVs in the impact of pollutants must be taken into account carefully and total numbers in the inventories and emission surveys must be reviewed [18]. An example of this statement was the analysis of the Bandeirantes highway, with 18% of the total volume of vehicles represented by HDVs. In this highway, the decrease in the circulation of LDVs, of up to 20,000 vehicles/day, was ~50% higher than the decrease in the circulation of HDVs (3000 vehicles/day). The highest percentages of decrease in the volume of LDVs were directly linked to the reductions in the concentration of all studied pollutants.
It was possible to build a comparison analysis of the vehicle flow with the concentration of pollutants during the second quarter (April to June of 2019 and 2020). This period had the largest percentage decline in the AADT of LDVs, ranging between 27% and 52% (Figure 3). In addition, HDVs showed a considerable decrease between 11% and 14%. Furthermore, this period also had high isolation index values, above 50% for the entire period (Figure 8). Regarding the level of pollutants, PM2.5, CO and NO2 showed decreases in the second quarter of 2020 compared to the same period in 2019: 8–20%, 15–29% and 13–16%, respectively (Table 3). These patterns were confirmed by the NO2 columns of satellite images at the end of each quarter (Figure 7). Therefore, it was possible to determine a clear relationship between decreased circulation of vehicles and the improvement of the air quality of the MRSP. To quantify the relationship between the isolation index and pollutants, PM2.5, CO and NO2, Pearson’s correlations were −0.05 (not significant), −0.14 (significant at 0.05 level) and −0.22 (significant at 0.01 level), respectively. These values indicate better results for NO2 as it is the pollutant most related to heavy vehicles.
In the third-year quarter, it was still observed that there was an overall decrease in all highways, both for LDVs and HDVs. However, the percentage of reduction in LDVs varied between 6% and 30% and that of HDVs varied between 0.6% and 8%, showing a recovery compared to the second quarter due to the reopening of economic activities (Figure 5). During this period, there was also a decrease in the isolation index, which was constantly below 40%, revealing that more people were returning to activities and coming out of isolation (Figure 8). Also in this quarter, the variation in air pollutants presented the first values higher in 2020 than those calculated in 2019 (Figure 6), with PM2.5 reaching an increase of 14%, CO of 0.9% and NO2 reaching 3%. The apparent increase in the circulation of vehicles on the highways resulted in an increase in the concentration of pollutants, in addition to a decrease in the isolation index by the third quarter. Thus, even though we observed highways with declines of up to 30% such as Bandeirantes, during the previous quarter the decrease was more than 50%, the recovery of vehicles on the highways was clear and this directly impacted the increase in the concentration of pollutants. On specific days, as was the case of the analysis of the tropospheric NO2 column by satellite (Figure 7), it was possible to identify days with smaller volumes of the pollutant in the region’s atmosphere. Regarding meteorological variables, the indices in the two analyzed years were: average temperature (T) 21.1 °C in 2019 and 20.5 °C in 2020; average relative humidity (RH) of 67% in 2019 and 66% in 2020; average wind speed (WS) of 1.7 m/s in 2019 and 1.8 m/s in 2020; accumulated precipitation (P) of 1752 mm in 2019 and 1731 in 2020; predominant wind direction (PW) from the SE quadrant in both years (data provided by the National Institute of Meteorology-INMET, Campo de Marte Station). Due to the unavailability of satellite images, specific dates were selected for comparison in the period. When analyzing meteorological parameters on these days it can be observed that the values of T, RH, WS, P and PW were very similar, indicating that the limitations imposed by the pandemic were responsible for the lower levels of pollutants.
Finally, in the months from October to December 2020, represented by the fourth quarter compared to the previous year, there was a constant reduction in PM2.5 between 3% and 17% at the investigated stations, while CO increased between 5% and 28% and NO2 reached positive rates ranging between 8% and 14%. During this period, the insolation index remained mostly below 40% (Figure 8), which also explained the increase of up to 7% in HDVs in the highways and the decrease of LDVs, which only range between 2% and 14%. From the observations of DER’s data and the survey carried out by CETESB simultaneously, we could establish an overall relationship by the end of the year of ~8% decreases in all the pollutants and LDVs. During the analysis of the variation in traffic volumes, HDVs slightly increase their flows while the variations were clearly negative for LDVs (Table 5).

3.5. Case Studies Analyzing the Influence of COVID-19 Pandemic on Air Quality

The analysis of social distancing due to COVID-19 pandemic and their impact on air quality are recent topics in the academic literature. To reference this work, three main areas of previous research have been reviewed: (i) existing studies on social distancing due to COVID-19 and their impact on air quality and vehicle activity reduction; (ii) factors influencing air quality improvement; (iii) specific researches addressing the analysis of air quality improvement for different transport policies, with the objective of reducing virus infections, similar to mobility restrictions scenarios (Table 6).
The first group of works mainly perform empirical analyses on the effects of social distancing due to COVID-19 from different perspectives [12,23,33,41,42,44,51,56,57]. The second group of reviewed studies considers the analysis of variables determining air quality improvement during COVID-19 confinement, which is particularly relevant for a better understanding of how those variables can be crucial for air quality improvement within the context of urban regions [8,11,17,26,52,58,59]. A third group of studies focuses on analyzing air quality improvement stimulated by different transport policies at urban regions learning from the COVID-19 scenarios developed to restrict mobility, with particular interest in reducing car traffic [13,14,27,60,61,62].
Table 6. Review of case studies analyzing the influence of COVID-19 pandemic on air quality at different urban regions.
Groups of StudiesReferenceAnalyzed IssueMain Result
Direct impact of COVID-19 on air quality and transport activities[41,51]Impact of the reduction of the transport activity on Canadian’s and Portuguese’s Air QualityThe Air Quality Index (AQI) strongly improved in terms of CO and NO2
[23,44,56]Social distancing measures and use of non-motorized transport modesThe implementation of private vehicle restrictions reduces the degree of air pollution
[12,33,42]São Paulo’s isolation measures influencing the improvement of air quality in the city14% decrease in
NO2 levels for SP in 2020 compared to 2019
[57]Efficiency of Southern California impacts of traffic decreases on air qualityImprovement of air quality as a consequence of a change in the traffic patterns
Factors influencing air quality improvement during COVID-19 confinement: meteorology, socio-demography, urban planning, transport and psychology [52]Air quality index as a proxy of modal choice of different transport alternativesAvoidance of public transportation by wealthy people, indicating that socio-economic inequalities are related to health and perceived risks
[58]Use of geo-statistics to study the interactions of socio-demographic factors and air quality parameters on COVID-19 in the NetherlandsThe results highlight the importance of transport systems and urban planning on disease dissemination
[8,11]Study socio-economic variables, understanding the key factors affecting environmental and health inequalities in Latin American and EnglandStudies show that a long-term increase of 1 µg/m3 PM2.5 was associated with an 8–10% increase of COVID-19 death rates
[17,59]Inequality and gender analyses and use of public transportationLower income, percent black, and peripheral zones continued using public transportation during lockdown, presenting higher COVID-19 rates
[26]Study at the neighborhood level the built environment attributes affecting the virus disseminationCentral areas concentrate commercial activities sustained by important transport infrastructures and are more likely to disseminate the virus
This studyImpact of different vehicles types on air quality and time series analyses A decrease of the traffic for LDVs was more evident than for HDVs, improving air quality index by 20%
Transport policy implications addressing air quality at cities during COVID-19 pandemic scenarios [60]Assess the reduction of private vehicle use during the confinement based on traffic parameters and measurements in TurkeyA change of the air quality index of ~25% was related to a 7% increase in the average traffic speed
[13,14]Evaluate transport policies with a-priori and posteriori mobility data to study the impact on air quality improvementDecision policy-makers must promote active mobility and public transport to reduce inequal access to transport
[61,62]Provide information on the response policies on non-motorized mobility due to the effect of COVID-19There were declines in utilitarian walking and widening inequalities in walking behavior
[27]Conduct an experiment in four European countries consisting of complex mobility patternsDifferential mobility patterns had unequal consequences to economic losses across countries
As observed in this study, there is a need to explore the effects of COVID-19 pandemic on transport use and modal shift since, several empirical analysis has been previously conducted (Table 6). However, there are few studies which points out that the evidence linking HDV differential reduction (compared with LDV) and air quality improvement during the pandemic is limited, given the scarcity of empirical studies and the increment of food deliveries at the residences, and the development of teleworking. An analogous argument was presented by Sarmadi et al. (2021) [63], who indicated that different results were found in 87 capital cities when measuring the air quality efficacy of lockdown restriction measures worldwide. In this context, this work indicates the effort of separating the direct effects of isolation measures to combat COVID-19 from other effects, such as economic recession, level of industrialization and the application of the new technologies.

4. Conclusions

The impact of the emergence and presence of the new Coronavirus in the world’s society is recent and, therefore, there is need to measure accurately what had affected human daily life during this period. Under this scenario, new studies are being developed specifically to assess the changes in the global way of life. In this context, we studied the correlation between improvements on air quality in the MRSP and the application of social isolation measures applied to prevent the virus. Thus, data of traffic volumes from state’s highways, citizens’ isolation index in the region, data from local air quality monitoring stations and satellite images, were evaluated and analyzed. From this information, it was possible to determine that there was a clear relationship between the application of social isolation measures and the improvement of air quality in the MRSP. It was also observed that the variation in pollutant levels over time (PM2.5, CO and NO2) followed the isolation index, reflecting the impact of the volume of vehicles, mainly passenger light vehicles using the central access highways in the region, on air quality.
Air quality monitoring stations in the city presented episodes of reduction in the concentration of atmospheric pollutants related to the reduction of transport activities due to increases of the isolation index. In the first months of the COVID-19 pandemic, first quarter of the year, reductions of more than 50% in the volumes of light vehicles on the state’s highways were observed (i.e., in the case of Bandeirantes highway there was a decrease of monthly averages from 41 thousand vehicles/day in 2019 to 15 thousand vehicles/day after the quarantine decree). During the year 2020, the isolation index decreased from more than 50% in the second quarter, to ~45% in the third quarter and less than 40% in the last months of the year, confirming the transport activity recovery by the end of the year.
NO2 reductions were confirmed by the assessment of satellite images which clearly showed a decrease in the concentration of pollutants during the periods of decline in vehicle circulation. The improving of air quality coupled months with highest isolation indices and it was possible to observe reductions of 30% in the concentrations of the main pollutants (Figure 6). In contrast, after the first half of 2020, the data showed that people began to follow less the social quarantine, lowering the isolation index by more than 15% and consequently increasing the volume of vehicles using the State’s highways. The 2019 levels before the pandemic were recuperated for HDVs as it was the case of the Bandeirantes highway. This road represented the most significant economic corridor in Brazil and showed volumes by the end of the year (~11 thousand vehicles/day) slightly higher than in 2019 (Figure 5). The behavior of the Bandeirantes SP-348, in terms of absolute AADT values and monthly distributions, was also observed in all the analyzed highways and it was possible to extrapolate the performance of this important corridor to the other corridors.
Since LDVs make up more than 85% of the total vehicles in the MRSP, it was possible to state that they contribute most to the variation of air pollution parameters. Using the region as a life observatory during the current pandemic, we can get this valuable information and relate monthly transport activity reductions and air quality improvements. This would be hardly possible without a pandemic of such magnitude, revealing possibilities for the public authorities to draw up future environmental plans and measures to improve air quality, as well as urban mobility projects aimed at reducing private cars on the streets. Thus, the observation and quantification of the relationship between the pandemic, social isolation and air quality represents information that has great potential for future use.

Author Contributions

Conceptualization, P.J.P.-M. and P.K.; methodology, R.M.d.M.; software, T.M.; validation, R.M.d.M., I.M. and P.K.; formal analysis, P.J.P.-M.; investigation, R.M.d.M.; resources, T.M.; data curation, I.M.; writing—original draft preparation, P.J.P.-M.; writing—review and editing, P.K. and R.M.d.M.; visualization, T.M.; supervision, P.J.P.-M.; project administration, P.K. and P.J.P.-M.; funding acquisition, P.K. All authors have read and agreed to the published version of the manuscript.

Funding

This research was funded by FAPESP, grant number 2018/10714-4 and The APC was funded by the Capes (Coordenação de Aperfeiçoamento de Pessoal de Nível Superior). Brazilian Ministry of Education. P.J.P.-M and R.M.d.M. receive productivity grant level 2 from CNPq.

Institutional Review Board Statement

Not applicable.

Informed Consent Statement

Not applicable.

Data Availability Statement

Not applicable.

Acknowledgments

The authors express gratitude to the São Paulo Research Foundation (FAPESP) NOTS Project-Novel high-resolution spatial mapping of health and climate emissions from urban transport in Sao Paulo megacity, from the call “FAPESPESRC-NWO Joint Call for Transnational Collaborative Research Projects” (Grant 2018/10714-4). Prashant Kumar acknowledges the ‘Knowledge transfer and practical application of research on indoor air quality (KTP-IAQ)’ project, which is funded by the University of Surrey’s Research England funding under the Global Challenge Research Fund (GCRF) program. We also express our gratitude to the State Company for the Environment (CETESB) and the São Paulo’s Road Transport Department, for the data provided.

Conflicts of Interest

The authors declare no conflict of interest. The funders had no role in the design of the study; in the collection, analyses, or interpretation of data; in the writing of the manuscript, or in the decision to publish the results.

References

  1. Prefeitura de São Paulo. COVID-19 Relatório Situacional. Available online: https://www.prefeitura.sp.gov.br/cidade/secretarias/saude/vigilancia_em_saude/doencas_e_agravos/coronavirus/index.php?p=295572 (accessed on 14 November 2021).
  2. WHO. Global Ambient Air Quality Database (Update 2021); WHO: New York, NY, USA, 2021. [Google Scholar]
  3. WHO. WHO Coronavirus (COVID-19) Dashboard. 2021; WHO: New York, NY, USA, 2021. [Google Scholar]
  4. Ribeiro, H.; Lima, V.M.; Waldman, E.A. In the COVID-19 pandemic in Brazil, do brown lives matter? Lancet Glob. Health 2020, 8, e976–e977. [Google Scholar] [CrossRef]
  5. Silva, G.A.; Jardim, B.C.; dos Santos, C.V.B. Excess mortality in Brazil in times of COVID-19. Cienc. Saude Coletiva 2020, 25, 3345–3354. [Google Scholar] [CrossRef] [PubMed]
  6. Da Saúde, M. Painel Coronavírus 2021; Ministério da Saúde: Brasilia, Brazil, 2021.
  7. Zoran, M.A.; Savastru, R.S.; Savastru, D.M.; Tautan, M.N. Assessing the relationship between surface levels of PM2.5 and PM10 particulate matter impact on COVID-19 in Milan, Italy. Sci. Total Environ. 2020, 738, 139825. [Google Scholar] [CrossRef] [PubMed]
  8. Travaglio, M.; Yu, Y.; Popovic, R.; Selley, L.; Leal, N.S.; Martins, L.M. Links between air pollution and COVID-19 in England. Environ. Pollut. 2021, 268, 115859. [Google Scholar] [CrossRef]
  9. Governo de São Paulo. Decreto No 64.881, de 22 de Março de 2020. Decreta Quarentena no Estado de São Paulo, no Contexto da Pandemia do COVID-19 (Novo Coronavírus), e dá Providências Complementares. Diário Oficial do Estado São Paulo; 23 March 2020. Available online: https://www.al.sp.gov.br/repositorio/legislacao/decreto/2020/decreto-64881-22.03.2020.html (accessed on 13 November 2021).
  10. Prefeitura de São Paulo. Histórico Mês a Mês. Boletim Diário de Mobilidade e Transportes COVID-19. Available online: https://www.capital.sp.gov.br/noticia/boletim-de-mobilidade-e-transportes-covid-19-1640639478.4 (accessed on 13 November 2021).
  11. Kephart, J.L.; Avila-Palencia, I.; Bilal, U.; Gouveia, N.; Caiaffa, W.T.; Diez Roux, A.V. COVID-19, Ambient Air Pollution, and Environmental Health Inequities in Latin American Cities. J. Urban Health 2021, 98, 428–432. [Google Scholar] [CrossRef] [PubMed]
  12. Connerton, P.; de Assunção, J.V.; de Miranda, R.M.; Slovic, A.D.; Pérez-Martínez, P.J.; Ribeiro, H. Air quality during COVID-19 in four megacities: Lessons and challenges for public health. Int. J. Environ. Res. Public Health 2020, 17, 5067. [Google Scholar] [CrossRef]
  13. Guzman, L.A.; Arellana, J.; Oviedo, D.; Moncada Aristizábal, C.A. COVID-19, activity and mobility patterns in Bogotá. Are we ready for a ‘15-minute city’? Travel Behav. Soc. 2021, 24, 245–256. [Google Scholar] [CrossRef]
  14. Hasselwander, M.; Tamagusko, T.; Bigotte, J.F.; Ferreira, A.; Mejia, A.; Ferranti, E.J.S. Building back better: The COVID-19 pandemic and transport policy implications for a developing megacity. Sustain. Cities Soc. 2021, 69, 102864. [Google Scholar] [CrossRef]
  15. CETESB. Relatório de Qualidade do Ar no Estado de São Paulo, 2019.; Companhia Ambiental do Estado de São Paulo (CETESB), Ed.; Governo do Estado de São Paulo, Secretaria de Infraestrutura e Meio Ambiente: São Paulo, Brazil, 2020.
  16. CONAMA. Resolução no 491, de 10 de Novembro de 2018, do Conselho Nacional do Meio Ambiente-CONAMA. “Dispõe Sobre Padrões de Qualidade do Ar”. Publicada no Diário Oficial da União em 21/11/2018; Diário Oficial da União em 21/11/2018; CONAMA: Brasília, Brazil, 2018.
  17. Fernandes, G.A.; Paulo, A.; Junior, N.; Azevedo, G.; Feriani, D.; Leonardo, I.; Franc, A.; Caruso, P.; Id, P.C. Excess mortality by specific causes of deaths in the city of São Paulo, Brazil, during the COVID-19 pandemic. PloS ONE 2021, 16, e0252238. [Google Scholar] [CrossRef] [PubMed]
  18. CETESB. Emissões Veiculares no Estado de São Paulo—2020; Governo do Estado de São Paulo, Secretaria do Meio Ambiente: São Paulo, Brazil, 2020; ISBN 9786555770131.
  19. CETESB. Plano de Controle de Poluição Veicular 2017–2019; CETESB: São Paulo, Brazil, 2017.
  20. Governo de São Paulo. Decreto no 59.113, de 24 de abril de 2013. Estabelece novos padrões de qualidade do ar e dá providências correlatas. Diário Oficial do Estado São Paulo, 24 April 2013. [Google Scholar]
  21. CETESB QUALAR—Sistema de Informações da Qualidade do Ar. Companhia Ambiental do Estado de São Paulo, CETESB. 2021. Available online: https://qualar.cetesb.sp.gov.br/qualar/home.do (accessed on 14 November 2021).
  22. Pérez-Martínez, P.J.; Andrade, M.F.; Miranda, R.M. Traffic-related air quality trends in São Paulo, Brazil. J. Geophys. Res. Atmos. 2015, 120, 6290–6304. [Google Scholar] [CrossRef] [Green Version]
  23. Chen, Z.; Hao, X.; Zhang, X.; Chen, F. Have traffic restrictions improved air quality? A shock from COVID-19. J. Clean. Prod. 2021, 279, 123622. [Google Scholar] [CrossRef]
  24. Pérez-Martínez, P.J.; Miranda, R.M.; Andrade, M.F.; Kumar, P. Air quality and fossil fuel driven transportation in the Metropolitan Area of São Paulo. Transp. Res. Interdiscip. Perspect. 2020, 5, 100137. [Google Scholar] [CrossRef]
  25. Pérez-Martínez, P.J.; Miranda, R.M.; Andrade, M.F. Freight road transport analysis in the metro São Paulo: Logistical activities and CO2 emissions. Transp. Res. Part A Policy Pract. 2020, 137, 16–33. [Google Scholar] [CrossRef]
  26. Li, B.; Peng, Y.; He, H.; Wang, M.; Feng, T. Built environment and early infection of COVID-19 in urban districts: A case study of Huangzhou. Sustain. Cities Soc. 2021, 66, 102685. [Google Scholar] [CrossRef] [PubMed]
  27. Spelta, A.; Pagnottoni, P. Mobility-based real-time economic monitoring amid the COVID-19 pandemic. Sci. Rep. 2021, 11, 13069. [Google Scholar] [CrossRef]
  28. ESA. Introducing Sentinel-5P; ESA: Paris, France, 2021. [Google Scholar]
  29. ESA. Sentinel-5P Pre-Operations Data Hub; ESA: Paris, France, 2021. [Google Scholar]
  30. DER. Contagem Volumétrica Classificatória. Available online: http://200.144.30.103:8081/vdm/Page/Detalhe.aspx?Param=SP348;2021;8 (accessed on 13 November 2021).
  31. IPT. Instituto de Pesquisas Tecnológicas Responde Perguntas Frequentes (FAQs) sobre Índices de Isolamento SOCIAL Divulgados Pelo Governo de SP; IPT: São Paulo, Brazil, 2021. [Google Scholar]
  32. SIMI-SP. Adesão ao Isolamento Social em SP. Sistema de Monitoramento Inteligente do Governo de São Paulo Atualiza Diariamente índice de adesão ao Isolamento Social no Estado. Available online: https://www.saopaulo.sp.gov.br/coronavirus/isolamento/ (accessed on 13 November 2021).
  33. Ibarra-Espinosa, S.; Dias de Freitas, E.; Ropkins, K.; Dominici, F.; Rehbein, A. Negative-Binomial and quasi-poisson regressions between COVID-19, mobility and environment in São Paulo, Brazil. Environ. Res. 2021, 112369. [Google Scholar] [CrossRef] [PubMed]
  34. Pérez-Martínez, P.J.; de Fátima Andrade, M.; de Miranda, R.M. Heavy truck restrictions and air quality implications in São Paulo, Brazil. J. Environ. Manag. 2017, 202, 55–68. [Google Scholar] [CrossRef]
  35. Behera, M.D.; Mudi, S.; Shome, P.; Das, P.K.; Kumar, S.; Joshi, A.; Rathore, A.; Deep, A.; Kumar, A.; Sanwariya, C.; et al. COVID-19 slowdown induced improvement in air quality in India: Rapid assessment using Sentinel-5P TROPOMI data. Geocarto Int. 2021, 1–21, ahead of print. [Google Scholar] [CrossRef]
  36. Stratoulias, D.; Nuthammachot, N. Air quality development during the COVID-19 pandemic over a medium-sized urban area in Thailand. Sci. Total Environ. 2020, 746, 141320. [Google Scholar] [CrossRef] [PubMed]
  37. Hashim, B.M.; Al-Naseri, S.K.; Al-Maliki, A.; Al-Ansari, N. Impact of COVID-19 lockdown on NO2, O3, PM2.5 and PM10 concentrations and assessing air quality changes in Baghdad, Iraq. Sci. Total Environ. 2021, 754, 141978. [Google Scholar] [CrossRef]
  38. METRO-SP. Pesquisa Origem e Destino 1967, 1977, 1987, 1997, 2007, 2017: Região Metropolitana de São Paulo—Síntese das Informações da Pesquisa Domiciliar; Governo do Estado de São Paulo, Secretaria dos Transportes Metropolitanos: São Paulo, Brazil, 2019. Available online: http://www.metro.sp.gov.br/pesquisa-od/ (accessed on 10 November 2021).
  39. CET. Lentidão no Trânsito—2019, 2020 e 2021. Available online: http://dados.prefeitura.sp.gov.br/it/dataset/base-de-dados-sobre-lentidao-por-trechos-cet (accessed on 10 November 2021).
  40. CET. Pesquisa de Monitoramento da Mobilidade, Mobilidade no Sistema viário Principal: Volume e Velocidade 2015–2019. Available online: http://www.cetsp.com.br/sobre-a-cet/relatorios-corporativos.aspx (accessed on 10 November 2021).
  41. Gama, C.; Relvas, H.; Lopes, M.; Monteiro, A. The impact of COVID-19 on air quality levels in Portugal: A way to assess traffic contribution. Environ. Res. 2021, 193, 110515. [Google Scholar] [CrossRef]
  42. Brandao, R.; Foroutan, H. Air quality in Southeast Brazil during COVID-19 lockdown: A combined satellite and ground-based data analysis. Atmosphere 2021, 12, 583. [Google Scholar] [CrossRef]
  43. Betancourt-Odio, M.A.; Martínez-De-ibarreta, C.; Budría-Rodríguez, S.; Wirth, E. Local analysis of air quality changes in the community of madrid before and during the COVID-19 induced lockdown. Atmosphere 2021, 12, 659. [Google Scholar] [CrossRef]
  44. Rossi, R.; Ceccato, R.; Gastaldi, M. Effect of Road Traffic on Air Pollution. Experimental Evidence from COVID-19 Lockdown. Sustainability 2020, 12, 8984. [Google Scholar] [CrossRef]
  45. SPTRANS. Passageiros Transportados—2019, 2020, 2021. Available online: https://www.prefeitura.sp.gov.br/cidade/secretarias/transportes/institucional/sptrans/acesso_a_informacao/agenda/index.php?p=306932 (accessed on 7 June 2021).
  46. SPTRANS. General Transit Feed Specification—GTFS. Dados de transporte público da cidade de São Paulo. Available online: https://www.sptrans.com.br/desenvolvedores/ (accessed on 7 June 2021).
  47. DER. Pesquisa de Radares. 2021; DER: São Paulo, Brazil, 2021. Available online: http://www.der.sp.gov.br/WebSite/MalhaRodoviaria/LocalizacaoRadar.aspx (accessed on 7 June 2021).
  48. CETESB. Configuração da Rede Automática e Localização das Estações. 2021; CETESB: São Paulo, Brazil, 2021. Available online: https://cetesb.sp.gov.br/ar/configuracao-da-rede-automatica/ (accessed on 12 June 2021).
  49. Mogaji, E. Impact of COVID-19 on transportation in Lagos, Nigeria. Transp. Res. Interdiscip. Perspect. 2020, 6, 100154. [Google Scholar] [CrossRef] [PubMed]
  50. Oliveira, M.C.Q.D.; Drumond, A.; Rizzo, L.V. Air pollution persistent exceedance events in the Brazilian metropolis of Sao Paulo and associated surface weather patterns. Int. J. Environ. Sci. Technol. 2021. ahead of print. [Google Scholar] [CrossRef]
  51. Tian, X.; An, C.; Chen, Z.; Tian, Z. Assessing the impact of COVID-19 pandemic on urban transportation and air quality in Canada. Sci. Total Environ. 2021, 765, 144270. [Google Scholar] [CrossRef] [PubMed]
  52. Barbieri, D.M.; Lou, B.; Passavanti, M.; Hui, C.; Hoff, I.; Lessa, D.A.; Sikka, G.; Chang, K.; Gupta, A.; Fang, K.; et al. Impact of COVID-19 pandemic on mobility in ten countries and associated perceived risk for all transport modes. PLoS ONE 2021, 16, e0245886. [Google Scholar] [CrossRef] [PubMed]
  53. Sharifi, A.; Khavarian-Garmsir, A.R. The COVID-19 pandemic: Impacts on cities and major lessons for urban planning, design, and management. Sci. Total Environ. 2020, 749, 142391. [Google Scholar] [CrossRef]
  54. Governo de São Paulo. Adesão ao Isolamento Social em SP. Available online: https://www.saopaulo.sp.gov.br/coronavirus/isolamento/ (accessed on 15 May 2021).
  55. SEADE. IMP—Informação dos Municípios Paulistas; SEADE: São Paulo, Brazil, 2020. Available online: https://imp.seade.gov.br/frontend/ (accessed on 7 May 2021).
  56. Camargo-Caicedo, Y.; Mantilla-Romo, L.C.; Bolaño-Ortiz, T.R. Emissions reduction of greenhouse gases, ozone precursors, aerosols and acidifying gases from road transportation during the COVID-19 lockdown in Colombia. Appl. Sci. 2021, 11, 1458. [Google Scholar] [CrossRef]
  57. Parker, H.A.; Hasheminassab, S.; Crounse, J.D.; Roehl, C.M.; Wennberg, P.O. Impacts of Traffic Reductions Associated with COVID-19 on Southern California Air Quality. Geophys. Res. Lett. 2020, 47, e2020GL090164. [Google Scholar] [CrossRef]
  58. Cole, M.A.; Ozgen, C.; Strobl, E. Air Pollution Exposure and COVID-19; Discussion Paper Series. IZA DP No. 13367; Institute of Labor Economics: Bonn, Germany, 2020. [Google Scholar]
  59. Mendoza, D.L.; Benney, T.M.; Ganguli, R.; Pothina, R.; Pirozzi, C.S.; Quackenbush, C.; Baty, S.R.; Crosman, E.T.; Zhang, Y. The Role of Structural Inequality on COVID-19 Incidence Rates at the Neighborhood Scale in Urban Areas. COVID 2021, 10, 186–202. [Google Scholar] [CrossRef]
  60. Alemdar, K.D.; Kaya, Ö.; Canale, A.; Çodur, M.Y.; Campisi, T. Evaluation of air quality index by spatial analysis depending on vehicle traffic during the COVID-19 outbreak in Turkey. Energies 2021, 14, 5729. [Google Scholar] [CrossRef]
  61. Hunter, R.F.; Garcia, L.; de Sa, T.H.; Zapata-Diomedi, B.; Millett, C.; Woodcock, J.; Pentland, A.S.; Moro, E. Effect of COVID-19 response policies on walking behavior in US cities. Nat. Commun. 2021, 12, 3652. [Google Scholar] [CrossRef] [PubMed]
  62. Nikitas, A.; Tsigdinos, S.; Karolemeas, C.; Kourmpa, E.; Bakogiannis, E. Cycling in the era of COVID-19: Lessons learnt and best practice policy recommendations for a more bike-centric future. Sustainability 2021, 13, 4620. [Google Scholar] [CrossRef]
  63. Sarmadi, M.; Rahimi, S.; Rezaei, M.; Sanaei, D.; Dianatinasab, M. Air quality index variation before and after the onset of COVID-19 pandemic: A comprehensive study on 87 capital, industrial and polluted cities of the world. Environ. Sci. Eur. 2021, 33. [Google Scholar] [CrossRef] [PubMed]
Figure 1. Location of the selected air quality monitoring stations over the Municipalities of the Metropolitan Region of São Paulo (MRSP), with zoom over São Paulo, and the corresponding main access highways: Ayrton Senna Hw (SP-70), Raposo Tavares Hw (SP-270), Castelo Branco Hw (SP-280), Anhanguera Hw (SP-330) and Bandeirantes Hw (SP-348). Notes: the coordinates of the standard air quality stations and highways are in Table 1 and Table 2, respectively.
Atmosphere 13 00052 g001
Figure 2. Time series of Annual Average Daily Traffic (AADT) of cars (thousand vehicles/day) circulating in the Metropolitan Region of São Paulo (MRSP) in 2020 (orange lines), and 2019 (blue lines): (A)—Bandeirantes (SP-348), (B)—Anhanguera (SP-330), (C)—Castelo Branco (SP-280), (D)—Raposo Tavares (SP-270) and (E)—Ayrton Senna (SP-70). Source: own elaboration based on DER/SP data (2020). Note: Red and green vertical shaded bars represent the months with some mobility restrictions and reopening of the economic activities, respectively. Blue and orange continuous lines represent 14-day moving averages.
Atmosphere 13 00052 g002
Figure 3. Time series of Annual Average Daily Traffic (AADT) of motorcycles (thousand vehicles/day) circulating in the Metropolitan Region of São Paulo (MRSP) in 2020 (orange lines), and 2019 (blue lines): (A)—Bandeirantes (SP-348), (B)—Anhanguera (SP-330), (C)—Castelo Branco (SP-280), (D)—Raposo Tavares (SP-270) and (E)—Ayrton Senna (SP-70). Source: own elaboration based on DER/SP data (2020). Note: Red and green vertical shaded bars represent the months with some mobility restrictions and reopening of the economic activities, respectively. Blue and orange continuous lines represent 14-day moving averages.
Atmosphere 13 00052 g003
Figure 4. Time series of Annual Average Daily Traffic (AADT) of Heavy Duty Vehicles (HDVs) (thousand vehicles/day) circulating in the Metropolitan Region of São Paulo (MRSP) in 2020 (orange lines), and 2019 (blue lines): (A)—Bandeirantes (SP-348), (B)—Anhanguera (SP-330), (C)—Castelo Branco (SP-280), (D)—Raposo Tavares (SP-270) and (E)—Ayrton Senna (SP-70). Source: own elaboration based on DER/SP data (2020). Note: Red and green vertical shaded bars represent the months with some mobility restrictions and reopening of the economic activities, respectively. Blue and orange continuous lines represent 14-day moving averages.
Atmosphere 13 00052 g004
Figure 5. Mobility trends for (A) Light Duty Vehicles (LDVs), including cars and motorcycles, and for (B) Heavy Duty Vehicles (HDVs), estimated for four main access highways in the Metropolitan Region of São Paulo (MRSP), between January and December 2020, compared to baseline 2019. Note: red and green vertical shaded bars represent the months with some mobility restrictions (April to June) and reopening of the economic activities (October to December), respectively. Between mobility and economic reopening, the varying sanitary conditions advised against policies of relaxation of social distancing. Results characterize monthly deviations of traffic, LDV and HDV flows; deviations of month i (January-December 2020) were estimated from 2019 baseline records (deviation monthi = (monthi − monthi,2019)/monthi,2019), comparing with the same month of the previous year; ANH: Anhanguera Hw (SP-330); CBR: Castelo Branco Hw (SP-280); BAN: Bandeirantes Hw (SP-348); RTA: Raposo Tavares Hw (SP-270).
Atmosphere 13 00052 g005
Figure 6. Timeseries of 1-PM2.5 (µg/m3), 2-CO (ppm) and 3-NO2 (µg/m3) daily concentrations observed from 1 January to 31 December 2019 (blue lines) and 2020 (orange lines), measured at the CETESB’s monitoring stations close to the main access highways in the Metropolitan Region of São Paulo (MRSP): Guarulhos-Pimentas (A1A3), Tietê-Ponte dos Remedios (B1B3), Osasco (C1C3), São Caetano do Sul (D1D3) and São Bernardo (E1E3). Blue and orange continuous lines represent 14-day moving averages.
Atmosphere 13 00052 g006
Figure 7. Comparison of the vertical tropospheric column of NO2 in the MRSP at each end of year quarter between 2019 (left figures) and 2020 (right figures). (A1,A2) first quarter (end March), (B1,B2) second quarter (end June), (C1,C2) third quarter (end September), (D1,D2) fourth quarter (end of December). Source: modified from Google Earth with data from Sentinel 5P satellite.
Atmosphere 13 00052 g007
Figure 8. Isolation index in the MRSP in 2020. Source: own elaboration based on data from the Government of São Paulo. Notes: The vertical bars represent values at the end of year-quarter. According to the Mobility Survey of the Metropolitan Company of São Paulo (2017), ~29% of people in the MRSP do not usually move (permanent immobility rate of population). Note: red and green vertical shaded bars represent the months with some mobility restrictions and reopening of the economic activities, respectively. Source: own preparation from SEADES’s data [54,55].
Atmosphere 13 00052 g008
Table 1. Locations of the analyzed traffic radars representing the main road accesses of the MRSP. Source: own preparation based on data available by the São Paulo’s Road Transport Department (DER/SP, 2021).
Highway Nomenclature
(SP-Number)
Location (km)Driving DirectionLatitude 1 (°)Longitude 1 (°)
Ayrton Senna Hw. (SP-070)51-kmWest−23.42−46.20
66-kmWest−23.36−46.08
Rodovia Raposo Tavares Hw. (SP-270)38-kmEast−23.62−46.97
84-kmWest−23.51−47.33
Rodovia Castello Branco Hw. (SP-280)35-kmWest−23.52−46.96
52-kmWest−23.44−47.09
Anhanguera Hw. (SP-330)54-kmNorth−23.22−46.88
73-kmSouth−23.08−46.98
Bandeirantes Hw. (SP-348)44-kmNorth−23.28−46.85
61-kmNorth−23.16−46.95
1 Coordinates correspond to the geographical location of the radars of Figure 1. Source: own elaboration from DER’s data.
Table 2. Location of selected air quality monitoring stations. Source: own preparation with data from QUALAR system (CETESB, 2021).
Station of CETESBLatitude 1 (°)Longitude 1 (°)Near Access Highway
Marginal Tietê-Ponte dos Remédios−23.52−46.74Bandeirantes Hw. (SP-348)
São Caetano do Sul−23.62−46.56-
Osasco−23.53−46.79Raposo Tavares Hw. (SP-270)
São Bernardo-Centro−23.70−46.55-
Guarulhos-Pimentas−23.44−46.41Ayrton Senna Hw. (SP-070)
1 Coordinates correspond to the geographical location of the air quality stations of Figure 1. Source: own elaboration from CETESB’s data.
Table 3. Variation of PM2.5, CO and NO2 concentrations during the 2020-year quarters compared to the same periods of the previous 2019-year at the selected CETESB stations for analyzing the air quality changes. Source: own preparation from the QUALAR system (2020).
Period 1AQ StationΔPM2.5
(%)
ΔCO
(%)
ΔNO2
(%)
1st-year quarter
(January–March)
Guarulhos-Pimentas St.−19.3−25.1−25.0
Marginal Tietê-Pte. Remédios St.−9.1−20.5−16.9
Osasco St.−20.9−20.2−17.7
São Bernardo-Centro St.−3.4−22.9−23.2
São Caetano do Sul St.−26.5−13.9−29.2
2nd-year quarter
(April–June)
Guarulhos-Pimentas St.−15.3−15.7−13.2
Marginal Tietê-Pte. Remédios St.−10.7−23.9−14.0
Osasco St.−20.5−29.7−16.6
São Bernardo-Centro St.−8.4−18.6−16.3
São Caetano do Sul St.−20.8−25.4−15.2
3rd-year quarter
(July–September)
Guarulhos-Pimentas St.14.10.9−1.1
Marginal Tietê-Pte. Remédios St.−6.2−6.13.8
Osasco St.0.2−10.7−5.6
São Bernardo-Centro St.9.2−12.6−13.6
São Caetano do Sul St.14.3−7.6−1.0
4th-year quarter
(October–December)
Guarulhos-Pimentas St.−16.74.99.9
Marginal Tietê-Pte. Remédios St.−5.912.213.7
Osasco St.−5.4−10.5−4.5
São Bernardo-Centro St.−9.028.913.5
São Caetano do Sul St.−3.94.98.3
1 Concentration levels were observed every 3 months, on the 4th Wednesday of March, June and September 2019 and 2020, as well as on the 3rd Wednesday of December 2019 and 2020.
Table 4. Variation of LDV and HDV traffic flows (AADT) during the 2020-year quarters compared to the same periods of the previous 2019-year at the selected counting traffic stations from the main access highways in the MRSP for analyzing classificatory volumes. Source: own preparation from the DER/SP records (2020).
Period 1Main Highway 2Location
(km)
ΔADT-
LDVs (%)
ΔADT-
HDVs (%)
1st-year quarter
(January–March)
Raposo Tavares Hw.38–84−7.24.3
Castello Branco Hw.35–52−2.2−0.5
Anhanguera Hw.54–73−3.81.6
Bandeirantes Hw.44–61−5.53.5
2nd-year quarter
(April–June)
Raposo Tavares Hw.38–84−26.4−11.5
Castello Branco Hw.35–52−37.8−13.4
Anhanguera Hw.54–73−38.9−15.1
Bandeirantes Hw.44–61−52.2−14.1
3rd-year quarter
(July–September)
Raposo Tavares Hw.38–84−6.3−3.1
Castello Branco Hw.35–52−10.0−0.8
Anhanguera Hw.54–73−20.8−8.1
Bandeirantes Hw.44–61−30.7−0.7
4th-year quarter
(October–December)
Raposo Tavares Hw.38–84−3.8−3.2
Castello Branco Hw.35–52−2.66.7
Anhanguera Hw.54–73−11.10.1
Bandeirantes Hw.44–61−14.4−2.0
1 Traffic levels were observed every 3 months, on the 4th Wednesday of March, June and September 2019 and 2020, as well as on the 3rd Wednesday of December 2019 and 2020. 2 The Ayrton Senna highway was not considered due to inconsistencies observed in the radar data.
Table 5. Simultaneous variations of pollutants and traffic flows during year quarters and for the combination of investigated air quality stations and highways.
ΔPM2.5
± SD 1
ΔCO
± SD 1
ΔNO2
± SD 1
ΔADTLDVs
± SD 1
ΔADTHDVs
± SD 1
Marginal Tietê-Ponte dos Remédios/Bandeirantes (SP-348) and Anhanguera (SP-330)
1st-year quarter (J–M)−9.1−20.5−16.9−4.7 ± 1.22.5 ± 1.4
2nd-year quarter (A–J)−10.7−23.9−14.0−45.6 ± 9.4−14.6 ± 0.7
3rd-year quarter (J–S)−6.2−6.13.8−25.7 ± 6.9−4.4 ± 5.3
4th-year quarter (O–D)−6.012.213.7−12.7 ± 2.3−1.0 ± 1.4
Osasco/Raposo Tavares (SP-270) and Castelo Branco (SP-280)
1st-year quarter (J–M)−20.9−20.2−16.9−4.7 ± 3.51.9 ± 3.4
2nd-year quarter (A–J)−20.5−29.7−16.6−32.1 ± 8.0−12.5 ± 1.3
3rd-year quarter (J–S)0.2−10.7−5.6−8.1 ± 2.6−1.9 ± 1.6
4th-year quarter (O–D)−5.4−10.5−4.5−3.2 ± 0.91.8 ± 7.0
São Bernardo and São Caetano/Raposo Tavares (SP-270)
1st-year quarter (J–M)−15.0 ± 21.1−18.4 ± 6.4−26.2−7.24.2
2nd-year quarter (A–J)−14.6 ± 8.8−22.0 ± 4.8−15.8−26.4−11.5
3rd-year quarter (J–S)11.7 ± 3.7−10.1 ± 3.6−7.3−6.3−3.1
4th-year quarter (O–D)−6.4 ± 3.616.9 ± 16.910.9−3.8−3.2
All air quality station/highways combinations
1st-year quarter (J–M)−15.8 ± 9.4−21.51 ± 4.2−22.4 ± 5.2−4.7 ± 2.22.2 ± 2.1
2nd-year quarter (A–J)−15.2 ± 5.6−22.6 ± 5.6−15.1 ± 1.5−38.8 ± 10.5−13.5 ± 1.5
3rd-year quarter (J–S)6.3 ± 9.1−7.2 ± 5.2−3.5 ± 6.6−16.9 ± 11.0−3.2 ± 3.5
4th-year quarter (O–D)8.2 ± 5.18.1 ± 14.38.2 ± 7.4−8.0 ± 5.70.4 ± 4.4
1 Data are means ± standard deviations (SD).
Publisher’s Note: MDPI stays neutral with regard to jurisdictional claims in published maps and institutional affiliations.

