
The Use of Composite GOES-R Satellite Imagery to Evaluate a TC Intensity and Vortex Structure Forecast by an FV3GFS-Based Hurricane Forecast Model


Abstract
:1. Introduction
2. The Model
3. Case and Data
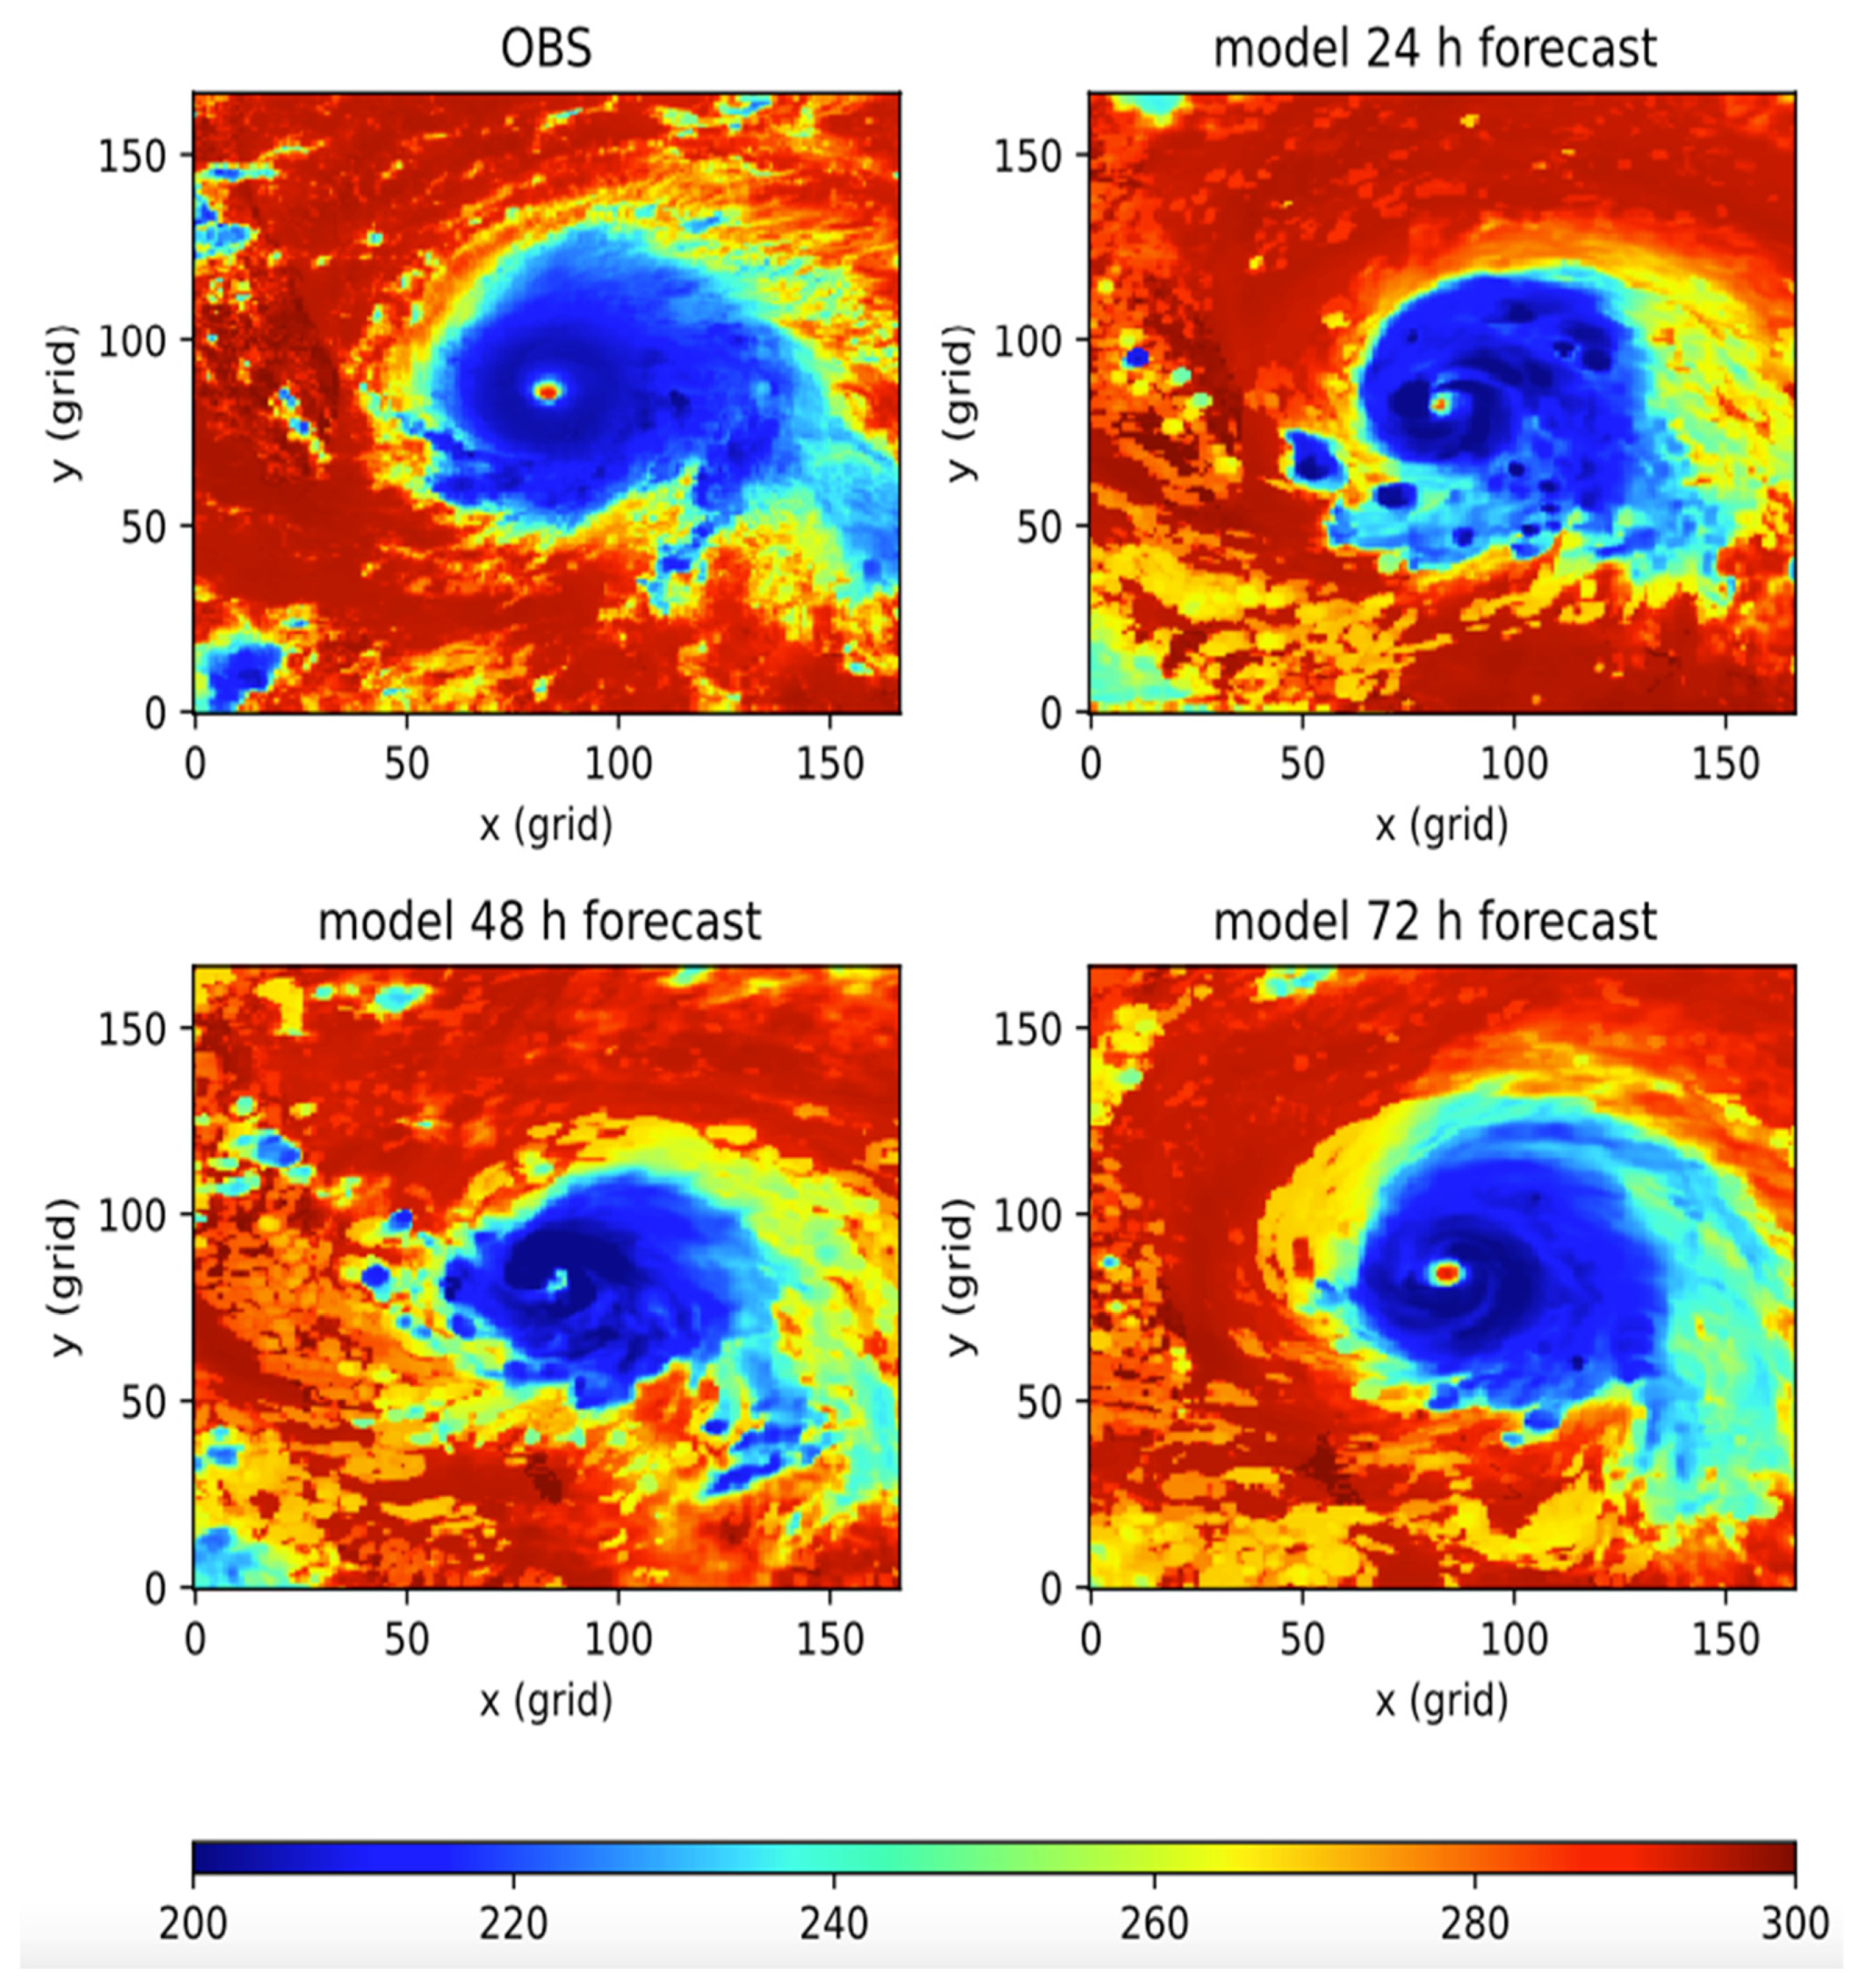
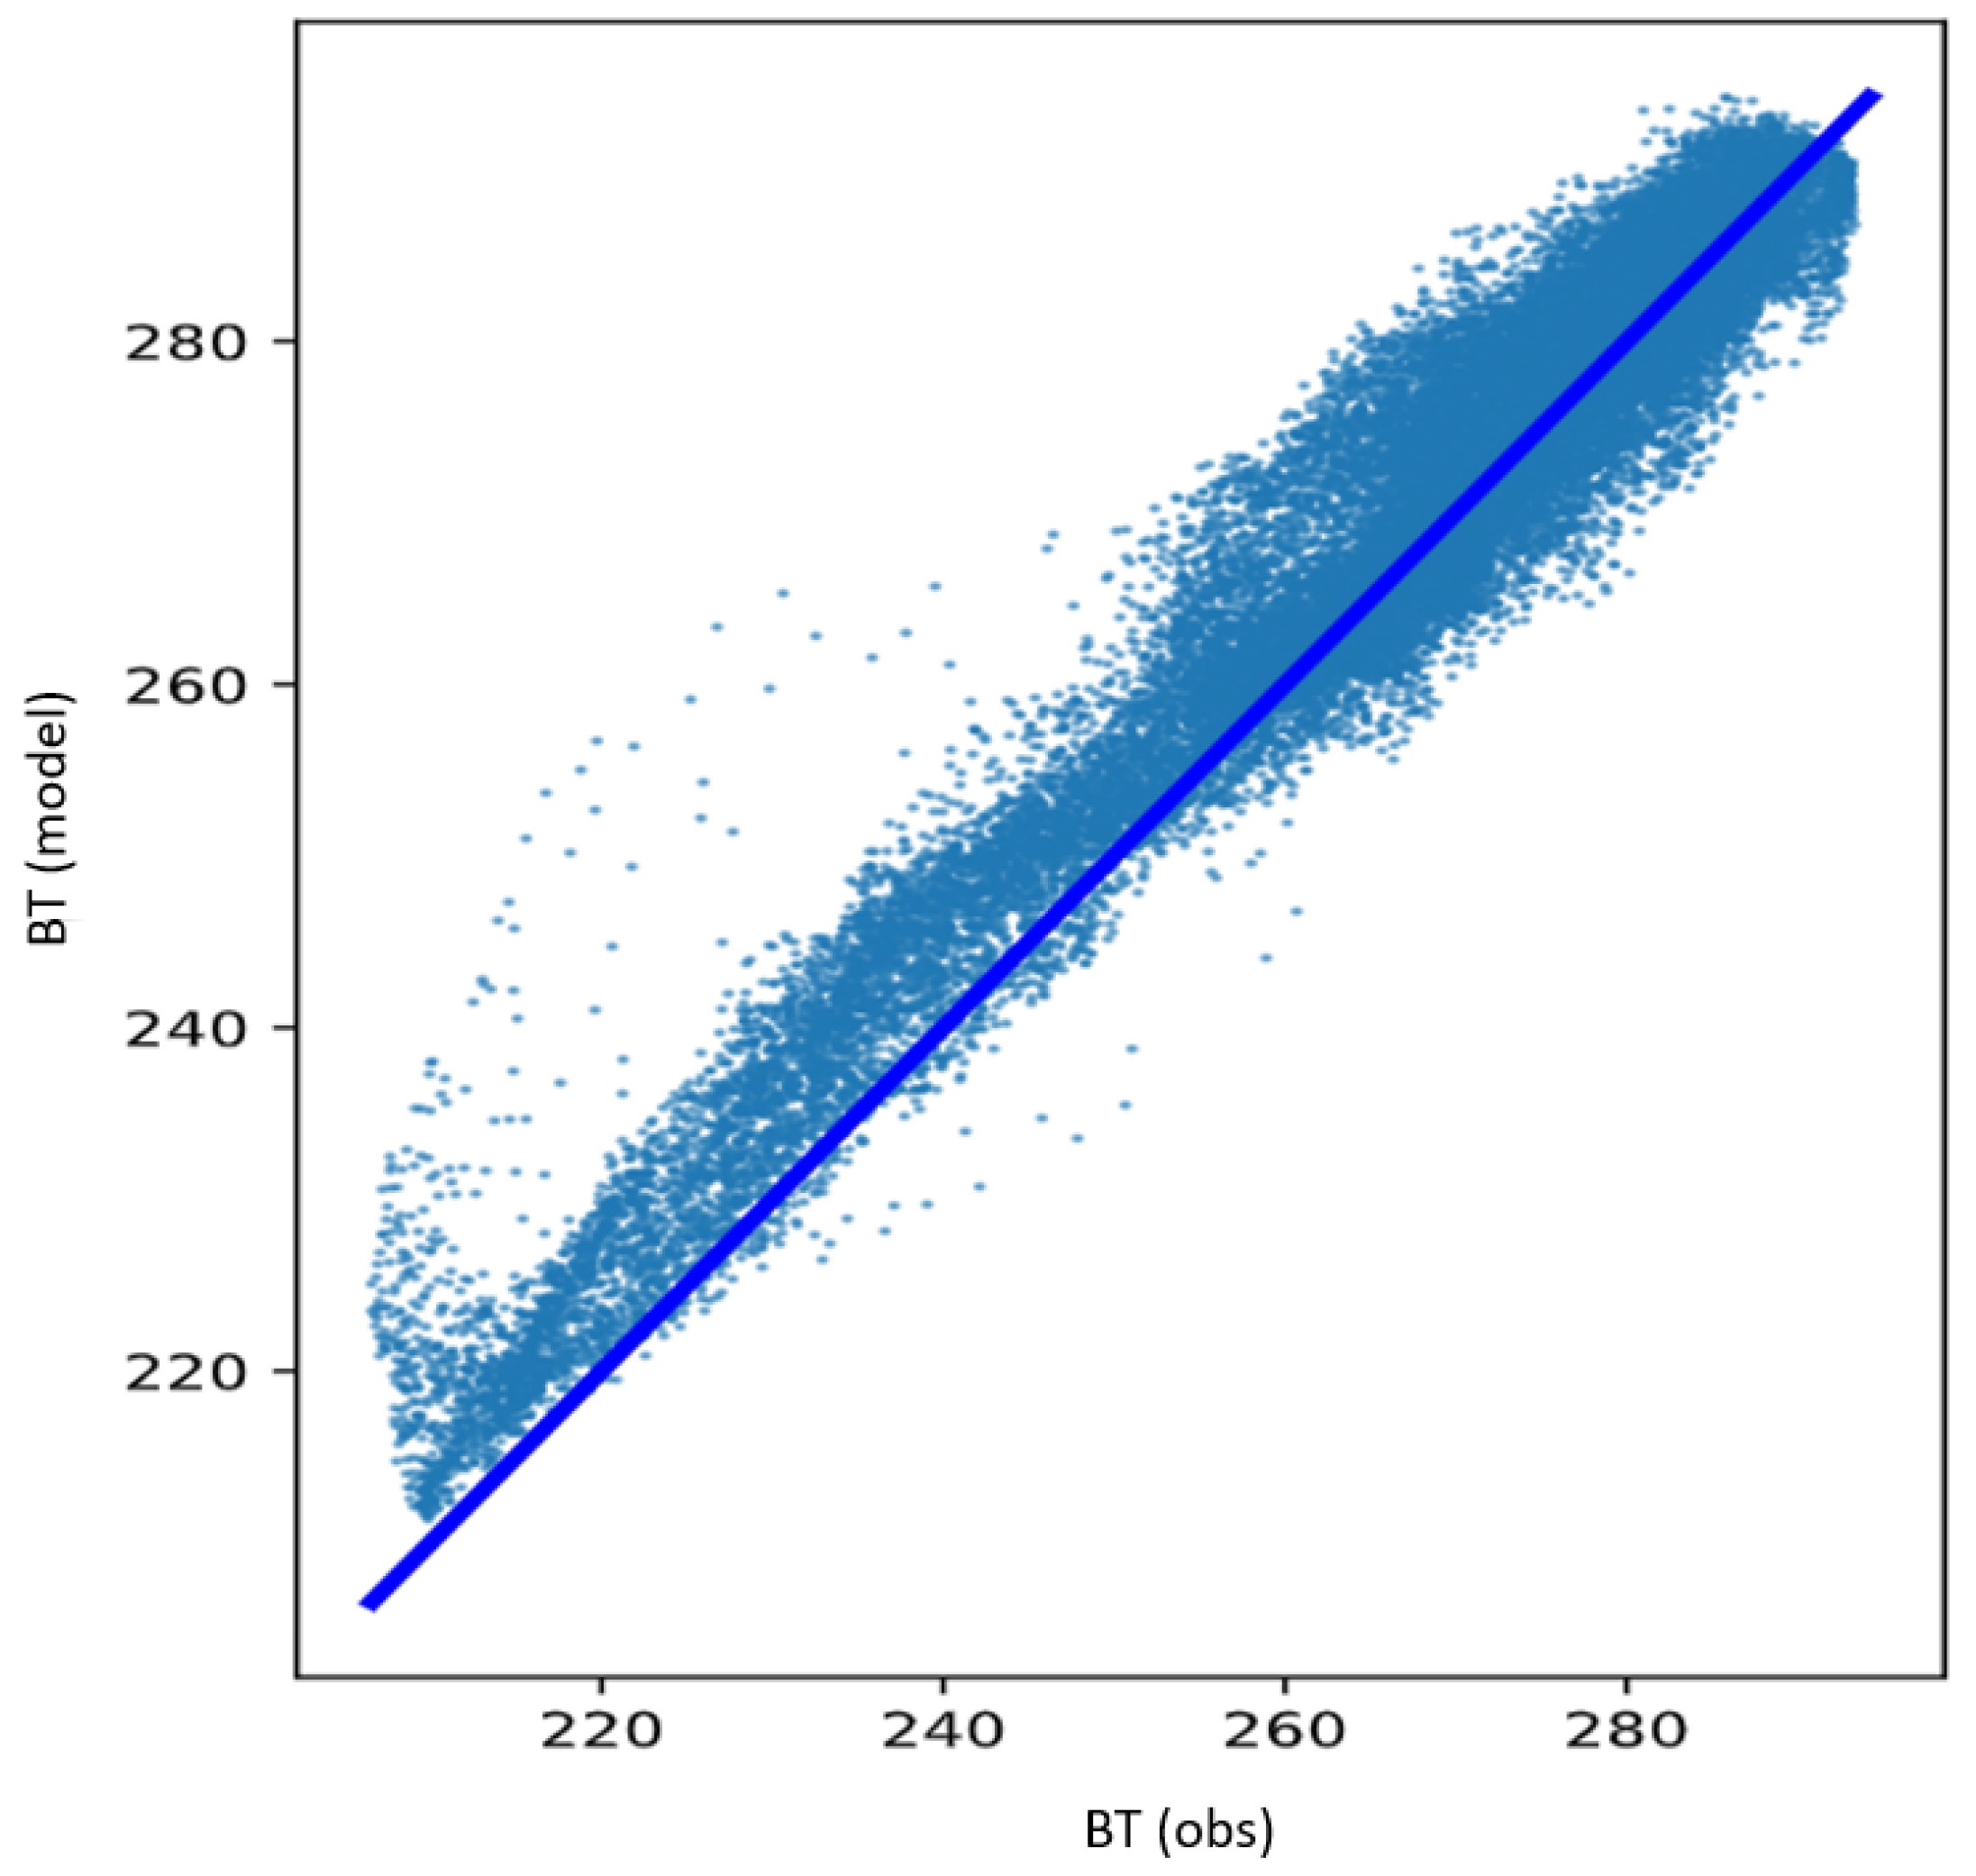
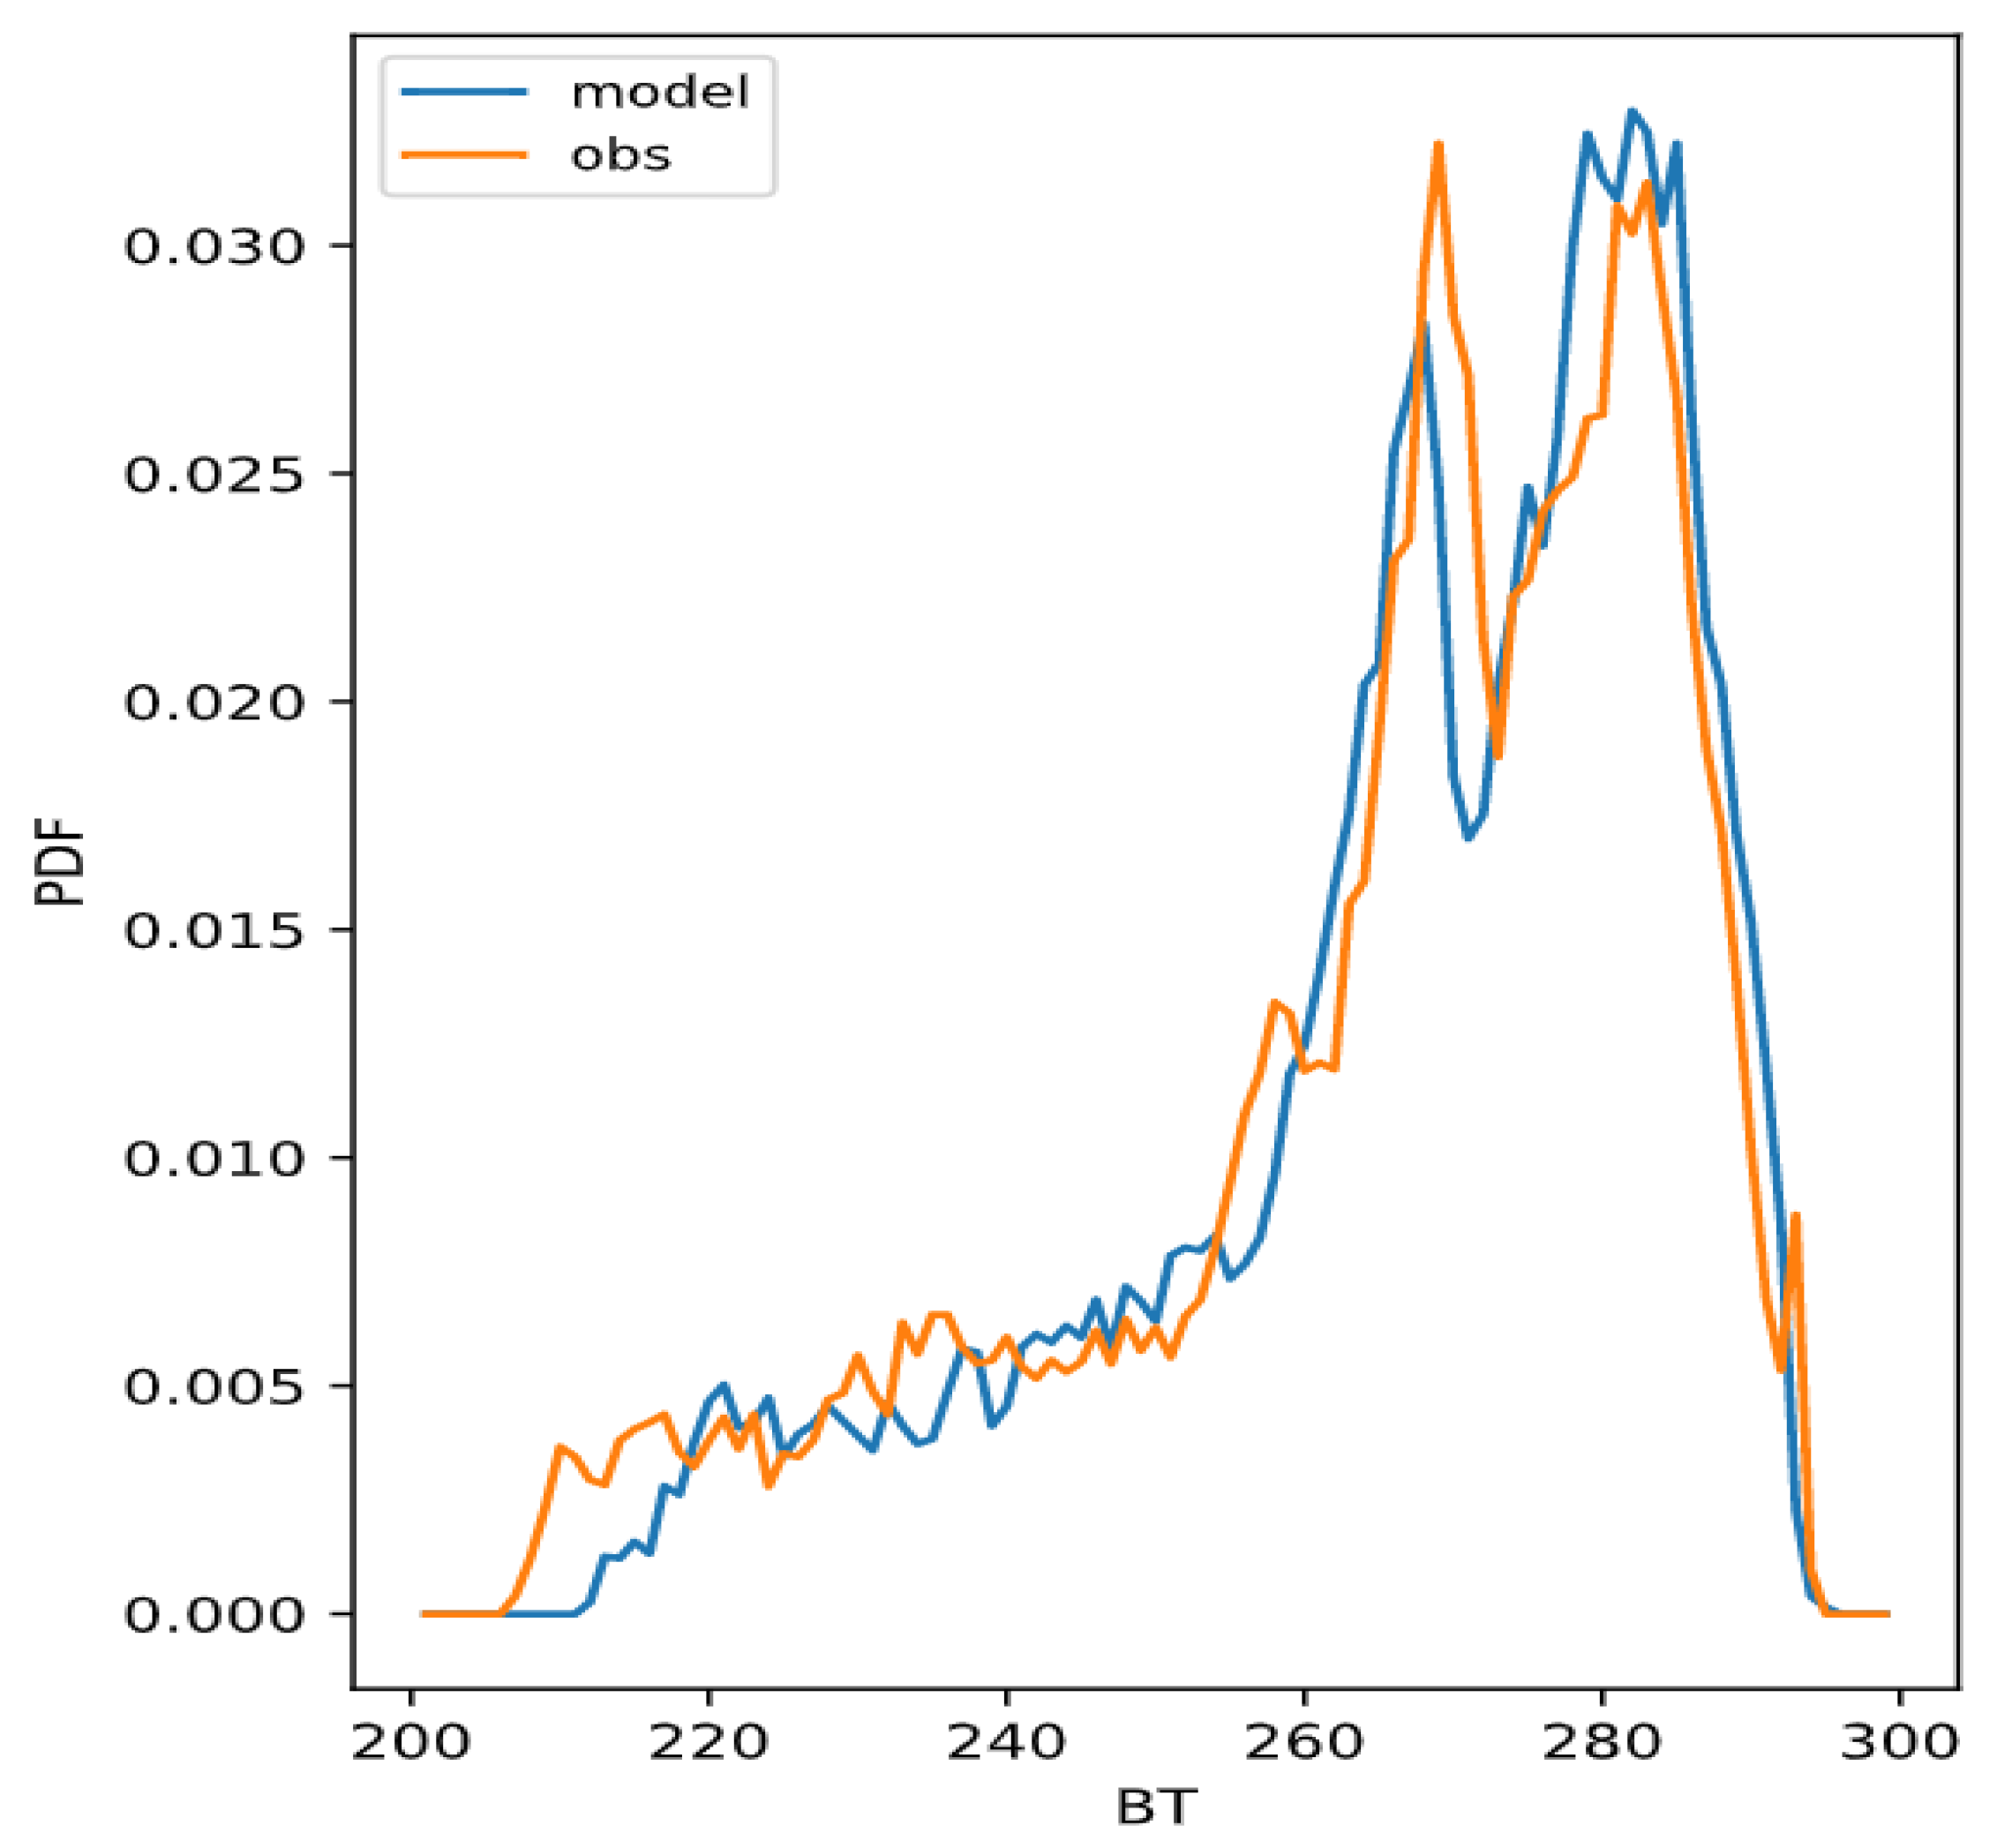
4. Results and Discussion
4.1. TC Intensity
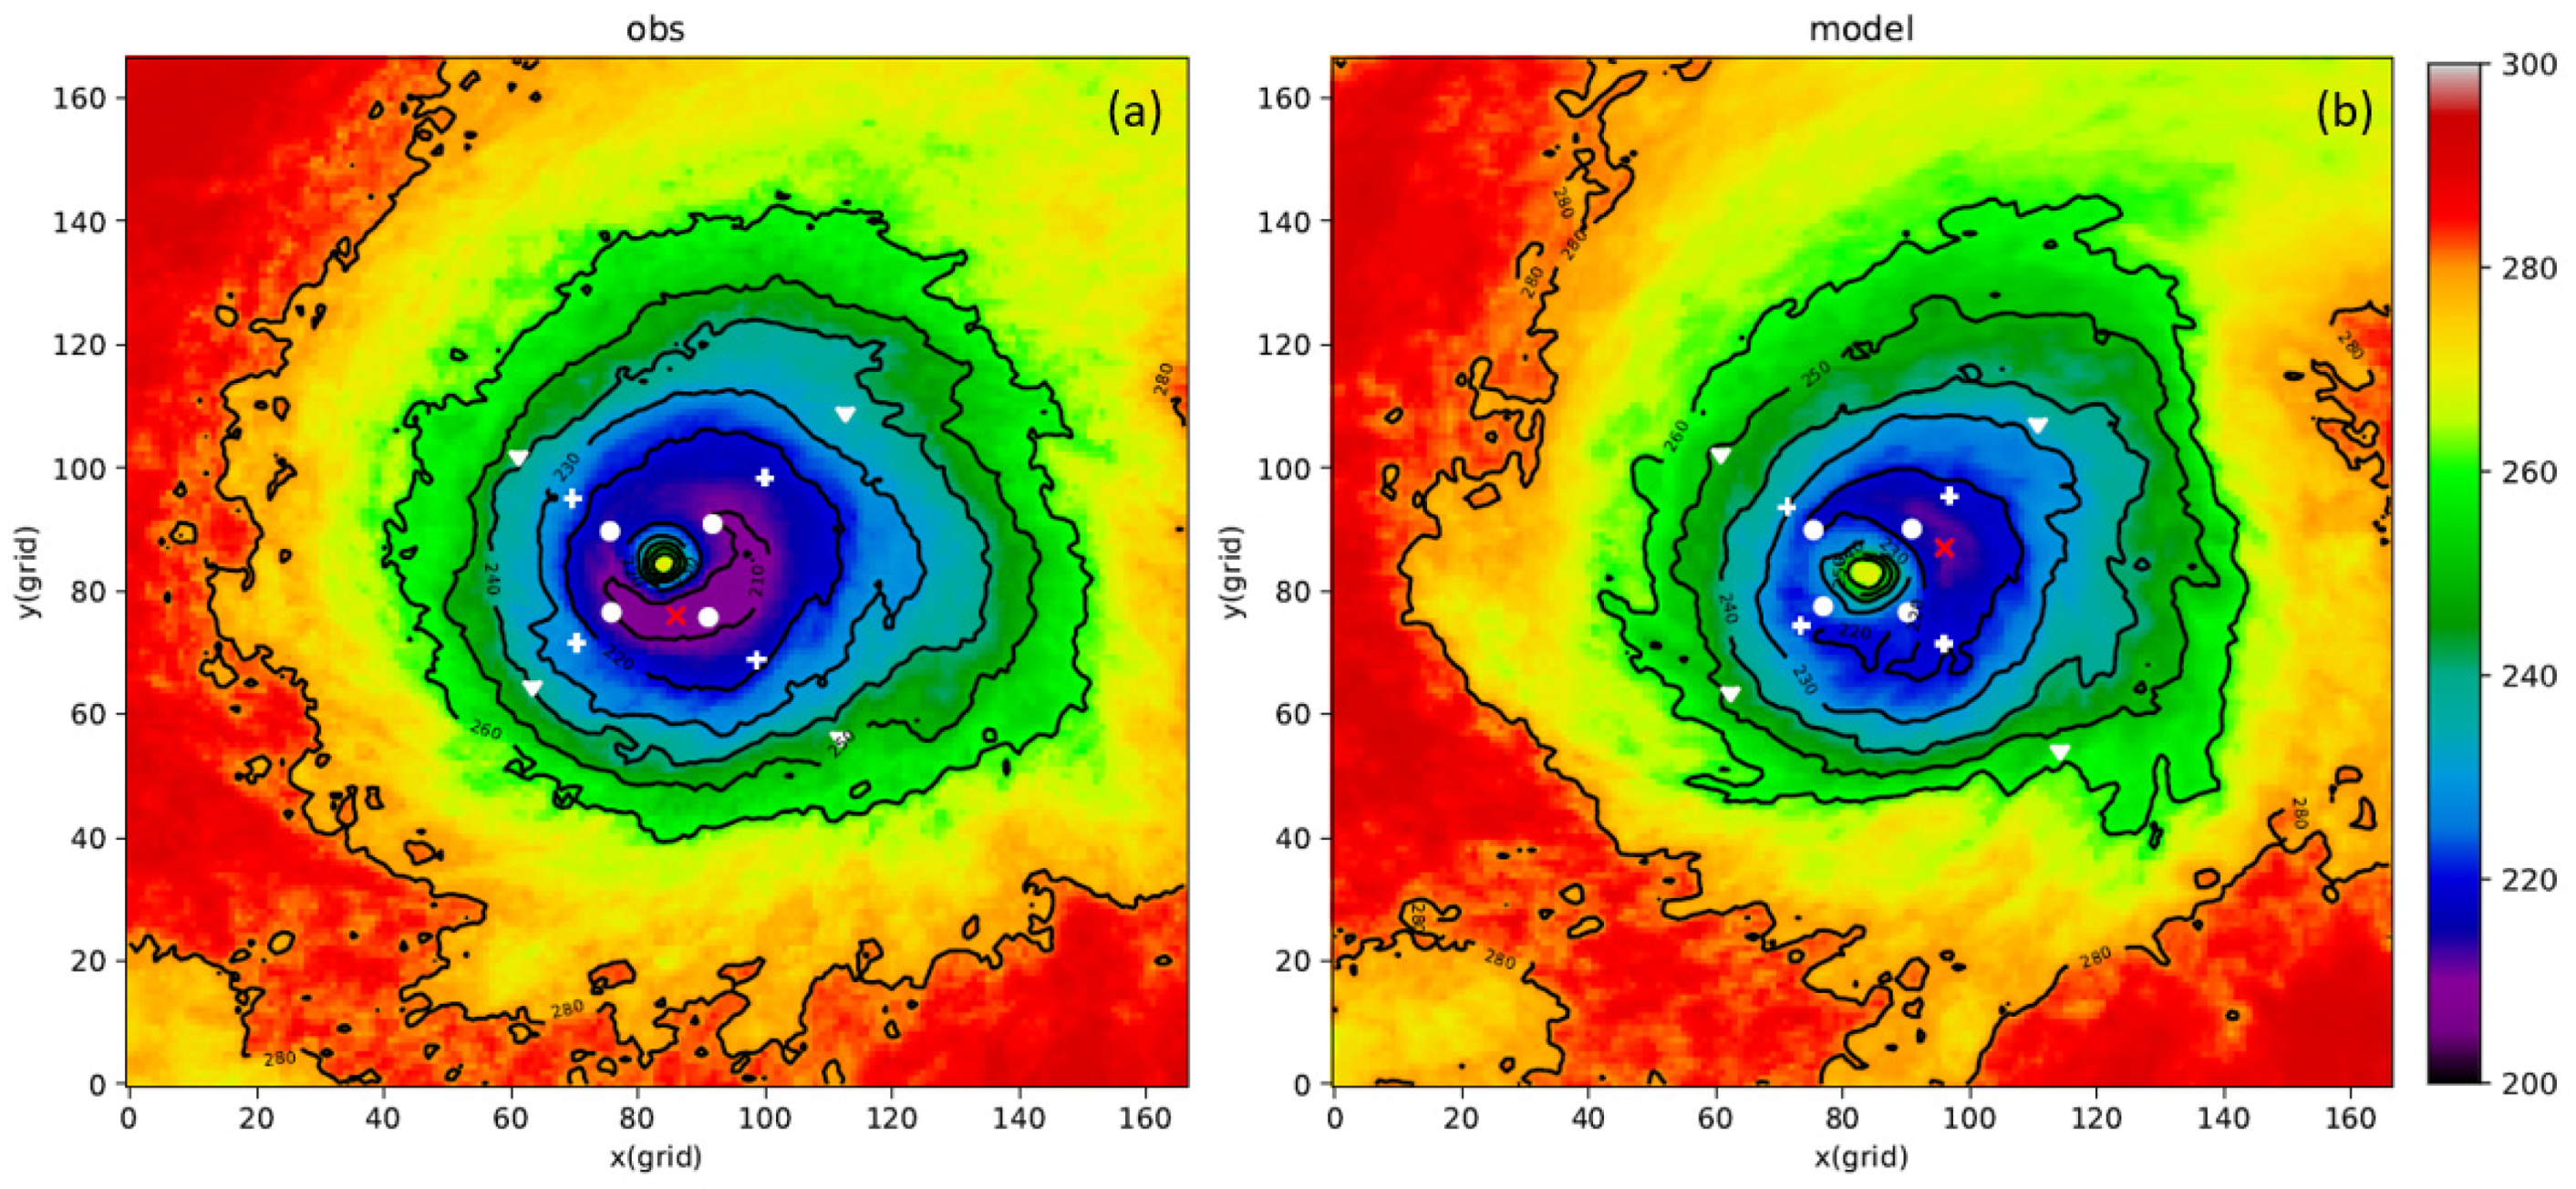
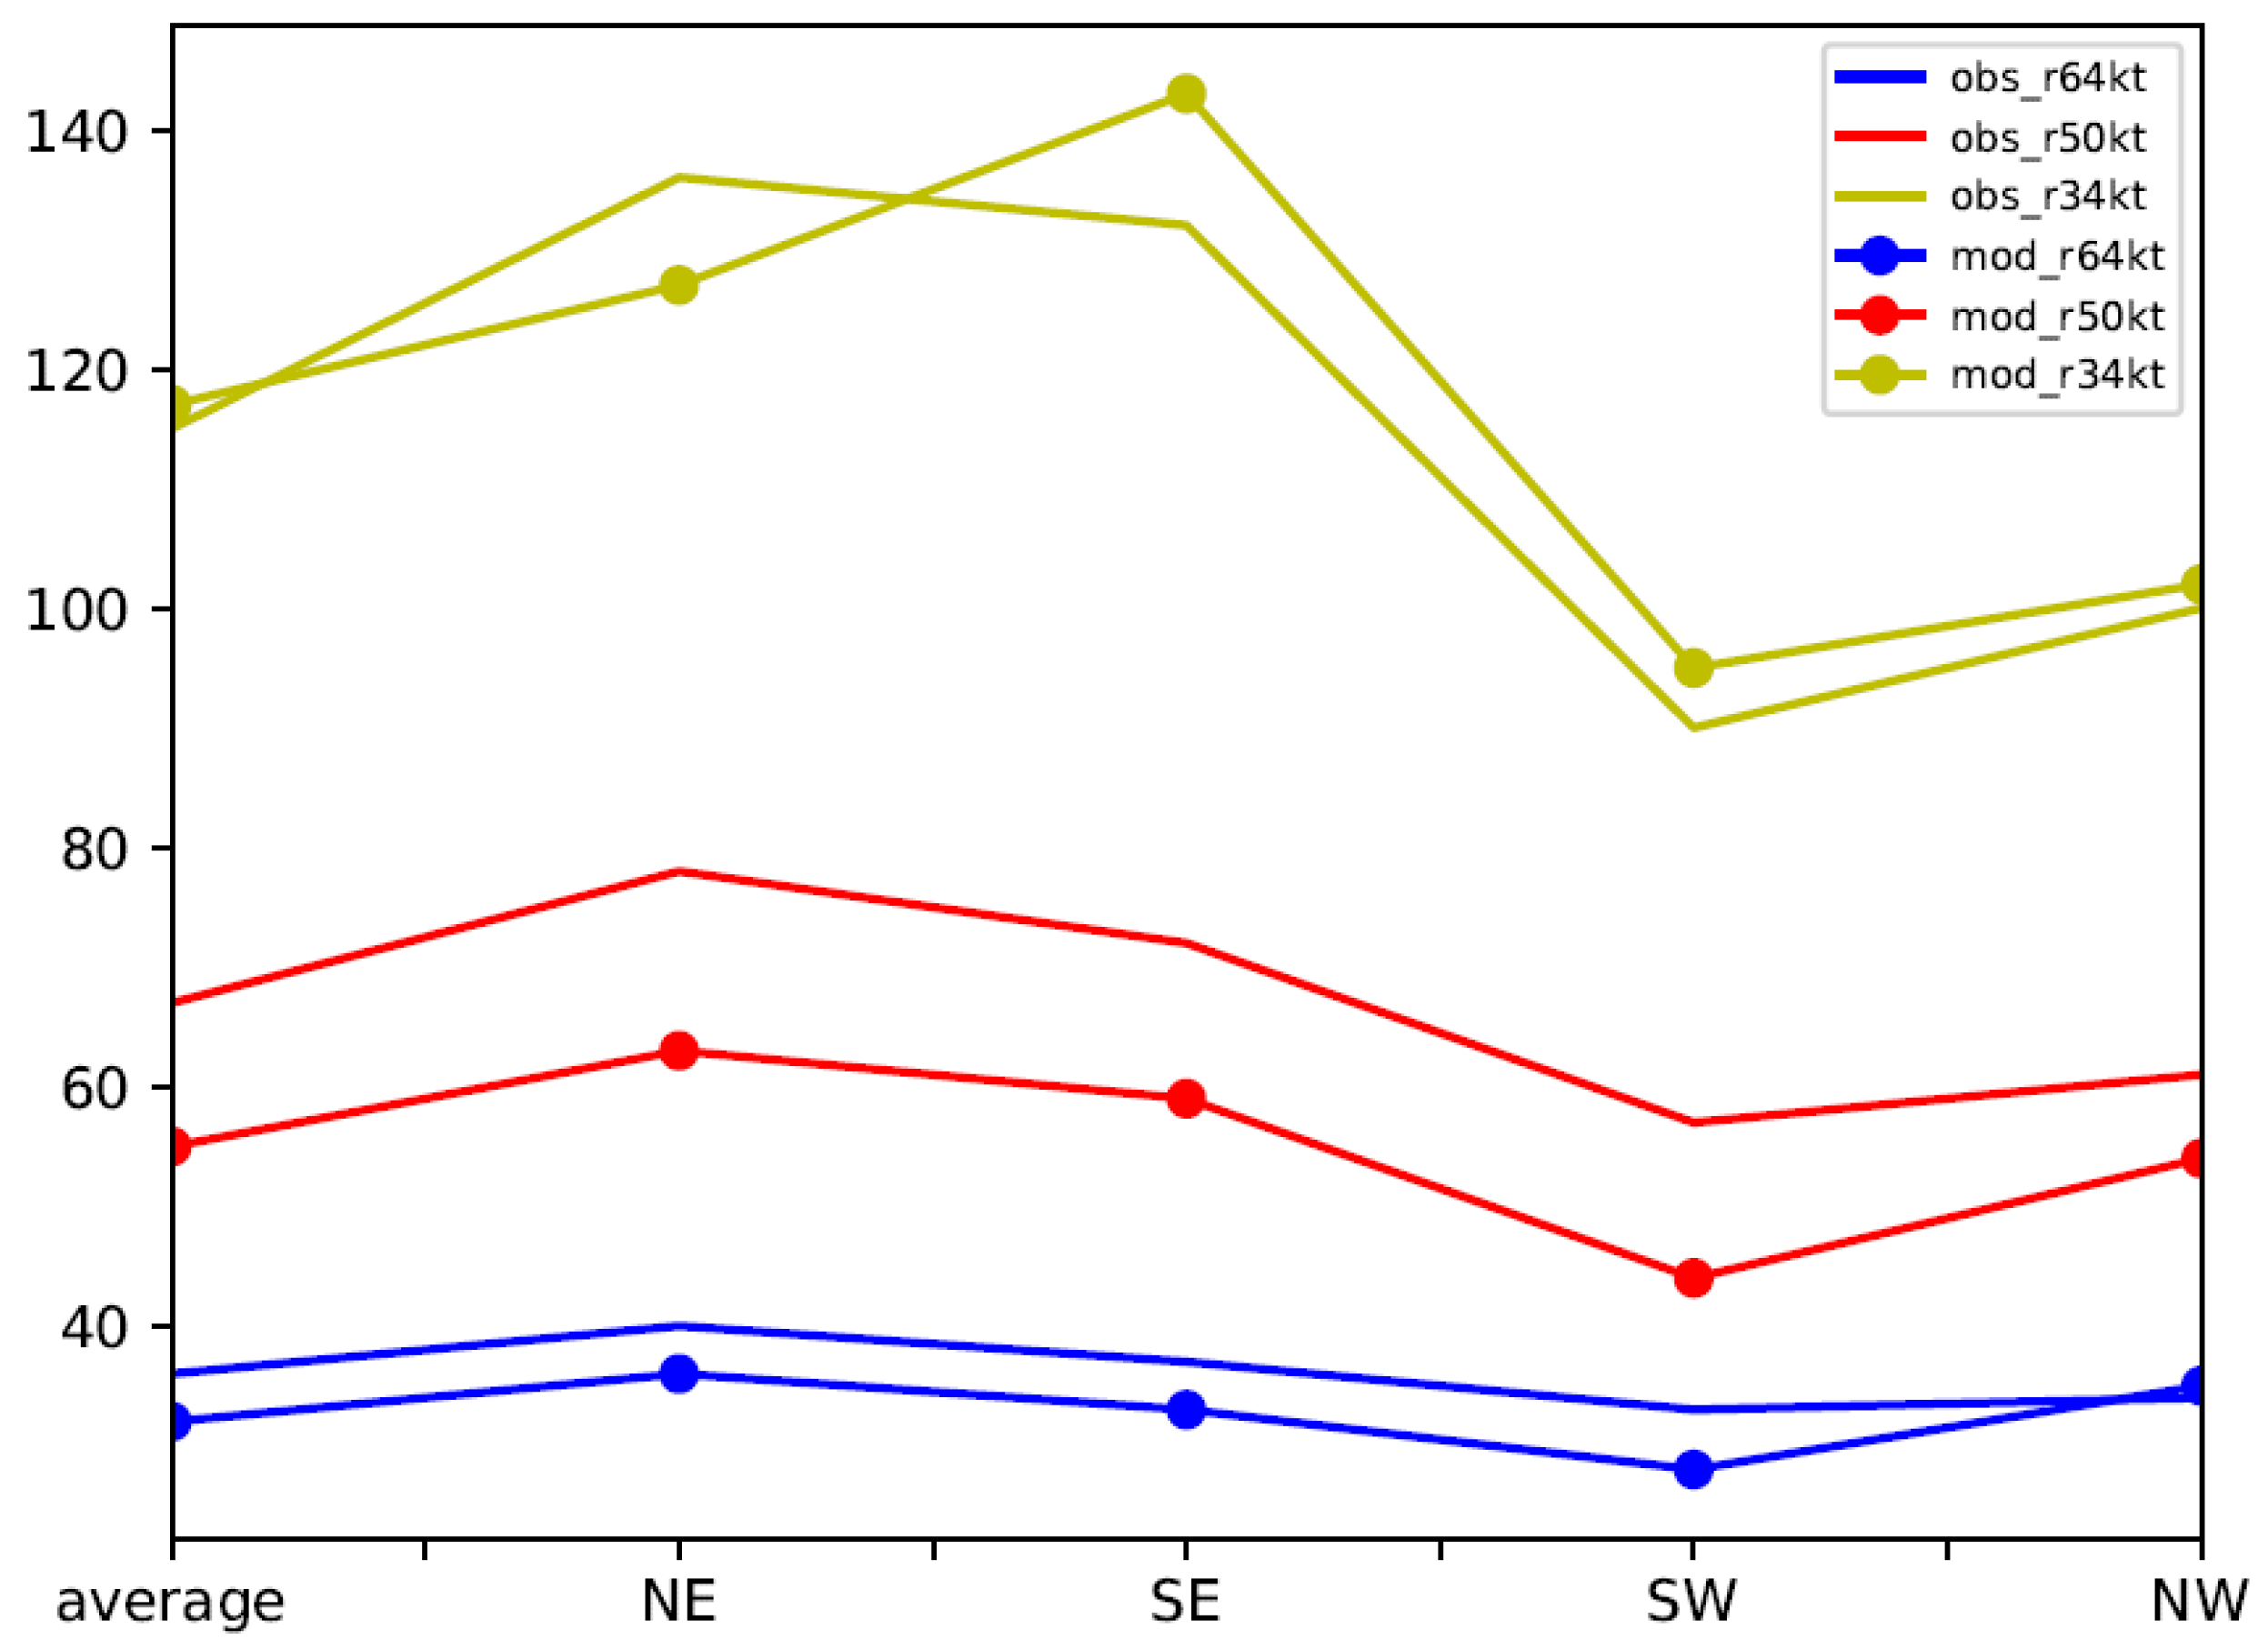
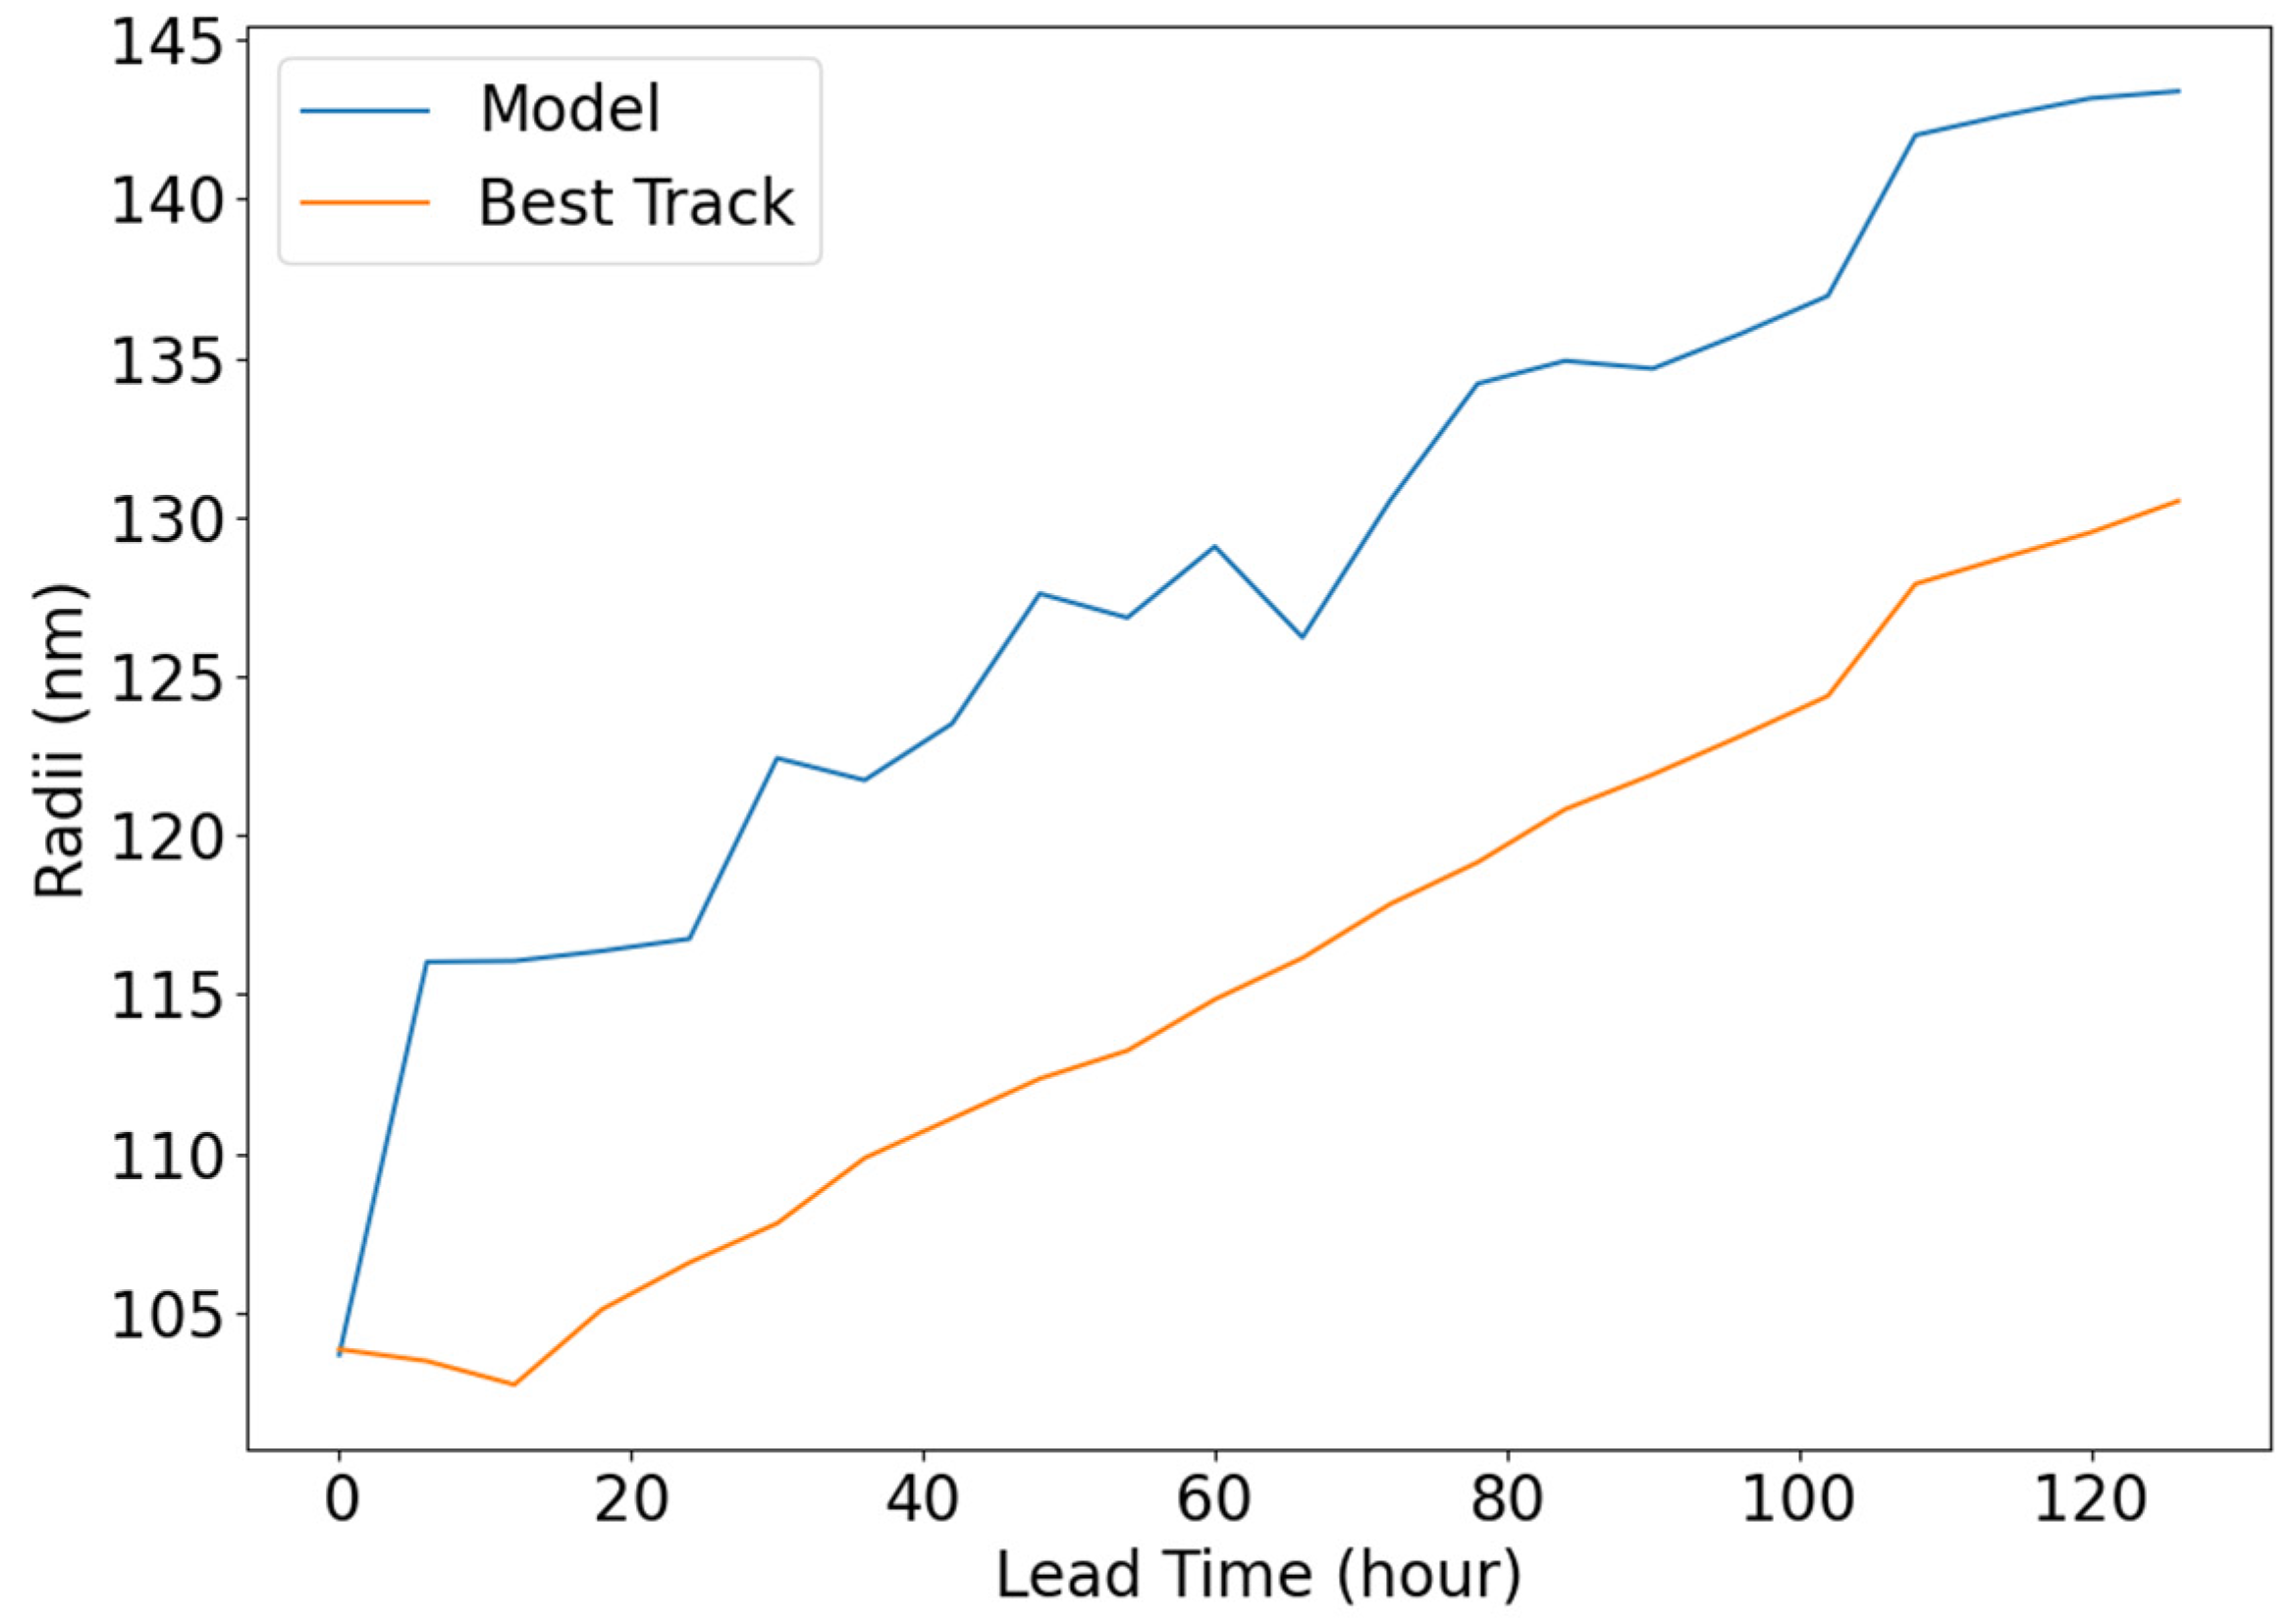
4.2. Size
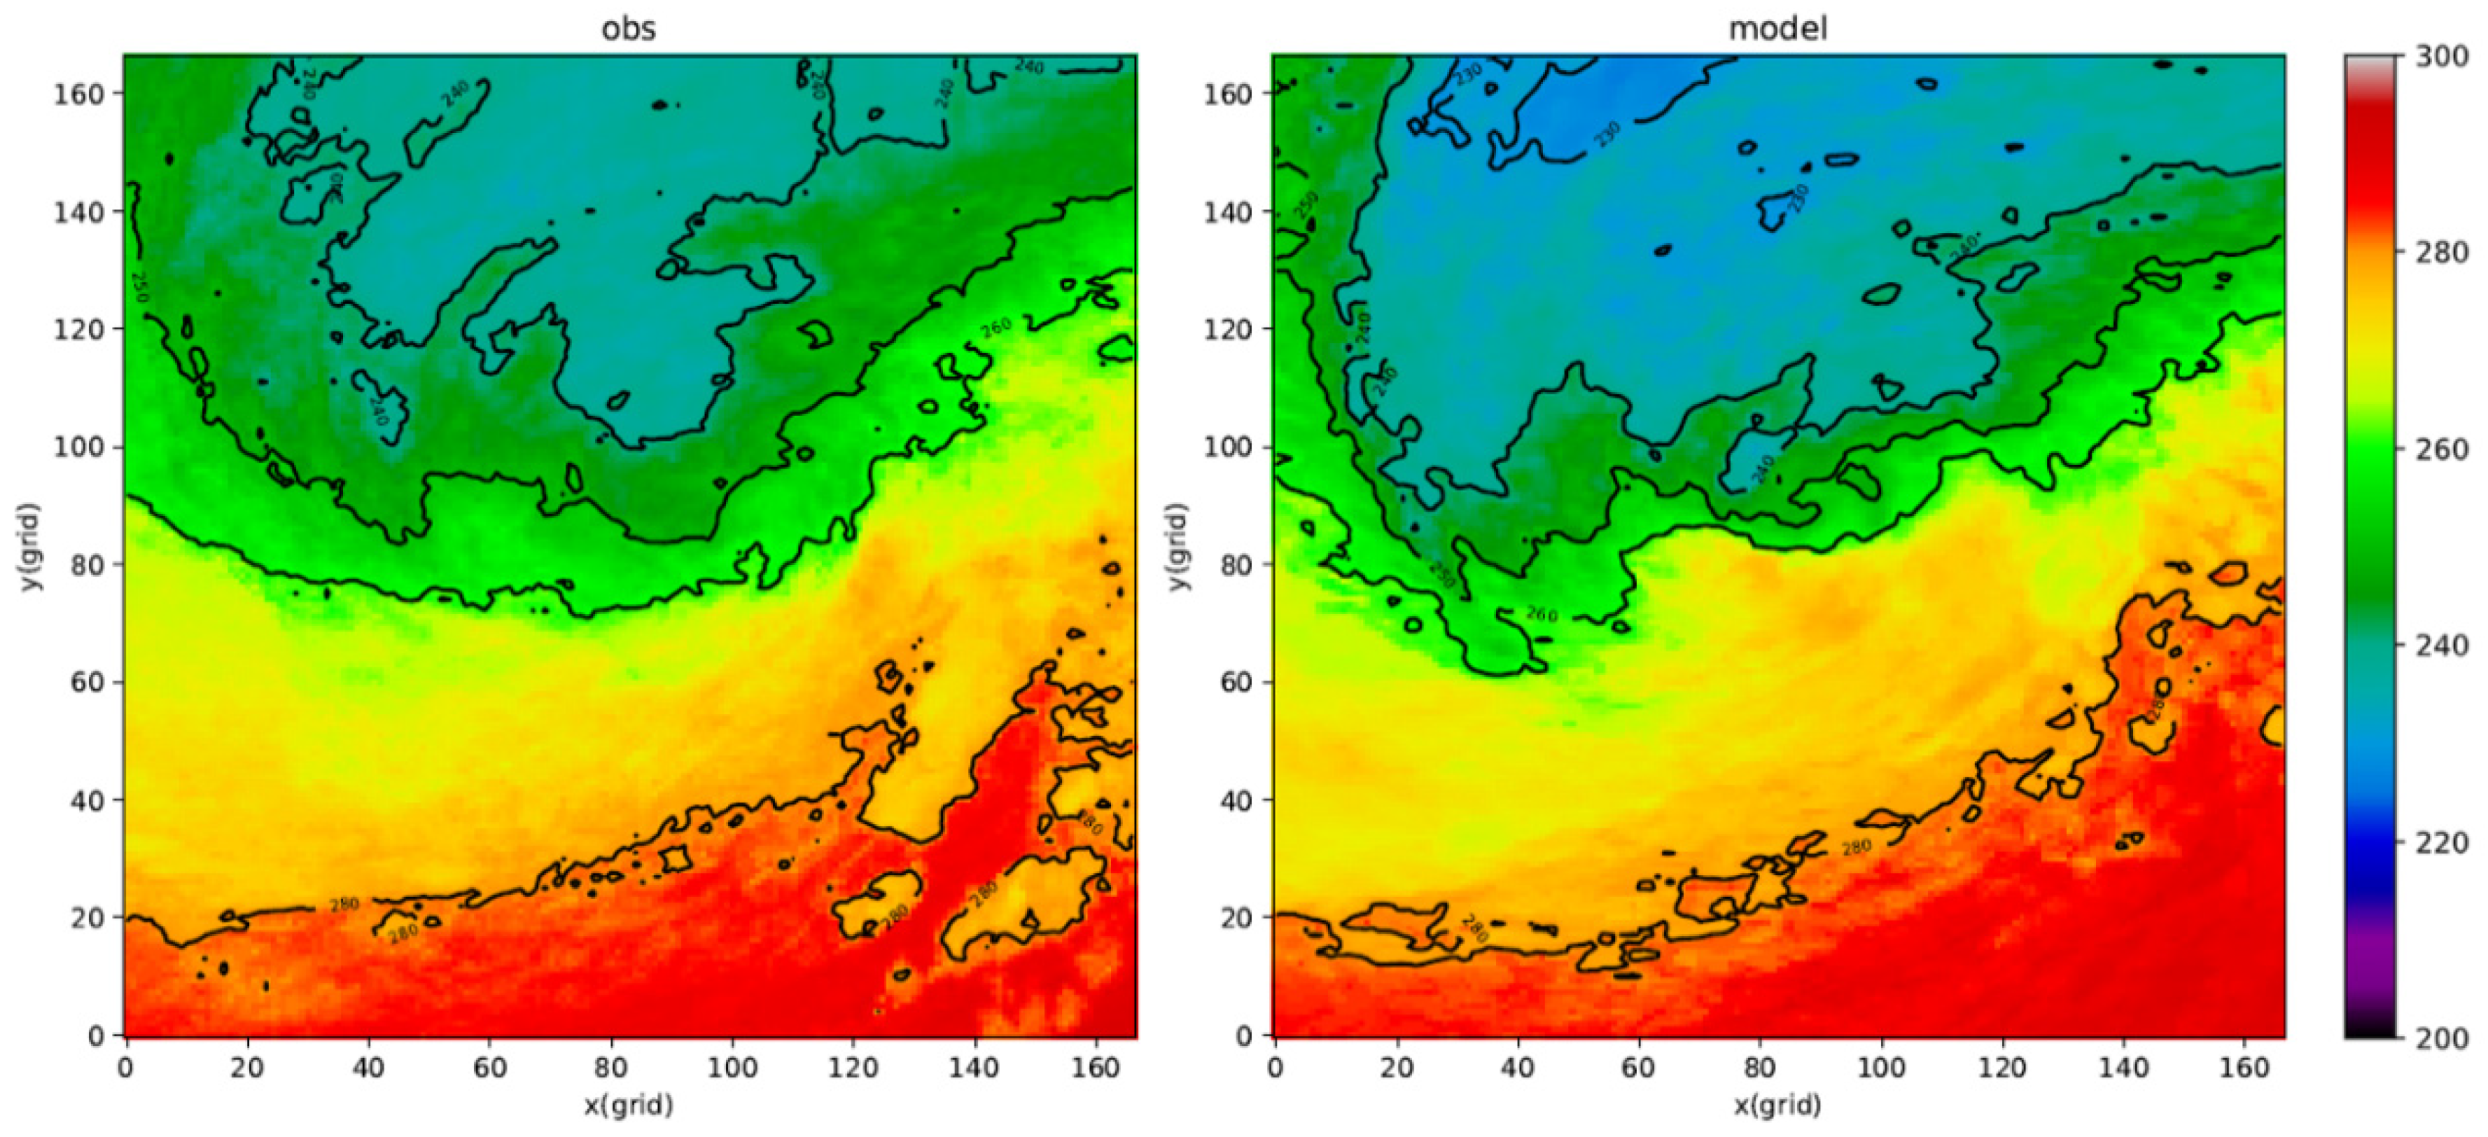
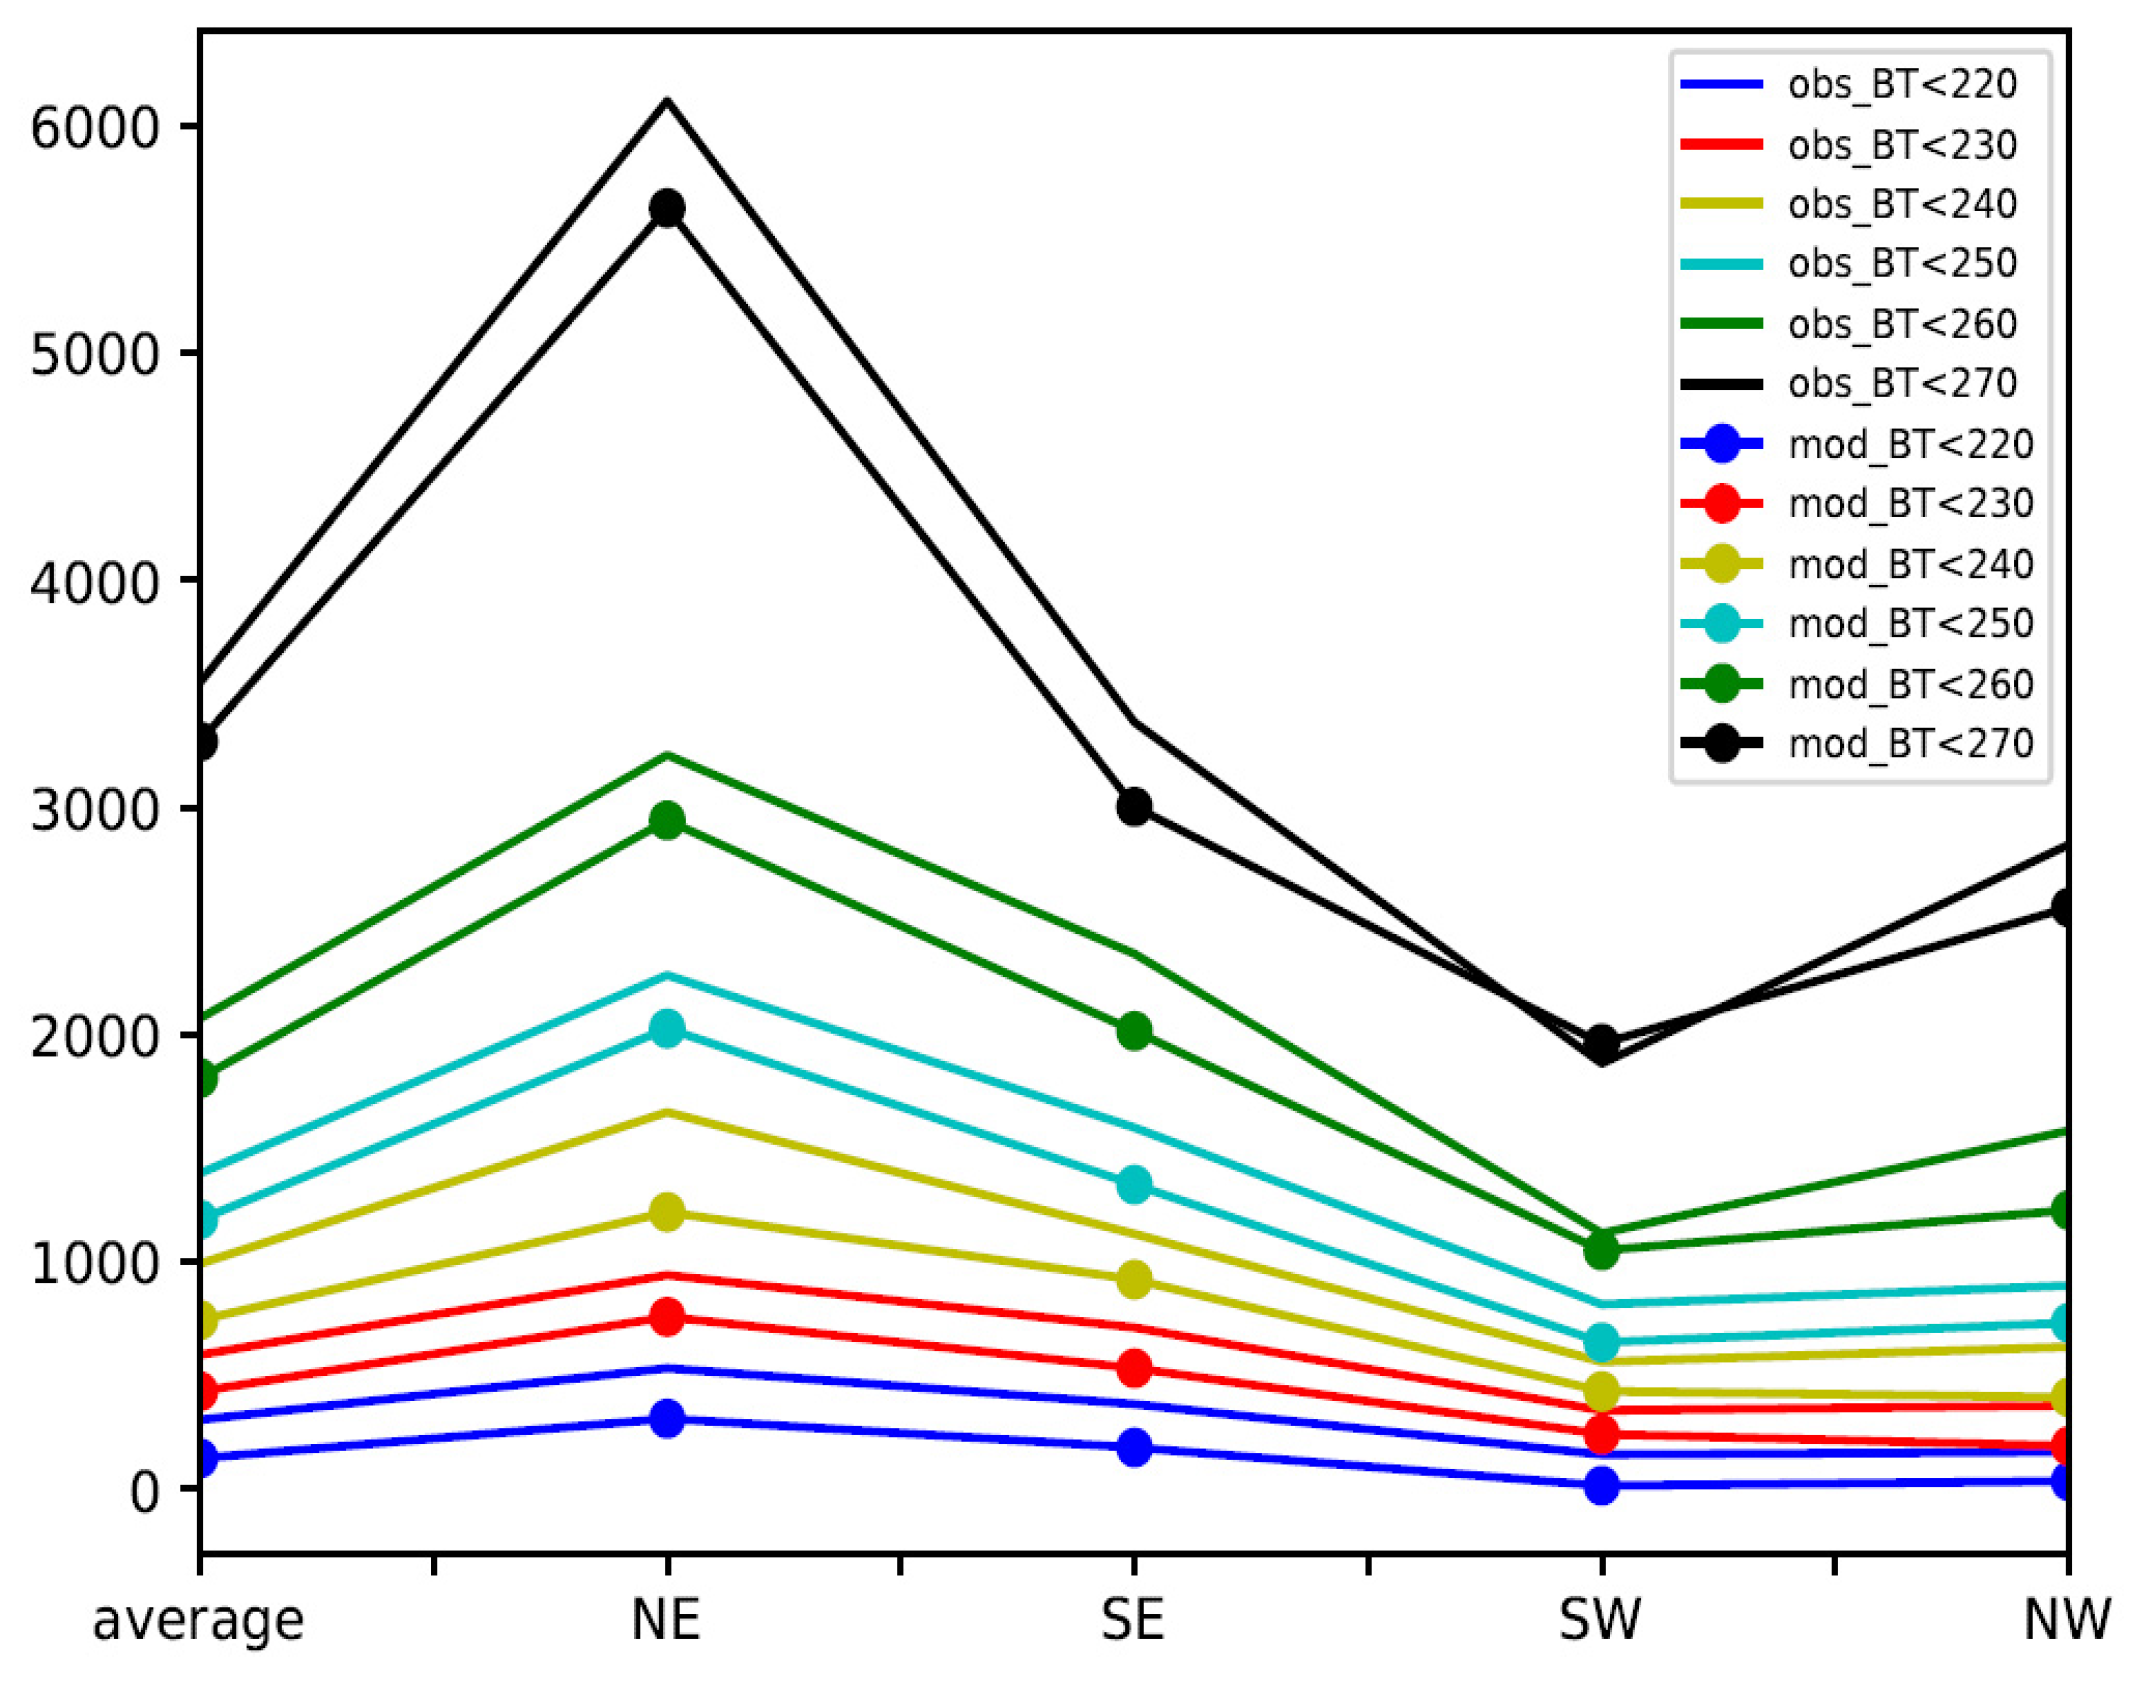
4.3. Asymmetry
5. Conclusions
Author Contributions
Funding
Data Availability Statement
Acknowledgments
Conflicts of Interest
References
- Hazelton, A.; Zhang, Z.; Liu, B.; Dong, J.; Alaka, G.; Wang, W.; Marchok, T.; Mehra, A.; Gopalakrishnan, S.; Zhang, X. 2019 Atlantic Hurricane Forecasts from the Global-Nested Hurricane Analysis and Forecast System: Composite Statistics and Key Events. Weather Forecast. 2021, 36, 519–538. [Google Scholar] [CrossRef]
- Dong, J.; Liu, B.; Zhang, Z.; Wang, W.; Mehra, A.; Hazelton, A.T.; Winterbottom, H.R.; Zhu, L.; Wu, K.; Zhang, C. The Evaluation of Real-Time Hurricane Analysis and Forecast System (HAFS) Stand-Alone Regional (SAR) Model Performance for the 2019 Atlantic Hurricane Season. Atmosphere 2020, 11, 617. [Google Scholar] [CrossRef]
- Bao, S. Use Satellite Infrared Brightness Temperature Data to Evaluate HWRF Ferrier-Aligo Microphysics Scheme. 2018. Available online: https://dtcenter.org/sites/default/files/visitor-projects/dtc-visitor-report-2018-Bao-final.pdf (accessed on 6 January 2022).
- Bao, S.; Bernardet, L.; Thompson, G.; Kalina, E.; Newman, K.; Biswas, M. Impact of the Hydrometeor Vertical Advection Method on HWRF’s Simulated Hurricane Structure. Weather Forecast. 2020, 35, 723–737. [Google Scholar] [CrossRef]
- Cintineo, R.; Otkin, J.A.; Xue, M.; Kong, F. Evaluating the Performance of Planetary Boundary Layer and Cloud Microphysical Parameterization Schemes in Convection-Permitting Ensemble Forecasts Using Synthetic GOES-13 Satellite Observations. Mon. Weather Rev. 2014, 142, 163–182. [Google Scholar] [CrossRef] [Green Version]
- Jin, Y.; Wang, S.; Nachamkin, J.; Doyle, J.D.; Thompson, G.; Grasso, L.; Holt, T.; Moskaitis, J.; Jin, H.; Hodur, R.M.; et al. The Impact of Ice Phase Cloud Parameterizations on Tropical Cyclone Prediction. Mon. Weather Rev. 2014, 142, 606–625. [Google Scholar] [CrossRef] [Green Version]
- Novak, K.; Bao, S. Evaluation of FV3 Model Using Satellite Brightness Temperature Data. AGU Fall Meeting Abstracts. 2019, Volume 2019, p. A21O-2771. Available online: https://ui.adsabs.harvard.edu/abs/2019AGUFM.A21O2771N/abstract (accessed on 6 January 2022).
- Otkin, J.A.; Lewis, W.E.; Lenzen, A.J.; McNoldy, B.D.; Majumdar, S.J. Assessing the Accuracy of the Cloud and Water Vapor Fields in the Hurricane WRF (HWRF) Model Using Satellite Infrared Brightness Temperatures. Mon. Weather Rev. 2017, 145, 2027–2046. [Google Scholar] [CrossRef]
- Han, Y. JCSDA Community Radiative Transfer Model (CRTM): Version 1. 2006. NOAA Technical Report NESDIS (122). Available online: https://repository.library.noaa.gov/view/noaa/1157 (accessed on 6 January 2022).
- Marchok, T. Use of the GFDL Vortex Tracker. WRF Tutor. Hurric. NOAAGFDL 2010, 40. Available online: https://dtcenter.org/sites/default/files/community-code/hwrf/docs/presentations/tutorial2018/16-HWRFtutJan2018_VortexTracker_Marchok.pdf (accessed on 6 January 2022).
- Dvorak, V.F. Tropical Cyclone Intensity Analysis and Forecasting from Satellite Imagery. Mon. Weather Rev. 1975, 103, 420–430. [Google Scholar] [CrossRef]
- Dvorak, V.F. Tropical Cyclone Intensity Analysis Using Satellite Data; US Department of Commerce, National Oceanic and Atmospheric Administration, 1984; Volume 11. Available online: https://repository.library.noaa.gov/view/noaa/19322 (accessed on 6 January 2022).
- DeMaria, M.; Kaplan, J. A Statistical Hurricane Intensity Prediction Scheme (SHIPS) for the Atlantic Basin. Weather Forecast. 1994, 9, 209–220. [Google Scholar] [CrossRef]
- DeMaria, M.; Zehr, R.M.; Kossin, J.P.; Knaff, J.A. The Use of GOES Imagery in Statistical Hurricane Intensity Prediction. In Proceedings of the 25th Conference on Hurricanes and Tropical Meteorology, San Diego, CA, USA, 29 April 2002; Volume 120, p. 121. [Google Scholar]
- Lajoie, F.; Walsh, K. A Technique to Determine the Radius of Maximum Wind of a Tropical Cyclone. Weather Forecast. 2008, 23, 1007–1015. [Google Scholar] [CrossRef]


| BT. | <210 K | <220 K | <230 K | <240 K | <250 K | <260 K | <270 K |
|---|---|---|---|---|---|---|---|
| Model Area | 0 | 543 | 1722 | 2976 | 4745 | 7237 | 13,162 |
| Obs Area | 212 | 1222 | 2367 | 3968 | 5562 | 8291 | 14,196 |
Publisher’s Note: MDPI stays neutral with regard to jurisdictional claims in published maps and institutional affiliations. |
© 2022 by the authors. Licensee MDPI, Basel, Switzerland. This article is an open access article distributed under the terms and conditions of the Creative Commons Attribution (CC BY) license (https://creativecommons.org/licenses/by/4.0/).
Share and Cite
Bao, S.; Zhang, Z.; Kalina, E.; Liu, B. The Use of Composite GOES-R Satellite Imagery to Evaluate a TC Intensity and Vortex Structure Forecast by an FV3GFS-Based Hurricane Forecast Model. Atmosphere 2022, 13, 126. https://doi.org/10.3390/atmos13010126
Bao S, Zhang Z, Kalina E, Liu B. The Use of Composite GOES-R Satellite Imagery to Evaluate a TC Intensity and Vortex Structure Forecast by an FV3GFS-Based Hurricane Forecast Model. Atmosphere. 2022; 13(1):126. https://doi.org/10.3390/atmos13010126
Chicago/Turabian StyleBao, Shaowu, Zhan Zhang, Evan Kalina, and Bin Liu. 2022. "The Use of Composite GOES-R Satellite Imagery to Evaluate a TC Intensity and Vortex Structure Forecast by an FV3GFS-Based Hurricane Forecast Model" Atmosphere 13, no. 1: 126. https://doi.org/10.3390/atmos13010126