Article

Identifying Conifer Tree vs. Deciduous Shrub and Tree Regeneration Trajectories in a Space-for-Time Boreal Peatland Fire Chronosequence Using Multispectral Lidar

by
Humaira Enayetullah
1,*,
Laura Chasmer
1,*,
Christopher Hopkinson
1,
Dan Thompson
2 and
Danielle Cobbaert
3
1
Department of Geography and Environment, University of Lethbridge, 4401 University Drive, Lethbridge, AB T1K 3E3, Canada
2
Canadian Forest Service, Great Lakes Forestry Centre, 1219 Queen Street, Sault Ste. Marie, ON P6A 2E5, Canada
3
Alberta Environment and Parks, 9th Floor, 9888 Jasper Avenue, Edmonton, AB T5J 5C6, Canada
*
Authors to whom correspondence should be addressed.
Atmosphere 2022, 13(1), 112; https://doi.org/10.3390/atmos13010112
Submission received: 28 November 2021 / Revised: 7 January 2022 / Accepted: 9 January 2022 / Published: 11 January 2022
(This article belongs to the Special Issue Climate-Vegetation Interactions in Northern High Latitudes)

Abstract

:
Wildland fires and anthropogenic disturbances can cause changes in vegetation species composition and structure in boreal peatlands. These could potentially alter regeneration trajectories following severe fire or through cumulative impacts of climate-mediated drying, fire, and/or anthropogenic disturbance. We used lidar-derived point cloud metrics, and site-specific locational attributes to assess trajectories of post-disturbance vegetation regeneration in boreal peatlands south of Fort McMurray, Alberta, Canada using a space-for-time-chronosequence. The objectives were to (a) develop methods to identify conifer trees vs. deciduous shrubs and trees using multi-spectral lidar data, (b) quantify the proportional coverage of shrubs and trees to determine environmental conditions driving shrub regeneration, and (c) determine the spatial variations in shrub and tree heights as an indicator of cumulative growth since the fire. The results show that the use of lidar-derived structural metrics predicted areas of deciduous shrub establishment (92% accuracy) and classification of deciduous and conifer trees (71% accuracy). Burned bogs and fens were more prone to shrub regeneration up to and including 38 years after the fire. The transition from deciduous to conifer trees occurred approximately 30 years post-fire. These results improve the understanding of environmental conditions that are sensitive to disturbance and impacts of disturbance on northern peatlands within a changing climate.

1. Introduction

Peatlands constitute 12% of Canada’s landscape and are characterized by the slow decomposition of soil organic matter (i.e., peat), having a minimum depth of 40 cm [1,2]. They play a globally important role as climate regulators due to the gradual sequestration and storage of atmospheric carbon dioxide (CO2) over centuries and their ability to mediate greenhouse gas fluxes [3]. It is estimated that northern peatlands store 10 to 16% of terrestrial detrital carbon, with significant amounts found within the Boreal and Subarctic zones of Canada [2].
Wildland fires are currently one of the major disturbances impacting northern peatlands [4]. It is estimated that fires from 2006 to 2015 burned approximately 200,000 hectares annually in Alberta [5], releasing large amounts of CO2 and a broad range of pollutants into the atmosphere [6]. In response to the increasing fire frequency, shifts in forests from mixedwood and conifer to deciduous tree and shrub species have been observed in parts of the Arctic-Boreal region [7,8]. Moreover, permafrost plateaus in northern Canada, dominated by black spruce trees, may transition into treeless bogs and fens as a result of the changing climate [9]. In the future, climate models predict a warmer, drier climate with increased fire severity. This is important for the sensitivity of peatland succession in the next few decades. Peatlands in the Boreal Plains ecozone of Alberta, for example, exist within a sub-humid climate where evapotranspiration exceeds precipitation during most years [10]. Some boreal peatland complexes in western Canada may be close to reaching their hydroclimatic moisture limit due to changes in hydrology [2,11]. As a result of climatic drying, peatlands are also becoming more susceptible to wildland fires as their deep soil carbon stores transition from moist organic matter to drier fuels for fire [11,12,13]. Enhanced drying could also predispose these ecosystems to more shrubby and more flammable fuel types, observed in [13] and reviewed in [14]. The potential for wildland fire in peatlands is also exacerbated by the lengthening of the fire season combined with increased fuel availability, enhancing both the area burned by wildland fire [13] and the depth of the burn [15]. The combined impacts of drying on successional trajectories, including peatland shrubification and more severe fires could result in a decline in boreal species such as black spruce, and a possible transition to younger deciduous species. Such transitions in peatland vascular tree/shrub species may have significant implications for the climate–carbon system by altering carbon dynamics across broad peatland-forest complexes [16,17].
In addition to wildfire and a changing climate, peatlands in Alberta’s oil sands region are also affected by human development such as draining for resource extraction, including peat harvesting, oil and gas exploration and mining, and other land disturbances [18,19]. The oil sands and natural gas sectors contributed $105 billion to the Canadian economy in 2020 [20] but their development is associated with substantial forest loss and fragmentation due to mining, roads, well pads, exploratory seismic lines, and infrastructure [21].
There is a lack of understanding of how peatland ecosystems recover from wildfires during recent decades of climate warming and anthropogenic disturbances. Ecosystem responses to stressors can take many years to become evident, and it is difficult to characterize cumulative effects due to a lack of baseline data. Shifts in vegetation species, age, and structure are especially difficult to quantify across large and often remote areas of boreal peatlands and forests using field measurements. Remote sensing provides an opportunity to quantify the impacts of disturbances on peatlands across larger, spatially continuous areas and a greater number of peatlands for which many environmental characteristics, peatland attributes, and proximal influences can be examined. Remotely sensed data can also be examined across ‘space-for-time’ chronosequence which captures differences in structure and productivity with years since disturbance or fire (e.g., [22]). Lidar data (terrestrial, airborne, spaceborne) can be used to quantify structural attributes, such as vegetation height, canopy cover, understory, etc., because of the ranging nature of the technology and the rapidity with which laser pulses are emitted, reflected, and recorded [23,24]. Moreover, several studies have used lidar technologies for quantifying vegetation structures in peatlands (e.g., [25,26]). In peatlands, conifer and deciduous vegetation may be differentiated within lidar data based on differences in radiation scattering of leaves vs. needles, along with typically round (deciduous) vs. conical (conifer) shapes, and the vertical distribution of foliage within the canopy [27,28,29]. Based on the distribution characteristics of return intensity between species, these characteristics may be used to distinguish between conifer and deciduous, and potentially, different species within these [27,29,30].
In this study, we used airborne multi-spectral lidar to classify the proportion of conifer tree vs. deciduous shrub and tree species within peatlands using a supervised machine learning approach. The goal of this study was to quantify spatial and temporal variations in conifer vs. deciduous shrub/tree communities following wildfire using a space-for-time-fire chronosequence of 5, 18, 30, and 38 years post-fire. The objectives of this research were to (a) determine the utility of multi-spectral lidar for identifying deciduous vs. conifer trees, shrubs, and herbaceous ground cover species; (b) quantify proportional coverage of post-fire shrub vs. tree regeneration within peatlands; and (c) determine the approximate timing of dominance of shrub vs. tree species determined from growth rate within the fire chronosequence.

2. Materials and Methods
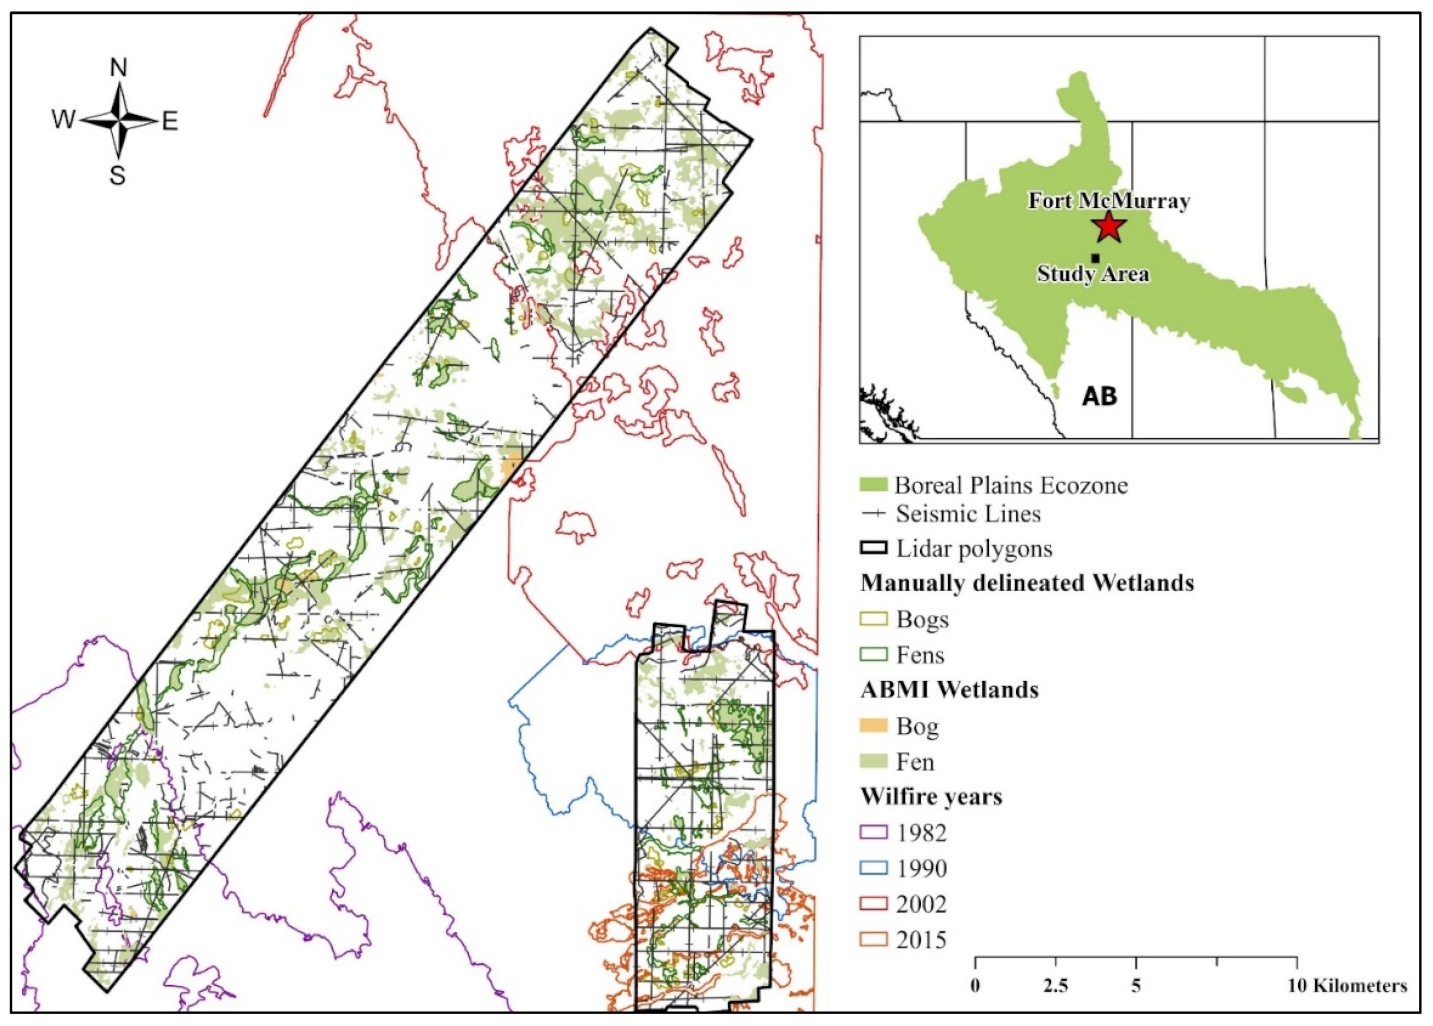
2.1. Study Area

The study was conducted ~230 km south of Fort McMurray near Wandering River, Alberta (112°12′31″ W, 55°37′46″ N) and is a part of the Central Mixedwood subregion of the Boreal Plains ecozone (Figure 1). The climate of this region is sub-humid and includes strong seasonal variations with short, warm summers and long, cold winters [31]. Air temperature and precipitation decrease throughout the subregion along a northward latitudinal gradient [32]; however, this spatial reduction in moisture is not found within the small area examined here. Field data were collected in August 2020, which was one of the wettest years over the last 100 years, with cumulative precipitation of 308 mm in the Wandering River in July 2020 [33].
Vegetation in the region consists of deciduous tree species including, but not limited to, Populus tremuloides Michx (trembling aspen), Populus balsamifera Lyall (balsam poplar), and Betula papyrifera Marshall (paper birch). Coniferous tree species include Picea mariana Kuntze, and P. glauca (Moench) Voss (black and white spruce), and Pinus banksiana Lamb. (jack pine). Shrub species include Prunus virginiana L. (chokecherry), Alnus crispa Pursh (green alder), Amelanchier alnifolia Nutt (Saskatoon berry) and Symphoricarpos albus K. Koch (snowberry), with a variety of herbaceous and moss species. More than 50% of the area was dominated by poorly drained fens and bogs [32] with treed peatlands containing mostly black spruce. Peatland shrub species include, but are not limited to, Ledum groenlandicum Oeder (Labrador tea), Betula pumila L. (bog birch), and Salix spp. L. (willow species). The surficial geology consists of mostly glacial moraines, stagnant ice moraines, and glaciofluvial deposits [34].
The study areas have a low density of seismic lines, 1.59 km/km2 [35], and were burned by fires in 1982, 1990, 2002, and 2015 (Figure 1). The older fires in 1982 and 1990 burned 36,996 and 9451 hectares, respectively [36], while fires in 2002 and 2015 burned more than 236,662 and 9883 hectares, respectively, and include some unburned islands and partially burned areas.

2.2. Field Data Collection

For validation purposes, shrub and tree heights and species were measured along four transects (three unburned and one burned). The selection of species along seismic lines was used so that laser pulse interactions with the tall trees could be minimized and the plots were homogenous. Species measurements were collected at approximately 4 m intervals along the center of each seismic line and were geographically located using a Garmin Montana 650 handheld GPS (n = 202). The Garmin Montana was a Wide Area Augmentation System (WAAS) enabled with a positional accuracy between 0.4 and 1.0 m [37]. Areas adjacent to seismic lines were dominated by black spruce, Labrador tea, and Sphagnum moss species (Figure 2).

2.3. Lidar Data Collection

The fire chronosequence and an older, unburned (in recent history) reference area between burn scars was surveyed on 2 August 2020, by the University of Lethbridge ARTeMiS Lab using the Titan multi-spectral airborne lidar system (Teledyne Optech Inc., Toronto, ON, Canada). The Titan scanner has three channels (C1, C2, and C3) with laser pulse emission wavelengths of 1550 nm (shortwave infrared, C1), 1064 nm (near infrared, C2), and 532 nm (green, C3), respectively [30]. Survey characteristics included a mean flight altitude of 1000 m above the ground surface and pulse repetition frequencies (PRF) of 100 KHz per wavelength. The survey covered an area of 220 km2 with a lateral strip overlap of 50% and an average point density of 6.2 points per square meter.

2.4. Supplementary Geospatial Data

In addition to the lidar surveyed areas, we also used additional geospatial layers, including the Human Footprint Inventory for the Oil Sands Monitoring Region circa 2019 [35]. The Human Footprint Inventory (herein, HFI) includes classified seismic lines and other linear disturbances such as pipelines and roads. Peatlands were expertly identified and manually delineated into bogs and fens using the lidar-derived digital elevation model (DEM), Landsat data (pre-2002 to determine pre-fire peatland characteristics for some polygons), and high spatial-resolution World Imagery available through ArcGIS Pro (ESRI, Toronto, ON, Canada), acquired during approximately maximum foliage cover collected within the last 3–5 years. The DEM was used to identify the lagg found at the transition between bogs and forest, thereby enhancing identification accuracy compared with fens. Peatlands were divided into the following categories for comparative analysis: burned + seismic line fen; burned + seismic line bog; seismic line only fen; seismic line only bog; reference bog; reference fen. A total of 76 bogs (21 unburned, 42 burned, and 13 reference) and 79 fens (22 unburned, 43 burned, and 14 reference) were delineated throughout the two-study area lidar polygons containing the burn chronosequences and unburned areas between them (Figure 1).
Shrub and tree locations (n = 4000 in total, n = 800 per each fire chronosequence and unburned area) were manually delineated throughout two study areas within classified peatlands, transition areas, and uplands using (a) high resolution imagery (30 cm pixel resolution) and (b) the lidar derived 99th percentile (2 m resolution) of vegetation heights, subdivided into the following categories: deciduous shrubs (0.5–3 m), deciduous trees (>3 m), and conifer trees (>3 m). All vegetation with heights greater than 3 m were classified as a “tree”, as defined by the Alberta Wetland Classification System [38]. Manually identified conifer/deciduous trees vs. deciduous shrubs were identified in areas that were more than 100 m from seismic lines to reduce the potential for anthropogenic impacts on vegetation establishment [39,40]. Seismic lines in the study area were determined using the HFI layer [35] for the Oil Sands Monitoring Region.

2.5. Data Analysis

2.5.1. Derivation of Geospatial Layers from Lidar

Lidar point cloud processing and raster analyses were carried out using TerraScan (TerraSolid, Espoo, Finland), LAStools (RapidLasso, Gilching, Germany) and ArcGIS Pro (ESRI, Toronto, ON, Canada). Lidar data returns were classified into ground and non-ground returns using the last of many echoes and only echoes in TerraScan. A DEM was generated at 2 m resolution using triangulation with linear interpolation in LAStools. The DEM was also used to calculate Topographic Position Index (TPI), indicating low lying areas and hills in the landscape. TPI was optimized and calculated using a circular search radius of 50 m to capture generalized variations in topography exceeding microtopographic variability. The DEM was also resampled to 5 m cell resolution to calculate the local average slope and aspect, similarly, characterizing the more generalized variations in microtopography, but not at the hillslope level. Numerous vegetation structural metrics were calculated based on the distribution of the point cloud, including percent cover, interquartile range, and maximum height within 2 m resolution cells, along with average laser pulse return intensity. All structural metrics were generated using all returns from all three channels with a height cutoff of >0.5 m above the ground surface (to ignore groundcover), while intensity metrics were derived using all returns from C1 and C2 only (described in Table 1). In addition to these, the Normalized Difference InfraRed index (NDIR) was calculated using C1 and C2 average intensities and was used along with other layers as explanatory rasters to predict areas of conifer or deciduous post-fire regeneration. The NDIR was used to provide a measure of vegetation moisture conditions [41].

2.5.2. Extracting Lidar Derived Metrics to Field Data

Lidar-derived vegetation and topographic structural and intensity metrics were extracted for field locations to identify deciduous and conifer tree species, ignoring the ground cover, using 44 out of the 202 homogenous field points with lidar returns (the remainder were removed due to a mixture of vegetation species). Lidar-derived percent cover, interquartile range, and NDIR were extracted for each species and compared at 2 m grid resolution. Moreover, average C1 (1550 nm) and C2 (1064 nm) lidar return intensities were examined to identify any differences in return intensity between species (associated with foliage scattering properties).

2.5.3. Random Forest

Forest-based classification and regression were performed in ArcGIS Pro (Version 2.7) following the original methods described in [42]. Random forest is based on a supervised machine learning algorithm that creates multiple decision trees used to create, in this case, a prediction raster of conifer vs. deciduous distribution based on structural and intensity metrics (Table 1). Random forest was used because it is non-parametric and does not rely on the user to have a priori knowledge of the ecological drivers or characteristics of the prediction/classification outputs [43,44]. Since the prediction of areas of conifer vs. deciduous regeneration was categorical, the model was based on classification trees. The model was first trained using 100, 500, 1500, and 2500 trees including 70% of the data that were manually delineated as shrubs vs. trees (n = 800 per each fire chronosequence) for training and 30% for validation. The default number of trees for the forest-based regression in ArcGIS Pro is 500; however, increasing the number of trees typically improves model accuracy [45,46]. In this study, 1500 trees were used after iterating from 100 to 2500 trees, identified by determining the threshold of the maximum accuracy, such that the maximum accuracy shows little improvement after 1500 trees. The number of features that was randomly selected for each tree was three.
In addition to these, the structural metrics of height and intensity metrics from 1550 nm and 1064 nm laser wavelengths were used as descriptors of conifer vs. deciduous along with environmental drivers of slope, aspect, and topographic position index (TPI), which were used as explanatory variables in the classification (Table 1). The model was first trained using all variables listed in Table 1. To reduce autocorrelation and model over-parameterization, explanatory rasters were decreased to the greatest explanatory power using the most important six variables described in Table 1. Variable importance was calculated based on the Gini coefficient, which was used to eliminate variables with lower importance to create a small subset of important variables that predicted most of the variability in the data. These were used for the final classification [43]. After training, the model was used to create a prediction raster that classified areas of deciduous shrubs, deciduous trees, and conifers in the study areas. The model reported a sensitivity and accuracy value for each category, which were used to assess model performance. Sensitivity measured the number of times the observed category was correctly predicted, and the diagnosis was calculated using a confusion matrix [46].
Using the results of random forest classification, the proportional cover of shrubs and trees in peatlands was calculated by dividing the classified pixel area by the total peatland area. Pixels within 25 m of seismic lines were not included in the proportional cover of shrubs and trees to reduce the proximal effect of seismic lines on peatlands according to the results of [39]. The cumulative vegetation growth since the fire was calculated by averaging the 99th percentile of vegetation height per cell and resampling this to 5 m using the bilinear method in ArcGIS Pro to reduce noise in the vertical data and normalize change across a larger area, resulting in a more generalized height metric. Post-fire standing dead trees/snags were removed by thresholding based on height as these can indicate tall, non-living vegetation in lidar data that are confused with living vegetation. Vegetation greater than 3 m were removed from the 5-year chronosequence, assuming that these were burned stems [22,47,48]. Similar stems were not observed in the older chronosequence sites.

2.5.4. Statistical Analysis

Statistical analyses and comparisons between the post-fire chronosequence datasets were performed in SPSS Version 26 (SPSS Inc., Chicago, IL, USA). Field data were used to identify species differences in vegetation structure and intensity observed using lidar data, within 1 × 1 m areas that had low to no species mixture >0.5 m. The field data were not normally distributed and were compared using the Kruskal–Wallis test. Manually delineated shrub and tree locations/classified information were used to determine the prediction/validation layers within the forest-based regressions, applied separately to each burn area and recently unburned peatlands. A Pearson’s correlation matrix of the lidar data derivatives was used to identify and remove correlating variables with correlations greater than 60%. For example, average height (Pearson’s correlation > 0.96) and standard deviation of height (Pearson’s correlation > 0.86) were highly correlated with maximum height and were removed from the final model. Moreover, maximum height and interquartile range (IQR, which is the difference between the 25th and the 75th percentiles in the lidar point cloud distribution) had a Pearson’s correlation = 0.67. Thus, maximum height was not included in the final model. Six variables were identified based on importance (Table 1) to reduce model overfitting. The lidar derived variables were tested for normality using the Kolmogorov–Smirnov and Shapiro–Wilk tests, indicating that data were non-parametric. The difference between proportional cover of deciduous shrubs, deciduous trees, and conifer trees in each post-fire year and mean post-fire vegetation height were not normally distributed and compared using Kruskal–Wallis one way ANOVA. The research methodology used is shown in Figure 3.

3. Results

3.1. Differences in Classified Conifer and Deciduous Trees/Shrubs Using Lidar Metrics

Field measurements indicate differences in vegetation structure also observed in lidar data. We found that some deciduous species such as alder and aspen were taller, had greater percent foliage cover, and greater variability in the range of IQR, indicating differences in the distribution of laser returns across the broadest part of the canopy envelope (Figure 4). Moreover, the IQR of height and percent cover of foliage were significantly different between black spruce and alder (p < 0.05) and black spruce and aspen (p < 0.05). This illustrates a broad distribution of returns within deciduous canopies, compared with early regeneration black spruce, which had a narrower distribution of returns within the canopy. In comparison, we found that other deciduous species such as willow and birch had reduced IQR ranging from 0 to 5 m associated with the positioning of returns higher in the canopy compared with black spruce and alder (Figure 4a). Significant differences in IQR were found between birch (distribution of returns at the top of the canopy, low IQR range) and alder/aspen (distribution of returns throughout the canopy, p < 0.05). Willow had the lowest proportional canopy cover, similar to black spruce and birch to a lesser extent (Figure 4c), while alder and aspen had the greatest cover in the study areas examined. These were significantly greater than willow (p < 0.05). Based on the average reflectance of all returns within grid cells there was no significant difference observed between conifers and deciduous species (p > 0.05) in the ratio of the difference between NIR and SWIR (NDIR) (Figure 4b). Average laser return intensities of all returns for individual channels were also observed, where higher SWIR average intensities were observed for alder, aspen, and birch compared to conifers such as black spruce (Figure 5), which tend to increase scattering of returns/loss of energy through the canopy. Despite the differences between the averages, the variability in NIR and SWIR across individual species was also not significantly different (p > 0.05), possibly due to other influencing factors including vegetation structure and height, which can impact the number of returns in the canopy.

3.2. Classification of Conifer vs. Deciduous Shrub/Tree in Post-Fire Peatlands Using Lidar

Forest-based regression parameterised using manually identified deciduous shrubs, deciduous trees, and conifer trees showed that the structural metric of the interquartile range (IQR) of height (the difference between the 25th and the 75th percentiles) was the most important variable for classifying shrub vs. trees, followed by intensity-based metric NDIR and percent cover ranked third. Environmental characteristics associated with local elevation (TPI, slope, and aspect) were less important (Table 2). Structural vegetation metrics had higher importance in burned peatlands and could be used to identify shrubs in the absence of a tree canopy. The IQR of height was consistently the most important variable for describing shrub vs. tree cover (importance ~20% in 5, 18, and 30 YSF), while NDIR and percent cover varied depending on years since fire (Table 2). Separability was greater between variables in burned peatlands compared with unburned ones but was reduced in recently (in the last ~90 years) unburned reference peatlands. Moreover, the structural variables had reduced importance in the unburned site (p > 0.05) because the 3D point cloud structural metrics provided little discriminatory power between established deciduous and conifer canopy. NDIR had the highest importance in unburned sites. Finally, with regards to the establishment of shrubs vs. trees, we found that environmental drivers were similar between burned and unburned sites (p > 0.05) (Table 2). The combination of derivatives in Table 2 provided the most accurate prediction and validation classification compared with field/manually identified deciduous vs. conifers in the areas examined.
The forest-based classification model predicted the spatial distribution of deciduous shrubs, deciduous trees, and conifers to an accuracy of > 95% compared with the training data (Table 3). However, the ability to predict the presence of conifer and deciduous trees in the validation data extracted from the lidar data was reduced (accuracy = 71% for both conifer and deciduous trees) compared with deciduous shrubs (accuracy = 92%). The greatest confusion between training and validation data occurred in areas of mixed deciduous and conifer trees with closed canopies (Table 4). Here we find that deciduous shrubs had the lowest commission error and were mostly correctly identified (omission error of 15%). The highest rate of confusion was associated with a commission error of 33% (conifer trees), while the model had an omission error of 27% and 36% for deciduous and conifer trees, respectively (Table 4).
Using forest-based classification, a prediction raster was generated with a pixel resolution of 2 m. The classification predicted more deciduous shrub presence in the areas burnt in 5- and 18-year since fire (YSF) compared to the older burned sites and recently unburned peatlands (Figure 6). Most deciduous trees were found throughout the 30- and 38-year sites within the chronosequence, while unburned areas were predicted to have greater areas of peatland containing conifers (Figure 6). Using the topographic metrics, we found that deciduous shrubs in peatlands were found in areas with shallow slopes (0–3°) in both burned and unburned sites determined using the random forest classification. Approximately 1% of flat to shallow slope areas in unburned peatlands had deciduous shrubs vs. 6% area coverage of conifers. Similarly, burned shallow slope areas within peatlands had 1–2% area coverage of deciduous shrubs, with a decrease in conifer trees of 1–2%. Comparatively, upland and transition areas with north-facing steep slopes (>25°) were dominated by mixedwood stands of conifer and deciduous trees while south-facing slopes were dominated by deciduous trees (Figure 6).

3.3. Proportion of Conifer and Deciduous Shrubs and/or Trees in Post-Fire Peatlands

Bogs had an overall higher proportional coverage of deciduous shrubs, deciduous trees, and conifer trees (Figure 7), while higher areas of coverage of deciduous shrubs were found in fens in the burned sites. Bogs and fens that have not been burned within recent scientific records (reference sites) had higher proportional cover of conifers compared to deciduous species, ranging from 6.6% in fens to 11.3% in bogs, overall. The highest proportion of conifers was found in reference peatlands (average = 10.5% in fens, and average = 11.5% in bogs) that had not been disturbed by natural and/or anthropogenic disturbances (Figure 7). In the 30 years since fire (YSF), bogs had the highest proportional area coverage of deciduous trees, which decreased significantly after that period (Figure 7a, p < 0.05). Differences in proportional area coverage of deciduous shrubs and conifers were also significant (p < 0.05) within all post fire years except between the 30 YSF and 38 YSF.
On the other hand, fens were more prone to post-fire shrub regeneration, having the highest proportional cover of deciduous shrubs (average = 4.6%) observed at 38 years since fire. The difference in proportional cover of deciduous shrubs was, at each period since fire within peatlands (5 YSF, 30 YSF, 38 YSF, and unburned fens (p < 0.05)), associated with a gradual increase in the proportion of shrubs in the years following fire. Shrubs were also greater following fire at 38 YSF than unburned sites that had been anthropogenically disturbed and undisturbed reference sites. Interestingly, the proportional cover of deciduous trees was significantly greater at 30 YSF compared to 38 YSF (Figure 7b, p < 0.05); however, similar differences did not occur in conifers. Differences between years in deciduous cover may be associated with other influencing environmental factors, such as surficial geology.

3.4. Cumulative Growth of Conifers vs. Deciduous Tree and Shrubs in the Years Since Fire

In the years since fire, we found that the cumulative growth of shrubs and trees within bogs and fens has increased over time, resulting in a chronosequence-based growth curve (Figure 8). Vegetation within both bogs and fens appeared to follow a logistic growth curve with significantly taller vegetation in unburned bogs compared to fens (p < 0.05). Moreover, the vegetation height in bogs and fens was statistically significant between all YSF, except between the 30 YSF and 38 YSF (p > 0.05). The regeneration growth rate of vegetation was also slower in fens than bogs. We also observed shorter vegetation heights in the 38 YSF (average = 3.6 m, stdev ± 1.8) compared to the 30 YSF (average = 3.8, stdev ± 1.7) suggesting poor growth conditions, possibly due to other environmental factors not examined here.

4. Discussion

4.1. Use of Lidar to Identify Conifers and Deciduous Trees and Shrubs

In this study, we demonstrated the use of high spatial resolution lidar data and machine learning to identify conifer and deciduous shrubs/trees in a post-fire peatland chronosequence. Lidar-based point cloud structural and intensity metrics were used to predict areas of conifer and deciduous regrowth with relatively high accuracy compared to manually identified trees and shrubs in high spatial resolution optical imagery (Table 3, Figure 6). The interquartile range (IQR) of the point cloud distribution between the 25th and the 75th percentile provided the greatest descriptor of shrub vs. trees, especially in the burned chronosequence where sites were recently disturbed by fire over the last 5 to 38 years (Table 2). IQR may be an indicator of the volume of biomass and, therefore, differences in the distribution of this biomass between conifers/deciduous shrubs and trees ([49], Figure 4). The intensity-based Normalized Difference Infrared Index (NDIR) is ranked second as it is sensitive to reflectance differences between leaf vs. needle foliage (Table 2). Despite the importance of NDIR in the random forest model, at the species level, we found no significant differences in NDIR when compared with field data. This is likely due to the spatial resolution of cells and low point density, while larger cell sizes often include a mixture of species/deciduous and conifers, which can skew return intensities resulting in weakness in the NDIR as a discriminatory variable. Budei et al. [29] found that NDIR ratios capture differences in chlorophyll (NIR) and water content (SWIR) of the leaves, thus providing greater separability. Moreover, deciduous species had higher NDIR ratios than conifer species because broadleaf species have a spherical crown structure and larger cross-sectional area, which provides greater reflectance in NIR [29,30]. While differences exist between conifer and deciduous vegetation in more recently burned sites, the structural and intensity metrics were not significantly different in unburned areas where late successional species dominate.
Through the random forest classification, we also found that the model resulted in reduced sensitivity of identification of deciduous trees vs. conifers trees, which may be due to overlapping crowns (Table 4, [29]). Our results produced an overall validation accuracy of 71% for both deciduous trees and conifers (Table 3, Figure 6, based on structural, intensity, and topographic inputs). Similarly, Li et al. [28] found that lidar point clouds were influenced by the compactness of the tree crown and the vertical distribution of the tree crown, increasing errors when separating aspen and jack pine.
In addition to structural metrics, topographic derivatives may be used to indicate where trees and shrubs grow following fires (Table 2, Figure 6). While these are not direct measures of energy receipt and moisture, they are influencing factors of areas that receive more (south-facing) or less (north-facing) energy and greater (low-lying, closer to water table) and higher (further from water table) topo-environmental conditions that may enhance or deter growth. For example, Thompson et al. [13] found that in shrub-dominated peatlands, a water table decline below 40 cm can cause surface vegetation to dry, making the ecosystem more flammable. Hence, these structural, environmental, and intensity-based variables can be determined from multi-spectral lidar to better understand the range and combination of environmental drivers impacting boreal peatland vegetation succession.

4.2. Changes in Proportional Coverage of Conifers and Deciduous Tree/Shrubs

In this study, we found higher proportional coverage of deciduous shrubs in the early years post-fire overall (Figure 7). Similarly, Alexander et al. [48] found that deciduous trees and shrubs in interior Alaska had high aboveground net primary productivity and high deciduous snag biomass with years since fire, while black spruce stands had slower rates of biomass accumulation. Bogs are typically hydrologically disconnected [10,50], while others found increased depth to water table in bogs and poor fens due to climate-mediated drying, providing ideal conditions for shrubs to grow [10,51]. However, in older burned bogs (38 YSF), we observed an increase in proportional coverage of conifers to 4.1% indicating suitable microsites for black spruce establishment [52].
There is also a lag in vegetation response to wildfires, creating younger forests with more deciduous-dominated species over time, which are less flammable [7,53,54]. For example, it takes about two to three years following fire for shrubs to colonize [55], while deciduous species dominate peatlands and other boreal ecosystems including pre-disturbance forest ecosystems in the first 10–20 years of succession ([56]; Figure 7). Deciduous tree species typically die off during the intermediate stages of stand succession due to density-dependent factors and shifts in dominance towards conifers are also observed in older post-fire years and unburned peatlands (Figure 7). Unburned peatlands typically have more heterogeneous eco-hydrological conditions, with large hydrological differences occurring between peatland margins and centers [10,57]. Unburned bogs in both areas surveyed by lidar had the greatest proportional cover of conifers, possibly because moist bog sites underlaid with mineral soils beneath Sphagnum mosses provided suitable microsites for conifer seedling establishment [22,52,54]. Thus, differences in site hydrology (either spatial or temporal) can result in differences in the relative deciduous and conifer proportion. Here, we found that it is approximately between 18- and 30-years post-fire where there is a transition from deciduous trees to conifer trees observed. After 30 years, we observed a reduction in the proportional cover of deciduous trees in bogs and fens (Figure 7).

4.3. Spatial Variation in Vegetation Height in Bogs and Fens

Growth curves have been applied to understand the biomass accumulation with stand age. The cumulative growth curve follows the different stages of boreal mixedwood succession: stand initiation dominated by deadwood, stem exclusion, and canopy transmission during the intermediate stages and gap dynamics in old growth [58,59]. Here, we used a growth curve to determine variations in vegetation growth in bogs and fens. Although bogs and fens have a similar range of vegetation heights within the first five years since fire (Figure 8), we found a greater rate of cumulative growth of woody vegetation in the later stages of stand succession in bogs compared to fens with time since fire. This may be associated with lifecycle influences on bog species regeneration, especially where bogs are dominated by black spruce, which have semi-serotinous cones and a half-life from 4.4 to 16.2 years [22,59]. Fires often do not burn all available biomass entirely, with some residual leaves/needles, deadwood, snags, and mosses remaining. These act as a preferred seedbed for conifer seedling establishment, often requiring 5–10 years for post-fire establishment [52,53]. On the other hand, fens may be more sensitive to changes in hydrology due to drainage, road disturbance, or sustained drought, where a moderate drop in water table can make it difficult for Sphagnum spp. to colonize, resulting in enhanced broadleaf species establishment [60,61]. Deciduous seedling recruitment occurs in the first decade post-fire, through reproduction via root suckers (aspen) and seed stump sprouts (birch), which are shade-intolerant [59]. However, deciduous species typically experience thinning in the second decade of stand development, resulting in density-dependent mortality and replacement by conifers [22,53,62]. Hence, bogs outcompete fens in terms of vegetation regeneration (Figure 8), and, over time, the growth rate decreases in mature stands to the point of stabilization.

4.4. Use of Remote Sensing and Possible Limitations

Remote sensing of wetlands provides a broad range of information that could be used to enhance field measurements. Although field sampling provides insights and measurements of the complex environmental and physical processes that are occurring, it can be labor-intensive and expensive [63]. Cumulative impacts of natural and anthropogenic disturbances can be estimated using remotely sensed data when calibrated/validated using field measurements. These datasets provide an opportunity to estimate (optical) or sample (lidar) vegetation structural characteristics beyond plots via classification and change detection methods [63]. Active remote sensing using lidar provides better estimates of structural attributes such as tree height. Lidar can be used for individual tree segmentation [64] and separating shrub canopy from ground layers [65] at accuracies that are comparable or potentially better than field structural mensuration methods.
In this study, we used a combination of lidar and field measurements to identify trees and shrubs. However, despite the collection of 202 species along seismic line transects, there were not enough field points to run forest-based classification to genus level, as random forest requires hundreds to thousands of measurements to parameterise the full distribution of the variability of shrub and tree characteristics. To reduce the implications of pixel mixtures on structure/intensity metrics, only homogenous plots were used, reducing the sample size to 44 micro-plot locations. Despite the data density reduction, these plots were useful for identifying differences in structural variability between species observed in Figure 4 and Figure 5 using lidar data. We observed some variability in the 3D structure in deciduous (aspen, alder, willow, and birch) and conifer species (black spruce) based on the influences of branching structures and foliage on the point cloud distribution [28]. To train the random forest model, 4000 manually delineated image-based locations of deciduous vs. conifers were used. Despite this, we expect that there may be some misidentification of shrubs and trees from high spatial resolution imagery. For example, it was more difficult to identify deciduous shrubs due to the potential impact of shadows, which occlude shrubs, such as overstory canopies. One way to improve this study would be to use an object-oriented classification, which could include structural attributes such as tree crown shape and crown area to height ratio to better distinguish between conifer and deciduous shrubs and trees [29,66]. Though this could enhance uncertainty when applied to early post-fire vegetation regeneration as small stature individuals may be missed within objects and require division of structures within pixels similar to spectral unmixing. Moreover, vegetation height was used to measure post-fire cumulative growth; however, other metrics could also be used, including allometrically derived biomass [49] and/or foliage or total area coverage [22]. Although the cumulative vegetation growth in peatlands follows a logistic curve to maturity, there remains some uncertainty that could be improved by adding intermediate chronosequence data or YSF to the curve (e.g., between 18 and 30 years).

5. Conclusions

This study explored the use of airborne multi-spectral lidar data to identify deciduous shrubs/trees and conifers in a space-for-time post-fire chronosequence boreal peatland environment using forest-based classification. Using a supervised machine learning model, deciduous shrubs were classified to 92% accuracy, while deciduous trees and conifers were classified to 71% accuracy for both, respectively, compared with validation data. The structural variables of the interquartile range (IQR) followed by NDIR and percent cover provided more discriminatory power than topographic metrics, particularly in the burned areas. The results of the forest-based classification illustrated high shrubification in recently burned peatlands, particularly in the 5 and 18 YSF, while conifers dominate the unburned peatlands and uplands. We also found that there was more shrubification in fens compared to bogs, though there was some evidence to suggest a transition between 18 and 30-year post-fire from deciduous to conifer tree species. These results indicate that as regenerating forests age, they become more flammable because the fuel content shifts from deciduous to conifer, providing more fuels for wildland fire. Early post-fire deciduous regeneration in peatlands may reduce the movement of fire across the landscape. Deciduous shrubification associated with climatic change in more mature peatland ecosystems could have mixed implications for fire, by reducing flammability (due to the moisture content of leaves) but also drying out peat through evaporative losses. A greater understanding of climate-mediated changes in post-fire peatlands will be critically important for assessing peatland resilience and fire behaviour in the future.

Author Contributions

Conceptualization, H.E., L.C., C.H., D.T. and D.C.; methodology, H.E., L.C., C.H., D.T. and D.C.; software, L.C. and C.H.; validation, H.E.; formal analysis, H.E.; writing—original draft preparation, H.E.; writing—review and editing, L.C., C.H., D.T. and D.C.; supervision, L.C.; project administration, L.C. and D.C.; funding acquisition, L.C.; C.H. and D.C. All authors have read and agreed to the published version of the manuscript.

Funding

This research was funded by the NSERC Discovery Grant (grant number 2017-04492) to Laura Chasmer, Alberta Environment and Parks (grant number 18GRAEM24) to Laura Chasmer and Danielle Cobbaert, NSERC Canada Wildfire (grant number RES0049086) to Laura Chasmer and Christopher Hopkinson, and the Oil Sands Monitoring Program. The Titan lidar was purchased with a grant to Christopher Hopkinson from Western Economic Diversification Canada (grant number 000015316). Field equipment was purchased using Canadian Foundation for Innovation (grant number 32436) to Christopher Hopkinson and Laura Chasmer. Funding for this project was also provided to Humaira Enayetullah by Alberta Graduate Excellence Scholarship, and Northern Scientific Training Program (NSTP).

Institutional Review Board Statement

Not Applicable.

Informed Consent Statement

Not Applicable.

Data Availability Statement

Lidar data can be requested through c.hopkinson@uleth.ca and laura.chasmer@uleth.ca, along with delineated wetlands. Geospatial data layers can be downloaded from ABMI (https://abmi.ca/home/data-analytics/da-top/da-product-overview/Data-Archive/Land-Cover.html accessed on 27 November 2021).

Acknowledgments

For assistance in the field and data collection, the authors would like to thank Chinyere Ottah and Nick Cuthbertson (University of Lethbridge). For airborne survey, lidar data pre-processing, and technical support we would like to thank Maxim Okhrimenko and Celeste Barnes (University of Lethbridge).

Conflicts of Interest

The authors declare no conflict of interest.

References

  1. National Wetlands Working Group. The Canadian Wetland Classification System, 2nd ed.; Wetlands Research Centre, University of Waterloo: Waterloo, ON, Canada, 1997. [Google Scholar]
  2. Tarnocai, C. The Impact of Climate Change on Canadian Peatlands. Can. Water Resour. J. 2009, 34, 453–466. [Google Scholar] [CrossRef] [Green Version]
  3. Reid, W.V. Millennium Ecosystem Assessment. 2005. Available online: https://www.millenniumassessment.org/documents/document.356.aspx.pdf (accessed on 26 December 2021).
  4. Turetsky, M.; Wieder, K.; Halsey, L.; Vitt, D. Current disturbance and the diminishing peatland carbon sink. Geophys. Res. Lett. 2002, 29, 1526. [Google Scholar] [CrossRef] [Green Version]
  5. Hanes, C.C.; Wang, X.; Jain, P.; Parisien, M.; Little, J.M.; Flannigan, M.D. Fire-regime changes in Canada over the last half century. Can. J. For. Res. 2019, 49, 256–269. [Google Scholar] [CrossRef]
  6. Akagi, S.K.; Yokelson, R.J.; Wiedinmyer, C.; Alvarado, M.J.; Reid, J.S.; Karl, T.; Crounse, J.D.; Wennberg, P.O. Emission factors for open and domestic biomass burning for use in atmospheric models. Atmos. Chem. Phys. 2011, 11, 4039–4072. [Google Scholar] [CrossRef] [Green Version]
  7. Stralberg, D.; Wang, X.; Parisien, M.A.; Robinne, F.N.; Sólymos, P.; Mahon, C.L.; Nielsen, S.E.; Bayne, E.M. Wildfire-mediated vegetation change in boreal forests of Alberta, Canada. Ecosphere 2018, 9, e02156. [Google Scholar] [CrossRef]
  8. Wang, J.A.; Sulla-Menashe, D.; Woodcock, C.E.; Sonnentag, O.; Keeling, R.F.; Friedl, M.A. Extensive land cover change across Arctic–Boreal Northwestern North America from disturbance and climate forcing. Glob. Chang. Boil. 2019, 26, 807–822. [Google Scholar] [CrossRef] [PubMed]
  9. Sniderhan, A.E.; Baltzer, J.L. Growth dynamics of black spruce (Picea mariana) in a rapidly thawing discontinuous permafrost peatland. J. Geophys. Res. Biogeosci. 2016, 121, 2988–3000. [Google Scholar] [CrossRef]
  10. Waddington, J.M.; Morris, P.J.; Kettridge, N.; Granath, G.; Thompson, D.K.; Moore, P.A. Hydrological feedbacks in northern peatlands. Ecohydrology 2015, 8, 113–127. [Google Scholar] [CrossRef]
  11. Schneider, R.R.; Devito, K.; Kettridge, N.; Bayne, E. Moving beyond bioclimatic envelope models: Integrating upland forest and peatland processes to predict ecosystem transitions under climate change in the western Canadian boreal plain. Ecohydrology 2016, 9, 899–908. [Google Scholar] [CrossRef]
  12. Flannigan, M.D.; Wotton, B.M.; Marshall, G.A.; de Groot, W.J.; Johnston, J.; Jurko, N.; Cantin, A.S. Fuel moisture sensitivity to temperature and precipitation: Climate change implications. Clim. Chang. 2015, 134, 59–71. [Google Scholar] [CrossRef]
  13. Thompson, D.K.; Simpson, B.N.; Whitman, E.; Barber, Q.E.; Parisien, M.A. Peatland hydrological dynamics as a driver of landscape connectivity and fire activity in the boreal plain of Canada. Forests 2019, 10, 534. [Google Scholar] [CrossRef] [Green Version]
  14. Nelson, K.; Thompson, D.; Hopkinson, C.; Petrone, R.; Chasmer, L. Peatland-fire interactions: A review of wildland fire feedbacks and interactions in Canadian boreal peatlands. Sci. Total Environ. 2021, 769, 145212. [Google Scholar] [CrossRef]
  15. Elmes, M.C.; Thompson, D.K.; Price, J.S. Changes to the hydrophysical properties of upland and riparian soils in a burned fen watershed in the Athabasca Oil Sands Region, northern Alberta, Canada. Catena 2019, 181, 104077. [Google Scholar] [CrossRef]
  16. Amiro, B.D.; Todd, J.B.; Wotton, B.M.; Logan, K.A.; Flannigan, M.D.; Stocks, B.J.; Mason, J.A.; Martell, D.L.; Hirsch, K.G. Direct carbon emissions from Canadian forest fires, 1959–1999. Can. J. For. Res. 2001, 31, 512–525. [Google Scholar] [CrossRef]
  17. Walker, X.J.; Baltzer, J.L.; Bourgeau-Chavez, L.; Day, N.J.; Dieleman, C.M.; Johnstone, J.F.; Kane, E.S.; Rogers, B.M.; Turetsky, M.R.; Veraverbeke, S.; et al. Patterns of ecosystem structure and wildfire carbon combustion across six ecoregions of the North American boreal forest. Front. For. Glob. Chang. 2020, 3, 87. [Google Scholar] [CrossRef]
  18. Dieleman, C.M.; Branfireun, B.A.; McLaughlin, J.W.; Lindo, Z. Climate change drives a shift in peatland ecosystem plant community: Implications for ecosystem function and stability. Glob. Chang. Biol. 2015, 21, 388–395. [Google Scholar] [CrossRef] [PubMed]
  19. Camill, P.; Barry, A.; Williams, E.; Andreassi, C.; Limmer, J.; Solick, D. Climate-vegetation-fire interactions and their impact on long-term carbon dynamics in a boreal peatland landscape in northern Manitoba, Canada. J. Geophys. Res. 2009, 114. [Google Scholar] [CrossRef]
  20. CAPP. Canadian Economic Contribution. Available online: https://www.capp.ca/economy/canadian-economic-contribution (accessed on 26 December 2021).
  21. Rosa, L.; Davis, K.F.; Rulli, M.C.; D’Odorico, P. Environmental consequences of oil production from oil sands. Earth’s Future 2017, 5, 158–170. [Google Scholar] [CrossRef]
  22. Bolton, D.K.; Coops, N.C.; Hermosilla, T.; Wulder, M.A.; White, J.C. Assessing variability in post-fire forest structure along gradients of productivity in the Canadian boreal using multi-source remote sensing. J. Biogeogr. 2017, 44, 1294–1305. [Google Scholar] [CrossRef]
  23. Wehr, A.; Lohr, U. Airborne laser scanning—An introduction and overview. ISPRS J. Photogramm. Remote Sens. 1999, 54, 68–82. [Google Scholar] [CrossRef]
  24. Lim, K.; Treitz, P.; Wulder, M.; St-Onge, B.; Flood, M. LiDAR remote-sensing of forest structure. Prog. Phys. Geogr. 2003, 27, 88–106. [Google Scholar] [CrossRef] [Green Version]
  25. Hopkinson, C.; Chasmer, L.E.; Sass, G.; Creed, I.F.; Sitar, M.; Kalbfleisch, W.; Treitz, P. Vegetation class dependent errors in lidar ground elevation and canopy height estimates in a boreal wetland environment. Can. J. For. Res. 2005, 31, 191–206. [Google Scholar] [CrossRef]
  26. Millard, K.; Richardson, M. Quantifying the relative contributions of vegetation and soil moisture conditions to polarimetric C-Band SAR response in a temperate peatland. Remote Sens. Environ. 2018, 206, 123–138. [Google Scholar] [CrossRef]
  27. Ørka, H.O.; Næsset, E.; Bollandsås, O.M. Effects of different sensors and leaf-on and leaf-off canopy conditions on echo distributions and individual tree properties derived from airborne laser scanning. Remote Sens. Environ. 2010, 114, 1445–1461. [Google Scholar] [CrossRef]
  28. Li, J.; Hu, B.; Noland, T.L. Classification of tree species based on structural features derived from high density LiDAR data. Agric. For. Meteorol. 2013, 171–172, 104–114. [Google Scholar] [CrossRef]
  29. Budei, B.C.; St-Onge, B.; Hopkinson, C.; Audet, F.A. Identifying the genus or species of individual trees using a three-wavelength airborne lidar system. Remote Sens. Environ. 2018, 204, 632–647. [Google Scholar] [CrossRef]
  30. Hopkinson, C.; Chasmer, L.; Gynan, C.; Mahoney, C.; Sitar, M. Multisensor and multispectral LiDAR characterization and classification of a forest environment. Can. J. For. Res. 2016, 42, 501–520. [Google Scholar] [CrossRef]
  31. Bonan, G.B.; Shugart, H.H. Environmental factors and ecological processes in boreal forests. Annu. Rev. Ecol. Syst. 1989, 20, 1–28. [Google Scholar] [CrossRef]
  32. Alberta Parks. Natural Regions and Subregions of Alberta. A Framework for Alberta’s Parks; Alberta Tourism, Parks and Recreation: Edmonton, AB, Canada, 2015; Available online: https://www.albertaparks.ca/media/6256258/natural-regions-subregions-of-alberta-a-framework-for-albertas-parks-booklet.pdf (accessed on 26 March 2021).
  33. Government of Alberta. Current and Historical Alberta Weather Station Data Viewer. Available online: https://acis.alberta.ca/weather-data-viewer.jsp (accessed on 10 July 2021).
  34. Alberta Energy Regulator. Surficial Geology of the Pelican Lake Area (NTS83P). Available online: https://ags.aer.ca/publication/dig-2002-0017 (accessed on 23 March 2021).
  35. ABMI. Human Footprint Inventory Enhanced (HFIe) for the Oil Sands Region: Wall-to-Wall Human Footprint Inventory Enhanced for the Oil Sands Region; Alberta Biodiversity Monitoring Institute and Alberta Human Footprint Monitoring Program: Edmonton, AB, Canada; Available online: https://abmi.ca/home/data-analytics/da-top/da-product-overview/Data-Archive/Land-Cover.html (accessed on 24 March 2021).
  36. Alberta Wildfire. Spatial Wildfire Data. Available online: http://wildfire.alberta.ca/resources/historical-data/spatial-wildfire-data.aspx (accessed on 26 March 2021).
  37. Witte, T.H.; Wilson, A.M. Accuracy of WAAS-enabled GPS for the determination of position and speed over ground. J. Biomech. 2005, 38, 1717–1722. [Google Scholar] [CrossRef]
  38. Government of Alberta. Alberta Wetland Classification System. Available online: http://www.waterforlife.alberta.ca/documents/ClassificationSystem-Jun-01-2015.pdf (accessed on 11 July 2020).
  39. Abib, T.H.; Chasmer, L.; Hopkinson, C.; Mahoney, C.; Rodriguez, L.C.E. Seismic line impacts on proximal boreal forest and wetland environments in Alberta. Sci. Total Environ. 2019, 658, 1601–1613. [Google Scholar] [CrossRef]
  40. van Rensen, C.K.; Nielsen, S.E.; White, B.; Vinge, T.; Lieffers, V.J. Natural regeneration of forest vegetation on legacy seismic lines in boreal habitats in Alberta’s oil sands region. Biol. Conserv. 2015, 184, 127–135. [Google Scholar] [CrossRef] [Green Version]
  41. Ji, L.; Zhang, L.; Wylie, B.K.; Rover, J. On the terminology of the spectral vegetation index (NIR − SWIR)/(NIR + SWIR). Int. J. Remote Sens. 2011, 32, 6901–6909. [Google Scholar] [CrossRef]
  42. Breiman, L. Random forests. Mach. Learn. 2001, 45, 5–32. [Google Scholar] [CrossRef] [Green Version]
  43. Menze, B.H.; Kelm, B.M.; Masuch, R.; Himmelreich, U.; Bachert, P.; Petrich, W.; Hamprecht, F.A. A comparison of random forest and its gini importance with standard chemometric methods for the feature selection and classification of spectral data. BMC Bioinform. 2009, 10, 213. [Google Scholar] [CrossRef] [PubMed] [Green Version]
  44. McCarley, T.R.; Hudak, A.T.; Sparks, A.M.; Vaillant, N.M.; Meddens, A.J.H.; Trader, L.; Mauro, F.; Kreitler, J.; Boschetti, L. Estimating wildfire fuel consumption with multitemporal airborne laser scanning data and demonstrating linkage with MODIS-derived fire radiative energy. Remote Sens. Environ. 2020, 251, 112114. [Google Scholar] [CrossRef]
  45. Belgiu, M.; Drăguţ, L. Random Forest in remote sensing: A review of applications and future directions. ISPRS J. Photogramm. Remote Sens. 2016, 114, 24–31. [Google Scholar] [CrossRef]
  46. ArcGIS Pro. How Forest-Based Classification and Regression Works. Available online: https://pro.arcgis.com/en/pro-app/latest/tool-reference/spatial-statistics/how-forest-works.htm (accessed on 1 April 2021).
  47. Wieder, R.K.; Scott, K.D.; Kamminga, K.; Vile, M.A.; Vitt, D.H.; Bone, T.; Xu, B.; Benscoter, B.W.; Bhatti, J.S. Postfire carbon balance in boreal bogs of Alberta, Canada. Glob. Chang. Biol. 2009, 15, 63–81. [Google Scholar] [CrossRef]
  48. Alexander, H.D.; Mack, M.C.; Goetz, S.; Beck, P.S.A.; Belshe, E.F. Implications of increased deciduous cover on stand structure and aboveground carbon pools of Alaskan boreal forests. Ecosphere 2012, 3, 1–21. [Google Scholar] [CrossRef]
  49. Hopkinson, C.; Chasmer, L.; Barr, A.G.; Kljun, N.; Black, T.A.; McCaughey, J.H. Monitoring boreal forest biomass and carbon storage change by integrating airborne laser scanning, biometry and eddy covariance data. Remote Sens. Environ. 2016, 181, 82–95. [Google Scholar] [CrossRef] [Green Version]
  50. Devito, K.J.; Hokanson, K.J.; Moore, P.A.; Kettridge, N.; Anderson, A.E.; Chasmer, L.; Hopkinson, C.; Lukenbach, M.C.; Mendoza, C.A.; Morissette, J.; et al. Landscape controls on long-term runoff in subhumid heterogeneous boreal plains catchments. Hydrol. Process. 2017, 31, 2737–2751. [Google Scholar] [CrossRef]
  51. Chasmer, L.; Lima, E.M.; Mahoney, C.; Hopkinson, C.; Montgomery, J.; Cobbaert, D. Shrub changes with proximity to anthropogenic disturbance in boreal wetlands determined using bi-temporal airborne lidar in the oil sands region, Alberta Canada. Sci. Total Environ. 2021, 780, 146638. [Google Scholar] [CrossRef] [PubMed]
  52. Jean, S.A.; Pinno, B.D.; Nielsen, S.E. Early regeneration dynamics of pure black spruce and aspen forests after wildfire in boreal Alberta, Canada. Forests 2020, 11, 333. [Google Scholar] [CrossRef] [Green Version]
  53. Johnstone, J.F.; Chapin Iii, F.S.; Foote, J.; Kemmett, S.; Price, K.; Viereck, L. Decadal observations of tree regeneration following fire in boreal forests. Can. J. For. Res. 2004, 34, 267–273. [Google Scholar] [CrossRef]
  54. Johnstone, J.F.; Chapin Iii, F.S. Effects of soil burn severity on post-fire tree recruitment in boreal forest. Ecosystems 2006, 9, 14–31. [Google Scholar] [CrossRef]
  55. Beck, P.S.A.; Goetz, S.J.; Mack, M.C.; Alexander, H.D.; Jin, Y.; Randerson, J.T.; Loranty, M.M. The impacts and implications of an intensifying fire regime on Alaskan boreal forest composition and albedo. Glob. Chang. Biol. 2011, 17, 2853–2866. [Google Scholar] [CrossRef]
  56. Boucher, D.; Gauthier, S.; Grandpré, L.D. Structural changes in coniferous stands along a chronosequence and a productivity gradient in the northeastern boreal forest of Québec. Écoscience 2006, 13, 172–180. [Google Scholar] [CrossRef]
  57. Morison, M.; Beest, C.; Macrae, M.; Nwaishi, F.; Petrone, R. Deeper burning in a boreal fen peatland 1-year post-wildfire accelerates recovery trajectory of carbon dioxide uptake. Ecohydrology 2021, 14, e2277. [Google Scholar] [CrossRef]
  58. Chen, H.Y.; Popadiouk, R.V. Dynamics of North American boreal mixedwoods. Environ. Rev. 2002, 10, 137–166. [Google Scholar] [CrossRef]
  59. Harper, K.A.; Bergeron, Y.; Drapeau, P.; Gauthier, S.; De Grandpré, L. Structural development following fire in black spruce boreal forest. For. Ecol. Manag. 2005, 206, 293–306. [Google Scholar] [CrossRef]
  60. Sherwood, J.H.; Kettridge, N.; Thompson, D.K.; Morris, P.J.; Silins, U.; Waddington, J.M. Effect of drainage and wildfire on peat hydrophysical properties. Hydrol. Process. 2013, 27, 1866–1874. [Google Scholar] [CrossRef]
  61. Kettridge, N.; Turetsky, M.R.; Sherwood, J.H.; Thompson, D.K.; Miller, C.A.; Benscoter, B.W.; Flannigan, M.D.; Wotton, B.M.; Waddington, J.M. Moderate drop in water table increases peatland vulnerability to post-fire regime shift. Sci. Rep. 2015, 5, 8063. [Google Scholar] [CrossRef] [Green Version]
  62. Bolton, D.K.; Coops, N.C.; Wulder, M.A. Measuring Forest structure along productivity gradients in the Canadian boreal with small-footprint Lidar. Environ. Monit. Assess. 2013, 185, 6617–6634. [Google Scholar] [CrossRef] [PubMed]
  63. Chasmer, L.; Mahoney, C.; Millard, K.; Nelson, K.; Peters, D.; Merchant, M.; Hopkinson, C.; Brisco, B.; Niemann, O.; Montgomery, J.; et al. Remote sensing of boreal wetlands 2: Methods for evaluating boreal wetland ecosystem state and drivers of change. Remote Sens. 2020, 12, 1321. [Google Scholar] [CrossRef] [Green Version]
  64. St-Onge, B.; Audet, F.; Bégin, J. Characterizing the height structure and composition of a boreal forest using an individual tree crown approach applied to photogrammetric point clouds. Forests 2015, 6, 3899–3922. [Google Scholar] [CrossRef]
  65. Zhuang, W.; Giorgos Mountrakis, G. Ground peak identification in dense shrub areas using large footprint waveform LiDAR and Landsat images. Int. J. Digit. Earth. 2015, 8, 805–824. [Google Scholar] [CrossRef]
  66. Zahidi, I.; Yusuf, B.; Hamedianfar, A.; Shafri, H.Z.M.; Mohamed, T.A. Object-based classification of QuickBird image and low point density LIDAR for tropical trees and shrubs mapping. Eur. J. Remote Sens. 2015, 48, 423–446. [Google Scholar] [CrossRef] [Green Version]
Figure 1. Location of 5 years, 18 years, 30 years, and 38 years since fire chronosequence near Fort McMurray, Alberta surveyed using multi-spectral lidar. The region is within the Boreal Plains ecozone. Areas that have not been burned in the recent history of scientific observation (since ~1930) are found in between the fire scars, predominantly between 1982 and 2002 fires in the western lidar polygon.
Atmosphere 13 00112 g001
Figure 2. Examples of seismic line transects for shrub and tree height validation through (a) burned peatland and (b) forest looking into an unburned treed peatland.
Atmosphere 13 00112 g002
Figure 3. Flowchart of research methodology. The flow chart shows the input data and steps taken to develop the tree and shrub classification.
Atmosphere 13 00112 g003
Figure 4. Box plot of (a) IQR of height, (b) NDIR, and (c) percent cover used to separate between species. The values are derived from lidar data for deciduous and conifer species identified in unmixed plots in the field (n = 44).
Atmosphere 13 00112 g004
Figure 5. Average SWIR (shortwave infrared, 1550 nm) and NIR (near infrared, 1064 nm) intensities for field-identified, unmixed pixels with deciduous and conifer species using all returns of SWIR and NIR > 0.5 m (n = 44).
Atmosphere 13 00112 g005
Figure 6. Prediction raster generated for (a) western lidar polygon including vegetation regeneration 18 YSF, 38 YSF, and recently unburned peatlands and (b) eastern lidar polygon including vegetation regeneration 5 YSF and 30 YSF. No data areas shaded in grey represent vegetation height less than 0.5 m. These low vegetation areas are typically representing ground cover, Labrador tea, and herbaceous species.
Atmosphere 13 00112 g006
Figure 7. Proportional cover of wetland conifer vs. deciduous species per fire chronosequence, in (a) bogs and (b) fens.
Atmosphere 13 00112 g007
Figure 8. Average vegetation height (at 99th percentile of lidar returns) with stand age for boreal peatland fire chronosequence (R2 = 0.96 for bogs, R2 = 0.98 for fens). Unburned peatlands are plotted with an arbitrary stand age of 90 ± 10 years, though there may be many more years since the last fire, but not determined in the field and not included in the recent history of scientific observation (since ~1930).
Atmosphere 13 00112 g008
Table 1. Lidar metrics derived for identifying shrubs and trees using return height above ground greater than 0.5 m. Lidar metrics in bold were used in the final model based on their importance. Other metrics were also generated but were not included in the forest-based classification (described below) because they were highly auto-correlated (Pearson’s correlation ≥ 0.60). All metrics generated had a cell resolution of 2 m2, except for slope and aspect, which had a resolution of 5 m2, resampled to 2 m2 for the random forest classification. C1 = 1550 nm (shortwave infrared, SWIR); C2 = 1064 nm (near infrared, NIR); C3 = 532 nm (green).
TypeLidar MetricDescription
Vegetation Structural MetricsC123_Max_hgtMaximum height of all returns from all channels with heights > 0.5 m from ground
C123_Min_hgtMinimum height of all returns with heights > 0.5 m from ground
C123_IQR_hgtInterquartile range of height using all returns from all channels with heights > 0.5 m from ground.
IQR = p75 height − p25 height
C123_Ske_hgtSkewness of height values using all returns with heights > 0.5 m from ground
C123_Kur_hgtKurtosis of height values using all returns with heights > 0.5 m from ground
C123_CoverPercent cover using all returns from all channels with heights > 0.5 m from ground
Vegetation Laser Return IntensityC1_Min_intC1 minimum intensity of returns with heights > 0.5 m from ground
C1_Max_intC1 maximum intensity of returns with heights > 0.5 m from ground
C1_Ske_intC1 skewness of intensity values using returns with heights > 0.5 m from ground
C1_Kur_intC1 kurtosis of intensity values using returns with heights > 0.5 m from ground
NDIR_C1_C2Normalized Difference InfraRed index using returns with heights > 0.5 m from ground calculated using the formula (C1 − C2)/(C1 + C2)
C2_Min_intC2 minimum intensity of returns with heights > 0.5 m from ground
C2_Max_intC2 maximum intensity of returns with heights > 0.5 m from ground
C2_Ske_intC2 skewness of intensity values using returns with heights > 0.5 m from ground
C2_Kur_intC2 kurtosis of intensity values using returns with heights > 0.5 m from ground
Environmental/TopographicSlope5 m resolution slope generated based on LasTool generated DEM
Aspect5 m resolution aspect generated based on LasTool generated DEM
TPITopographic position index generated using Jenness topographic position tool having a search radius of 50 m
Table 2. Variable importance for each fire chronosequence and unburned area generated using forest-based classification, where YSF refers to years since fire. Here red represents vegetation structural metrics, yellow represents vegetation laser intensity returns, and green represents environmental/topographic variables.
Variable Importance (%)5 YSF18 YSF30 YSF38 YSFUnburned
IQR height19.819.719.918.718.5
NDIR17.115.616.715.517.9
Percent Cover15.517.117.218.616.0
Aspect14.916.515.515.516.4
TPI16.616.215.916.115.8
Slope16.115.014.816.715.3
Vegetation structural metric
Vegetation laser return intensity
Environmental/Topographic
Table 3. Model performance for the study area. Sensitivity is the percentage of time each observed category was correctly predicted, while accuracy takes into consideration how well each category was predicted and how often it was miscategorised.
Training DataSensitivity (%)Accuracy (%)
Deciduous shrubs1.000.98
Deciduous trees0.950.96
Conifer trees0.960.96
Validation DataSensitivity (%)Accuracy (%)
Deciduous shrubs0.920.92
Deciduous trees0.660.71
Conifer trees0.620.71
Table 4. Confusion matrix of forest-based regression between deciduous shrubs, deciduous trees, and conifers within burned and recently unburned peatlands.
Deciduous ShrubsDeciduous TreesConifer TreesCommission ErrorOmission Error
Deciduous shrubs150570.070.15
Deciduous trees122391020.320.27
Conifer trees14841970.330.36
Numbers in bold represents the number of correctly identified groups compared with validation.
Publisher’s Note: MDPI stays neutral with regard to jurisdictional claims in published maps and institutional affiliations.

