Article

Ambient BTEX Concentrations during the COVID-19 Lockdown in a Peri-Urban Environment (Orléans, France)

1
Institut de Combustion, Aérothermique, Réactivité Environnement (ICARE), CNRS, 1C Avenue de la Recherche Scientifique, CEDEX 2, 45071 Orléans, France
2
Research Center for Eco-Environmental Sciences, Chinese Academy of Sciences, Beijing 100085, China
3
Laboratorio de Estudios Atmosféricos (LEA)-Instituto de Química del Noroeste Argentino (CONICET-UNT), Facultad de Bioquímica, Química y Farmacia, Universidad Nacional de Tucumán, San Lorenzo 456, T4000CAN San Miguel de Tucumán, Argentina
4
Laboratoire de Physique et de Chimie de l’Environnement et de l’Espace (LPC2E), 3A Avenue de la Recherche Scientifique, CEDEX 2, 45071 Orléans, France
*
Author to whom correspondence should be addressed.
Atmosphere 2022, 13(1), 10; https://doi.org/10.3390/atmos13010010
Submission received: 2 November 2021 / Revised: 13 December 2021 / Accepted: 14 December 2021 / Published: 21 December 2021
(This article belongs to the Special Issue VOC Sensing and Measurements)

Abstract

:
During the period from 17 March to 10 May 2020, France saw dramatic shifts in domestic, industrial and transport activities as a national lockdown was introduced. So far, studies have generally focused on urban settings, by contrast, this work reports data for a peri-urban location. Air samples were collected and analyzed using a fully automated GC-MS-FID system in an air quality monitoring station situated in the suburbs of Orléans, France. Average concentrations of BTEX (benzene, toluene, ethylbenzene, and xylenes) before, during, and after lockdown, were 402 ± 143, 800 ± 378 and 851 ± 445 pptv, respectively. Diurnal variation in BTEX and correlations between each of its components were analyzed to determine its various sources. The toluene/benzene (T/B) and m,p-xylene/ethylbenzene (MP/E) ratios, photochemical ages were used to explore whether the BTEX were from local or more distant sources. Together with a host of complementary measurements including NOx, O3, black carbon, meteorological parameters, and anthropogenic activities, we were able to make some inferences on the sources of BTEX. The results suggest that although anomalous local anthropogenic activity can lead to significant changes in BTEX concentrations, pollution levels in Orléans are mostly dependent on meteorological conditions, specifically whether the winds are coming from the Paris region. It appears, based on these measurements, that the pollution in the Orléans area is very much tied to the nearby megacity of Paris, this may be true for other peri-urban sites with implications for city planning and pollution mitigation strategies.

1. Introduction

The COVID-19 pandemic has resulted in reduced emissions into the atmosphere worldwide as a result of the actions taken to limit or even stop certain human activities, which are generally linked to transportation and industrial activities. In some locations, these measures led to substantial reductions in the emissions of important atmospheric pollutants such as nitrogen oxides (NOx), particulate matter (PM), and volatile organic compounds (VOCs) as reported by a number of studies around the globe. For example, Barré et al. [1] and Guevara et al. [2] reported emissions dropping by up to 60% for NOx, and up to 15% for non-methane volatile organic compounds (NMVOC) during the March/April 2020 lockdown in Europe while Shi and Brasseur [3] showed that the surface concentrations of PM2.5 and NO2 in China were reduced by 35% and 60%, respectively. It is expected that the NOx levels decreased in urban areas during lockdown periods since they are major combustion by-products from vehicle emissions. Many other regions have recorded significant reductions in air pollution globally [4,5,6].
While NOx levels have generally decreased, NOx concentration from other sources and the concentrations of other species may not follow the same trends, especially for those emitted into the atmosphere through plants, agricultural, biomass burning, and indoor activities. In addition, atmospheric pollution is not a linear “chemistry” [7,8]. The reduction of NOx alone does not necessitate a direct improvement of air quality, for example, lowering NOx emissions may lead to an increase of ozone levels depending on a number of factors such as the types of VOCs and their concentrations as well as the solar irradiation. In fact, a number of studies have reported an increase of ozone concentrations in various areas during the lockdown despite the reduction in the NOx levels [9,10].
Atmospheric chemistry is complex; a complete understanding of the processes occurring and the resulting impacts on air quality and health require the knowledge of many parameters, not only the concentrations of NOx and PMs. More specifically, it requires the speciation of many other pollutants such as VOCs, which may play an important role in tropospheric ozone formation for example. Among the VOCs emitted into the atmosphere, the mono-aromatic hydrocarbons such as benzene, toluene, ethylbenzene, and xylene isomers (BTEX) are of special interest because of their role in the tropospheric chemistry and their adverse health effects such as asthma, dizziness, fatigue, and eye, nose, and throat irritation [11,12,13]. BTEX are emitted into the atmosphere from gasoline and diesel-powered automobiles, residential heating, industrial emissions, and biogenic sources [14,15,16,17]. Once in the atmosphere, BTEX could react near the emission source or undergo transport depending on the atmospheric composition and meteorological conditions [18]. It is expected that the main degradation process in the gas phase during the day is the reaction with OH (hydroxyl radicals), resulting in a considerable contribution to photo-oxidant and secondary organic aerosol formation in the atmosphere [19]. The ratios of toluene/benzene (T/B) and m,p-xylene/ethylbenzene (MP/E) are considered to be useful indicators of atmospheric photochemical activity as well as the sources [20]. Assessing the impact of the lockdown on the BTEX atmospheric levels is important to the evaluation of the stay-at-home measures on the air quality during the pandemic period.
We report in the present work measurements of the concentrations of BTEX levels in a peri-urban area in France. The main objectives are: (1) to determine real time BTEX concentrations before, during and after the period of COVID-19 lockdown in Orléans, France; (2) to rationalize the obtained results based on the concentrations of secondary pollutants such as NOx and O3, particulate matter, and black carbon (BC); and (3) to investigate the effect of meteorological parameters such as wind speed, wind direction, and temperature on the diurnal BTEX variations during the studied period.

2. Materials and Methods
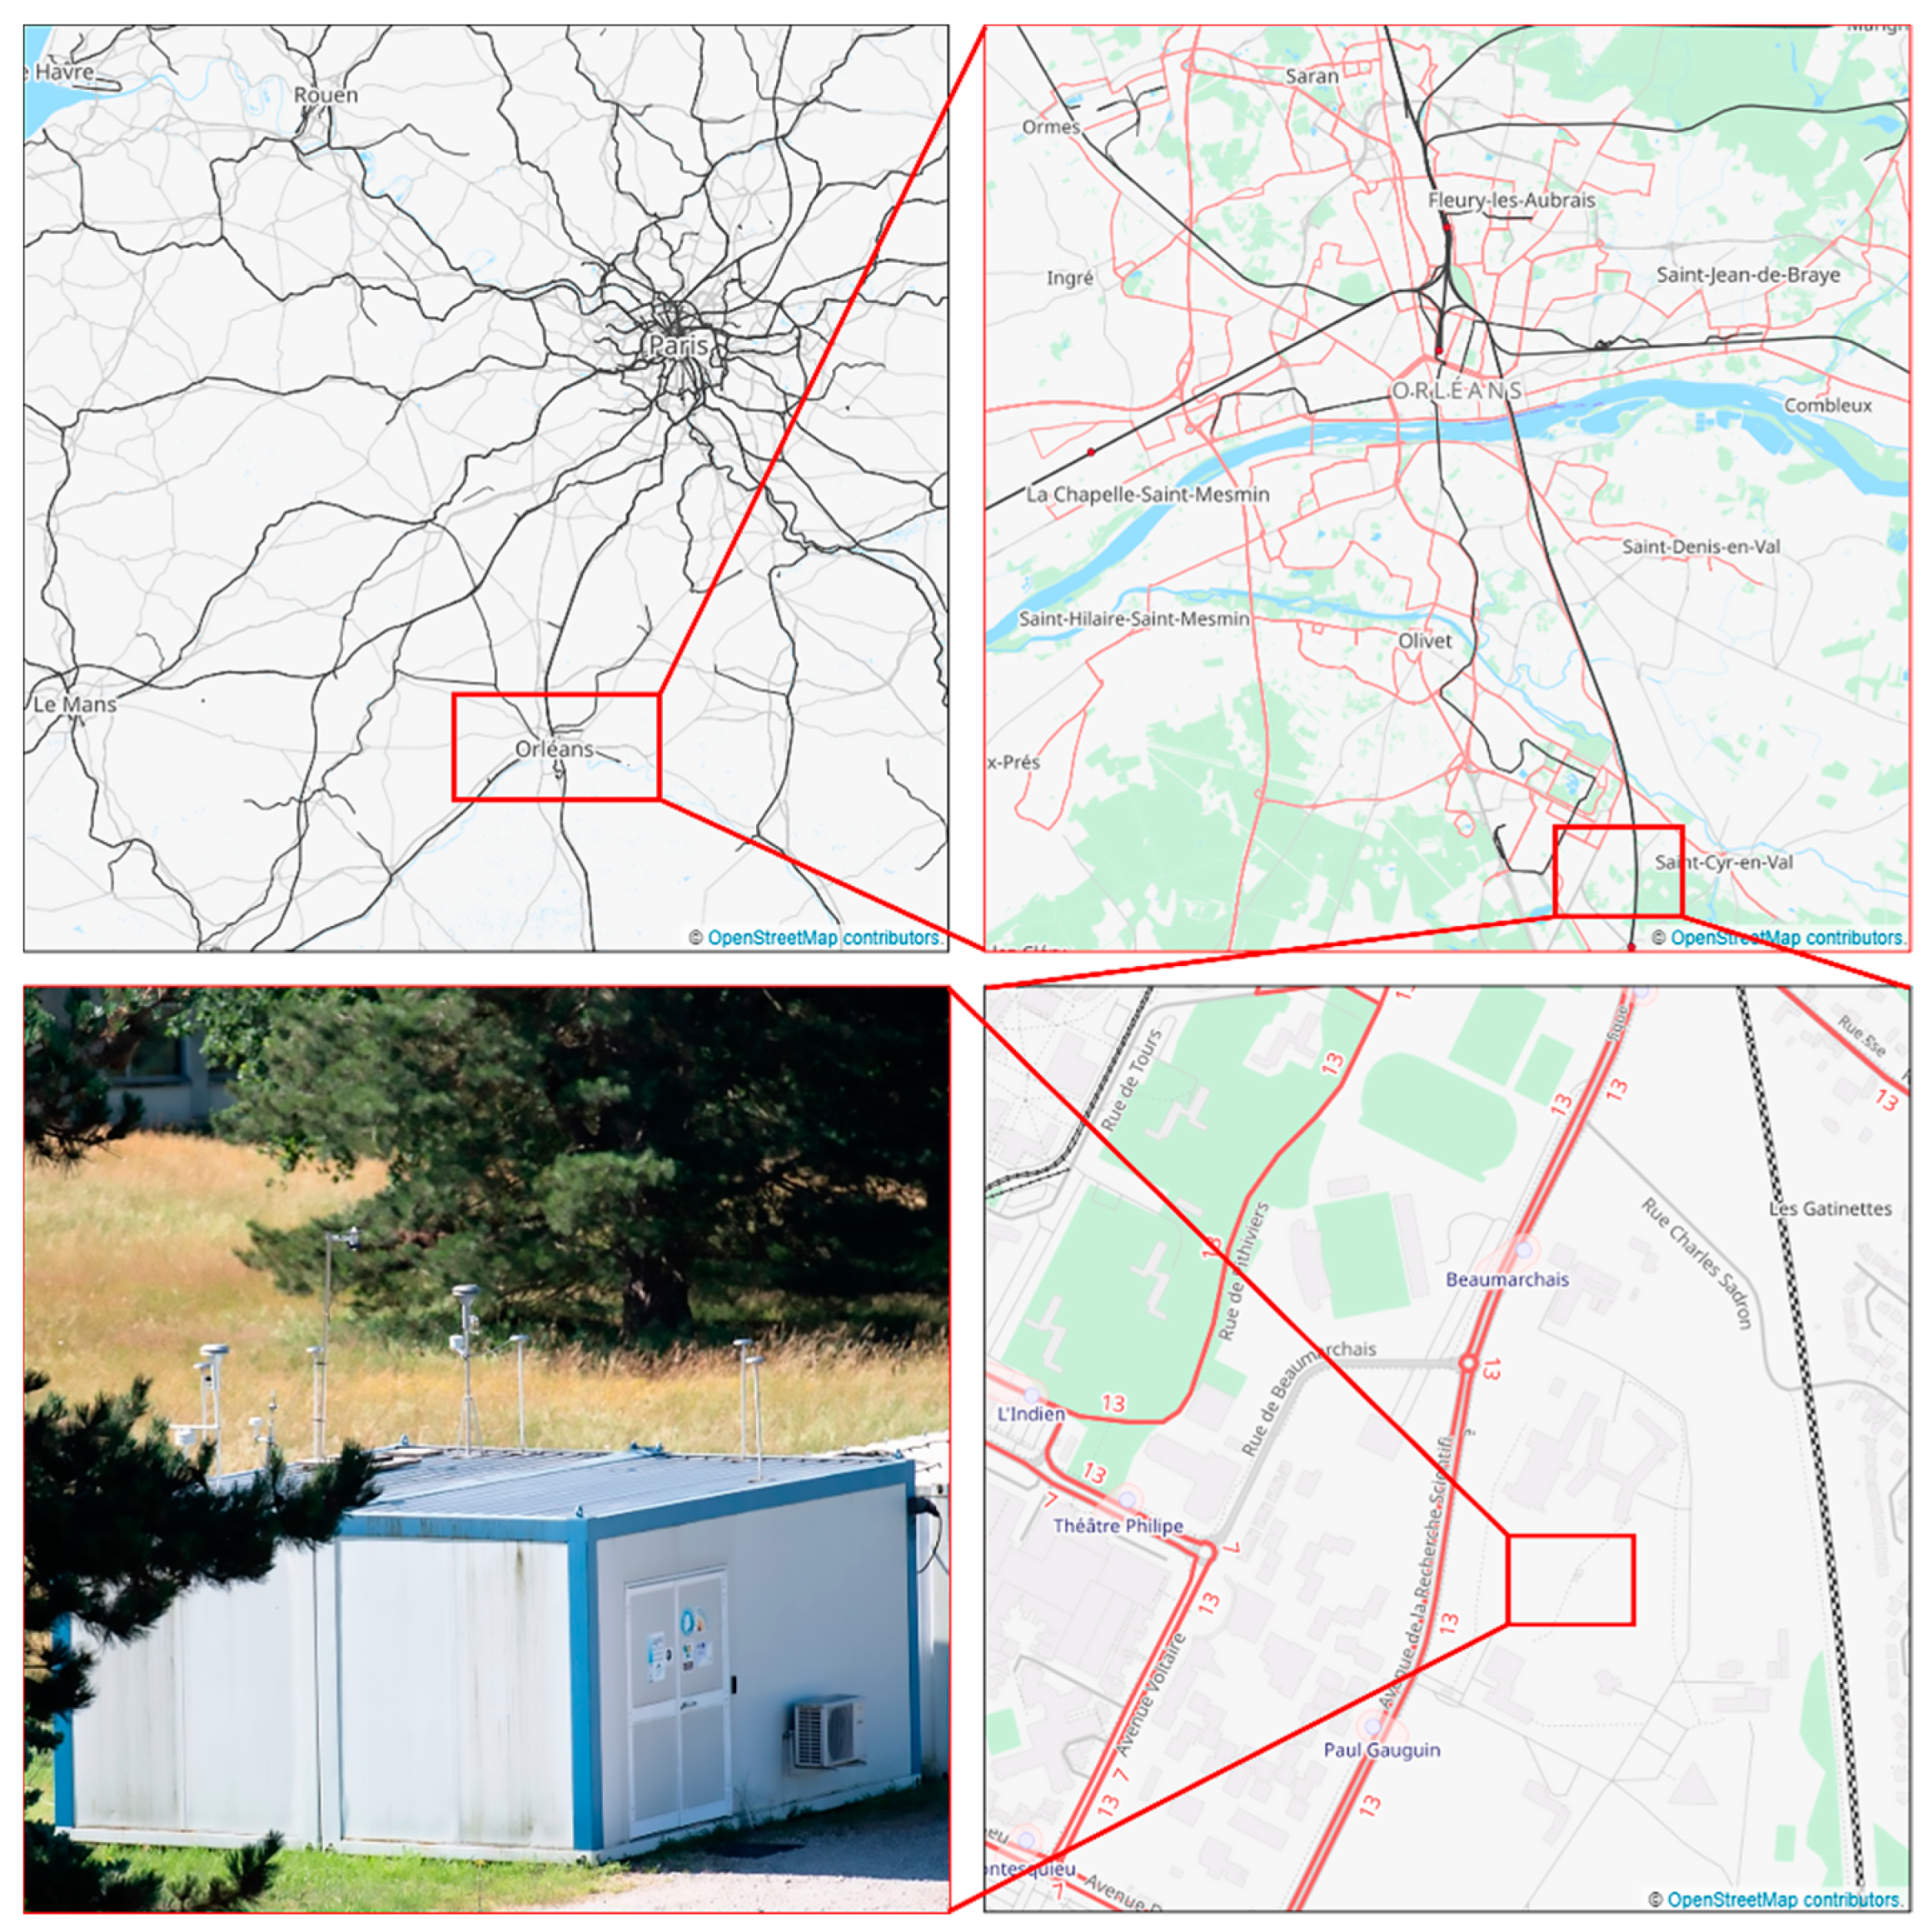
2.1. Sampling Site

As shown in Figure 1, the sampling site is positioned within the campus of the Centre National de la Recherche Scientifique (CNRS) about 10 km south from Orléans city center (47°50′17″ N, 1°56′39″ E). Orléans is the capital of the Centre-Val de Loire region, located in central France about 120 kilometers southwest of Paris, with a population of 300 thousand inhabitants. The site is close to a forest belt, and farms. There are no obstructing buildings around the sampling site within 50 m. The measurements reported in this study were made during the period from 26 February to 31 May in 2020.

2.2. Instrumentation

2.2.1. BTEX Measurements

An automated online gas chromatographic system (GC-FID, AirmoVOC C6–C16 Chromatotec®, Val-deVirvée, France) was used for in situ BTEX measurements with a time resolution of 40 min. Ambient air was sampled continuously from an inlet mounted at a height of 4 m above the ground through a Teflon tube (length 2.5 m, diameter 1/4 inch) at a 16 L min−1 bypass flow, and then entered the trap at a flow rate of 45 mL min−1 through a heated stainless-steel tube (length ~1.5 m, diameter 1/8 inch). This sampling setup could ensure a short residence time in the sampling line and improve the sampling efficiency of the C6–C16 VOCs. The volume of air samples was 1350 mL for a 30 min sampling period. The trap was heated to 380 °C within 4 min. VOCs were thermally desorbed and injected into capillary columns (analytical column: MXT 30 CE, film thickness: 1 µm, id: 0.28 mm, length: 30 m) with H2 around 3–4 mL min−1 for separation before detection. The temperature ramp of the capillary column (a plot of temperature vs. time is provided in Figure S1 in the supporting information) was set as follows: increased from 38 to 50 °C at a rate of 2 °C min−1; increased to 80 °C in 3 min; increased to 220 °C at a rate of 15 °C min−1, then went to 230 °C at a rate of 2 °C min−1; finally reached 269 °C at a rate of 9 °C min−1 and held for 3 min. A flame ionization detector (FID) set at 200 °C was used for quantification.
The accuracy of the system (quantification and identification) was controlled every 12 h using an automatic calibration system, which is equipped with four internal permeation tubes containing four internal standards (benzene, n-butane, n-decane, and n-hexane). The detection limits for benzene, toluene, ethylbenzene, m, p-xylene, and o-xylene were ~5 pptv.

2.2.2. NOx, O3, PM10, and BC Measurements

The concentrations of ozone (O3), NOx (include NO and NO2), BC, and particulate matter with a diameter less than 10 µm (PM10) were provided by the air quality monitoring agency at the Centre-Val de Loire region by Lig’Air (http://www.ligair.fr/, accessed on 15 December 2021). These species were monitored at the same location as the BTEX measurements reported in the present work. Ambient air was sampled continuously from separate Teflon tubes (diameter 1/4 inch) at a height of 1 m above the roof of the container and about 4 m from the ground. BC was measured continuously at 1 min intervals using an aethalometer (AE33 model, Magee Scientific, Berkeley, CA, USA). The O3 and NO–NOx concentrations were continuously monitored by UV absorption (Thermo Scientific™ Model 49i, Waltham, MA, USA) and chemiluminescence (Thermo Scientific™ Model 42i, Waltham, MA, USA), respectively. A DIGITEL DHA-80 high volume aerosol sampler was also used for PM10 sampling. Most of the data processing and figures were performed using the R software environment [21] and particularly the Openair package, designed by Carslaw et al. [22].

2.2.3. Meteorological Data

The meteorological data were used from Orléans-Bricy air base station (https://www.infoclimat.fr/, accessed on 15 December 2021).) due to missing data for several weeks during lockdown from the measurement site.

3. Results and Discussion
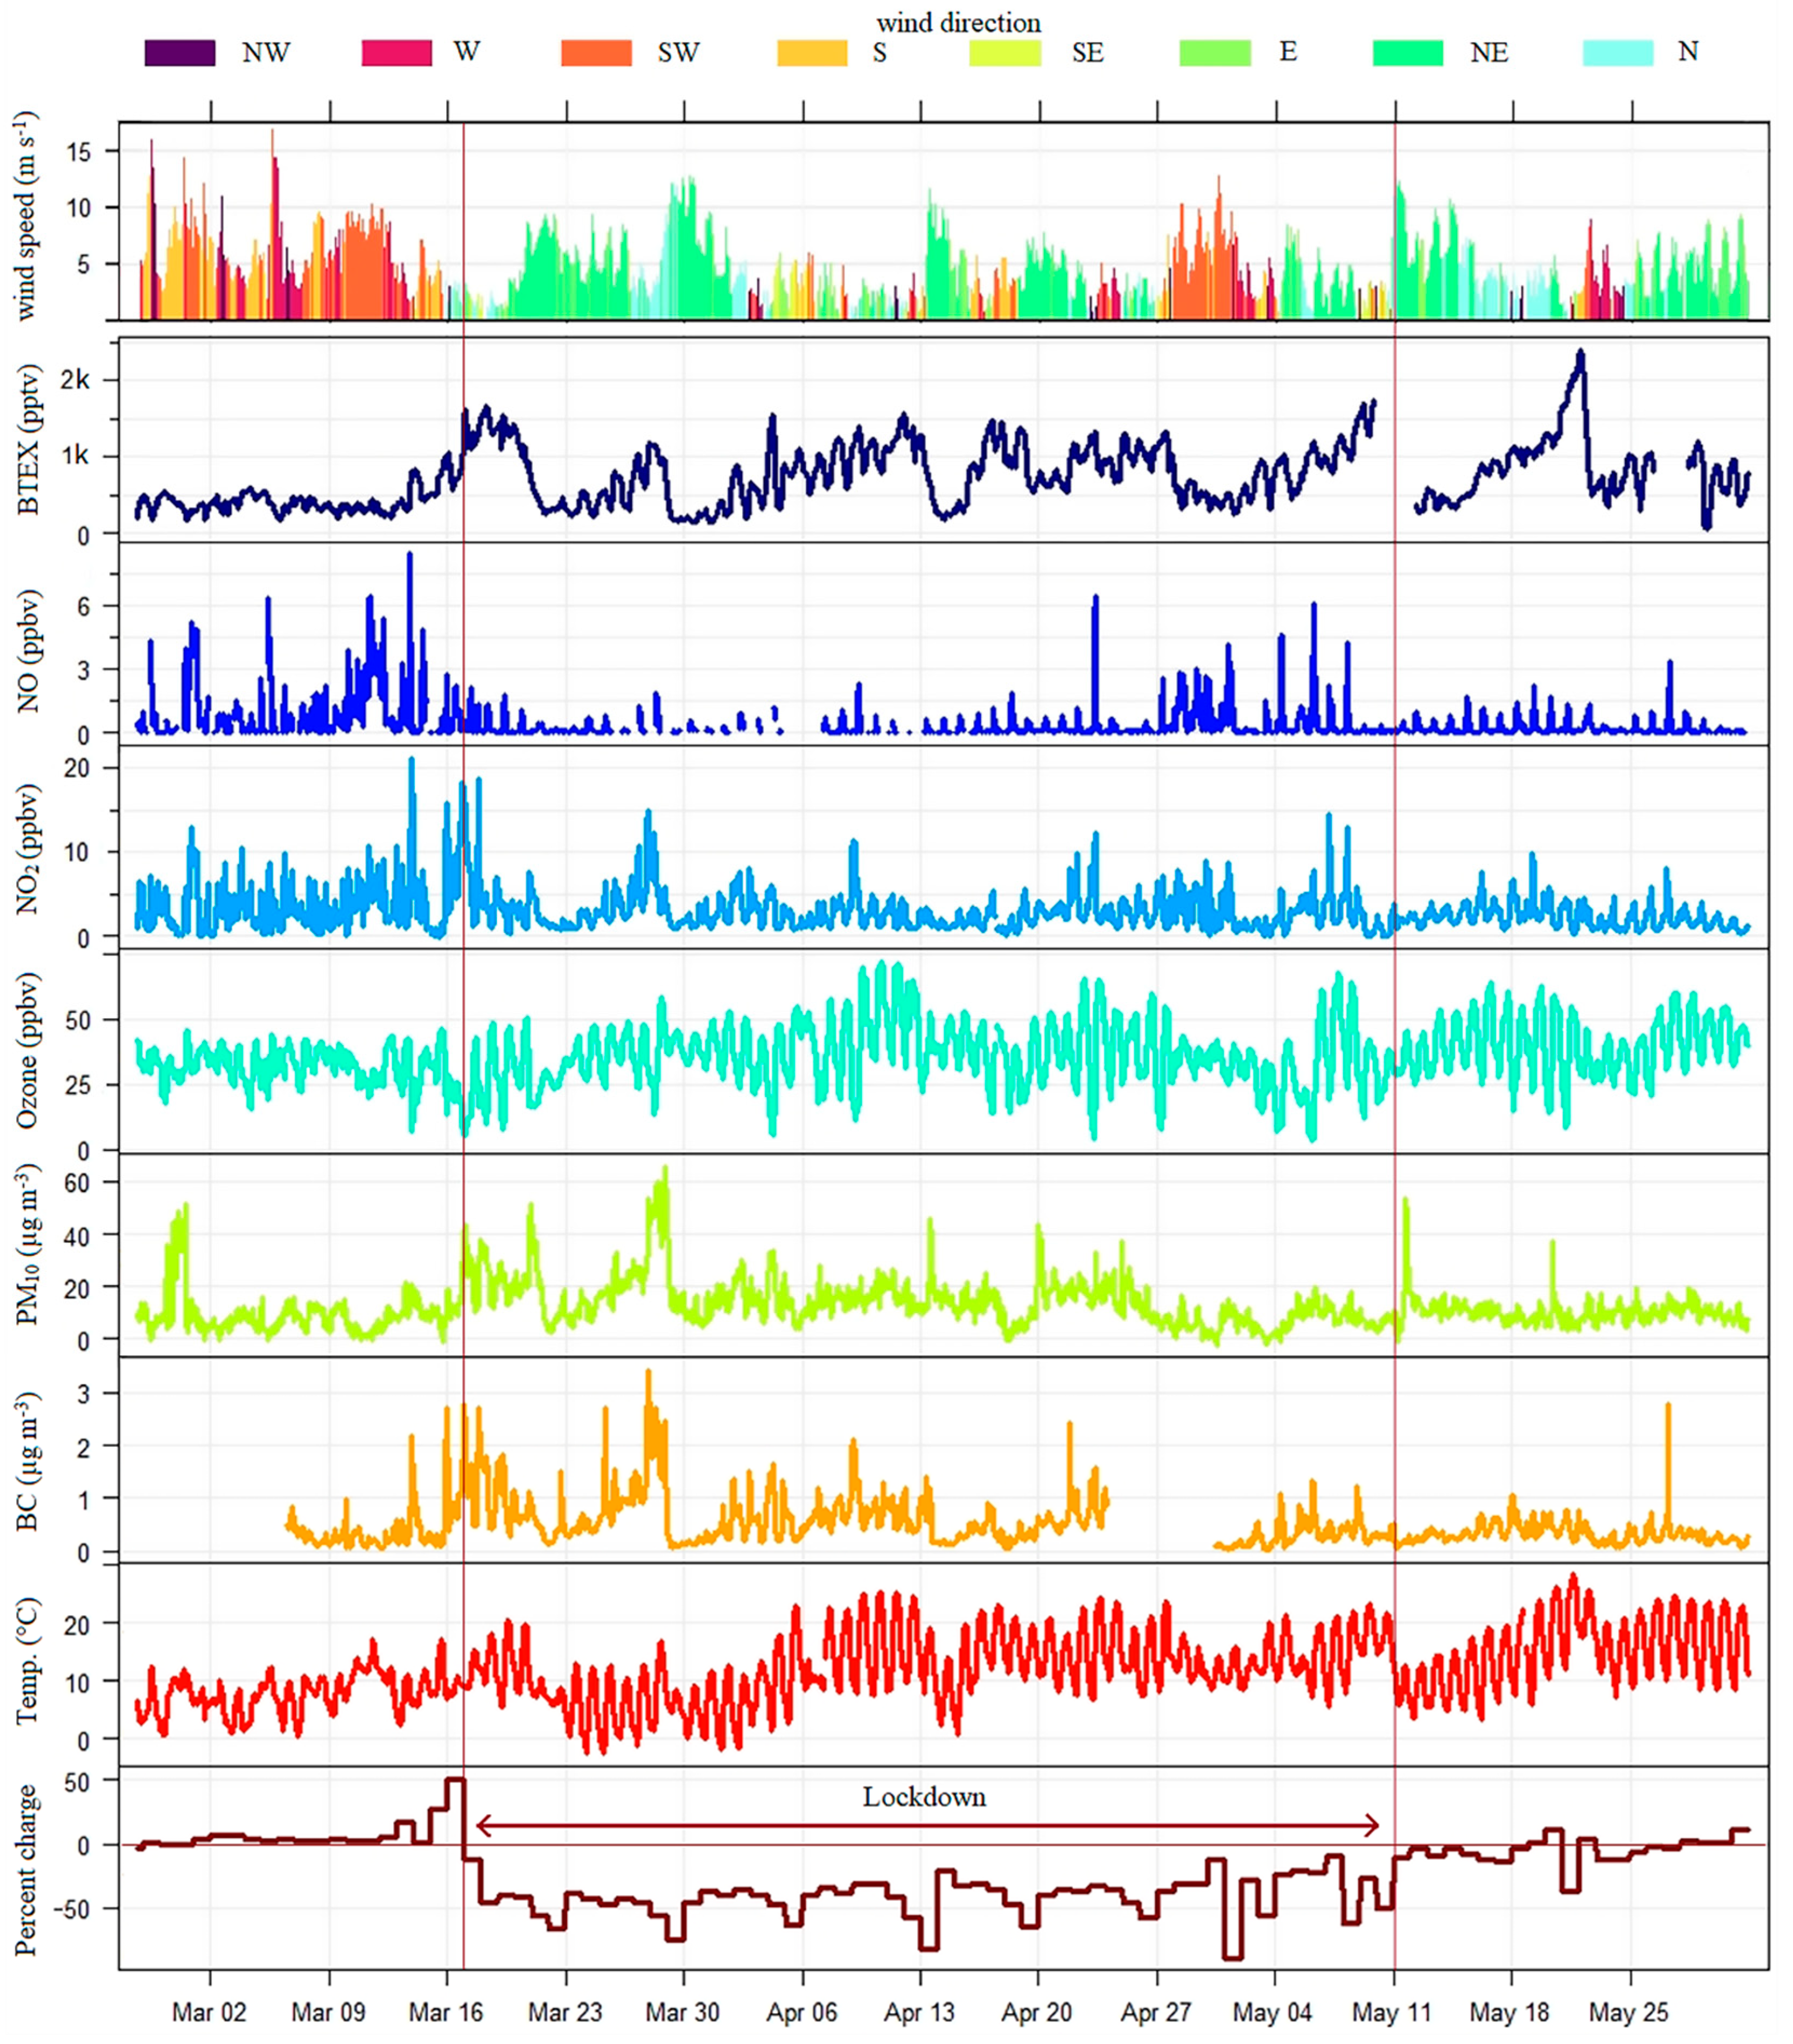
3.1. Data Overview

The measurement period (26 February to 31 May 2020) was divided in three periods (a) before lockdown (26 February–16 March), (b) during lockdown (17 March–10 May), and (c) after lockdown (11 May–31 May). Average BTEX mixing ratios along with their associated arithmetic mean and interquartile range (IQR) in each period are listed in Table 1. Benzene and ethylbenzene were the most abundant BTEX compounds throughout the study period. On average, the highest concentrations of BTEX were observed during and after the lockdown.
The temporal variations of BTEX, NO, NO2, O3, PM10, BC, temperature at this site, and meteorological parameters (wind speed in m s−1 and wind direction in a color-coded way) during the measurement period are illustrated in Figure 2. Furthermore, the relative changes in daily regional mobility data from the Google Community Mobility Reports (https://www.google.com/covid19/mobility/, accessed on 15 June 2020)) were also used for this analysis (the bottom of Figure 2). The reports chart movement trends over time by geography, across different categories of places such as retail and recreation, groceries and pharmacies, parks, transit stations, workplaces, and residential. These reports are created with aggregated, anonymized sets of data from users who have turned on the Location History setting, which is off by default. This provides a breakdown by category (grocery stores, parks, residential, workplaces, transit stations, and retail) in changes to daily movement at a regional level. The data “percent charge in the grocery and pharmacy” was used to perform the comparisons along the studied period.

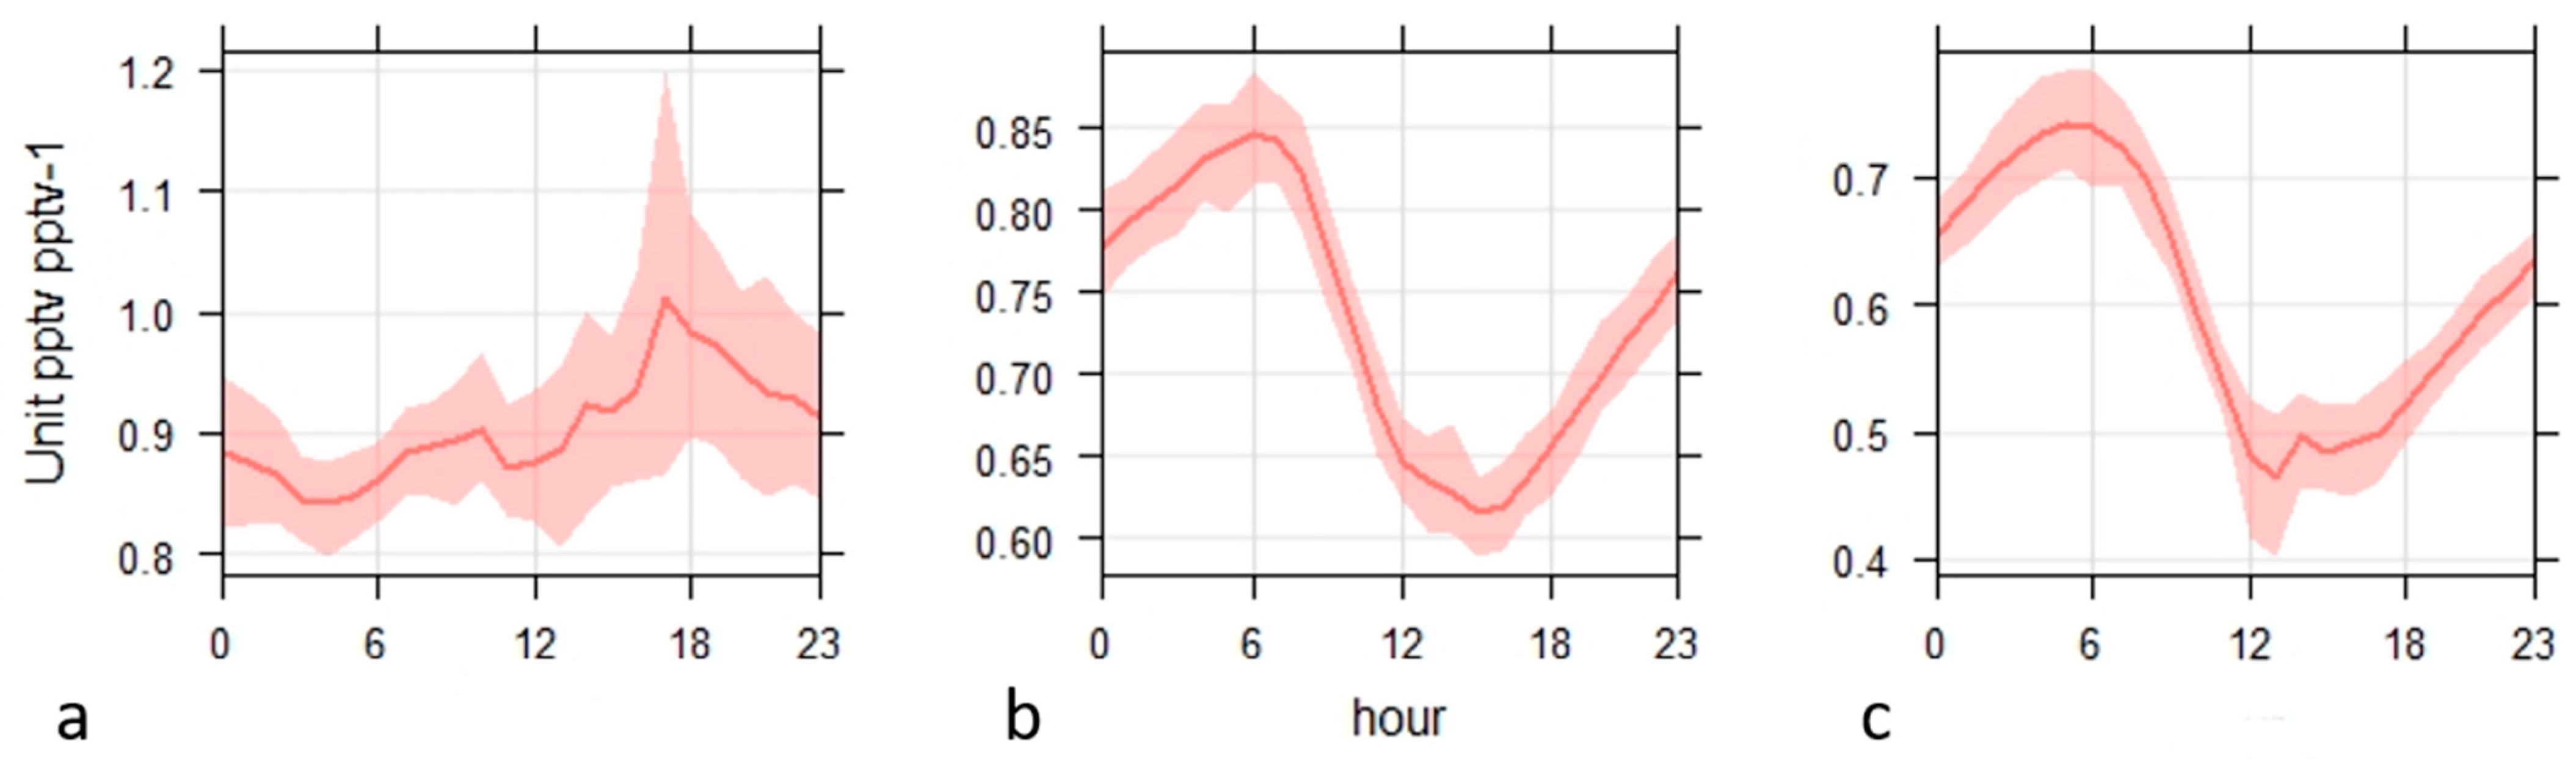
3.2. Diurnal Variation and Correlations

The study of diurnal variations of air pollutants could provide valuable information about the sources, transport, and chemical formation/destruction of such pollutants. The diurnal variations of the BTEX, BC, PM10, NOx, and O3 during the present study are shown in Figure 3 (a series of diurnal variations in benzene, toluene, ethylbenzene, m,p-xylene and o-xylene mixing ratios before, during and after lockdown are provided in the supporting information, Figure S2).
BTEX concentrations have been observed to be generally higher during the night than daytime. The concentrations–time profiles show a decrease of the total BTEX from around 6 am to around 3 pm in the three periods. This is likely to result from a combination of effects such as photochemical reactions, an increase in the atmospheric mixing depth, and/or a reduction in emission rates [23]. During the afternoon, an increase in concentration is observed around 3 pm. This increase is observed during the period before the lockdown, which could be attributed to traffic emissions and home heating fuels consumed in winter in the late afternoon. Some subtle changes in the diurnal pattern of BC concentrations can be observed before, during, and after lockdown. It appears, for example, that pre-lockdown, there were small concentrations throughout the day, increasing steadily into the night, which could reflect people heating their houses during the cold hours of the evening. During lockdown, BC is present in higher concentrations in the early to mid-morning period, decreasing over mid-day. This could potentially indicate changes in living habits as people are working from home and are needing to heat. This is also seen post-lockdown, since many people remained working from home during that period, although the levels were lower probably as a consequence of the warmer ambient conditions. The highest correlations between BC and PM10 were observed during the lockdown, which may indicate a common, possibly wood-burning source. The diurnal profiles of NOx were not very distinct before lockdown, and show typical diurnal variability during and after lockdown, which be a consequence of a difference in wind direction before lockdown. No clear influence of lockdown was observed in the diurnal profiles of ozone.
Moreover, a strong correlation coefficient (r = 0.83) was obtained for ethylbenzene/xylene isomers before the lockdown (Figure 4a). This fact suggests that both compounds could be emitted from common sources [24]. Toluene is also widely used as a solvent in paint manufacture, the production of adhesives and glues, while benzene emissions could be mainly due to wintertime domestic heating combustion in France [25]. During the lockdown (Figure 4b), the high correlations among all the BTEX suggests that the contributions are likely to be emitted by the same sources. The correlation becomes even stronger after the lockdown period as shown by Figure 4c, which indicates that the sources of BTEX were becoming increasingly homogenous.

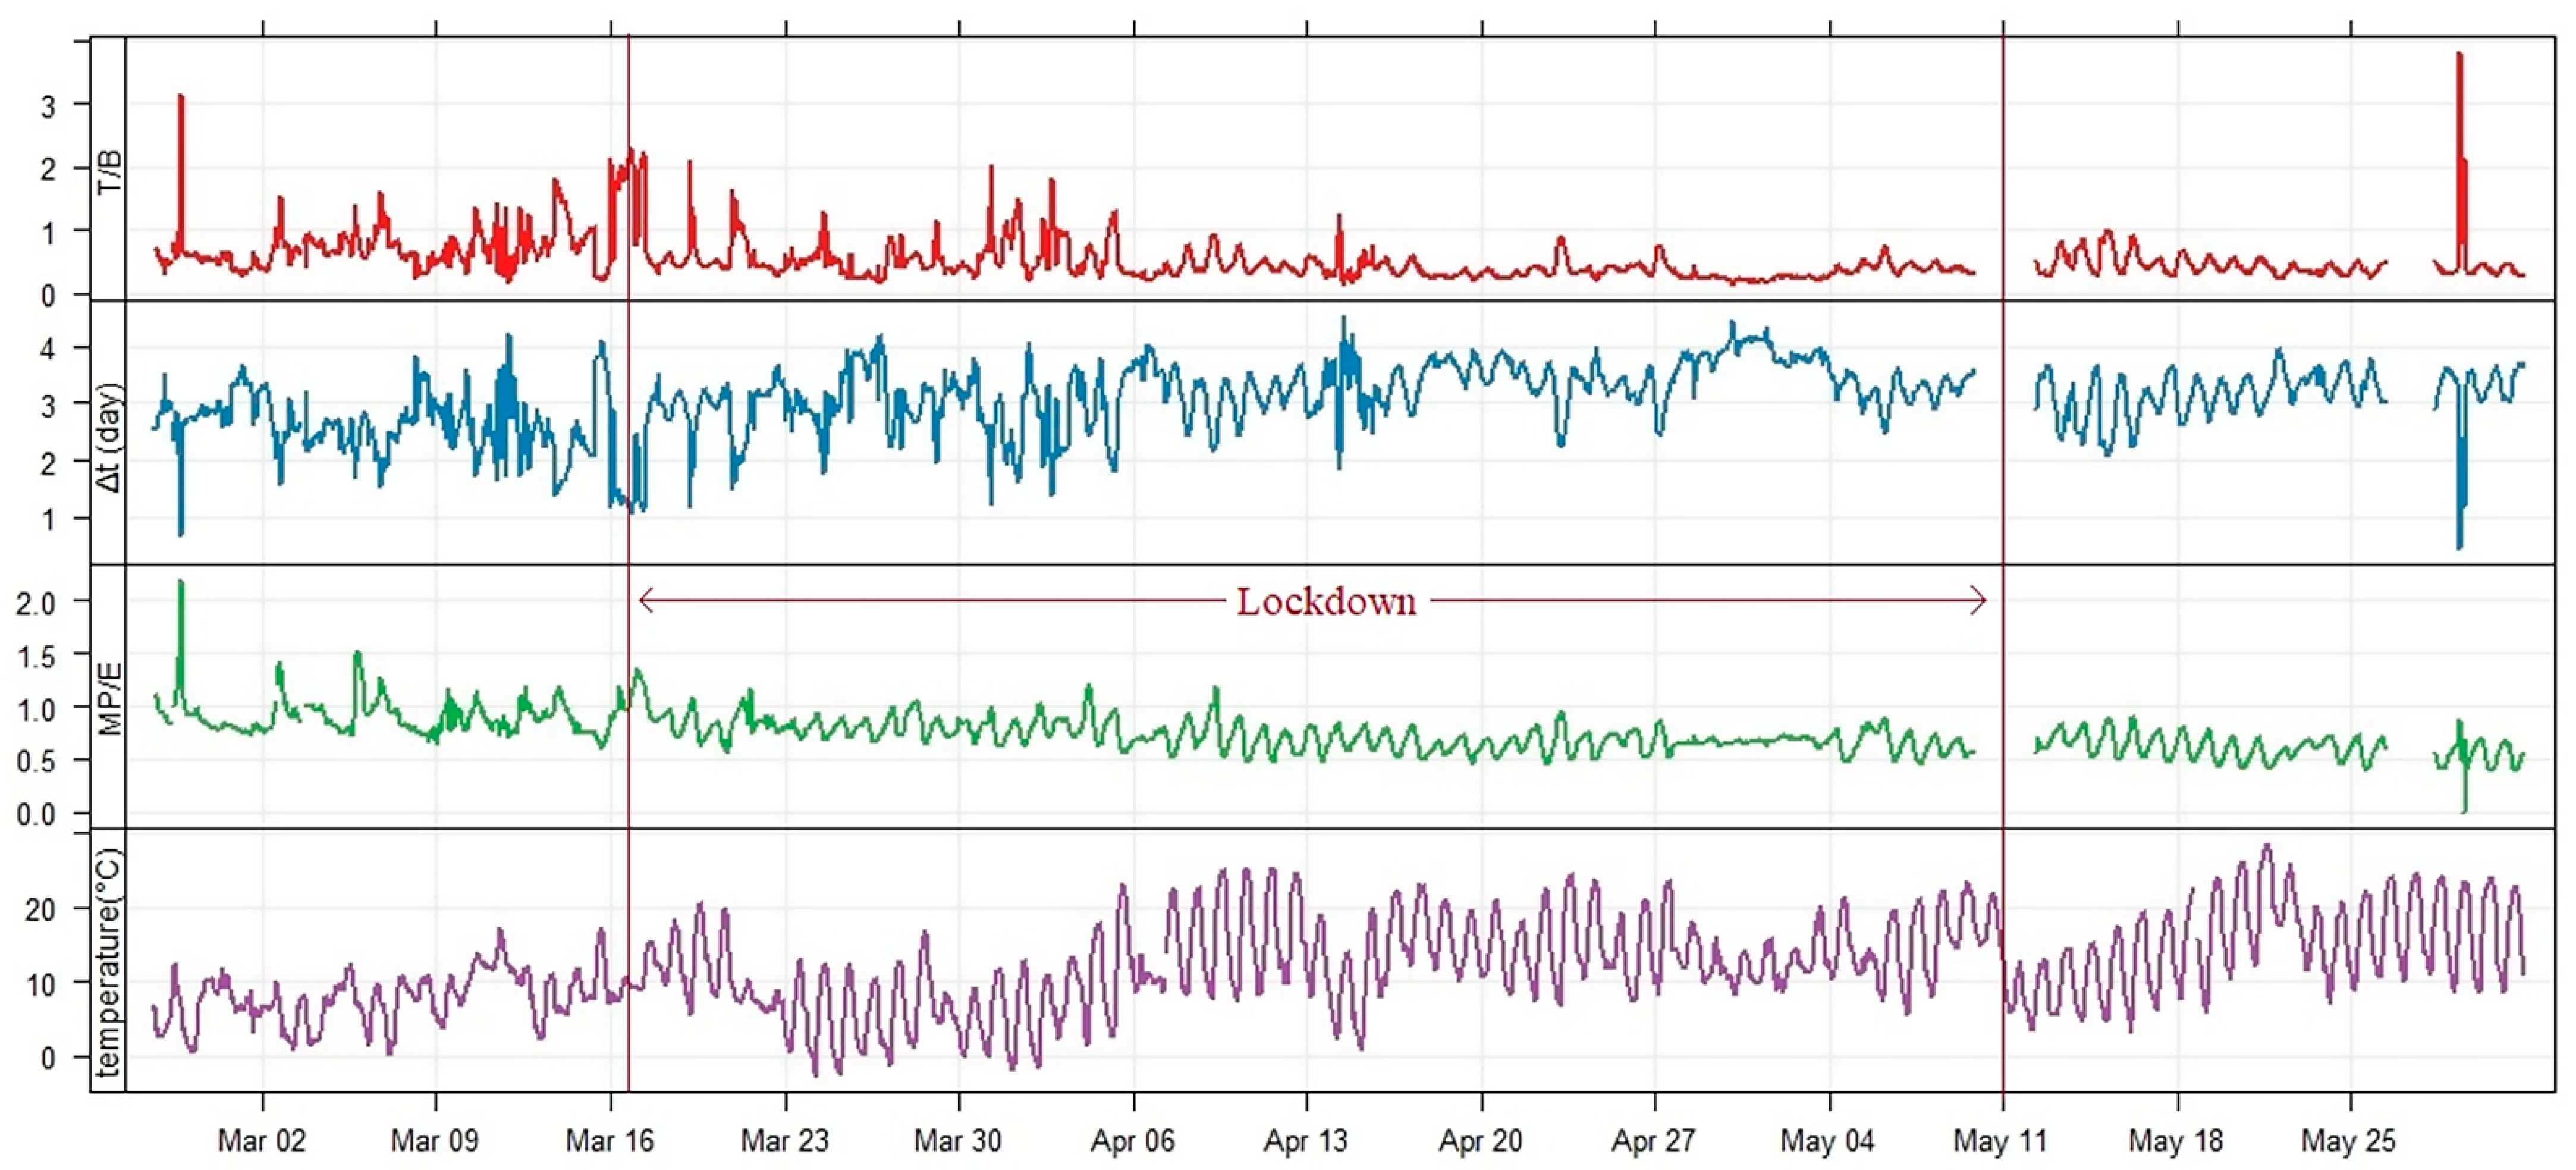
3.3. BTEX Ratios Assessment

The Toluene/Benzene ratio (T/B) is often used in BTEX source apportionment studies [26]. It is a tool for characterizing the distance from (and age of) vehicular emission sources. While toluene emissions are associated with traffic and industries, benzene from these sources has been reduced as a consequence of gasoline regulations. The principal source of benzene in France is therefore likely to be residential heating [27].
It can be observed in Figure 5 that the T/B ratio falls below 1 in general, with some higher values observed in the first week of lockdown. This suggests that there were no major changes in BTEX sources during our study period, which is surprising, given the decrease in transport activities and the change in the population’s daily routines during lockdown. When the location of the measurement site in Orléans is considered in relation to potential BTEX sources in Paris, the T/B ratios < 1 that we observe are broadly consistent with the measurements of Salameh [28], who show that in suburban sites such as Melun and other locations on the outskirts of Paris, T/B ratios are close to 1. Nevertheless, it is possible that a significant contribution of the benzene concentration comes from residential heating as mentioned above. Temperature was not a strong determinant of T/B, which suggests that evaporation rates were not the major control on this ratio in our study.
In this study, the photochemical age was used to estimate the origin of the air masses. Its definition depends on the fact that the more reactive chemicals are consumed faster than the less reactive ones, so that as an air mass ages there are systematic changes in concentration ratios [29]. The T/B ratio in the sampled air as described by Roberts [30]:
Δ t = 1 [ O H ] ( k t o l u e n e k b e n z e n e ) × [ ln ( [ t o l u e n e ] [ b e n z e n e ] ) 0 ln ( [ t o l u e n e ] [ b e n z e n e ] ) t ]
where ktoluene and kbenzene are the rate coefficients for the reaction with OH (ktoluene = 5.63 × 10⁻¹² and kbenzene = 1.22 × 10⁻¹² at 298 K in cm3 molecule−1 s−1 [31]. [OH] is the average concentration of the OH radical (2.1 × 10⁶ molecule cm−3, [32]). The initial emission ratio of T/B was set to 1.69 (initial value of B/T = 0.59), taken from Airparif station, which is located on the roof of the main Airparif building, close to busy roads, in the Paris city center [33].
It can be seen from Figure 5 that when the T/B ratio increases, the photochemical age decreases. For example, on the evening of 13 March and the early morning of 16 March, it is as low as 1.37 and 1.14 days, respectively. This suggests that the pollutants are fresher and the source of the pollution is relatively close to the site (100~300 km). In most of the observation period, the photochemical age is more than 3 days, indicating that long-distance air transport could contribute to the air pollution in this region (> 500 km).
The m,p-xylene to ethylbenzene (MP/E) ratio could also be used to evaluate the age of air parcels and as an indicator for the photochemical age of the VOCs in the atmosphere. The xylenes are more reactive towards the OH radical than ethylbenzene so the low ratio of MP/E could be used as an indication of an aged air parcel. Relatively constant MP/E ratios ranging from 2.8 to 4.6 with a mean value of 3.5 due to near traffic exhaust emissions have been previously reported [34]. MP/E ratio along the studied period is presented in Figure 5. MP/E ratios average shows a quite small but noticeable difference before (0.87), during (0.72), and after (0.59) the lockdown. The values in the three periods suggest a rather aged air parcel, and the decreasing trend is an expected effect due to the increase in solar radiation as the spring season approaches. During and after lockdown the variation in the MP/E ratio reaches its maximum value before sunrise and its minimum at mid-afternoon (Figure 5), in agreement with what is expected for a photochemically aged air parcel [35]. On the other hand, before the lockdown, this cyclical variation in the MP/E ratio between day and night is not clearly observed, this may be due to the different emission sources during winter (Figure 6). Figure 2 shows that the prevailing wind direction changed significantly after the first period. This is likely to have also a strong effect, transporting air from different locations with different distance.

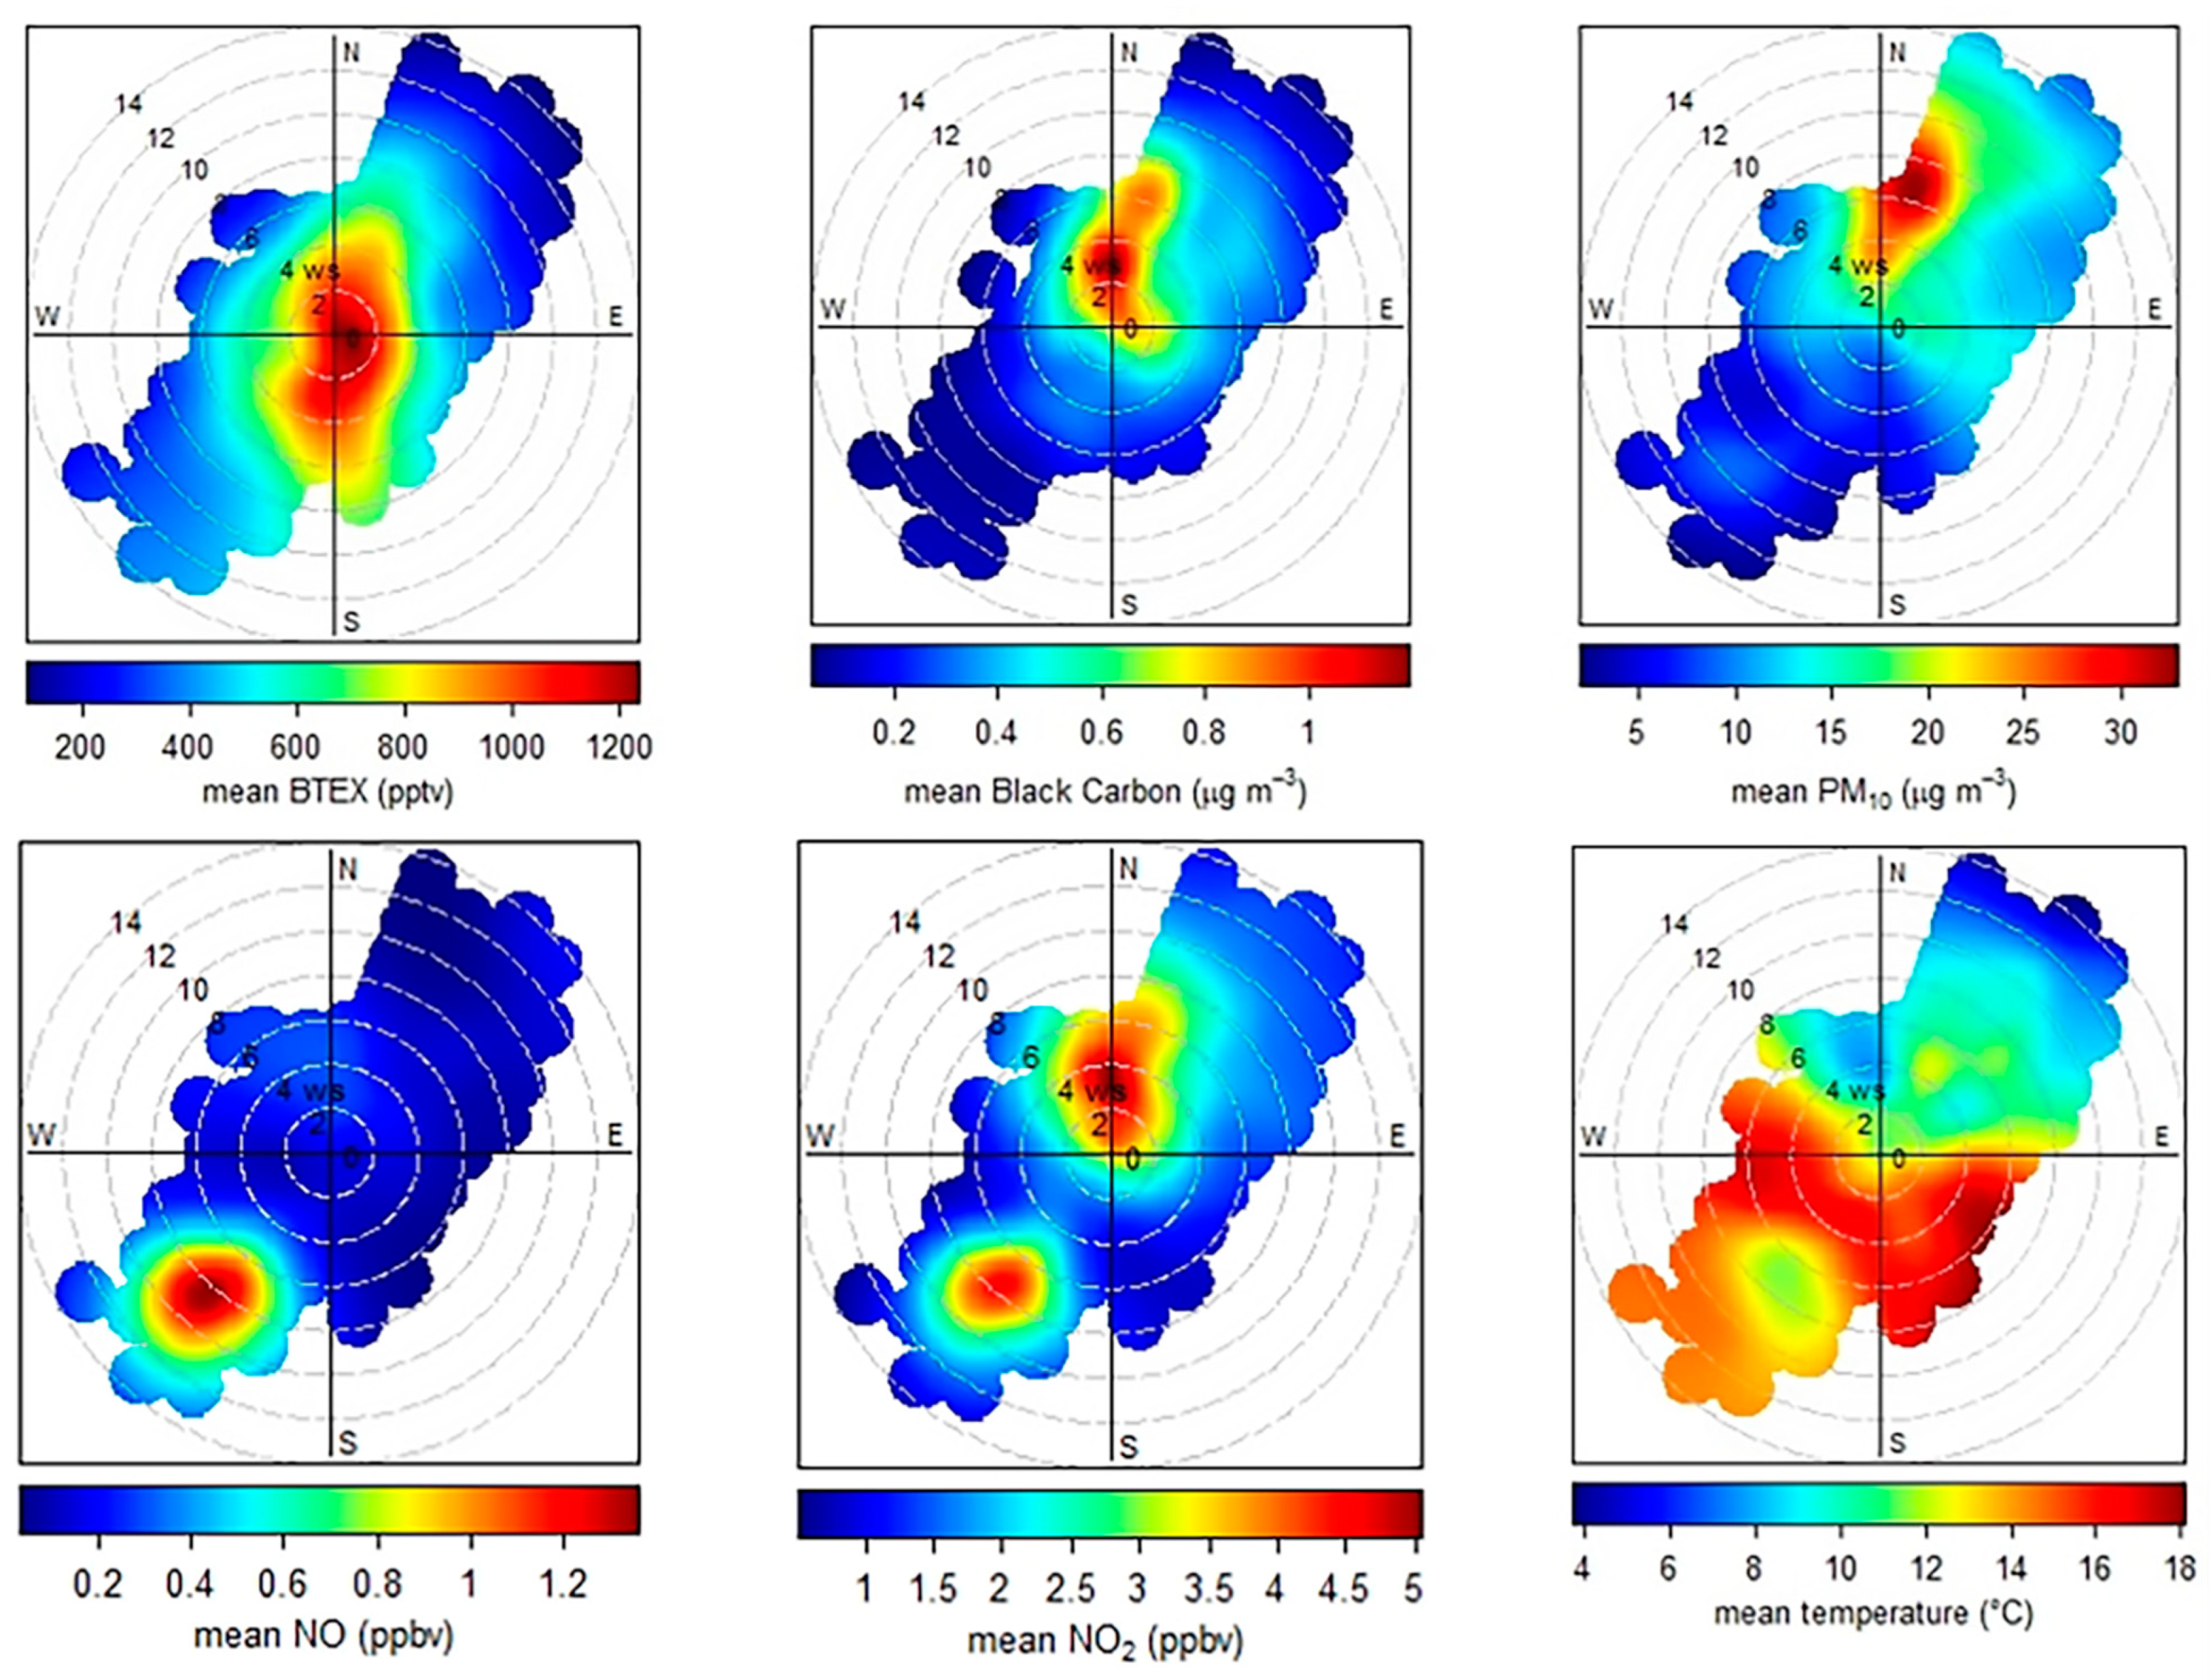
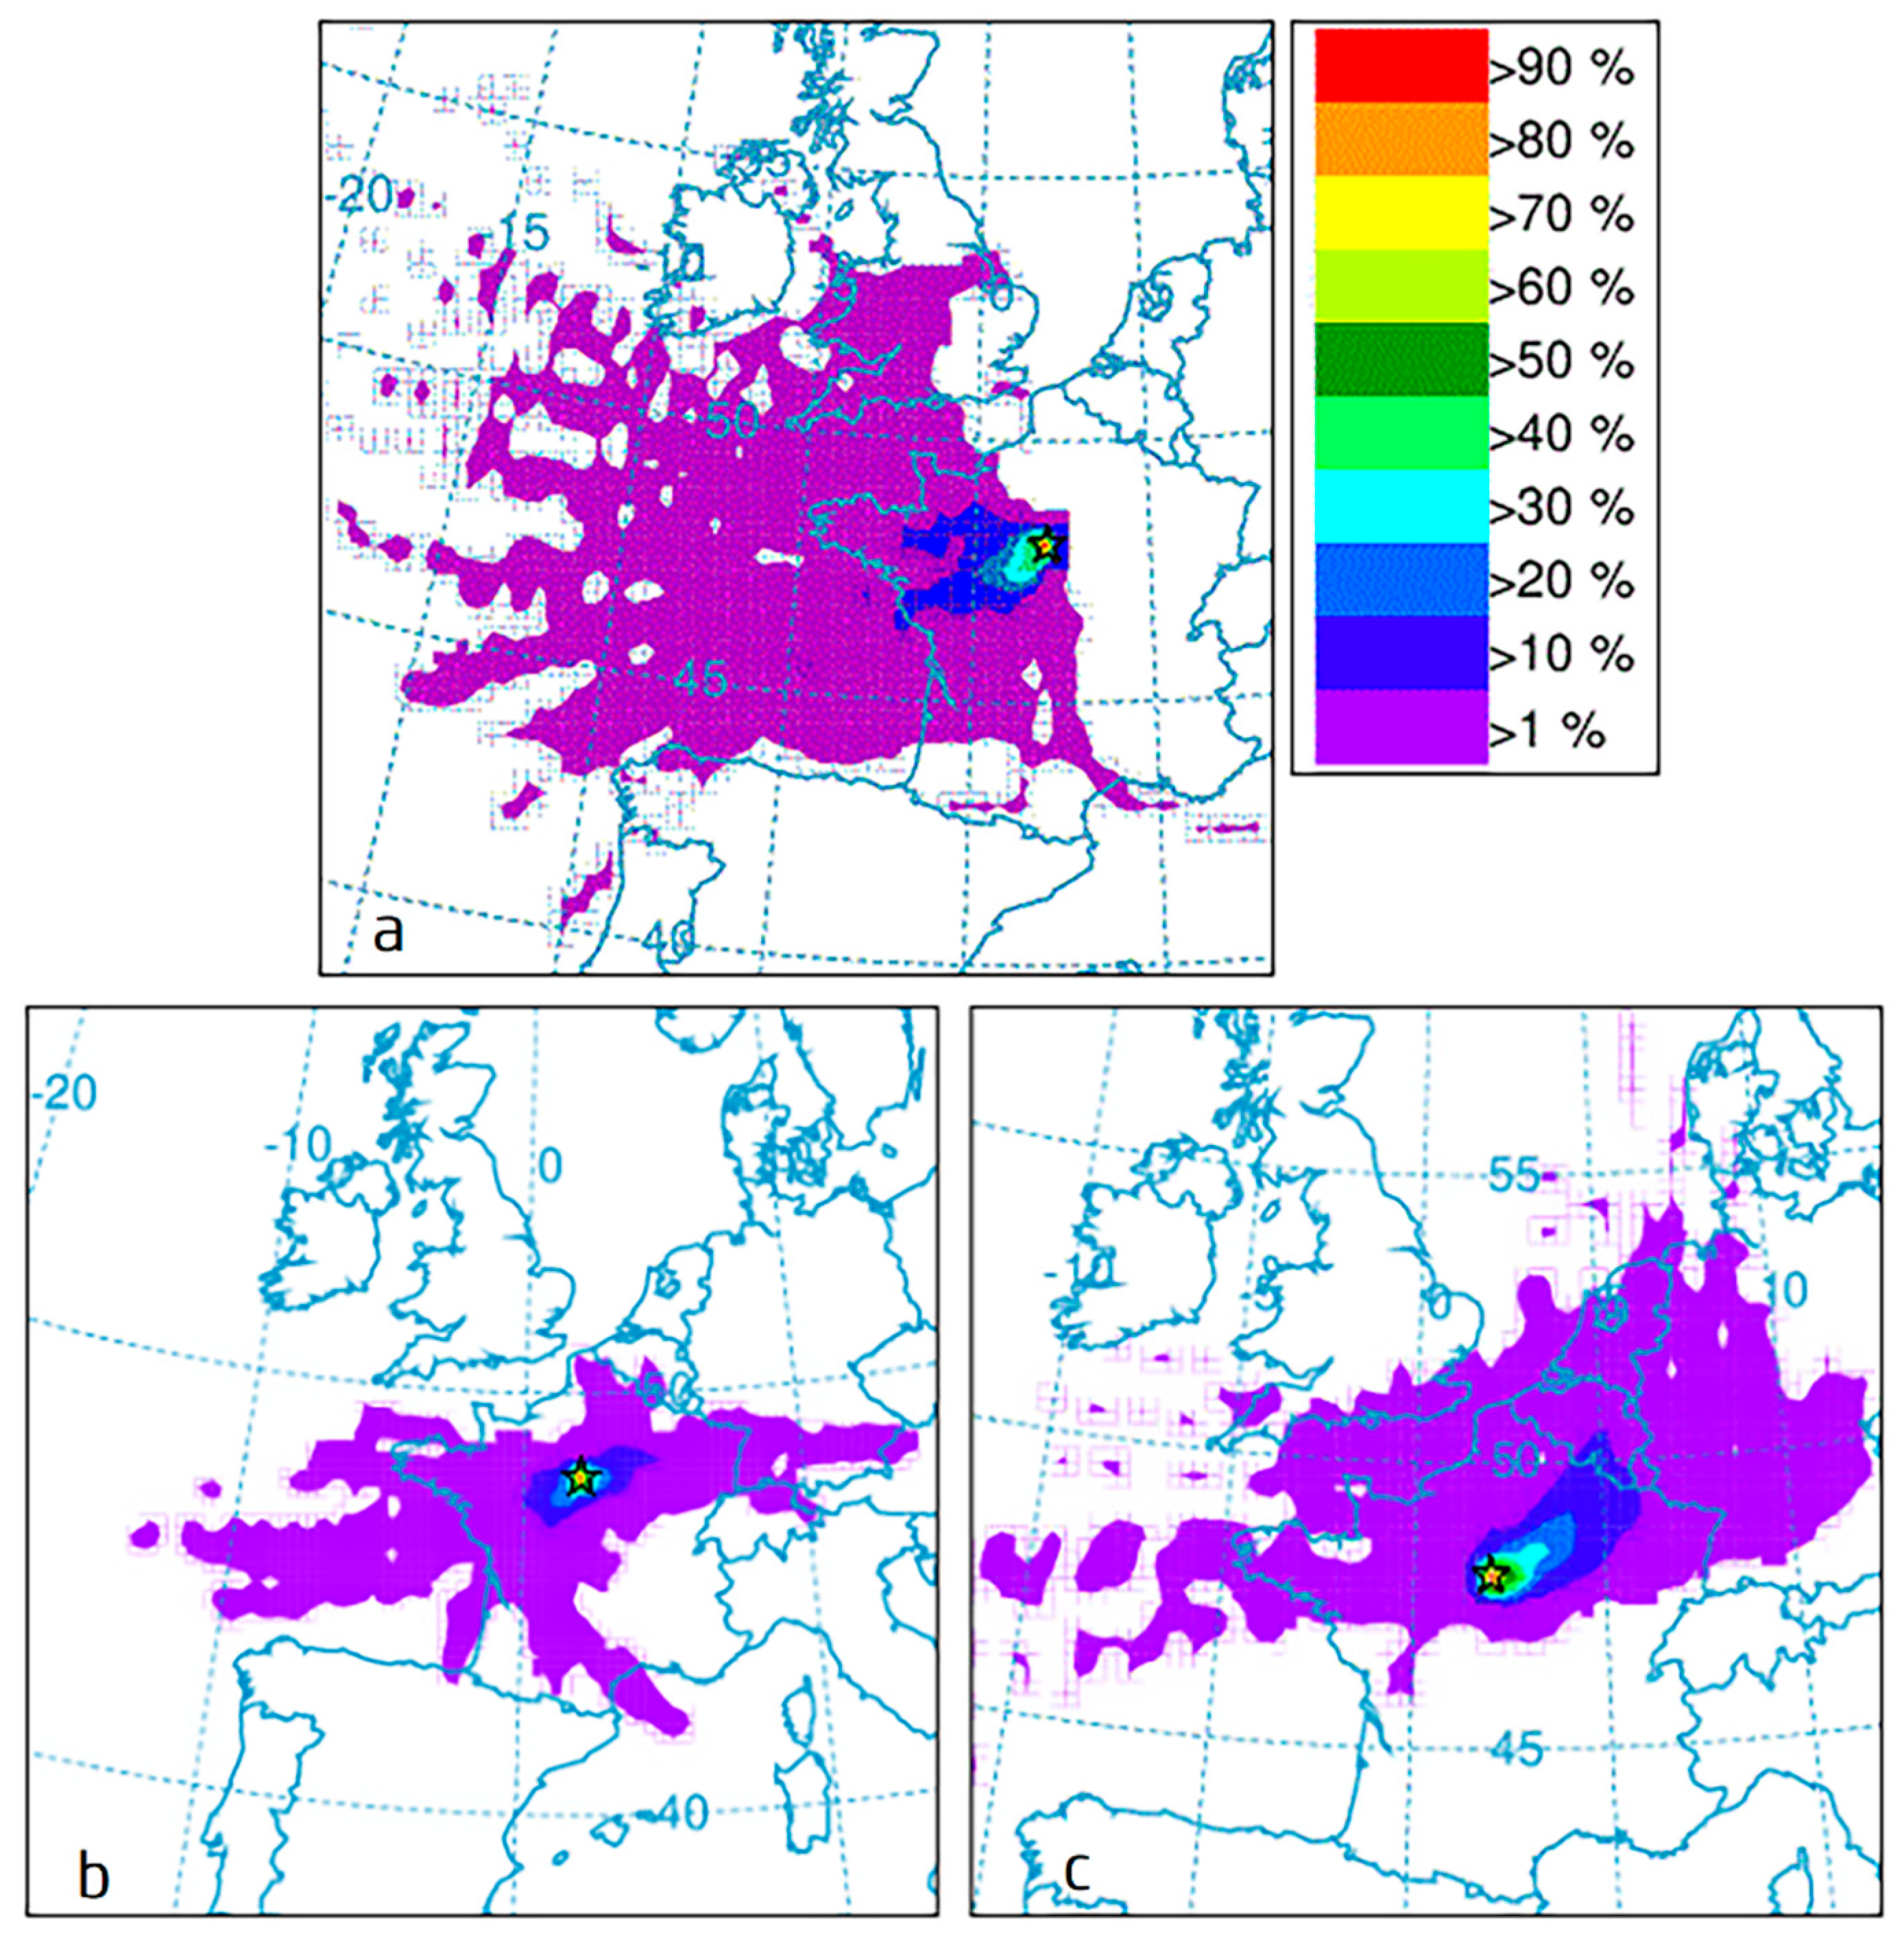
3.4. Impact from Community Mobility and Meteorological Effects on the Measured BTEX

In order to get a better understanding of the BTEX sources we made a series of supporting measurements including meteorological information, O3, NO, NO2, PM10, and BC. For this purpose, we investigated correlations over four episodes taken from the whole period of investigation: before lockdown (26 February–12 March), declared lockdown (13, 15 and 16 March), lockdown (17 March–10 May), and after the lockdown (11 May–31 May). Figure 7 shows correlation coefficient between BTEX, O3, NO, NO2, PM10, BC, and temperature (T) for each period.
BTEX average concentrations were relatively low before lockdown, with an average mixing ratio around 402 ± 143 pptv. Nevertheless, on 13 March and 15–16 March, two higher concentration peaks of BTEX were detected, with about 820 and 1040 pptv, respectively. To better understand the possible causes and identify the main contribution sources for these particular events, correlation coefficients were calculated using the corresponding data of these particular days as shown in Figure 7b. From this figure, it can be seen that there was a high positive correlation (r = 0.90) between BC and NO2, but BTEX did not correlate very well with either of them (r = 0.51 with NO2 and r = 0.63 with BC), suggesting that it could be another source besides fuels and/or biomass burning [36].
During the same period, the warm weather would suggest that it is less likely that the burning of wood for home heating represented a significant source, however, given the extremely different daily schedules of people during this timeframe, it remains possible that residential heating was a contributing factor. Considering these facts, BTEX concentration increase during these episodes could be related to transportation emissions rather than other sources. This may be linked to the announcement of official measures to be implemented in order to prevent the spread of COVID-19 on 12 March. Similarly, for 15 and 16 March with the order from the French Government to close all non-essential public places and businesses, including restaurants, cafes, shops, and entertainment venues from 14 March in order to limit social movements. To support this hypothesis, the Google Community Mobility Reports data for Friday 13, Sunday 15, and Monday 16 of March were also used. From these data, displayed in Figure 2, it is possible to observe a substantial increase in the mobility of people (percent change) on the same dates where the maximum concentrations of BTEX were observed. Considering this, it could be speculated that most of the emissions detected during 13, 15, and 16 March were strongly related to the local use of transport vehicles on an elevated scale to visit pharmacies and grocery stores.
During the lockdown, social mobility decreased significantly as it can be seen from the relative changes in the Mobility Reports (Figure 2). At the same time, NO concentrations also showed a progressive decrease, which is likely to be associated with the reduction of local traffic emissions. However, BTEX concentrations showed multiple elevated episodes during the lockdown period. From the correlation coefficients shown in Figure 7, it is possible to observe that this increase does not correlate with the NO concentration (r = 0.02), is weakly correlated with NO2 (r = 0.29), and only shows a moderate correlation with BC (r = 0.45). Moreover, from Figure 2, it is possible to observe that wind direction changed markedly in the region, from southwest before lockdown to northeast during the lockdown.
To consider a possible effect of these variables, polar plots of each pollutant and temperature against wind direction were constructed in Figure 8, where each factor is plotted as a function of wind speed and wind direction. The dominant wind direction came from the northeast 43.1% of the time, which was most frequent during the lockdown. Other wind directions were north 15%, east 8.7%, southeast 5.2%, south 8.1%, southwest 12%, west 5.8%, and northwest 2%. This is consistent with trajectory results from HYSPLIT (https://www.ready.noaa.gov/HYSPLIT_traj.php, accessed on 25 October 2021). Briefly, as shown in Figure 9, before the lockdown (panel a), air masses mainly originated from the west, from the Atlantic Ocean. This represents a relatively clean air masses, in line with lower BTEX levels observed before the lockdown (Figure 8). However, during and after the lockdown (panels b and c, respectively), air masses have a more continental origin with various directions with more southerly and westerly components which is likely to pick up pollution plumes from built-up areas such as Paris which helps to explain the higher BTEX levels observed during these periods.
For NO and NO2, polar plot representations clearly show that maximum concentrations were observed for winds blowing from the southwest. The southwest of the site is located near a traffic intersection, gas station, and provincial road, which would indicate very local sources.
Another area with high NO2 concentration was found in the north, which has a similar situation for BC and PM10. It is noted that the site is located in the south of Orléans (distance 6 km from city center) and south west of Paris (distance 90 km), and that the major source of volatile organic compounds during wintertime in the Paris region is wood burning [33]. Hence, impact of biomass burning emissions, especially during the lockdown, was clearly evidenced on NO2, BC, and PM10 atmospheric concentrations.
Concerning the BTEX mixing ratios, the probability to observe high concentrations decreased with the wind speed. Higher concentrations were associated with a speed ranging between 0 and 4 m s−1, lower concentrations of all pollutants were observed when the wind speed was greater than 12 m s−1, intuitively, this result indicates that the high wind speed plays a role in “cleaning up” the air over the measurements site area.

4. Conclusions

The ambient levels and possible sources of atmospheric BTEX during the lockdown period in Orléans are reported in this study. The variation of the mean BTEX concentration suggests that besides source strength, the seasonal and diurnal variations of atmospheric BTEX in peri-urban areas also strongly depend on meteorological conditions and photochemical activity.
T/B ratios are generally low (<1) at the site during all three periods. In contrast to the observations of Salameh [28], which focused on the Paris area, we find that temperature is not a strong determinant of T/B, which suggests that evaporation rates are not the major control on this ratio in our study, and that photochemical age may be playing a more important role. Previous observations in Parisian suburbs such as Melun [28] find T/B ratios of approximately 1, which is similar to our own observations and suggests that we are observing a more aged air mass in line with the overall findings of the MEGAPOLI campaign [28].
Surprisingly, the overall BTEX mixing ratios were in general at their highest (~ 1 ppb) during the lockdown period, a time when we would expect to have the lowest volumes of traffic, which is supported by the Google Community mobility reports. Some of this effect is likely to be caused by meteorological conditions, where a change in the prevailing wind direction from SW to NE occurred near the onset of lockdown, suggesting that Orléans during this time could be more affected by plumes from the Paris megacity. It is noted that the overall concentrations are lower than those observed in Paris, as would be expected from photochemical losses as well as mixing and diffusion during the transport process. Changes to daily routines that could result in increases of residential heating emissions could also explain elevated BTEX mixing ratios during lockdown, although it is noted that the meteorological conditions during this time were generally warmer than the period that preceded lockdown. This hypothesis is supported on some days by the higher loading of BC and PM10 observed during lockdown, which could be attributable to a wood smoke source.
In addition to the BTEX measurements, we present a suite of supporting measurements including NOx, O3, PM10, BC, and meteorological data. In general, we did not observe strong correlations between these parameters and BTEX, suggesting that their respective sources could be different.
Even though we can be sure of changes in emission sources during the lockdown period, we find that the highest ambient pollution levels occurred during a time of national inactivity. Given that BTEX are considered to be dominated by traffic [25], and that local traffic volumes were reduced during the lockdown, we conclude therefore that ambient pollution levels in Orléans are strongly connected with the neighboring Paris region, which may be true of other suburban and peri-urban sites around the globe. Furthermore, if the higher BTEX episodes observed during lockdown are indeed related to more local sources of residential heating, then this implies that emission control of wood burning should be prioritized. From the perspective of pollution mitigation, we recognize that some of these conclusions remain tentative. Larger, more detailed datasets which would allow positive matrix factorization for example, would allow a more definitive source apportionment, and ultimately aid in emission control strategies.

Supplementary Materials

The following supporting information can be downloaded at: https://www.mdpi.com/article/10.3390/atmos13010010/s1, Figure S1: the temperature ramp of the capillary column. Figure S2: a series of diurnal variations in benzene, toluene, ethylbenzene, m,p-xylene and o-xylene mixing ratios before, during and after lockdown provided in the supporting information.

Author Contributions

M.C., Y.R., R.G.G. and B.G. conducted the measurements, M.C., Y.R., R.G.G. C.X. and B.G. performed the analysis of the data, M.C., R.G.G., M.R.M., V.D. and A.M. wrote the manuscript, all coauthors commented on the manuscript, V.D. and A.M. supervised the work and provided the resources. All authors have read and agreed to the published version of the manuscript.

Funding

This research was funded through PIVOTS project by the Région Centre–Val de Loire (ARD 2020 program), CPER 2015–2020 and European Union who invests in Centre-Val de Loire with the European Regional Development Fund. This work is also part of the “Investments d’Avenir” Programme overseen by the French National Research Agency (ANR) (LabEx BASC; ANR-11-LABEX-0034).

Institutional Review Board Statement

Not applicable.

Informed Consent Statement

Not applicable.

Data Availability Statement

Acknowledgments

We are grateful to Météo France and Lig’Air for the use of their meteorological and other pollutants data, respectively. M.C. is grateful to the China Scholarship Council for the financial support.

Conflicts of Interest

The authors declare no conflict of interest.

References

  1. Barré, J.; Petetin, H.; Colette, A.; Guevara, M.; Peuch, V.-H.; Rouil, L.; Engelen, R.; Inness, A.; Flemming, J.; Pérez García-Pando, C.; et al. Estimating Lockdown Induced European NO2 Changes using satellite and surface observations and air quality models. Atmos. Chem. Phys. 2020, 21, 7373–7394. [Google Scholar] [CrossRef]
  2. Guevara, M.; Jorba, O.; Soret, A.; Petetin, H.; Bowdalo, D.; Serradell, K.; Tena, C.; Denier van der Gon, H.; Kuenen, J.; Peuch, V.-H.; et al. Time-Resolved Emission Reductions for Atmospheric Chemistry Modelling in Europe during the COVID-19 Lockdowns. Atmos. Chem. Phys. 2021, 21, 773–797. [Google Scholar] [CrossRef]
  3. Shi, X.; Brasseur, G.P. The Response in Air Quality to the Reduction of Chinese Economic Activities during the COVID-19 Outbreak. Geophys. Res. Lett. 2020, 47, e2020GL088070. [Google Scholar] [CrossRef] [PubMed]
  4. Briz-Redón, Á.; Belenguer-Sapiña, C.; Serrano-Aroca, Á. Changes in Air Pollution during COVID-19 Lockdown in Spain: A Multi-City Study. J. Environ. Sci. 2021, 101, 16–26. [Google Scholar] [CrossRef] [PubMed]
  5. Le, T.; Wang, Y.; Liu, L.; Yang, J.; Yung, Y.L.; Li, G.; Seinfeld, J.H. Unexpected Air Pollution with Marked Emission Reductions during the COVID-19 Outbreak in China. Science 2020, 369, 702–706. [Google Scholar] [CrossRef]
  6. Singh, V.; Singh, S.; Biswal, A.; Kesarkar, A.P.; Mor, S.; Ravindra, K. Diurnal and Temporal Changes in Air Pollution during COVID-19 Strict Lockdown over Different Regions of India. Environ. Pollut. 2020, 266, 115368. [Google Scholar] [CrossRef] [PubMed]
  7. Kroll, J.H.; Heald, C.L.; Cappa, C.D.; Farmer, D.K.; Fry, J.L.; Murphy, J.G.; Steiner, A.L. The Complex Chemical Effects of COVID-19 Shutdowns on Air Quality. Nat. Chem. 2020, 12, 777–779. [Google Scholar] [CrossRef]
  8. Menut, L.; Bessagnet, B.; Siour, G.; Mailler, S.; Pennel, R.; Cholakian, A. Impact of Lockdown Measures to Combat COVID-19 on Air Quality over Western Europe. Sci. Total Environ. 2020, 741, 140426. [Google Scholar] [CrossRef]
  9. Collivignarelli, M.C.; Abbà, A.; Bertanza, G.; Pedrazzani, R.; Ricciardi, P.; Carnevale Miino, M. Lockdown for COVID-2019 in Milan: What Are the Effects on Air Quality? Sci. Total Environ. 2020, 732, 139280. [Google Scholar] [CrossRef]
  10. Schripp, T.; Langer, S.; Salthammer, T. Interaction of Ozone with Wooden Building Products, Treated Wood Samples and Exotic Wood Species. Atmos. Environ. 2012, 54, 365–372. [Google Scholar] [CrossRef]
  11. Lee, S.C.; Chiu, M.Y.; Ho, K.F.; Zou, S.C.; Wang, X. Volatile Organic Compounds (VOCs) in Urban Atmosphere of Hong Kong. Chemosphere 2002, 48, 375–382. [Google Scholar] [CrossRef]
  12. Liu, J.; Mu, Y.; Zhang, Y.; Zhang, Z.; Wang, X.; Liu, Y.; Sun, Z. Atmospheric Levels of BTEX Compounds during the 2008 Olympic Games in the Urban Area of Beijing. Sci. Total Environ. 2009, 408, 109–116. [Google Scholar] [CrossRef] [PubMed]
  13. Mehlman, M.A. Dangerous Properties of Petroleum-Refining Products: Carcinogenicity of Motor Fuels (Gasoline). Teratog. Carcinog. Mutagenes. 1990, 10, 399–408. [Google Scholar] [CrossRef]
  14. Demir, S.; Saral, A.; Ertürk, F.; Kuzu, S.L.; Goncaloğlu, B.İ.; Demir, G. Effect of Diurnal Changes in VOC Source Strengths on Performances of Receptor Models. Environ. Sci. Pollut. Res. 2012, 19, 1503–1514. [Google Scholar] [CrossRef] [PubMed]
  15. Guo, H.; So, K.L.; Simpson, I.J.; Barletta, B.; Meinardi, S.; Blake, D.R. C1–C8 Volatile Organic Compounds in the Atmosphere of Hong Kong: Overview of Atmospheric Processing and Source Apportionment. Atmos. Environ. 2007, 41, 1456–1472. [Google Scholar] [CrossRef] [Green Version]
  16. Kansal, A. Sources and Reactivity of NMHCs and VOCs in the Atmosphere: A Review. J. Hazard. Mater. 2009, 166, 17–26. [Google Scholar] [CrossRef] [PubMed]
  17. Lanz, V.A.; Hueglin, C.; Buchmann, B.; Hill, M.; Locher, R.; Staehelin, J.; Reimann, S. Receptor modeling of C-2-C-7 hydrocarbon sources at an urban background site in Zurich, Switzerland. Changes between 1993–1994 and 2005–2006. Atmos. Chem. Phys. 2008, 8, 2313–2332. [Google Scholar] [CrossRef] [Green Version]
  18. Finlayson-Pitts, B.J.; Pitts, J.N. Atmospheric Chemistry of Tropospheric Ozone Formation: Scientific and Regulatory Implications. Air Waste 1993, 43, 1091–1100. [Google Scholar] [CrossRef]
  19. Calvert, J.; Mellouki, A.; Orlando, J.; Pilling, M.; Wallington, T. Mechanisms of Atmospheric Oxidation of the Oxygenates; Oxford University Press: New York, NY, USA, 2011. [Google Scholar] [CrossRef]
  20. Nelson, P.F.; Quigley, S.M. The m,p-Xylenes:Ethylbenzene Ratio. A Technique for Estimating Hydrocarbon Age in Ambient Atmospheres. Atmos. Environ. 1967 1983, 17, 659–662. [Google Scholar] [CrossRef]
  21. R Core Team. R: A Language and Environment for Statistical Computing; R Foundation for Statistical Computing: Vienna, Austria, 2018. [Google Scholar]
  22. Carslaw, D.C.; Ropkins, K. Openair—An R Package for Air Quality Data Analysis. Environ. Model. 2012, 27–28, 52–61. [Google Scholar] [CrossRef]
  23. Jiang, Z.; Grosselin, B.; Daële, V.; Mellouki, A.; Mu, Y. Seasonal and Diurnal Variations of BTEX Compounds in the Semi-Urban Environment of Orleans, France. Sci. Total Environ. 2017, 574, 1659–1664. [Google Scholar] [CrossRef] [PubMed]
  24. Hajizadeh, Y.; Mokhtari, M.; Faraji, M.; Mohammadi, A.; Nemati, S.; Ghanbari, R.; Abdolahnejad, A.; Fard, R.F.; Nikoonahad, A.; Jafari, N.; et al. Trends of BTEX in the Central Urban Area of Iran: A Preliminary Study of Photochemical Ozone Pollution and Health Risk Assessment. Atmos. Pollut. Res. 2018, 9, 220–229. [Google Scholar] [CrossRef]
  25. Borbon, A.; Boynard, A.; Salameh, T.; Baudic, A.; Gros, V.; Gauduin, J.; Perrussel, O.; Pallares, C. Is Traffic Still an Important Emitter of Monoaromatic Organic Compounds in European Urban Areas? Environ. Sci. Technol. 2018, 52, 513–521. [Google Scholar] [CrossRef] [Green Version]
  26. Gelencsér, A.; Siszler, K.; Hlavay, J. Toluene−Benzene Concentration Ratio as a Tool for Characterizing the Distance from Vehicular Emission Sources. Environ. Sci. Technol. 1997, 31, 2869–2872. [Google Scholar] [CrossRef]
  27. Sauvage, S.; Plaisance, H.; Locoge, N.; Wroblewski, A.; Coddeville, P.; Galloo, J.C. Long Term Measurement and Source Apportionment of Non-Methane Hydrocarbons in Three French Rural Areas. Atmos. Environ. 2009, 43, 2430–2441. [Google Scholar] [CrossRef]
  28. Salameh, T.; Sauvage, S.; Locoge, N.; Gauduin, J.; Perrussel, O.; Borbon, A. Spatial and Temporal Variability of BTEX in Paris Megacity: Two-Wheelers as a Major Driver. Atmos. Environ. X 2019, 1, 100003. [Google Scholar] [CrossRef]
  29. Kleinman, L.I.; Daum, P.H.; Lee, Y.-N.; Nunnermacker, L.J.; Springston, S.R.; Weinstein-Lloyd, J.; Hyde, P.; Doskey, P.; Rudolph, J.; Fast, J.; et al. Photochemical Age Determinations in the Phoenix Metropolitan Area. J. Geophys. Res. Atmos. 2003, 108. [Google Scholar] [CrossRef] [Green Version]
  30. Roberts, J.M.; Fehsenfeld, F.C.; Liu, S.C.; Bollinger, M.J.; Hahn, C.; Albritton, D.L.; Sievers, R.E. Measurements of Aromatic Hydrocarbon Ratios and NOx Concentrations in the Rural Troposphere: Observation of Air Mass Photochemical Aging and NOx Removal. Atmos. Environ. 1967 1984, 18, 2421–2432. [Google Scholar] [CrossRef]
  31. Warneke, C.; McKeen, S.A.; de Gouw, J.A.; Goldan, P.D.; Kuster, W.C.; Holloway, J.S.; Williams, E.J.; Lerner, B.M.; Parrish, D.D.; Trainer, M.; et al. Determination of Urban Volatile Organic Compound Emission Ratios and Comparison with an Emissions Database. J. Geophys. Res. Atmos. 2007, 112. [Google Scholar] [CrossRef]
  32. Languille, B.; Gros, V.; Petit, J.-E.; Honoré, C.; Baudic, A.; Perrussel, O.; Foret, G.; Michoud, V.; Truong, F.; Bonnaire, N.; et al. Wood Burning: A Major Source of Volatile Organic Compounds during Wintertime in the Paris Region. Sci. Total Environ. 2020, 711, 135055. [Google Scholar] [CrossRef] [PubMed]
  33. Monod, A.; Sive, B.C.; Avino, P.; Chen, T.; Blake, D.R.; Sherwood Rowland, F. Monoaromatic Compounds in Ambient Air of Various Cities: A Focus on Correlations between the Xylenes and Ethylbenzene. Atmos. Environ. 2001, 35, 135–149. [Google Scholar] [CrossRef] [Green Version]
  34. Rad, H.D.; Babaei, A.A.; Goudarzi, G.; Angali, K.A.; Ramezani, Z.; Mohammadi, M.M. Levels and Sources of BTEX in Ambient Air of Ahvaz Metropolitan City. Air Qual. Atmos. Health 2014, 7, 515–524. [Google Scholar] [CrossRef]
  35. Kirchstetter, T.W.; Novakov, T.; Hobbs, P.V. Evidence That the Spectral Dependence of Light Absorption by Aerosols Is Affected by Organic Carbon. J. Geophys. Res. Atmos. 2004, 109, D21208. [Google Scholar] [CrossRef] [Green Version]
  36. Logan, J.A. Nitrogen Oxides in the Troposphere: Global and Regional Budgets. J. Geophys. Res. Oceans 1983, 88, 10785–10807. [Google Scholar] [CrossRef]
Figure 1. Location of the sampling site at the CNRS-campus in Orléans, France.
Atmosphere 13 00010 g001
Figure 2. Time series of hourly BTEX (pptv, y axis of BTEX 1k = 1 × 10³), NO (ppbv), NO2 (ppbv), O3 (ppbv), PM10 (µg m−3), black carbon (µg m−3), and temperature (°C) in Orléans during the studied period, with daily “percent change in the grocery and pharmacy”, and meteorological parameters (wind speed in m s−1, wind direction in a color-coded way).
Atmosphere 13 00010 g002
Figure 3. Diurnal variations in BTEX, BC, PM10, NOx, O3, and temperature before, during and after lockdown. The shaded area represents 95% confidence interval in mean.
Atmosphere 13 00010 g003
Figure 4. Correlation coefficients in percentage between benzene, toluene, ethylbenzene, m,p-xylene and o-xylene (a) before, (b) during, and (c) after the lockdown.
Atmosphere 13 00010 g004
Figure 5. Variation of toluene/benzene (T/B), photochemical age of the air (Δt), m, p-xylene/ethylbenzene (MP/E) concentration ratios and temperature in the observation site during the entire measurement period.
Atmosphere 13 00010 g005
Figure 6. Diurnal variations in MP/E ratio (a) before, (b) during, and (c) after the lockdown.
Atmosphere 13 00010 g006
Figure 7. Correlation coefficient in percentage between BTEX, NO, NO2, O3, PM10, BC, and temperature (T) for each period (before, declared, during, and after lockdown). (a) before; (b) declared; (c) during; (d) after.
Atmosphere 13 00010 g007
Figure 8. Polar plots of BTEX, NO, NO2, O3, PM10, BC, and temperature (T) for lockdown (from 17 Mar to 10 May); ws = wind speed (m s−1).
Atmosphere 13 00010 g008
Figure 9. Results of HYSPLIT 24 h back trajectory frequencies before (a), during (b), and after (c) the lockdown. The star represents the location of the measurement site. Height: 500 m above the ground level; frequency grid resolution: 0.5 × 0.5°.
Atmosphere 13 00010 g009
Table 1. Average mixing ratios (pptv) of BTEX for each period (before, during, and after lockdown) in Orléans, France (SD: standard deviation, IQR: interquartile range).
Before Lockdown
26 February–16 March
Lockdown
17 March–10 May
After Lockdown
11 May –31 May
Mean ± SDIQRMean ± SDIQRMean ± SDIQR
N° samples620 1860 595
Benzene83 ± 4830271 ± 143233280 ± 163191
Toluene56 ± 3632121 ± 80112118 ± 6379
Ethylbenzene99 ± 3747172 ± 80125205 ± 113121
m,p-xylene86 ± 2937124 ± 5992122 ± 5876
o-xylene79 ± 2027113 ± 4965128 ± 6459
Total BTEX402 ± 143155800 ± 378626851 ± 445523
Publisher’s Note: MDPI stays neutral with regard to jurisdictional claims in published maps and institutional affiliations.

