1. Introduction
With increasing awareness of climate change and global warming, the role of reducing greenhouse gas (GHG) emissions in all sectors of countries’ economy is becoming increasingly more important. With roughly 90% of Europe’s, the agricultural sector is the biggest contributor [
1]. Around 40% of ammonia emission in the animal sector can be traced back to cattle and cows [
2]. As ammonia converts into various nitrous oxides in the atmosphere, its contribution to global warming is roughly 265 times more severe compared to CO
2 [
3]. The European Union identified the threat and harmfulness of ammonia emissions on the ozone layer [
4], water eutrophication [
5], overfertilizing or soil acidification [
6], and odor nuisance in 2016 and decided that NH
3 emission must be cut by 12% until 2030 compared to 2005 [
7]. Until the year 2017, emissions increased moderately every year, which means that by now, roughly 20% of ammonia emissions must be reduced to reach the goals set by the EU25 [
8]. Furthermore, the UN defined an even stricter directive to cut ammonia emission by 30–50% to sustain a healthy and undamaged ecosystem [
9].
As this topic is of increasing importance, extensive research has been conducted over the past years. The most common methods for mitigating GHG emissions from agriculture, especially manure, include the following:
- -
Covering manure pits and stock piles in order to mitigate the oxidation of ammonia to nitrous oxides [
10]
- -
Adapting the application of manure on the field (ground injection, near-ground release instead of spraying)
- -
Changing the animal’s diet to reduce enteric fermentation (e.g., via feeding plant active compounds like tannins) or to reduce crude protein intake
- -
Modifying the manure sludge with various additives to either inhibit the hydrolysis of urea to ammonium [
11,
12], lower the pH of the manure [
13,
14,
15,
16] to shift the NH
4+-NH
3 equilibrium towards NH
4+, and mineral additives like lime, coal, alum, zeolite, or clay [
17,
18,
19,
20]. In a study previous presented by the authors, tannins and tannin-based polymers showed promising results in suppressing ammonia emission from cattle manure [
21]
By-products from the dairy industry like whey or flushing milk from cleaning milk trucks are available in high abundance and often cause difficulties for the manufacturers when disposing [
22]. Both before-mentioned liquids contain lactic acid bacteria, which were shown to moderate the ammonia emission from poultry litter and slaughter sludge [
23]. Nie et al. showed that the addition of lactic acid facilitates the population of lactobacilli, which reduces the emission of ammonia and therefore preserves nitrogen in the fertilizer [
23]. Compared to other bacteria, lactic acid bacteria are able to survive pH below 5, which makes them promising for survival in manure with lowered pH, where they can act as a hydrogen donor to facilitate the NH
4+ formation [
24]. In this study, we aimed to show that by mixing cattle manure slurry with by-products of the dairy industry, it is possible (i) to achieve a decrease of pH, therefore shifting the equilibrium towards ammonium, and (ii) to preserve nitrogen within the dairy modified manure to a higher extent compared with untreated control samples.
2. Materials and Methods
2.1. Raw Materials and Reagents
Cattle manure slurry was collected freshly before every trial from manure slurry pits of organic livestock farms in Salzburg and Tyrol (both Austria). Acidic whey and flushing milk were provided by Käserei Gebrüder Woerle Ges.m.b.H (Henndorf, Salzburg, Austria) and Pinzgau Milch Produktions GmbH (Maishofen, Salzburg, Austria) and used immediately after being received. Prior to the test setup, the manure was homogenized either with a two-hand mixer (large scale) or an Ultra Turrax T10 (IKA, Staufen, Germany) for lab-scale trials. Sodium hydroxide, sulfuric acid, hydrochloric acid, kjeldahl catalyst, and MRS agar were all purchased from VWR, Bruchsal, Germany.
2.2. Methods
For the lab-scale experiments, manure was mixed with 20–50% dairy additive in 10% increments and water in the same extent as reference (w_50 = manure with 50% whey, m_30 = manure with 30% flushing milk, ref = reference manure) to obtain a final volume of 500 mL. Containers with manure mixtures were stored with a gas-permeable lid in order to allow gassing out of ammonia. Samples were analyzed for NH4-N, total Kjeldhal nitrogen (TKN) pH, and lactobacillus growth on day 1, day 3, and then once a week for up to 3 weeks. TKN and NH4-N were evaluated as described in national standards for soil and sludge analysis [
25]. pH was measured using a SiAnalystics Lab 830 (Xylem Analytics, Weilheim, Germany). Colony growth of lactobacilli was monitored on MRS-agar plates after incubation according to the manufacturers guidelines after 48 ± 2 h. Inoculum was prepared as follows: an equivalent of 2 mL of manure/dairy mixture was drawn from the container and centrifuged at 400 rpm for 2 min to remove the solid. Supernatant was collected and diluted appropriately.
Large-scale experiments were conducted with the same ratios of additives to manure, making a total volume of 20 L. pH was measured using an Apera pH 60 (Apera Instruments, Wuppertal, Germany) hand-held pH meter. Measurements were conducted for 1 month in regular intervals. A total of three different test series were conducted from April to June 2021. The influence of the solid content of flushing milk on pH development was monitored in the same setup.
Field experiments in two manure slurry pits (roughly 150 m3) were conducted using approximately 30% dairy additive without further addition of manure during the observation period. Measurements of pH were again performed using the Apera pH 60 hand-held pH meter, cross-checked with an Apera AP 20 (Apera Instruments, Wuppertal, Germany) meter.
2.3. Data Curation
Data analysis was performed using OriginPro 2021a (OriginLab, Northampton, MA, USA). If not stated otherwise, measurements were conducted in duplicate (large scale) or triplicate (lab scale).
3. Results
Flushing milk is obtained at various stages in the dairy industry including, but not limited to cleaning milk trucks or flushing the piping within the plant after finishing the production of a specific product (e.g., yoghurt, cream cheese). Depending on the source of the flushing milk, solid content strongly varies between 0.1 and roughly 10%. If not stated otherwise, flushing milk with a solid content of 3.5% was used in all experiments. The acidic whey used in the experiments had a solid content of 5.3%.
3.1. Lab-Scale Trials
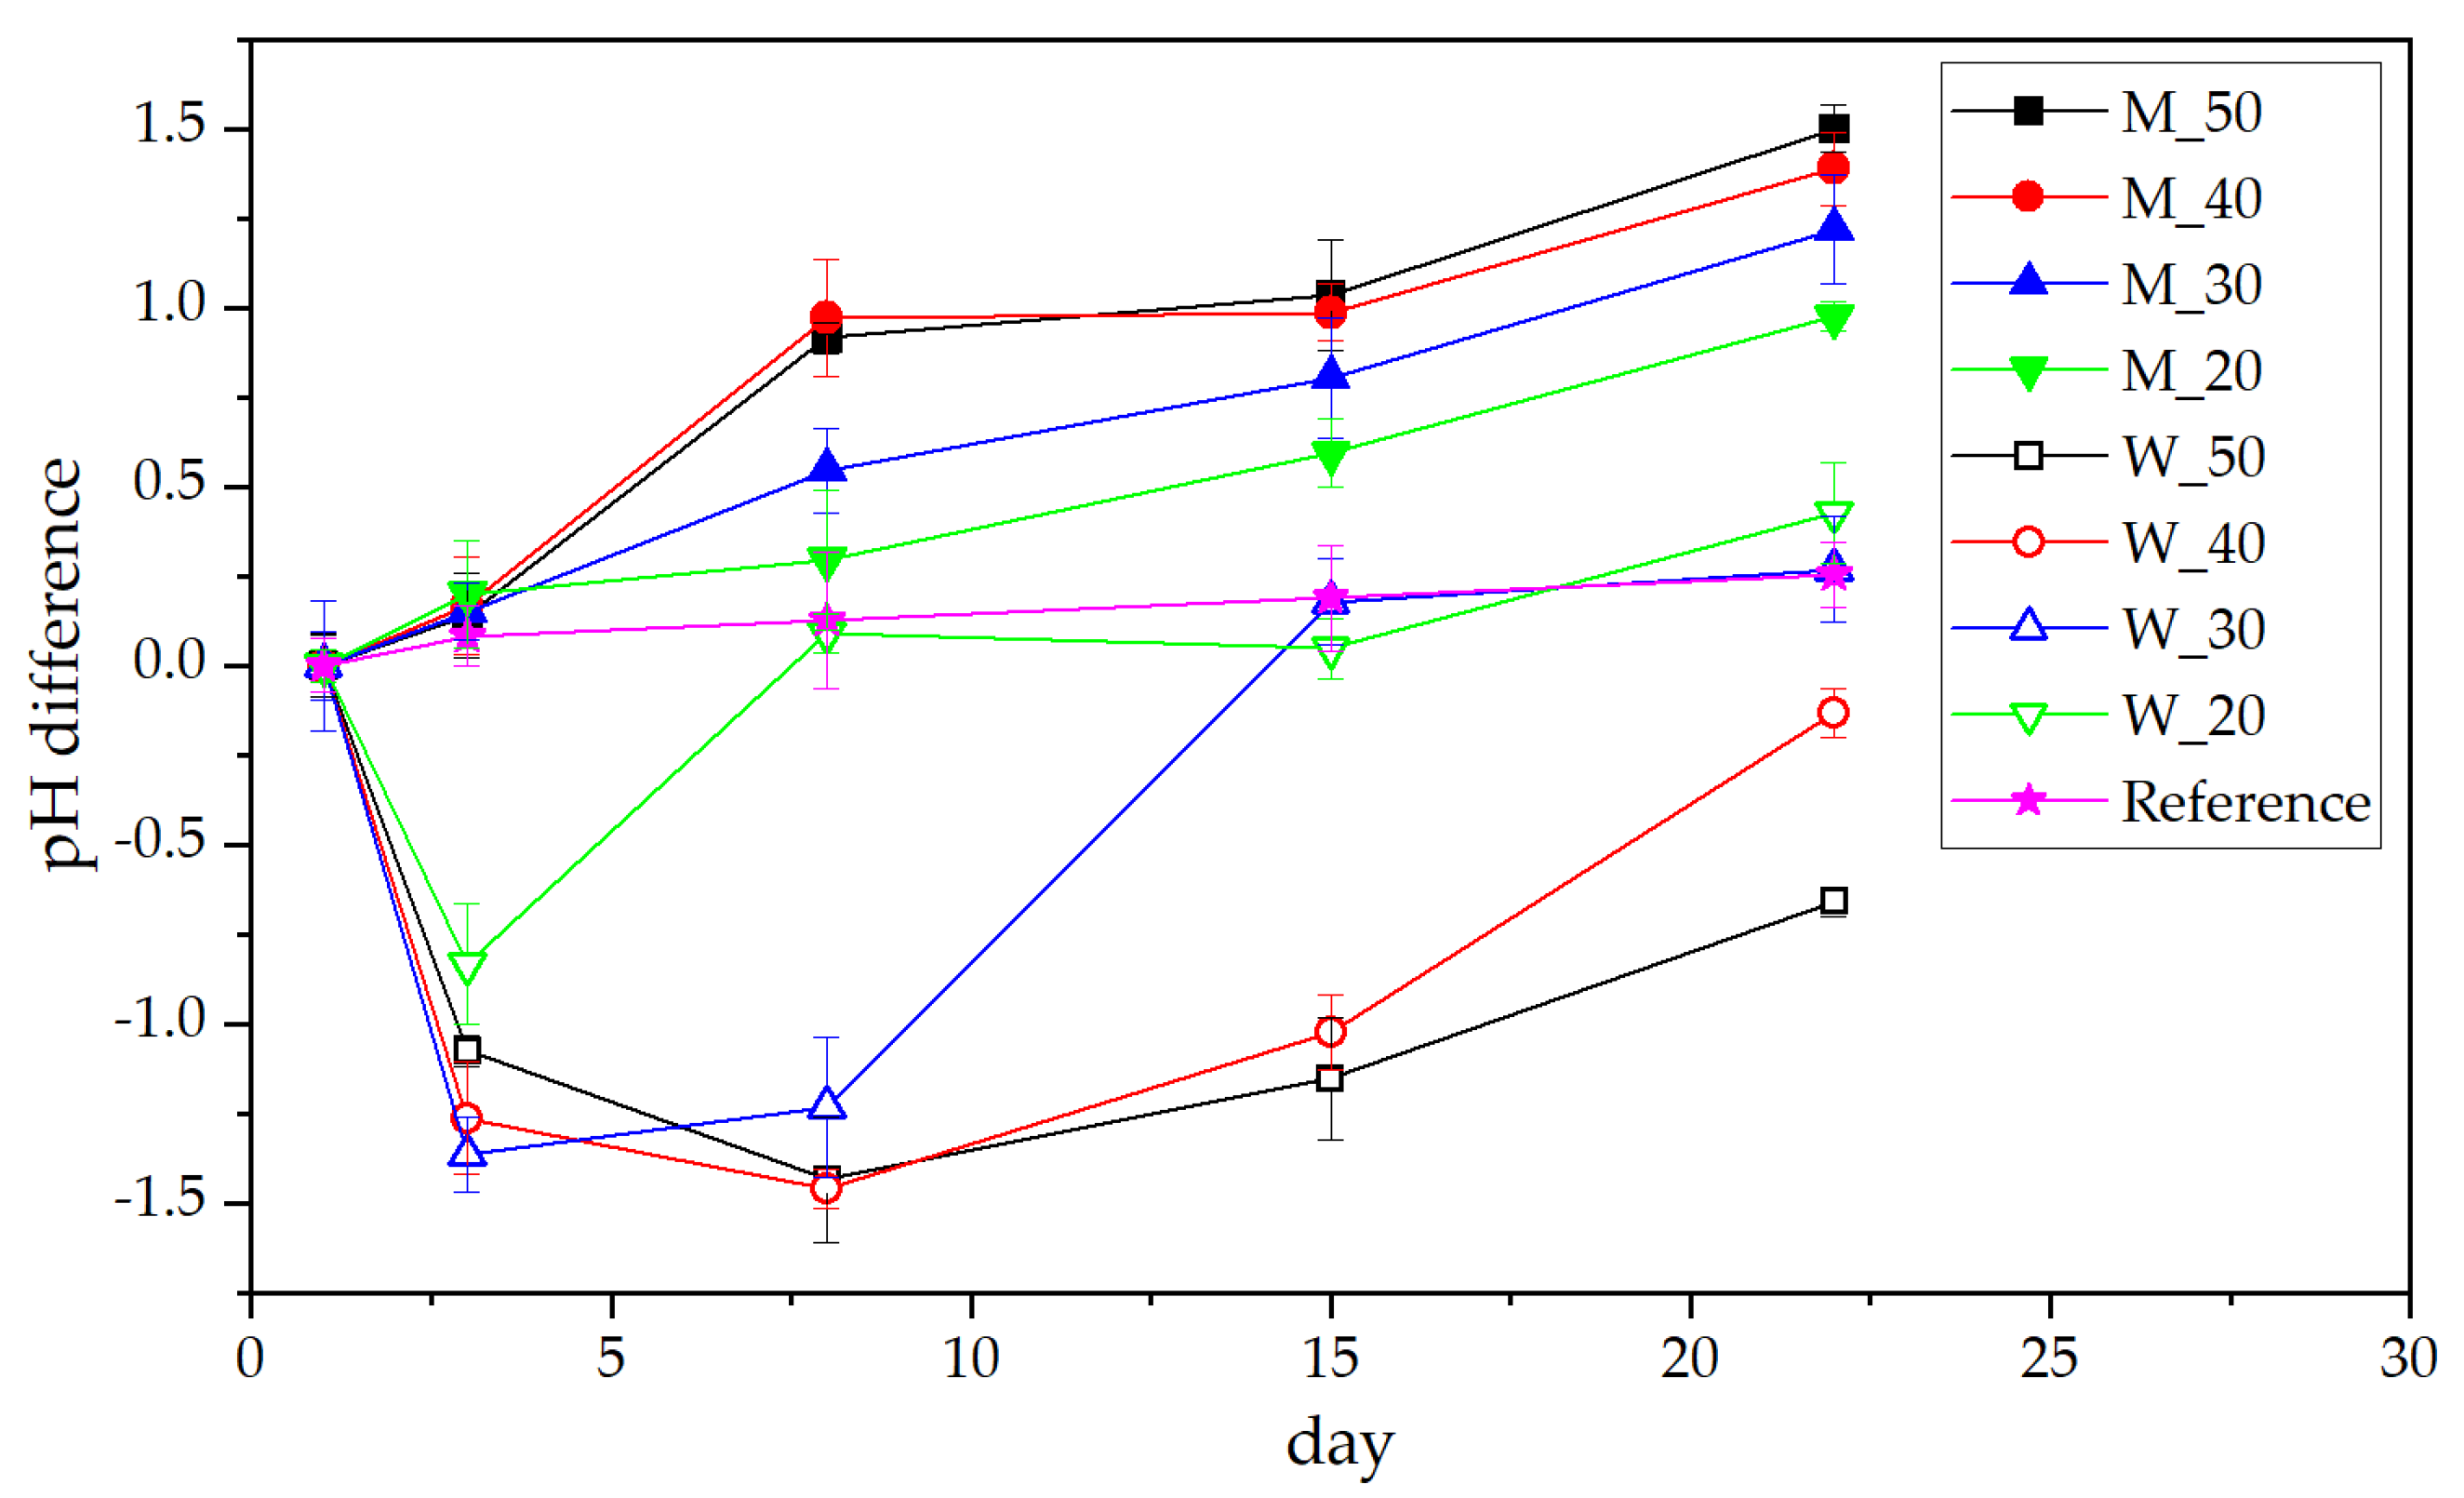
Lab-scale trials were conducted on a total volume of 500 mL (manure + additive). Changes in pH value of the different solutions over time are shown in
Figure 1. It is clearly visible that the control and the flushing milk samples show a steady increase in pH over time. While the control starts at a pH of 7.11 (which could be expected for diluted manure), the milk samples start between 5.13 (for 50%) and 6.17 (20%), but all show a uniform development towards a pH of 7 (milk samples) or 7.4 (reference), again moving to the natural pH range of manure. The addition of whey on the other hand shows a decrease of pH for a certain time, again depending on the concentration. In general, the starting pH of whey samples is in the range of milk samples (between 5.15 and 6.15). However, compared with the milk samples, the whey ones develop towards neutral pH much slower. For 50% and 40% whey, the pH value after 22 days was still below 6, effectively mitigating emission of NH
3 almost entirely [
26]. The lowest pH for the samples was observed after 1 week for 50% and 40% whey at 3.98 and 4.73, respectively. The overall lower pH when using whey can be traced back to lactic acid from lactic-acid-producing bacteria (LAB) in the (acidic) whey [
22]. Whey as source of LAB was summarized by Rama et al. in 2019 [
27], yet Burns showed that the addition of yeast to the whey has beneficial effects on the growth [
28].
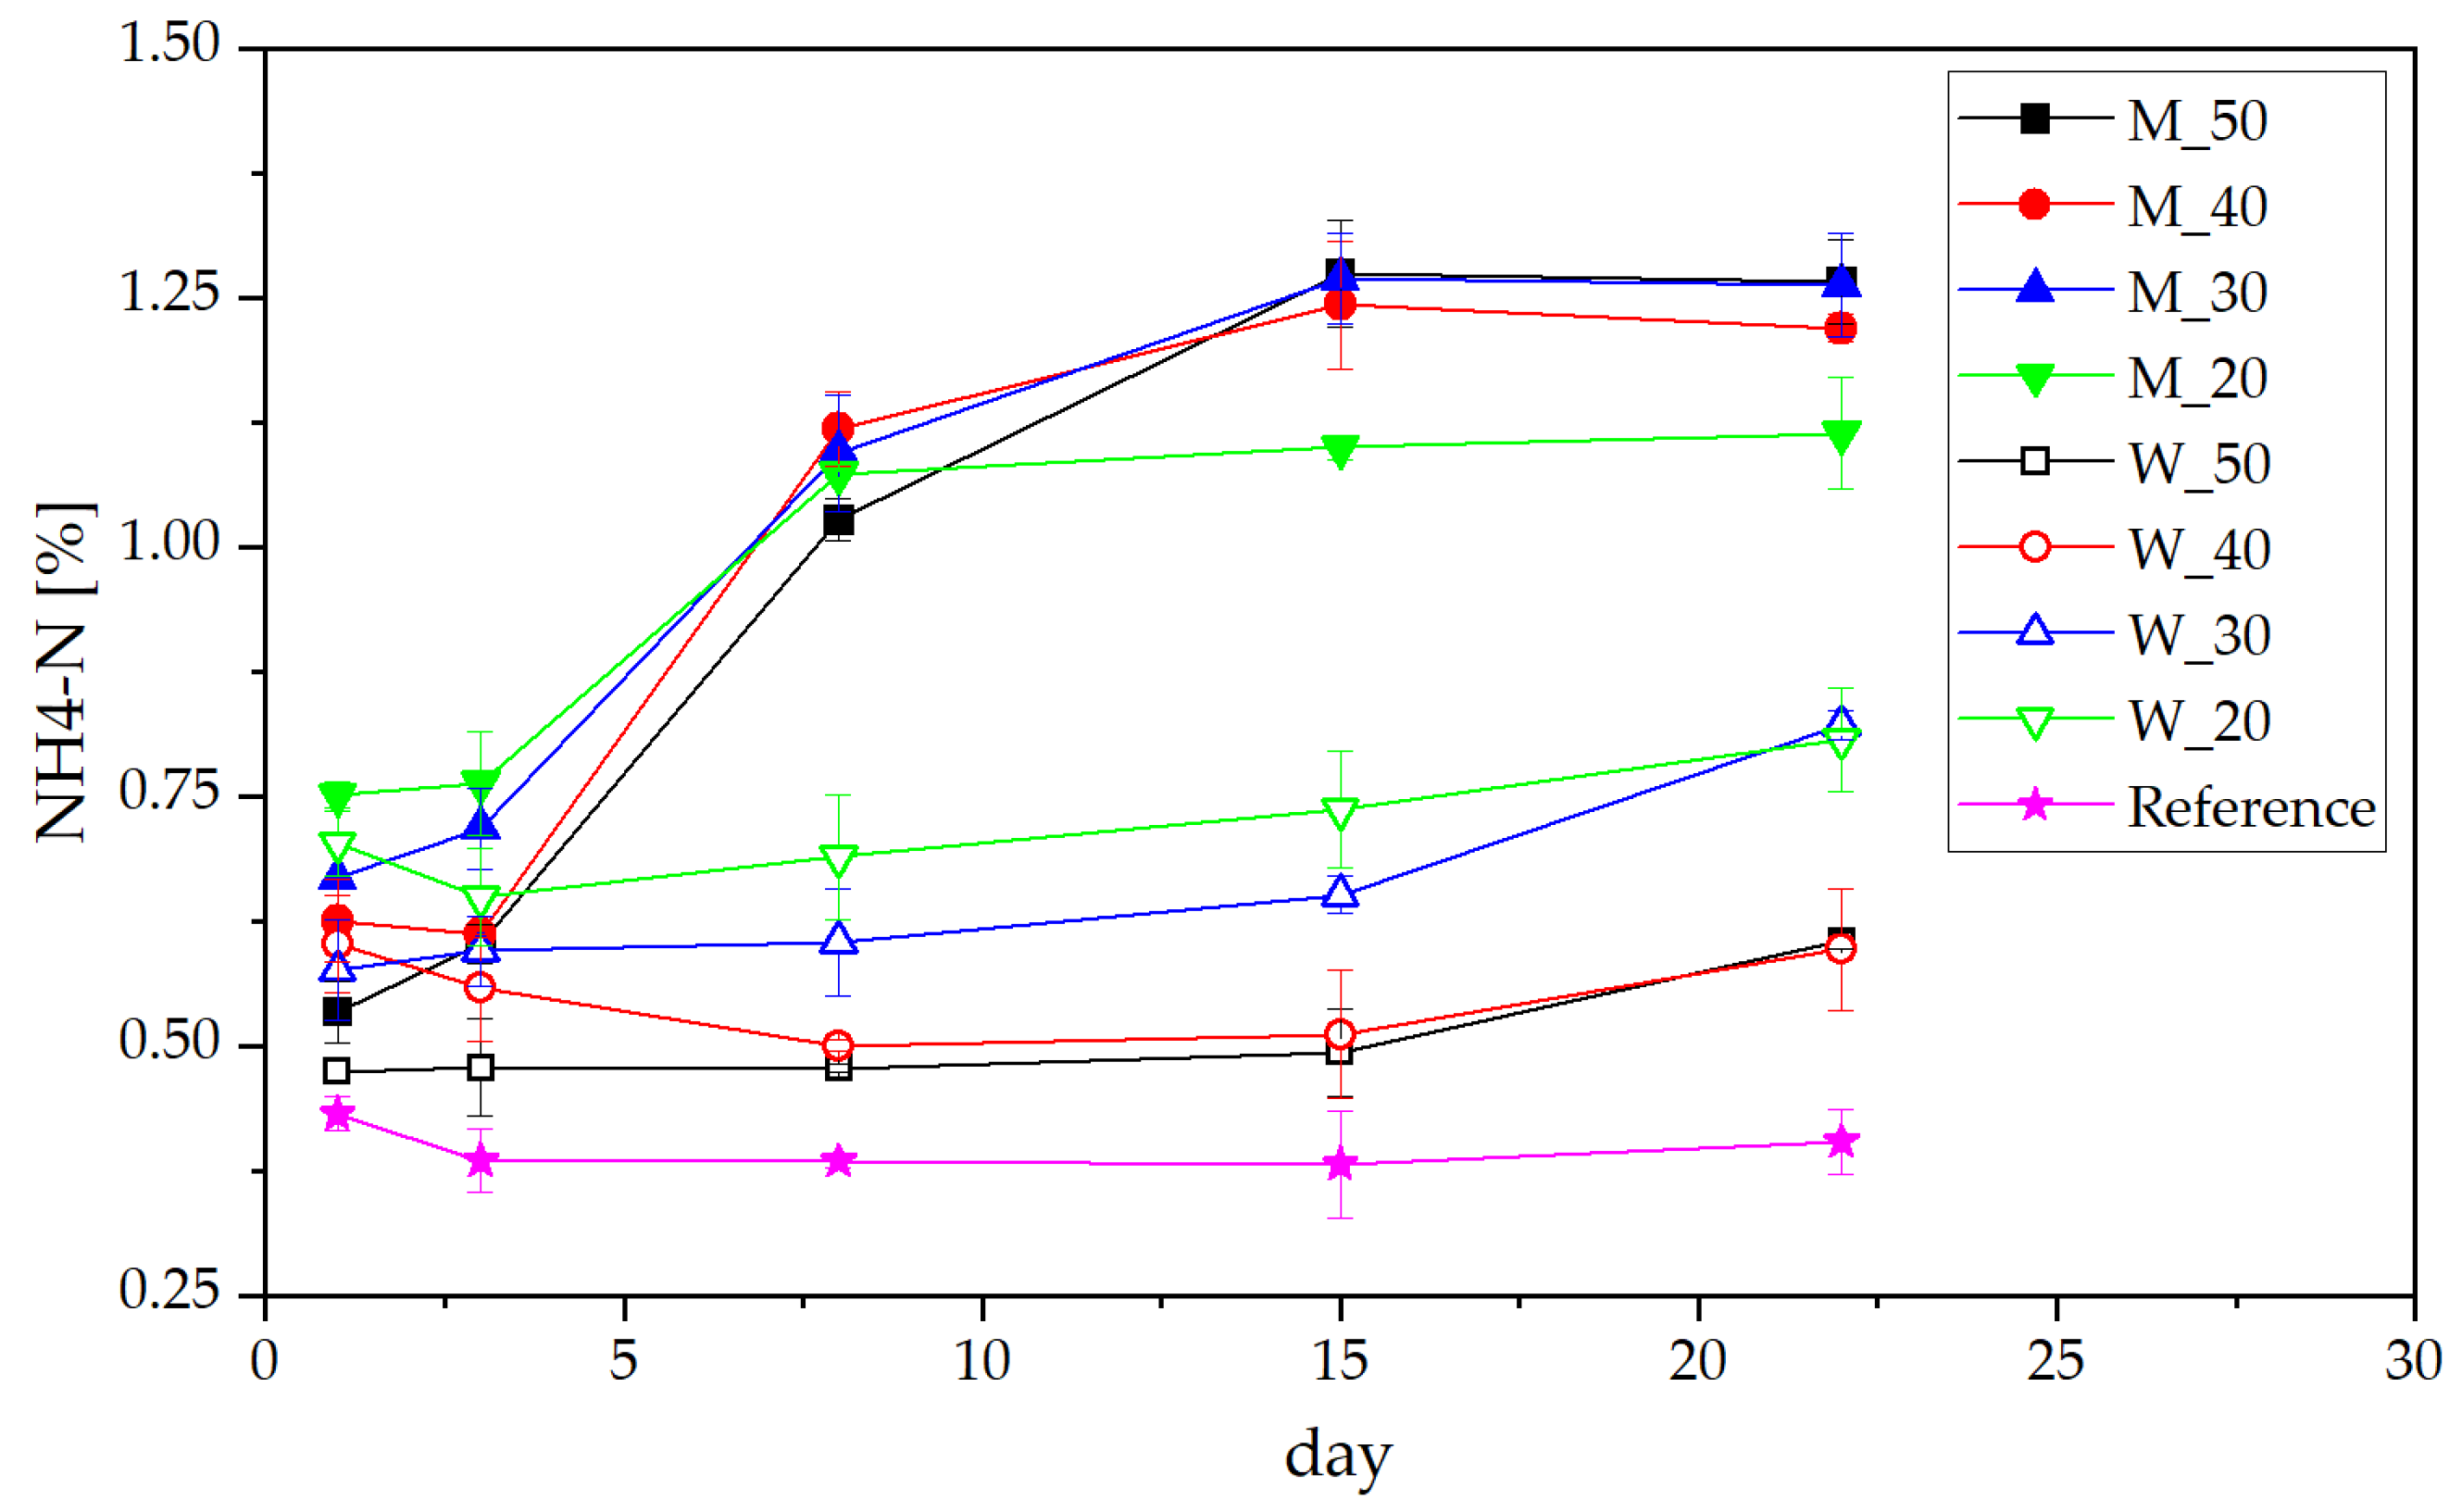
Monitoring of ammonium nitrogen (NH4-N) in different manure mixtures showed interesting results, as depicted in
Figure 2. First of all, NH4-N content in untreated manure sludge did decrease slightly in the first 3 days, afterwards remaining constant at roughly 0.4 kg N per ton of fresh manure (kg/t). For all whey-containing samples, the increase in NH4-N amount was very small (on average 0.15 kg/t), after a slight initial decrease. This could be traced back to the proteolytic capability of some strains of LAB [
29]; furthermore, they allow for the fermentation of proteins into amino acids and subsequently NH4-N [
30]. Although the pH of whey mixtures was lower, increase in NH4-N content of milk mixtures was higher. The biggest change was recorded for M_50 from 0.53 kg/t to 1.26 kg/t, effectively more than doubling the NH4-N content. One reason might be the pH-dependent hydrolysis of urea into ammonia, as shown by Fidaleo et al. in 2003 [
31], which is most successful at around pH 6–8.
Another reason for increasing the ammonium content is the ability of LAB to act as a hydrogen donor, protonating NH
3 [
24]. It was shown by various researchers that the ideal growth environment for LAB is a pH range of around 7–8 [
32], while below 4 growth is almost completely inhibited [
33,
34]. Therefore, the growth environment in milk-mixed manure is much more favorable than in the acidic whey manure. For the two lower whey concentrations (pH around 6.2 at the end of the measurements), NH4-N was roughly 0.2 kg/t higher than for the two manure samples containing more whey (pH 4.8 and 5.6). It can also be observed that as soon as the pH of the whey-manure mixture increases, NH4-N concentration increases, indicating also a higher conversion rate of urea into ammonium.
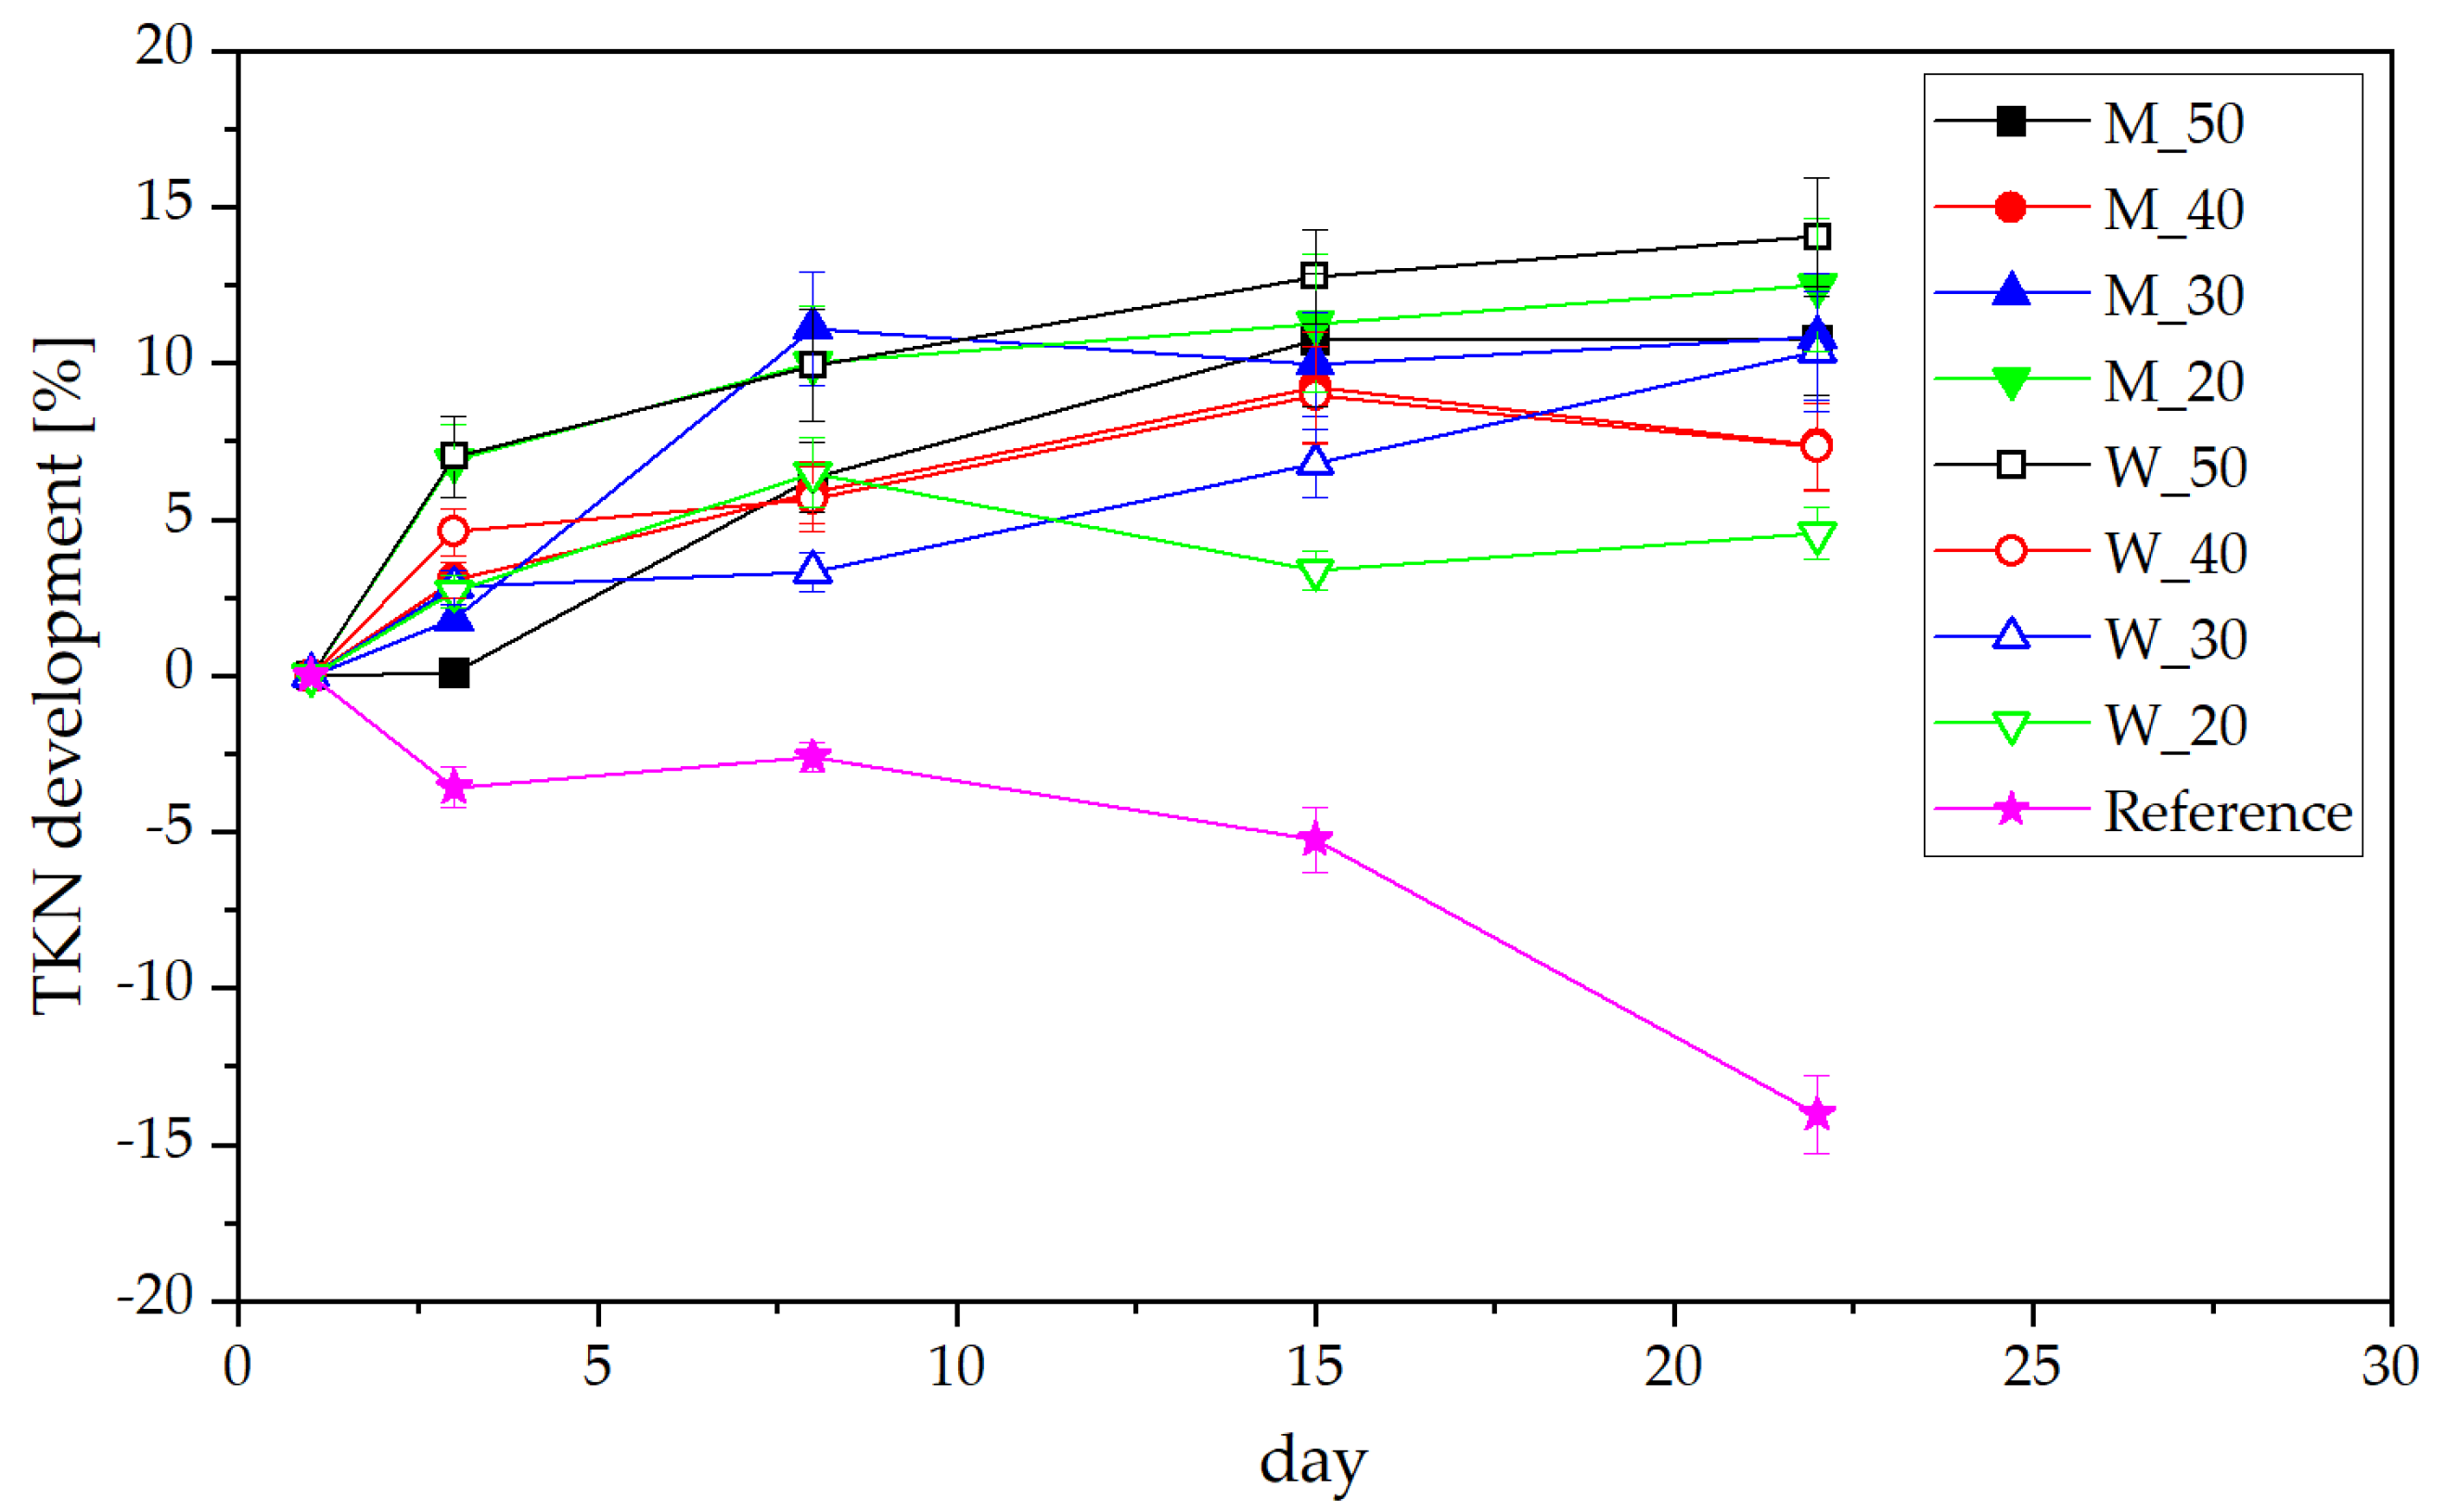
Results from the determination of total Kjeldahl nitrogen (TKN) are shown in
Figure 3 as relative development over time compared to day 1, as the absolute nitrogen contents vary between 2 and 5% N on a dry basis. All samples that were mixed with dairy by-products did retain their nitrogen content or showed an increase in nitrogen detectable by the Kjeldahl method, while the untreated sample showed a strong decrease in TKN of roughly 14% over 22 days. These observations correspond to previous findings [
35]. The relatively steady amount of NH
4-N combined with a loss of TKN shows that the conversion of urea into ammonia is not hindered in untreated manure, and N is lost in the form of gaseous emissions to the surrounding atmosphere. On the other hand, the steady development of TKN compared with an increasing amount of ammonium nitrogen indicates an ongoing nitrogen preservation within the dairy-manure, allowing it to be accessible for plants after spreading on the field.
Colony forming units for each manure-dairy combination as well as pure manure and control plates of the observed time are listed in
Table 1. The number of LAB in milk was orders of magnitude lower compared to whey, as the milk was already strongly diluted to begin with. In all milk samples, growth of LAB over time was observed, not hindered by the favorable pH value. For the whey samples on the other hand, after an initial growth, the amount of CFU decreased. The higher concentration in whey could be due to the lower pH not favoring the growth of the bacteria. Another reason might be the exhaustion of convertible lactose. Overall, the results from MRS agar growth confirmed the presence of LAB in manure-dairy mixtures also after longer periods of time. This leads to the overall lower pH compared to normal manure and therefore reduced nitrogen loss.
3.2. Large-Scale Experiments
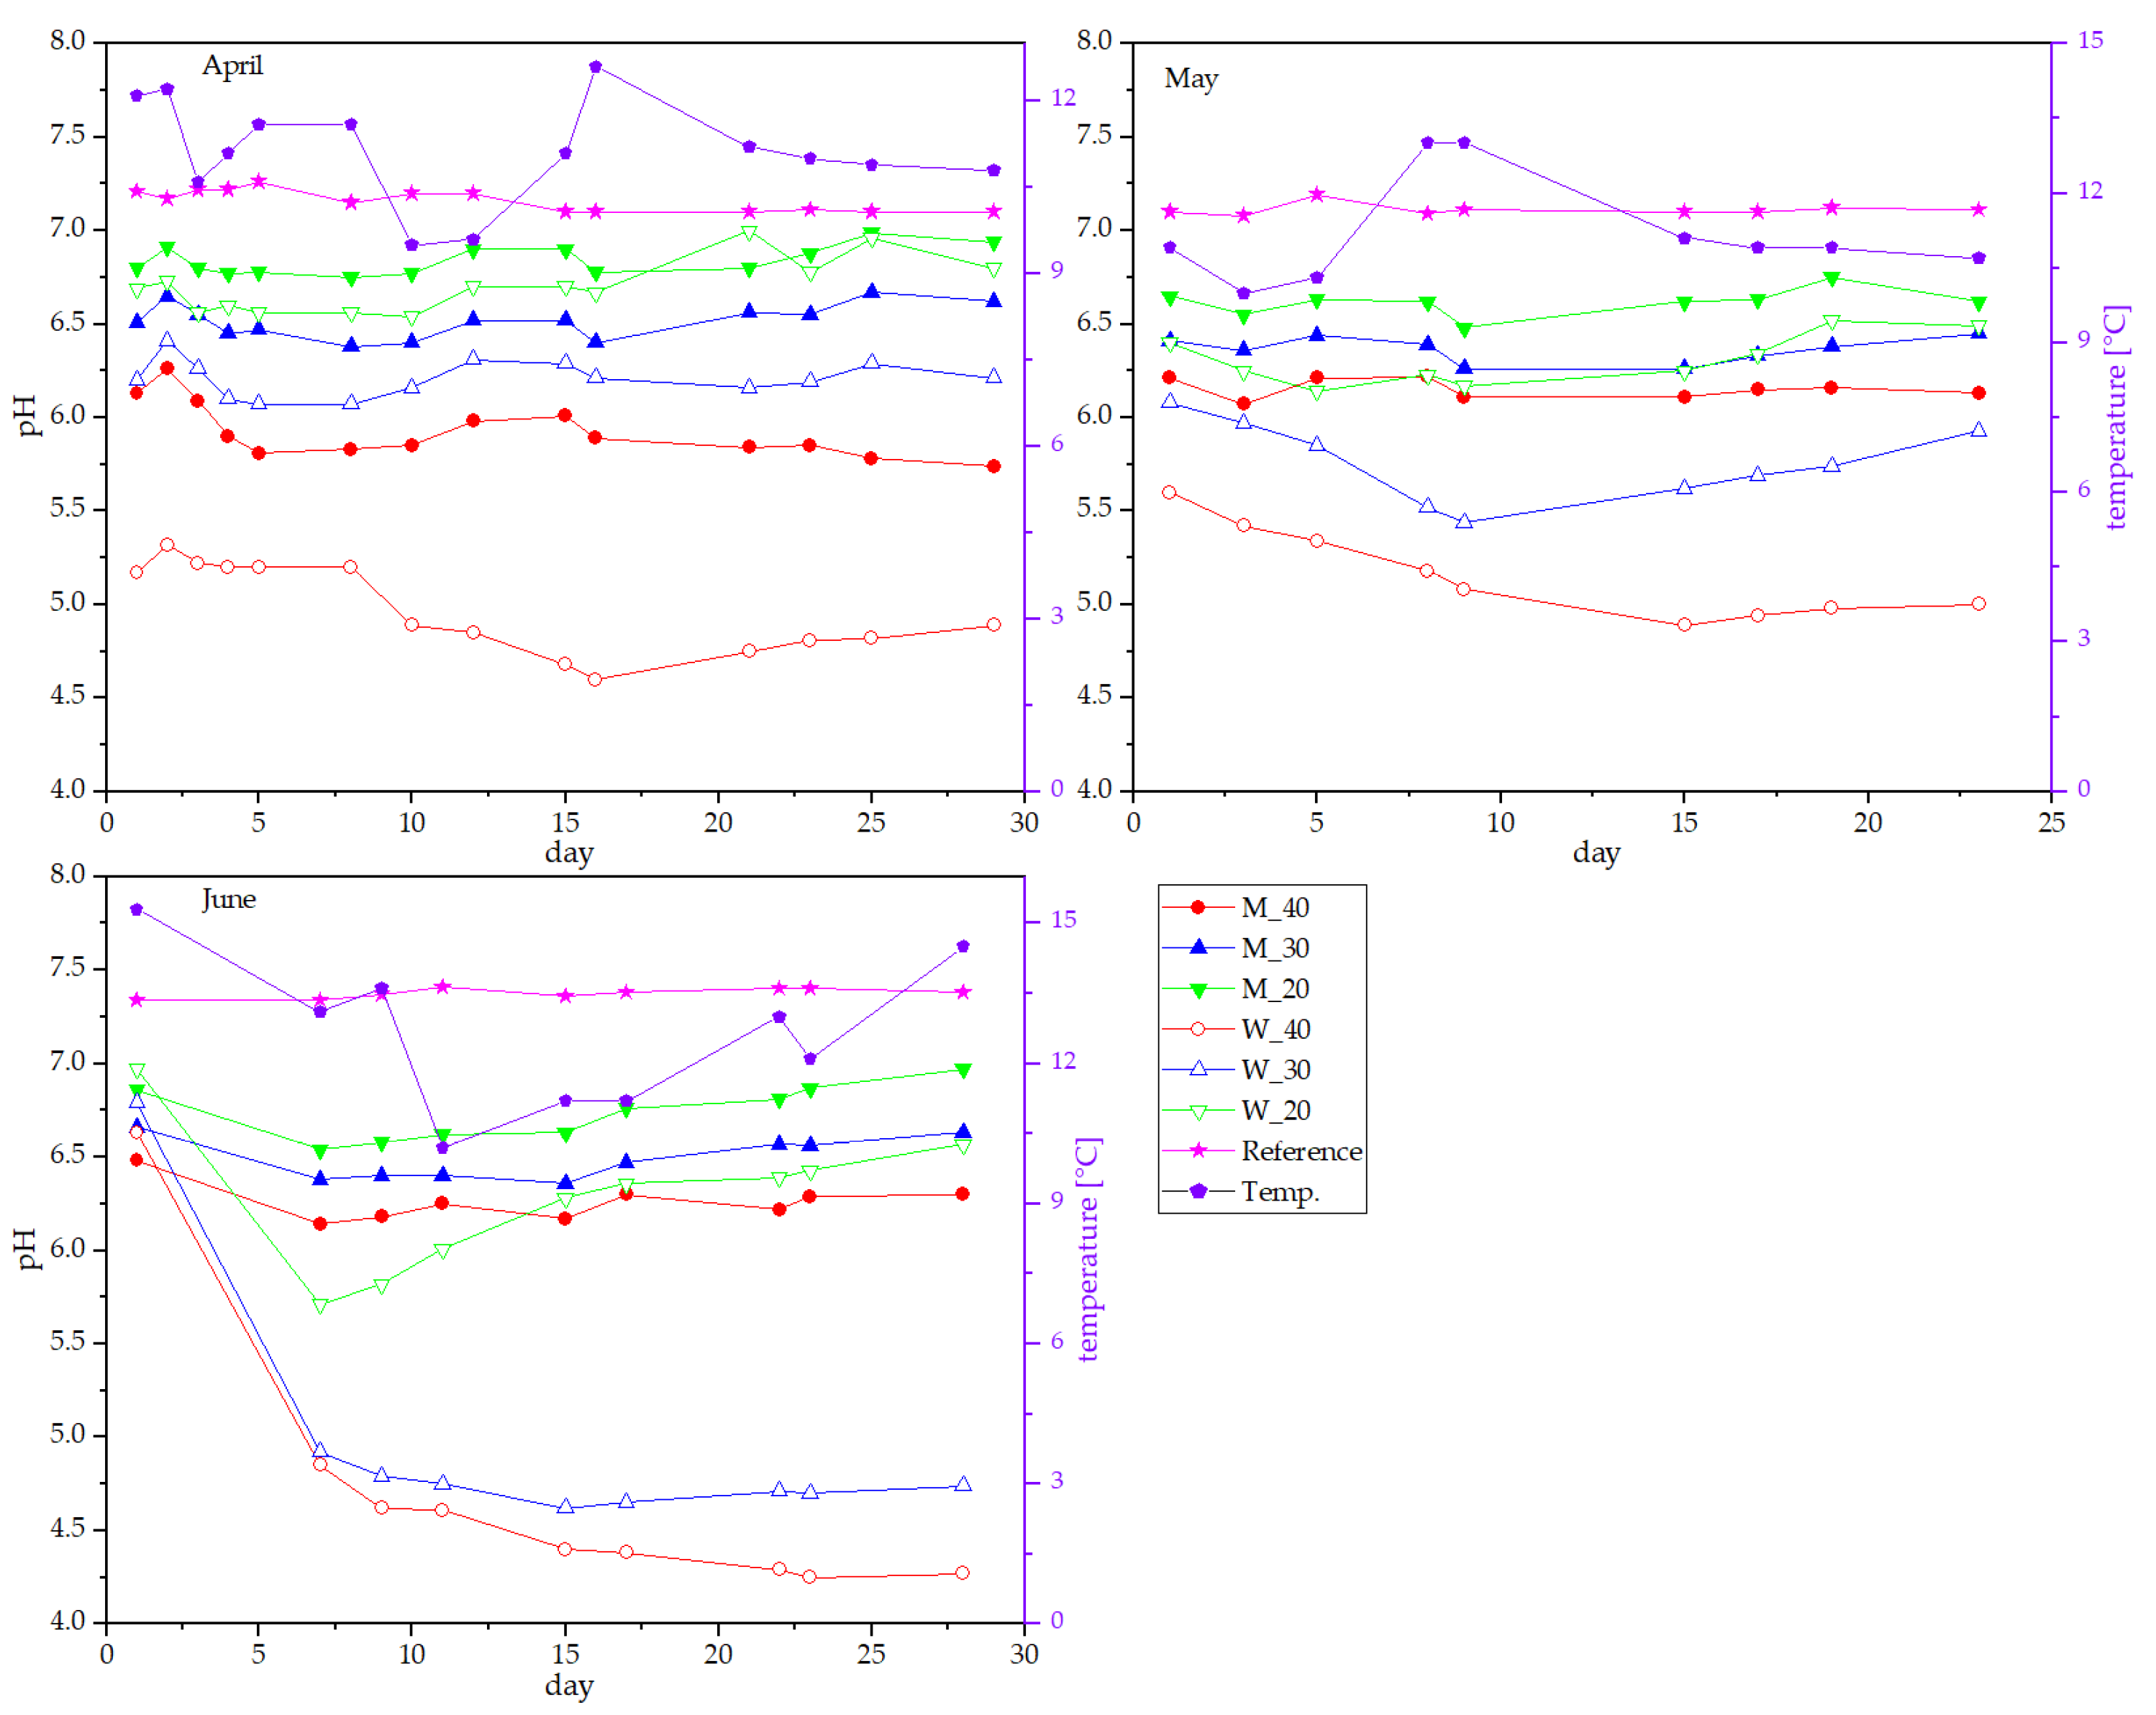
On a larger scale, a total volume of 20 L for each manure/dairy mixture was prepared, and the pH was monitored for up to 1 month. Three measurement series were conducted in April, May, and June. The development of pH for all three setups is shown in
Figure 4. Independently of the dilution with water, manure presented the highest pH, between 7 and 7.5, which did not alter much during the whole period. Addition of various percentages of flushing milk did again lower the pH depending on the amount in the range of 6 to 7, as already observed in the lab-scale trials. Contrary to the observations in the lab-trials, a smaller increase in pH was observed for the flushing milk samples over time, keeping the pH levels lower for a longer time. Once more, acidic whey addition did lower the pH to a higher extent than did flushing milk. For 30% and 40% whey, a reduction to an initial pH of 5.5 and 6 was observed, respectively. Within the first week, the pH decreased further depending on the surrounding temperature, which likely influences the growth of LAB [
32,
36]. As observations concerning pH development in the large-scale experiments mostly matched those in lab-scale monitoring, it could be assumed that the preservation of nitrogen functions in the same way.
3.3. Influence of Solid Content on pH Development
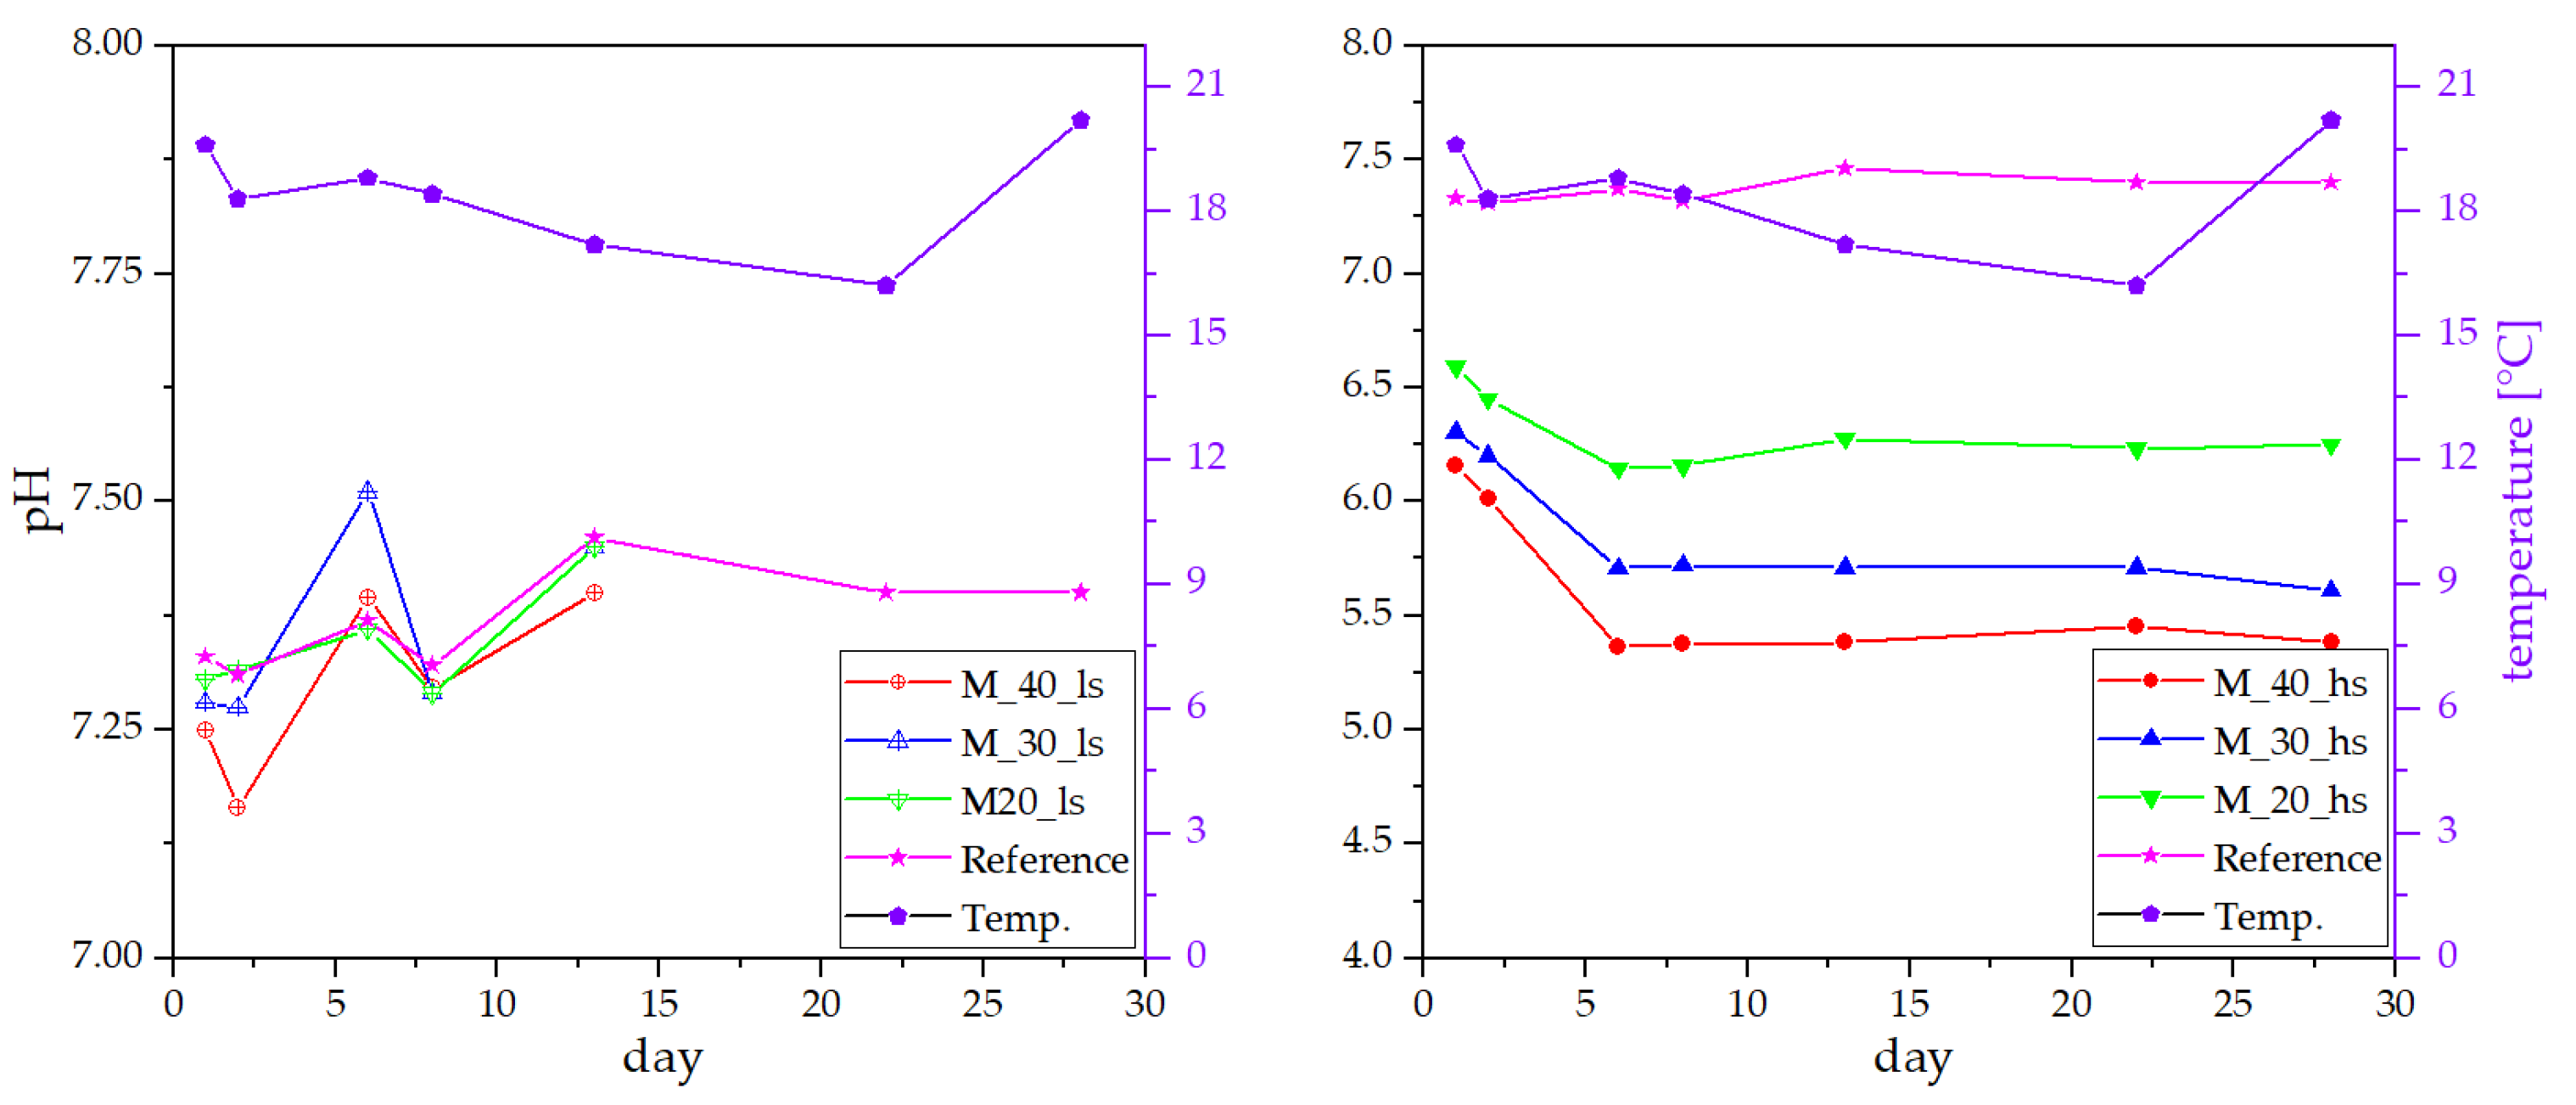
Naturally, the solid content of flushing milk shows strong fluctuation depending on its source. When flushing milk is obtained from cleaning milk trucks, a low solid content is reported (below 1%), but when it is derived from cleaning the tubing after production of high-fat products (yoghurt or other desserts), the solid content can be up to 10%. As the solid content effectively represents an additional dilution factor, it does have a strong influence on the pH reduction ability. In
Figure 5, a comparison of the addition of 40%, 30%, and 20% flushing milk with a solid content of 0.1% (left panel) and 9.7% (right panel) is shown. While no effect of the flushing milk with low solid content (M_%%_ls) was observed, the pH reduction for the high-solid-content milk (M_%%_hs) was still observable after 28 days to a value below 5.5. These results suggest that a higher solid content in flushing milk does reduce the pH for a longer time, as all other trials were conducted using flushing milk with a solid content of roughly 3.5%.
3.4. Field Experiment in Manure Slurry Pits
Monitoring pH development in bench-scale and 20 L containers showed similar results. To finally confirm that the absolute volume of manure only has a small influence on the pH development when the ratio of manure to additive is kept constant, two trials in manure slurry pits were conducted. One pit was mixed with roughly 30% acidic whey, and the other with roughly 30% flushing milk. In both pits, the pH was monitored for the period of about 1 month without further addition of manure slurry into the pit during this period. Results for the measurements are listed in
Table 2. As already observed in the bench-scale trials, the addition of acidic whey resulted in a decrease in pH within the first 2 to 3 weeks. After this initial reduction (from initially pH 7.1 of the pure manure to 4.72 after 14 days), an increase in pH to around 6 was observed. When adding flushing milk, an higher initial pH reduction was observed relative to acidic whey, which is in accordance with the observations during the trials with 20 L containers. Within the first 3 weeks, the pH was constantly kept low at around 6, before it started to increase up to the initial pH of the manure slurry.
4. Discussion
The results for the development of TKN and NH4-N observed in the lab-sized experiments can be compared with the results from the literature where other additive were used to alter the pH value of manure. Sokolov et al. [
16] investigated the effect of sulfuric acid acidification of manure on methane emission over a long period of time. Their initial pH reduction was from 7.57 to 6.2 using sulfuric acid; depending on the conditions, an emission reduction between 18% and 80% was observed [
16]. Berg et al. [
37] investigated the influence of lactic acid on ammonia and methane emission from cattle manure slurry. A pH reduction as low as 4.8 lead to roughly 70% mitigation of nitrogen loss, as confirmed by determination of ammonium and Kjeldahl nitrogen. A pH reduction for the manure achieved with acidic whey is in the same range, therefore a similar mechanism can be assumed (as the main reason is the lactic acid derived from the dairy products). In addition to that, lactic acid showed a beneficial effect also on the emission of methane (reduction of 90%) [
38]. Trials with sulfuric acid conducted by Mannheim [
15] in 1996 investigated the influence of 0.5 m sulfuric acid on nitrogen loss; at a pH as low as 5.8 or 4.2, only 15.9% and 14% of the nitrogen were found to be lost during storage, respectively. This pH reduction is well within the range observed for acidic whey addition and close to that for flushing milk. All previous findings in the literature therefore support the hypothesis that a pH reduction in the range achievable by acidic whey or flushing milk allows for an effective mitigation of nitrogen loss, and at a low enough pH, even for a complete stop of greenhouse gas emissions from manure slurry.
5. Conclusions
In this study, the effect of two by-products from the dairy industry, namely acidic whey and flushing milk, were investigated for their potential to lower the pH of cattle manure slurry and therefore to reduce the nitrogen loss in form of gaseous ammonia. Concentrations from 10% to 50% based on weight were tested for their influence on the manure for several weeks. For all concentrations, a long-lasting reduction of the pH was observed. For flushing milk, the pH was reduced by 1 pH unit on average, while 30%, 40%, and 50% whey reduced pH to as low as 4.5. Depending on the surrounding temperature, concentration, and conditions during storage, the pH reduction with whey was permanent or stabilized at around 6 after some days/weeks.
Total Kjeldahl nitrogen decreased only for the untreated control samples, which also had constant ammonium nitrogen content; this indicates a constant loss of nitrogen to the atmosphere. Low pH whey-modified manure resulted in a slightly but constant increase in ammonium nitrogen as well as Kjeldahl nitrogen. In the case of flushing milk, the pH reduction was not as severe and therefore favored the hydrolysis of urea into ammonium, indicated by the significant increase in ammonium nitrogen while also keeping the total Kjeldahl nitrogen constant. Monitoring the growth of lactic-acid-producing bacteria on MRS agar showed an increase in the flushing milk samples, explaining the increase in ammonium nitrogen, while simultaneously increases in Kjeldahl nitrogen were observed. After an initial propagation of bacteria colonies in the whey-treated manure, CFUs decreased, likely because of the acidic environment or a shortage of lactose.
Repeating the experiments at a larger scale (20 L or manure slurry pit) resulted in pH developments following the trend observed in the lab-scale trials, allowing for the assumption that the positive influence of dairy by-product addition on nitrogen loss of manure is independent of the scale, and both acidic whey and flushing milk preserve nitrogen within the manure slurry. However, in order to quantify the potential impact of manure dairy treatment on greenhouse gas emissions, further studies involving a precise monitoring of the gaseous emissions over a long period of time are required. This opens the opportunity for future research in this field and also to further confirm the findings presented in this study. It will be important to quantify the impact of dairy addition on global warming potential.
This novel approach to reduce the pH, subsequently adding value to by-products normally flushed down the drain, provides a sustainable and natural alternative in manure treatment compared with currently available additives. This approach also mitigates the necessity of using special field application equipment, which could prove difficult in certain parts of the alpine region (e.g., ground infection on steep alpine meadows).
Author Contributions
Conceptualization, T.S. and K.S.; Data curation, T.S.; Funding acquisition, A.P. and K.S.; Investigation, T.S.; Methodology, T.S. and K.S.; Project administration, A.P. and K.S.; Resources, A.P. and K.S.; Visualization, T.S.; Writing—original draft, T.S. All authors have read and agreed to the published version of the manuscript.
Funding
This research was funded by AWS (Austrian Wirtschafts Service). Grant number P1727558-IWB01, in scope of the EFRE Project IWB Zentrum Smart Materials.
Institutional Review Board Statement
Not applicable.
Informed Consent Statement
Not applicable.
Data Availability Statement
Not applicable.
Acknowledgments
The authors are grateful to Käserei Gebrüder Woerle Ges.m.b.H and Pinzgau Milch Produktions GmbH for supplying the dairy products and providing financial support for test equipment used in the large-scale trials; the students from HBLA Ursprung (Sonja Laimböck, Leonhard Pajk, Andreas Rahm, Bianca Stroner, and Eva Webhofer) for performing the larger-scale experiments (pH measurements, sample preparation); and estate agent Franz Griessner.
Conflicts of Interest
The authors declare no conflict of interest.
References
- Erisman, J.W.; Bleeker, A.; Hensen, A.; Vermeulen, A. Agricultural air quality in Europe and the future perspectives. Atmos. Environ. 2008, 42, 3209–3217. [Google Scholar] [CrossRef] [Green Version]
- Paulot, F.; Jacob, D.J.; Pinder, R.W.; Bash, J.O.; Travis, K.; Henze, D.K. Ammonia emissions in the United States, European Union, and China derived by high-resolution inversion of ammonium wet deposition data: Interpretation with a new agricultural emissions inventory (MASAGE_NH3). J. Geophys. Res. Atmos. 2014, 119, 4343–4364. [Google Scholar] [CrossRef]
- Zhu, M.; Lai, J.-K.; Wachs, I.E. Formation of N2O greenhouse gas during SCR of NO with NH3 by supported vanadium oxide catalysts. Appl. Catal. B Environ. 2018, 224, 836–840. [Google Scholar] [CrossRef]
- Ravishankara, A.R.; Daniel, J.S.; Portmann, R.W. Nitrous Oxide (N2O): The Dominant Ozone-Depleting Substance Emitted in the 21st Century. Science 2009, 326, 123–125. [Google Scholar] [CrossRef] [PubMed] [Green Version]
- Bergstrom, A.-K.; Jansson, M. Atmospheric nitrogen deposition has caused nitrogen enrichment and eutrophication of lakes in the northern hemisphere. Glob. Chang. Biol. 2006, 12, 635–643. [Google Scholar] [CrossRef]
- Song, H.; Che, Z.; Cao, W.; Huang, T.; Wang, J.; Dong, Z. Changing roles of ammonia-oxidizing bacteria and archaea in a continuously acidifying soil caused by over-fertilization with nitrogen. Environ. Sci. Pollut. Res. 2016, 23, 11964–11974. [Google Scholar] [CrossRef] [PubMed]
- Commission of the European Communities Communication from the Commission to the Council and the European Parliament. Available online: https://www.eea.europa.eu/policy-documents/communication-from-the-commission-to-1 (accessed on 15 September 2021).
- Umweltbundesamt Ammoniak. Available online: https://www.umweltbundesamt.at/umweltthemen/luft/luftschadstoffe/ammoniak (accessed on 15 September 2021).
- United Nations Economic Commission for Europe. Assessment Report on Ammonia—2020; United Nations Economic Commission for Europe: Geneva, Switzerland, 2020. [Google Scholar]
- Scotto di Perta, E.; Mautone, A.; Oliva, M.; Cervelli, E.; Pindozzi, S. Influence of Treatments and Covers on NH3 Emissions from Dairy Cow and Buffalo Manure Storage. Sustainability 2020, 12, 2986. [Google Scholar] [CrossRef] [Green Version]
- Varel, V.H.; Nienaber, J.A.; Freetly, H.C. Conservation of nitrogen in cattle feedlot waste with urease inhibitors. J. Anim. Sci. 1999, 77, 1162–1168. [Google Scholar] [CrossRef] [PubMed]
- Hagenkamp-Korth, F.; Haeussermann, A.; Hartung, E.; Reinhardt-Hanisch, A. Reduction of ammonia emissions from dairy manure using novel urease inhibitor formulations under laboratory conditions. Biosyst. Eng. 2015, 130, 43–51. [Google Scholar] [CrossRef]
- Sommer, S.G.; Clough, T.J.; Balaine, N.; Hafner, S.D.; Cameron, K.C. Transformation of Organic Matter and the Emissions of Methane and Ammonia during Storage of Liquid Manure as Affected by Acidification. J. Environ. Qual. 2017, 46, 514–521. [Google Scholar] [CrossRef] [PubMed]
- Yu, H.; Huang, G.H. Effects of sodium acetate as a pH control amendment on the composting of food waste. Bioresour. Technol. 2009, 100, 2005–2011. [Google Scholar] [CrossRef]
- Mannheim, T. Ammoniakemissionen von Landwirtschaftlichen Nutzflächen: Quellen und Minderungsmaßnahmen. Dissertation im Fachbereich Agrarwissenschaften. Ph.D. Thesis, Universität Hohenheim, Stuttgart, Germany, 1996. [Google Scholar]
- Sokolov, V.K.; VanderZaag, A.; Habtewold, J.; Dunfield, K.; Wagner-Riddle, C.; Venkiteswaran, J.J.; Crolla, A.; Gordon, R. Dairy manure acidification reduces CH4 emissions over short and long-term. Environ. Technol. 2021, 42, 2797–2804. [Google Scholar] [CrossRef]
- Wong, J.W.-C.; Fung, S.O.; Selvam, A. Coal fly ash and lime addition enhances the rate and efficiency of decomposition of food waste during composting. Bioresour. Technol. 2009, 100, 3324–3331. [Google Scholar] [CrossRef]
- Shi, Y.; Parker, D.B.; Cole, N.A.; Auvermann, B.W.; Mehlhorn, J.E. Surface amendments to minimize ammonia emissions from beef cattle feedlots. Trans. ASAE 2001, 44, 677. [Google Scholar] [CrossRef] [Green Version]
- Chan, M.T.; Selvam, A.; Wong, J.W.C. Reducing nitrogen loss and salinity during ‘struvite’ food waste composting by zeolite amendment. Bioresour. Technol. 2016, 200, 838–844. [Google Scholar] [CrossRef] [PubMed]
- Chen, H.; Awasthi, M.K.; Liu, T.; Zhao, J.; Ren, X.; Wang, M.; Duan, Y.; Awasthi, S.K.; Zhang, Z. Influence of clay as additive on greenhouse gases emission and maturity evaluation during chicken manure composting. Bioresour. Technol. 2018, 266, 82–88. [Google Scholar] [CrossRef] [PubMed]
- Sepperer, T.; Tondi, G.; Petutschnigg, A.; Young, T.M.; Steiner, K. Mitigation of ammonia emissions from cattle manure slurry by tannins and tannin-based polymers. Biomolecules 2020, 10, 581. [Google Scholar] [CrossRef] [Green Version]
- Chen, G.Q.; Eschbach, F.I.I.; Weeks, M.; Gras, S.L.; Kentish, S.E. Removal of lactic acid from acid whey using electrodialysis. Sep. Purif. Technol. 2016, 158, 230–237. [Google Scholar] [CrossRef]
- Nie, E.; Gao, D.; Zheng, G. Effects of lactic acid on modulating the ammonia emissions in co-composts of poultry litter with slaughter sludge. Bioresour. Technol. 2020, 315, 123812. [Google Scholar] [CrossRef]
- Hofvendahl, K.; Hahn-Hägerdal, B. Factors affecting the fermentative lactic acid production from renewable resources1. Enzyme Microb. Technol. 2000, 26, 87–107. [Google Scholar] [CrossRef]
- AustrianStandards. ÖNORM EN 16169:2012 10 01 Sludge, Treated Biowaste and Soil—Determination of Kjeldahl Nitrogen. 2012. Available online: https://standards.iteh.ai/catalog/standards/cen/9e028236-52b8-4a63-b343-46809ae9a286/en-16169-2012 (accessed on 18 September 2021).
- Dewes, T. Effect of pH, temperature, amount of litter and storage density on ammonia emissions from stable manure. J. Agric. Sci. 1996, 127, 501–509. [Google Scholar] [CrossRef]
- Rama, G.R.; Kuhn, D.; Beux, S.; Maciel, M.J.; Volken de Souza, C.F. Potential applications of dairy whey for the production of lactic acid bacteria cultures. Int. Dairy J. 2019, 98, 25–37. [Google Scholar] [CrossRef]
- Burns, P.; Vinderola, G.; Molinari, F.; Reinheimer, J. Suitability of whey and buttermilk for the growth and frozen storage of probiotic lactobacilli. Int. J. Dairy Technol. 2008, 61, 156–164. [Google Scholar] [CrossRef]
- Canon, F.; Nidelet, T.; Guédon, E.; Thierry, A.; Gagnaire, V. Understanding the Mechanisms of Positive Microbial Interactions That Benefit Lactic Acid Bacteria Co-cultures. Front. Microbiol. 2020, 11. [Google Scholar] [CrossRef]
- Song, Y.-S.; Frias, J.; Martinez-Villaluenga, C.; Vidal-Valdeverde, C.; de Mejia, E.G. Immunoreactivity reduction of soybean meal by fermentation, effect on amino acid composition and antigenicity of commercial soy products. Food Chem. 2008, 108, 571–581. [Google Scholar] [CrossRef] [PubMed]
- Fidaleo, M.; Lavecchia, R. Kinetic study of enzymatic urea hydrolysis in the pH range 4–9. Chem. Biochem. Eng. Q. 2003, 17, 311–318. [Google Scholar]
- Yang, E.; Fan, L.; Yan, J.; Jiang, Y.; Doucette, C.; Fillmore, S.; Walker, B. Influence of culture media, pH and temperature on growth and bacteriocin production of bacteriocinogenic lactic acid bacteria. AMB Express 2018, 8, 10. [Google Scholar] [CrossRef] [Green Version]
- LeBlanc, J.G.; Garro, M.S.; Savoy de Giori, G. Effect of pH on Lactobacillus fermentum growth, raffinose removal, α-galactosidase activity and fermentation products. Appl. Microbiol. Biotechnol. 2004, 65, 119–123. [Google Scholar] [CrossRef] [PubMed]
- Hutkins, R.W.; Nannen, N.L. pH Homeostasis in Lactic Acid Bacteria. J. Dairy Sci. 1993, 76, 2354–2365. [Google Scholar] [CrossRef]
- Pan, J.; Fadel, J.G.; Zhang, R.; El-Mashad, H.M.; Ying, Y.; Rumsey, T. Evaluation of sample preservation methods for poultry manure. Poult. Sci. 2009, 88, 1528–1535. [Google Scholar] [CrossRef] [PubMed]
- Adamberg, K. The effect of temperature and pH on the growth of lactic acid bacteria: A pH-auxostat study. Int. J. Food Microbiol. 2003, 85, 171–183. [Google Scholar] [CrossRef]
- Berg, W.; Türk, M.; Hellebrand, J.M. Effects of Acidifying Liquid Cattle Manure with Nitric or Lactic Acid on Gaseous Emissions; Workshop on Agricultural Air Quality: State of the Science: Potomac, MD, USA, 2006; pp. 492–498. [Google Scholar]
- Höring, G.; Berg, W.; Türk, M. Emissionsminderung durch Ansäuern von Gülle. Landtechnik 1998, 53, 146–147. [Google Scholar] [CrossRef]
| Publisher’s Note: MDPI stays neutral with regard to jurisdictional claims in published maps and institutional affiliations. |
© 2021 by the authors. Licensee MDPI, Basel, Switzerland. This article is an open access article distributed under the terms and conditions of the Creative Commons Attribution (CC BY) license (https://creativecommons.org/licenses/by/4.0/).


