Article

Particulate PAH Transport Associated with Adult Chronic Cough Occurrence Closely Connected with Meteorological Conditions: A Modelling Study

1
Institute of Natural Science and Technology, Kanazawa University, Kakuma-machi, Kanazawa 920-1192, Japan
2
Frontier Engineering, Kanazawa University, Kakuma-machi, Kanazawa 920-1192, Japan
3
Department of Environmental and Preventive Medicine, Kanazawa University, 13-1, Takara-machi, Kanazawa 920-8640, Japan
4
Meteorological Research Institute, 1-1, Nagamine, Tsukuba 305-0052, Japan
*
Author to whom correspondence should be addressed.
Atmosphere 2021, 12(9), 1163; https://doi.org/10.3390/atmos12091163
Submission received: 2 August 2021 / Revised: 3 September 2021 / Accepted: 7 September 2021 / Published: 10 September 2021
(This article belongs to the Special Issue Aerosol Pollution in Asia)

Abstract

:
Exposure to polycyclic aromatic hydrocarbons (PAHs) are a cause of chronic cough occurrence in adult patients. In order to clear the relationship between transboundary transport of PAH and health effects, this study investigates the relationship between atmospheric particulate PAHs (p-PAHs), cough occurrence by epidemiological research, and meteorological conditions using a chemical transport model. Source receptor relationship (SRR) analysis revealed that a higher cough occurrence was caused by exposure to high p-PAH levels in air masses transported from central China (CCHN, 30–40° N) under westerly conditions. The p-PAHs transported from northern China (NCHN, >40° N) and the eastern part of Russia (ERUS) under north-westerly conditions also contributed to cough occurrence. The low equivalent potential temperature (ePT) and geopotential height anomaly suggested that the p-PAHs emitted near the surface were suppressed to upward transport under the colder air mass but were instead transported horizontally near the surface in the boundary layer, resulting in high p-PAH concentrations arriving in Kanazawa. Our study’s findings suggest that the air mass transport pattern associated with meteorology strongly influences the high p-PAH concentrations causing adult chronic cough occurrence.

1. Introduction

Exposure to ambient gaseous air pollutants and particulate matter (PM) has been associated with various adverse health effects [1,2,3,4,5,6]. In particular, the mass concentration of PM was systematically adopted as an indicator of the exposure to air pollutants because the ultrafine and fine fractions of PM are considered to yield a high toxicity related to condensation and/or coagulation of chemical components.
Previous epidemiological studies have revealed that ambient PM may pose a high risk, especially in regard to cardiovascular disease, asthma, and lung cancer [3,5,7,8,9]. Although many studies have focused on the mass concentrations of PM, several specific components were targeted to investigate the adverse health effects of PM because of their toxic, mutagenic, and carcinogenic properties. Polycyclic aromatic hydrocarbons (PAHs), which are emitted by the incomplete combustion of fossil fuels (coal and oil), biomass burning, coke production, metal production, and vehicle exhaust gases [10], are considered as one of the most important atmospheric pollutants generating adverse health effects [11]. The potential risk of PAH exposure was evaluated by risk assessment [12] and epidemiological research [13]. By epidemiological research, Anyenda et al., (2016) reported that exposure to p-PAHs is strongly associated with chronic cough occurrence in adult patients in a coastal site in the eastern part of the Sea of Japan [14].
However, these analyses did not consider the influence of transboundary transport of PAHs. In the northeast of Asia, atmospheric pollutions are having advection and diffusion via transboundary transport from the Asian continent under westerly wind conditions. Humans living in the downwind region are exposed by these atmospheric pollutants. It is necessary to consider the feature prediction to decrease the cough occurrence or other diseases associated with the transboundary transport of pollutants. The chemical transport model is useful to investigate the transboundary transport of atmospheric pollution. We have analyzed the spatial and temporal distribution of PAHs by using the regional air quality model (RAQM2-POP) [15,16].
The purpose of this study is to investigate the effect of transboundary transport of p-PAHs for inducing the adult chronic cough, which were the results provided by Anyenda et al., (2016) [14], using the chemical transport model [15,16,17,18,19]. Source–receptor relationship (SRR) analysis of the p-PAH concentration was conducted to estimate the source contributions of trace constituents. Moreover, we also investigated the meteorological conditions facilitating the transboundary transport of p-PAHs in Northeast Asia.

2. Methods

2.1. Model Description

The RAQM2-POP was used to simulate the PAH concentration. We have previously investigated the distribution of the p-PAH concentration in the Northeast Asia and an SRR has been conducted of the p-PAH concentration and deposition process with the above model [15,16,18]. Therefore, we only provide a brief description of the PAH simulation process here. The Weather Research and Forecasting model version 3.3 (WRFV3) [20] was adopted to provide the meteorological fields required for RAQM2-POP. Final operational global analysis data from the National Centers for Environmental Prediction (ds083.2: http://rda.ucar.edu/datasets/ds083.2, accessed on 9 September 2021) provided the initial and boundary conditions required for WRFV3 (http://rda.ucar.edu, accessed on 6 September 2021). In this model, the physical and chemical submodules (turbulent diffusion, photochemistry, new particle formation, condensation, evaporation, Brownian coagulation, dry deposition, grid-scale wet scavenging (i.e., cloud condensation nucleus (CCN) and ice nucleus (IN) activation and subsequent cloud microphysical processes), grid-scale aqueous chemistry in hydrometers and aerosol water and sub-grid-scale convection and wet scavenging processes) are included [17]. In RAQM2-POP, gas-particulate partitioning and oxidation of POPs are considered as based on the MSCE-POP model [21]. Details of the model have been previously reported in Inomata et al., (2013) [16]. PAH partitioning between the gas and particulate phases was performed with the Junge–Pankow model based on the subcooled liquid vapor pressure [22,23]. Oxidation of PAHs was considered for the gas and particulate phases reacting with OH radicals and O3. Temperature-dependent degradation rate constants of the gas and particulate phase reactions with OH radicals and O3 were applied for each species.
The model domains covered most Northeast Asian countries. The horizontal grid resolution was 60 km based on the Lambert conformal map projection. There were 27 vertical layers in WRFV3 from the ground surface to 100 hPa. These layers were interpolated to 13 layers, which correspond to 1000, 990, 980, 960, 930, 890, 850, 800, 700, 600, 500, 250, 0 hPa, from the ground to 10 km in RAQM2-POP.
The simulation was conducted from January to June 2011 based on the observation data. Simulated concentrations of p-PAH were output on an hourly basis. The simulated p-PAH concentrations were validated against daily observed PAH concentrations in Kanazawa, Japan [14].

2.2. Emission Inventory

We developed a PAH emission inventory (denoted as the Regional Emission inventory in ASia for POPs version 2, REAS-POP ver2) based on the Regional Emission inventory in ASia version 2 (REAS ver2) [24]. The area covered in REAS-POP ver2 is China, the eastern part of Russia, Mongolia, North Korea, South Korea, Japan, and Taiwan. The PAH emissions were estimated as the product of the fuel consumption rate and the emission factor. The fuel consumption rates were divided into three categories: stationary, on-road mobile, and open biomass burning sources. Relevant fuel consumption data for the stationary and on-road mobile sources were derived from REAS ver2, and those for open biomass burning were derived from the Global Fire Emissions Database version 3 (GFEDv3) [25].
REAS-POP ver2 included emission data for the following 16 PAHs: naphthalene (NaP), acenaphthylene (Acy), acenaphthene (Ace), fluorene (Fle), phenanthrene (Phe), anthracene (Ant), fluoranthene (Flu), pyrene (Pyr), benz[a]anthracene (BaA), chrysene (Chr), benzo[b]fluoranthene (BbF), benzo[k]fluoranthene (BkF), benzo[a]pyrene (BaP), dibenz[a,h]anthracene (DahA), indeno[1,2,3-cd]pyrene (IcdP), and benzo[g,h,i]perylene (BghiP). These PAHs are listed as priority pollutants by the United States Environmental Protection Agency (IARC, 2010) [11].
The PAH emission data were gridded at 0.50° × 0.5° and interpolated to model grids with a 60 km × 60 km resolution. The PAH emission period lasted from 2000 to 2008. The temporal resolution was one month. In this study, the data in 2008 were used to determine the PAH emissions.

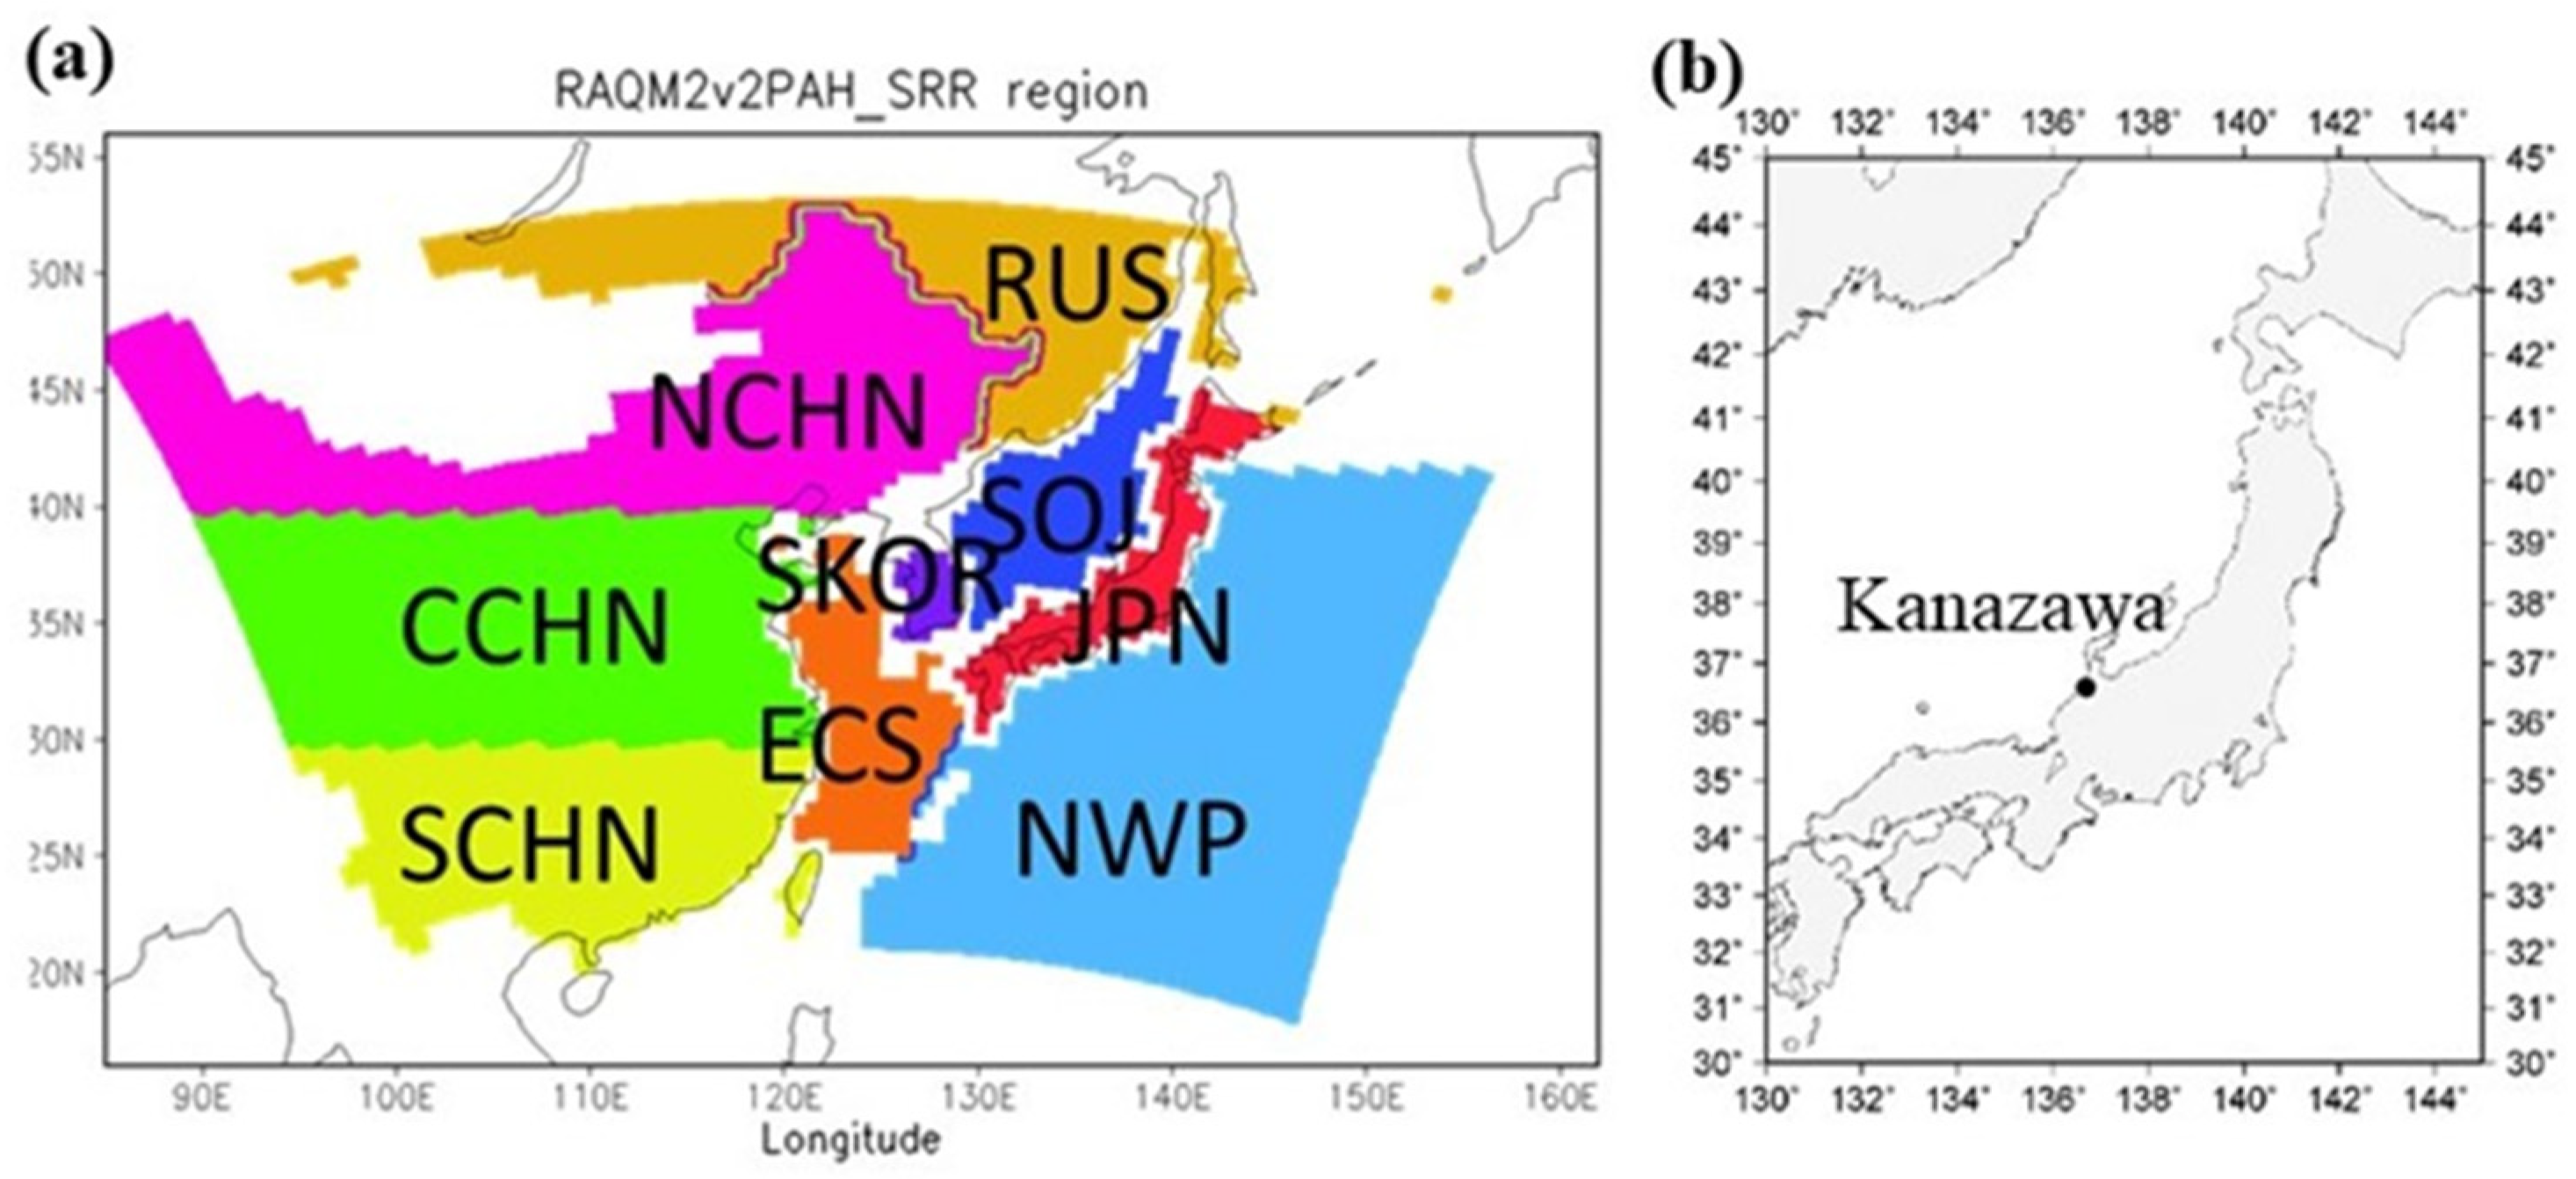
2.3. Source-Receptor Relationship Analysis Method

The source–receptor relationship analysis employed in this study was almost the same as that used in our previous study [16,18]. We provide a short description here. The brute force method was used to perform SRR analysis of the p-PAH concentration. We simulated two different programs, a control run and an emission-reduced run. The control run was simulated with the original emission inventory, whereas in the emission-reduced run, the emissions in each domain were reduced by 20%.
The control run was simulated with the original PAH emissions, whereas in the emission-reduced run, the emissions in each region were reduced by 20%. Because a large reduction could cause nonlinear effects such as photochemical reactions, several studies have adopted reduction rates ranging from 10–25% [26,27].
Northeast Asia was divided into six source-receptor regions (Figure 1a): northern China (NCHN, north of 40° N); central China (CCHN, 30° N–40° N); southern China (SCHN, south of 30° N); eastern Russia (ERUS); South Korea (SKOR); and Japan (JPN).
The SRR of the p-PAH concentration was calculated as:
R i , j ( % ) = D j D i 20 % , j D j   ×   5   ×   100
where Ri,j is the contribution of the ith emission source to the jth receptor, Dj is the concentration at the jth receptor in the control run and Di-20%,j is the concentration at the jth receptor in the 20% emission reduction run.

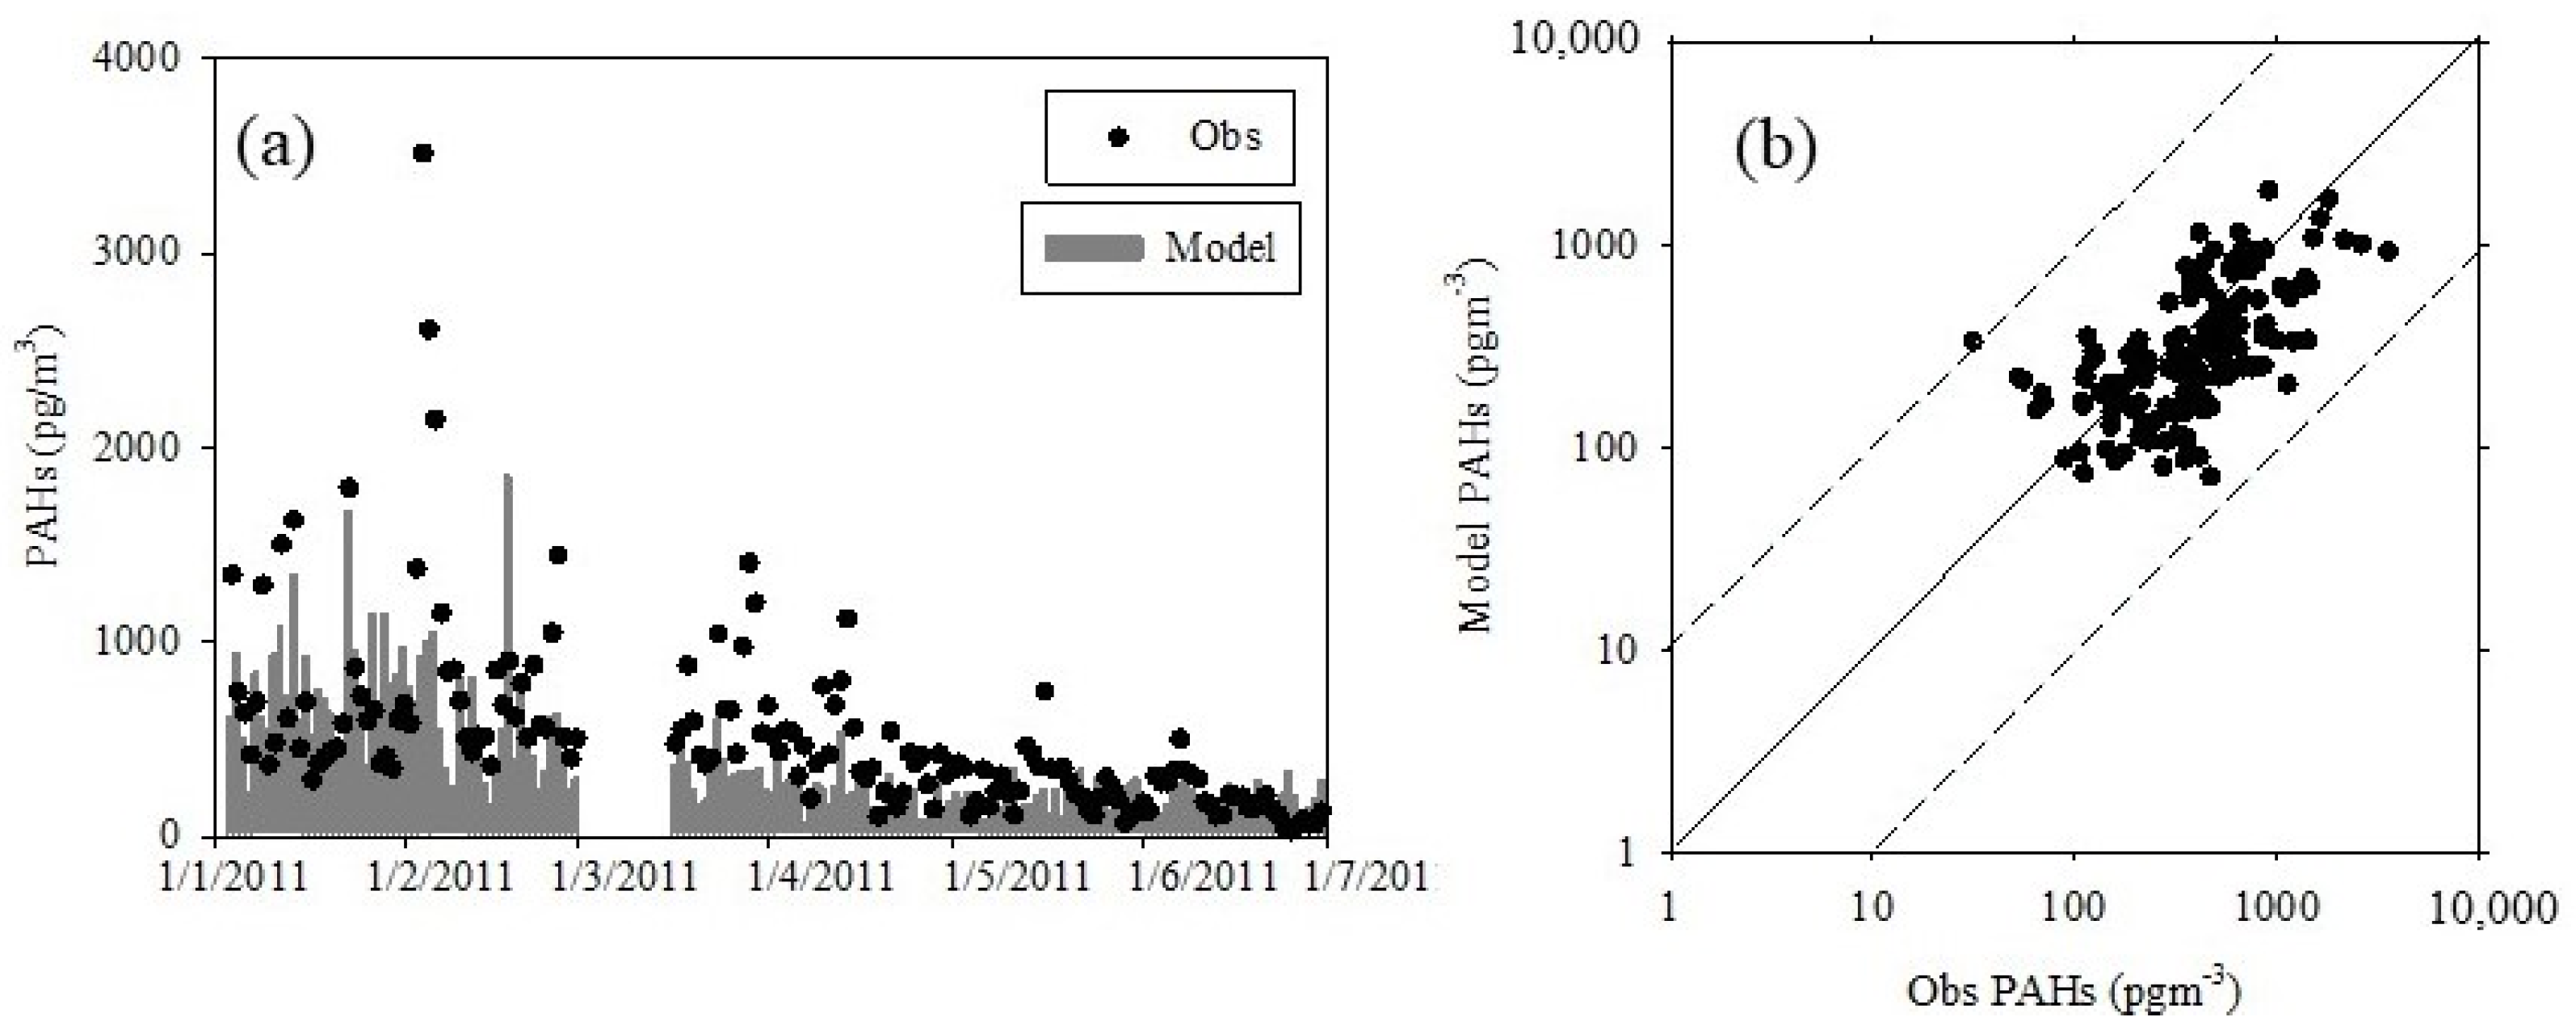
2.4. Model Validation Using the Observed Data

The RAQM-POP model’s performance was evaluated by comparing the observed and simulated concentration data. Figure 2a shows the observed and simulated p-PAH concentrations, which are the sum of Flu, Pyr, Chr, BbF, BkF, and BaP, from 4 January to 30 June 2011 in Kanazawa. The temporal variations in the simulated p-PAH concentrations agreed well with those in the measured concentrations. The scatter plot between the observed and modelled concentrations indicated that the modelling results agree with the observed data within a factor of 10 (Figure 2b).

2.5. Observations of the p-PAH Concentration and Epidemiological Analysis

The p-PAH concentration data and epidemiological analysis method were derived from Anyenda et al., (2016) [14]. We present a short description in this study.

2.5.1. Analysis of the Ambient p-PAHs

The daily ambient particulate matter was sampled in Kanazawa University, a coastal site of the Sea of Japan, Japan (136.7° E, 36.6° N) (Figure 1b). The sampling period lasted from 4 January to 30 June 2011. Analysis of the ambient p-PAHs was conducted by high-performance liquid chromatography with fluorescence detection.

2.5.2. Epidemiological Analysis

Epidemiological analysis data were derived from Ayenda et al., (2016). [14]. In this section, we briefly describe only the main information. The data used in this study were obtained from 88 patients who underwent a medical examination at the Kanazawa University Hospital, Japan (Figure 1b). Table 1 lists the summary of the dataset. The patients were adults older than 20 years. Each participant recorded their daily number of coughs and symptoms or no cough. The diagnoses by physicians mainly included asthma (adult bronchial asthma), cough variant asthma (CVA), and atopic cough (AC). Asthma is characterized by chronic airway inflammation, reversible airway narrowing, and airway hyperresponsiveness [28]. CVA is a type of asthma, and the dominant symptom is a dry cough without wheezing or shortness of breath. CVA is also called chronic cough and persists for longer than six-to-eight weeks. Furthermore, it is defined as a precursor of asthma [29]. AC is considered a non-asthmatic bronchodilator-resistant chronic cough with atopy [30]. The asthma, CVA, and AC diagnoses were based on specific guidelines such as those reported by Ohta et al., (2011) [28], Kohno et al., (2006) [31], and Fujimura et al., (2005) [32], respectively. In Anyenda et al., (2016) [14], these data were divided into two cases: an asthma group (asthma, asthma and AC) and a non-asthma group (CVA, AC, CVA and AC) (Table 2). The ratio of these classification is also listed in Table 2. In total, 12473 datasets were used to complete the longitudinal analysis.
In order to investigate the p-PAHs exposure and cough occurrence, the generated estimating equations (GEEs) model was used. The GEEs model is a statistical model, which tests hypotheses regarding the influence of factors on binary and other exponentially with time by using binary or count data. The GEEs model estimates regression coefficients and standard errors to investigate the main effects or interactions to evaluate variables [33,34]. In this study, the GEEs model’s regression parameters are expressed as symptom odds ratios per unit change in p-PAH. Statistical analysis was performed using the SPSS software program for MS Windows, version 19.0 (SPSS, Inc., New York, NY, USA).

3. Results and Discussion

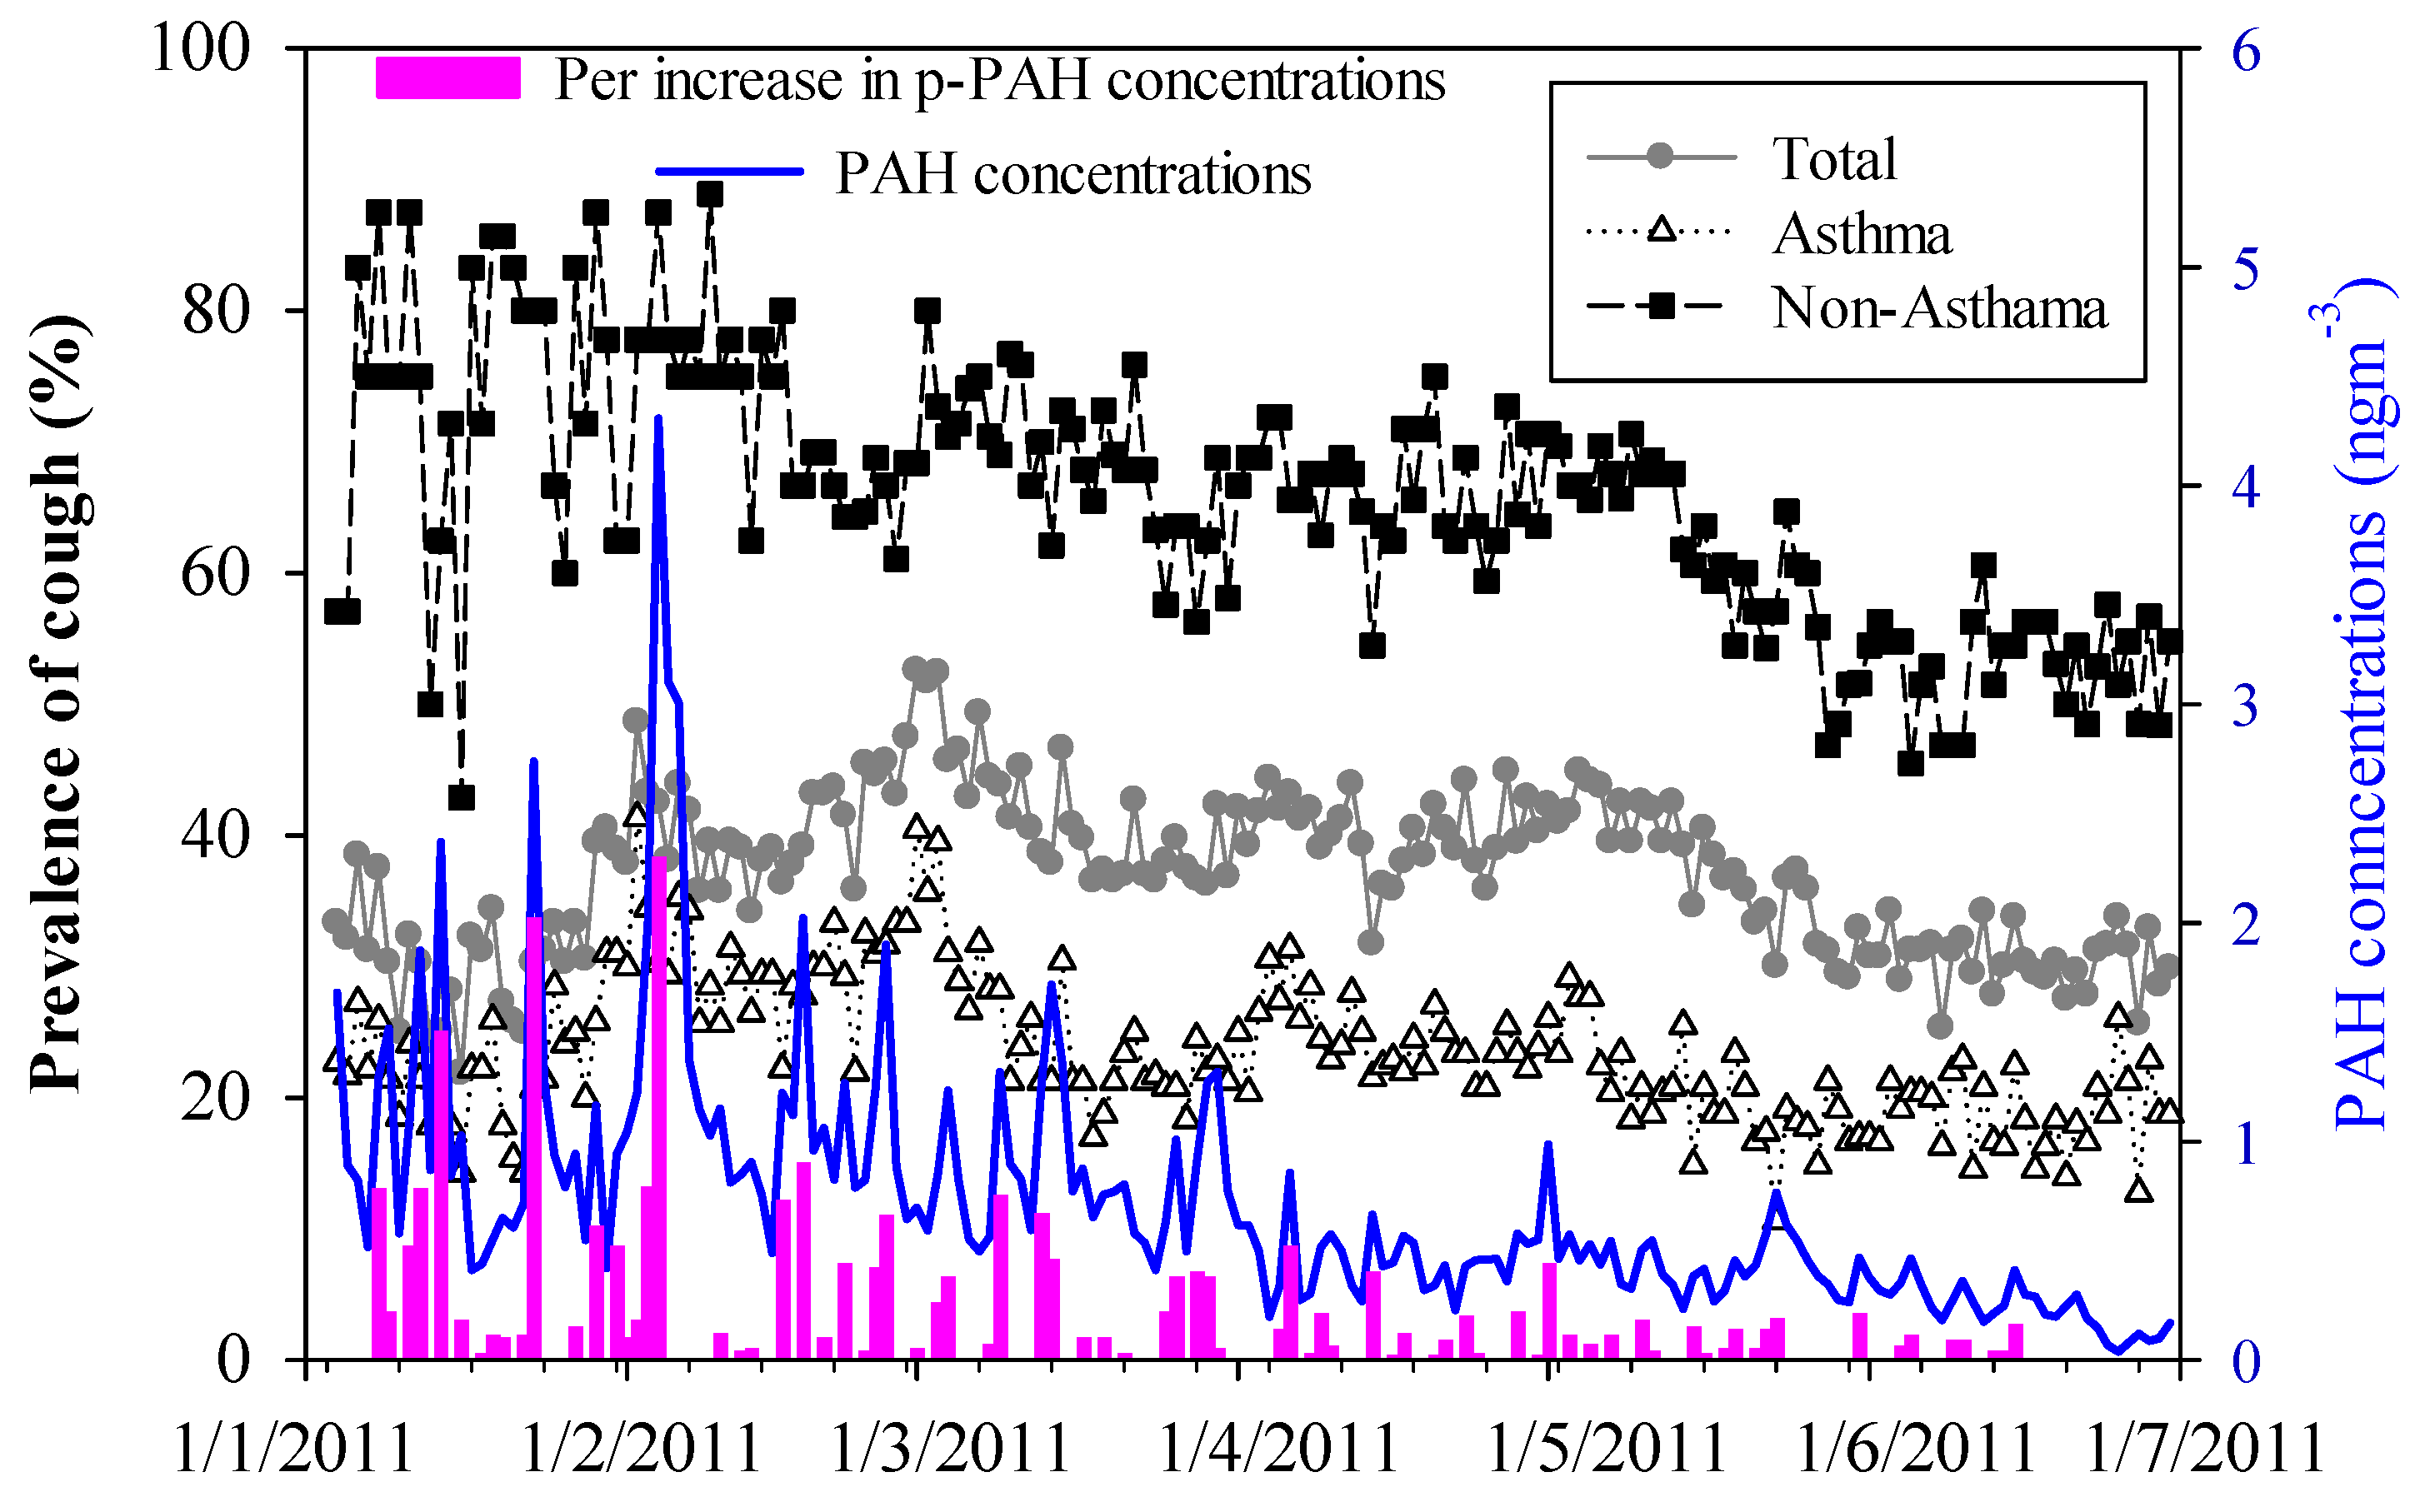
3.1. Relation of the Daily Cough Occurrence and p-PAH Concentration

Figure 3 shows the temporal variations in the daily cough prevalence for the total patients and those with and without asthma (%) versus the p-PAH concentration from 4 January to 30 June 2011 in Kanazawa city. These data were provided by Anyenda et al., (2016) [14]. A dominant feature of the analysis results is that the daily prevalence of cough in the non-asthma group was higher than that in the asthma group during the observation period (Table 1). The second feature is that there exists a tendency of a positive association between the cough prevalence and the per unit increase in the p-PAH concentration in the asthma group. The odds ratio indicated that the relation between time lagged PAH concentrations (2-, 3-, 5-,and 6-day) and chronic cough occurrence was positive (Table S1) in the case of the asthma group. In the non-asthma group, a positive tendency between the cough prevalence and the per unit increase in the p-PAH concentration is found in the 0-, 2-, 4-, 5-,and 6-day time lag data. With respect to the effect of time lag, it is possible to progress the diagnosis inside the human body after large exposure to p-PAHs. These processes are inadequate to discuss by using the chemical transport model.

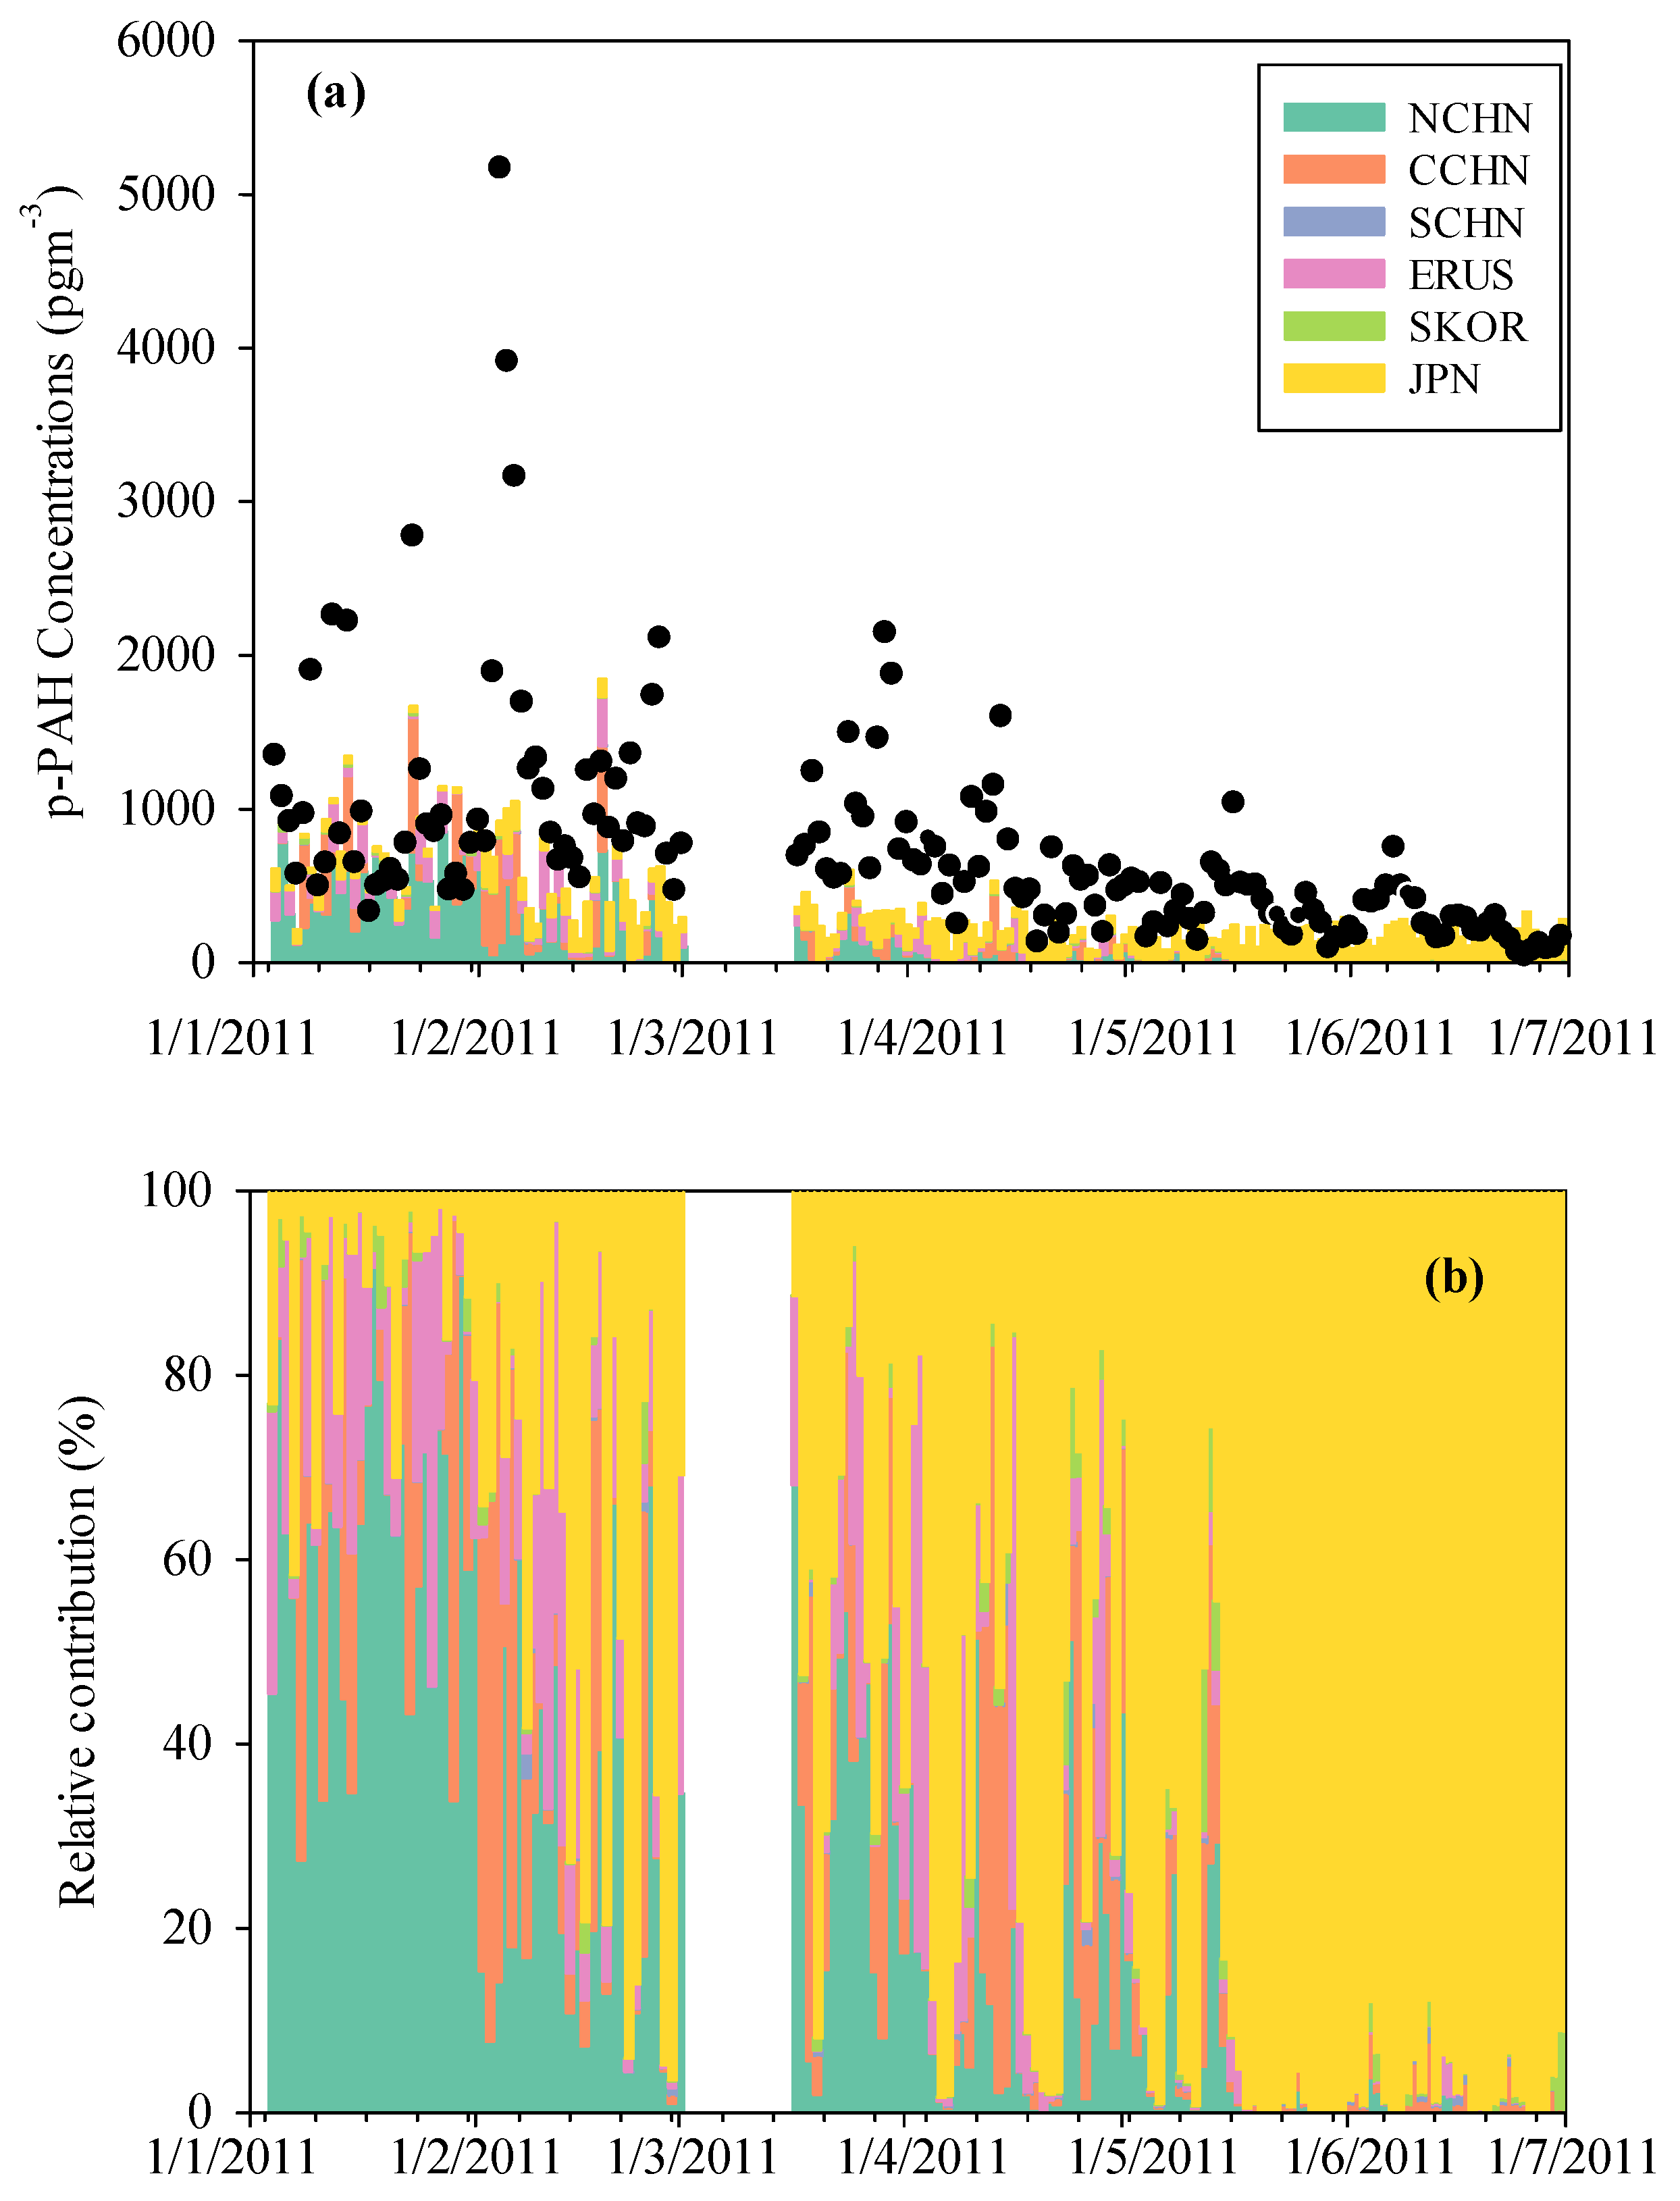
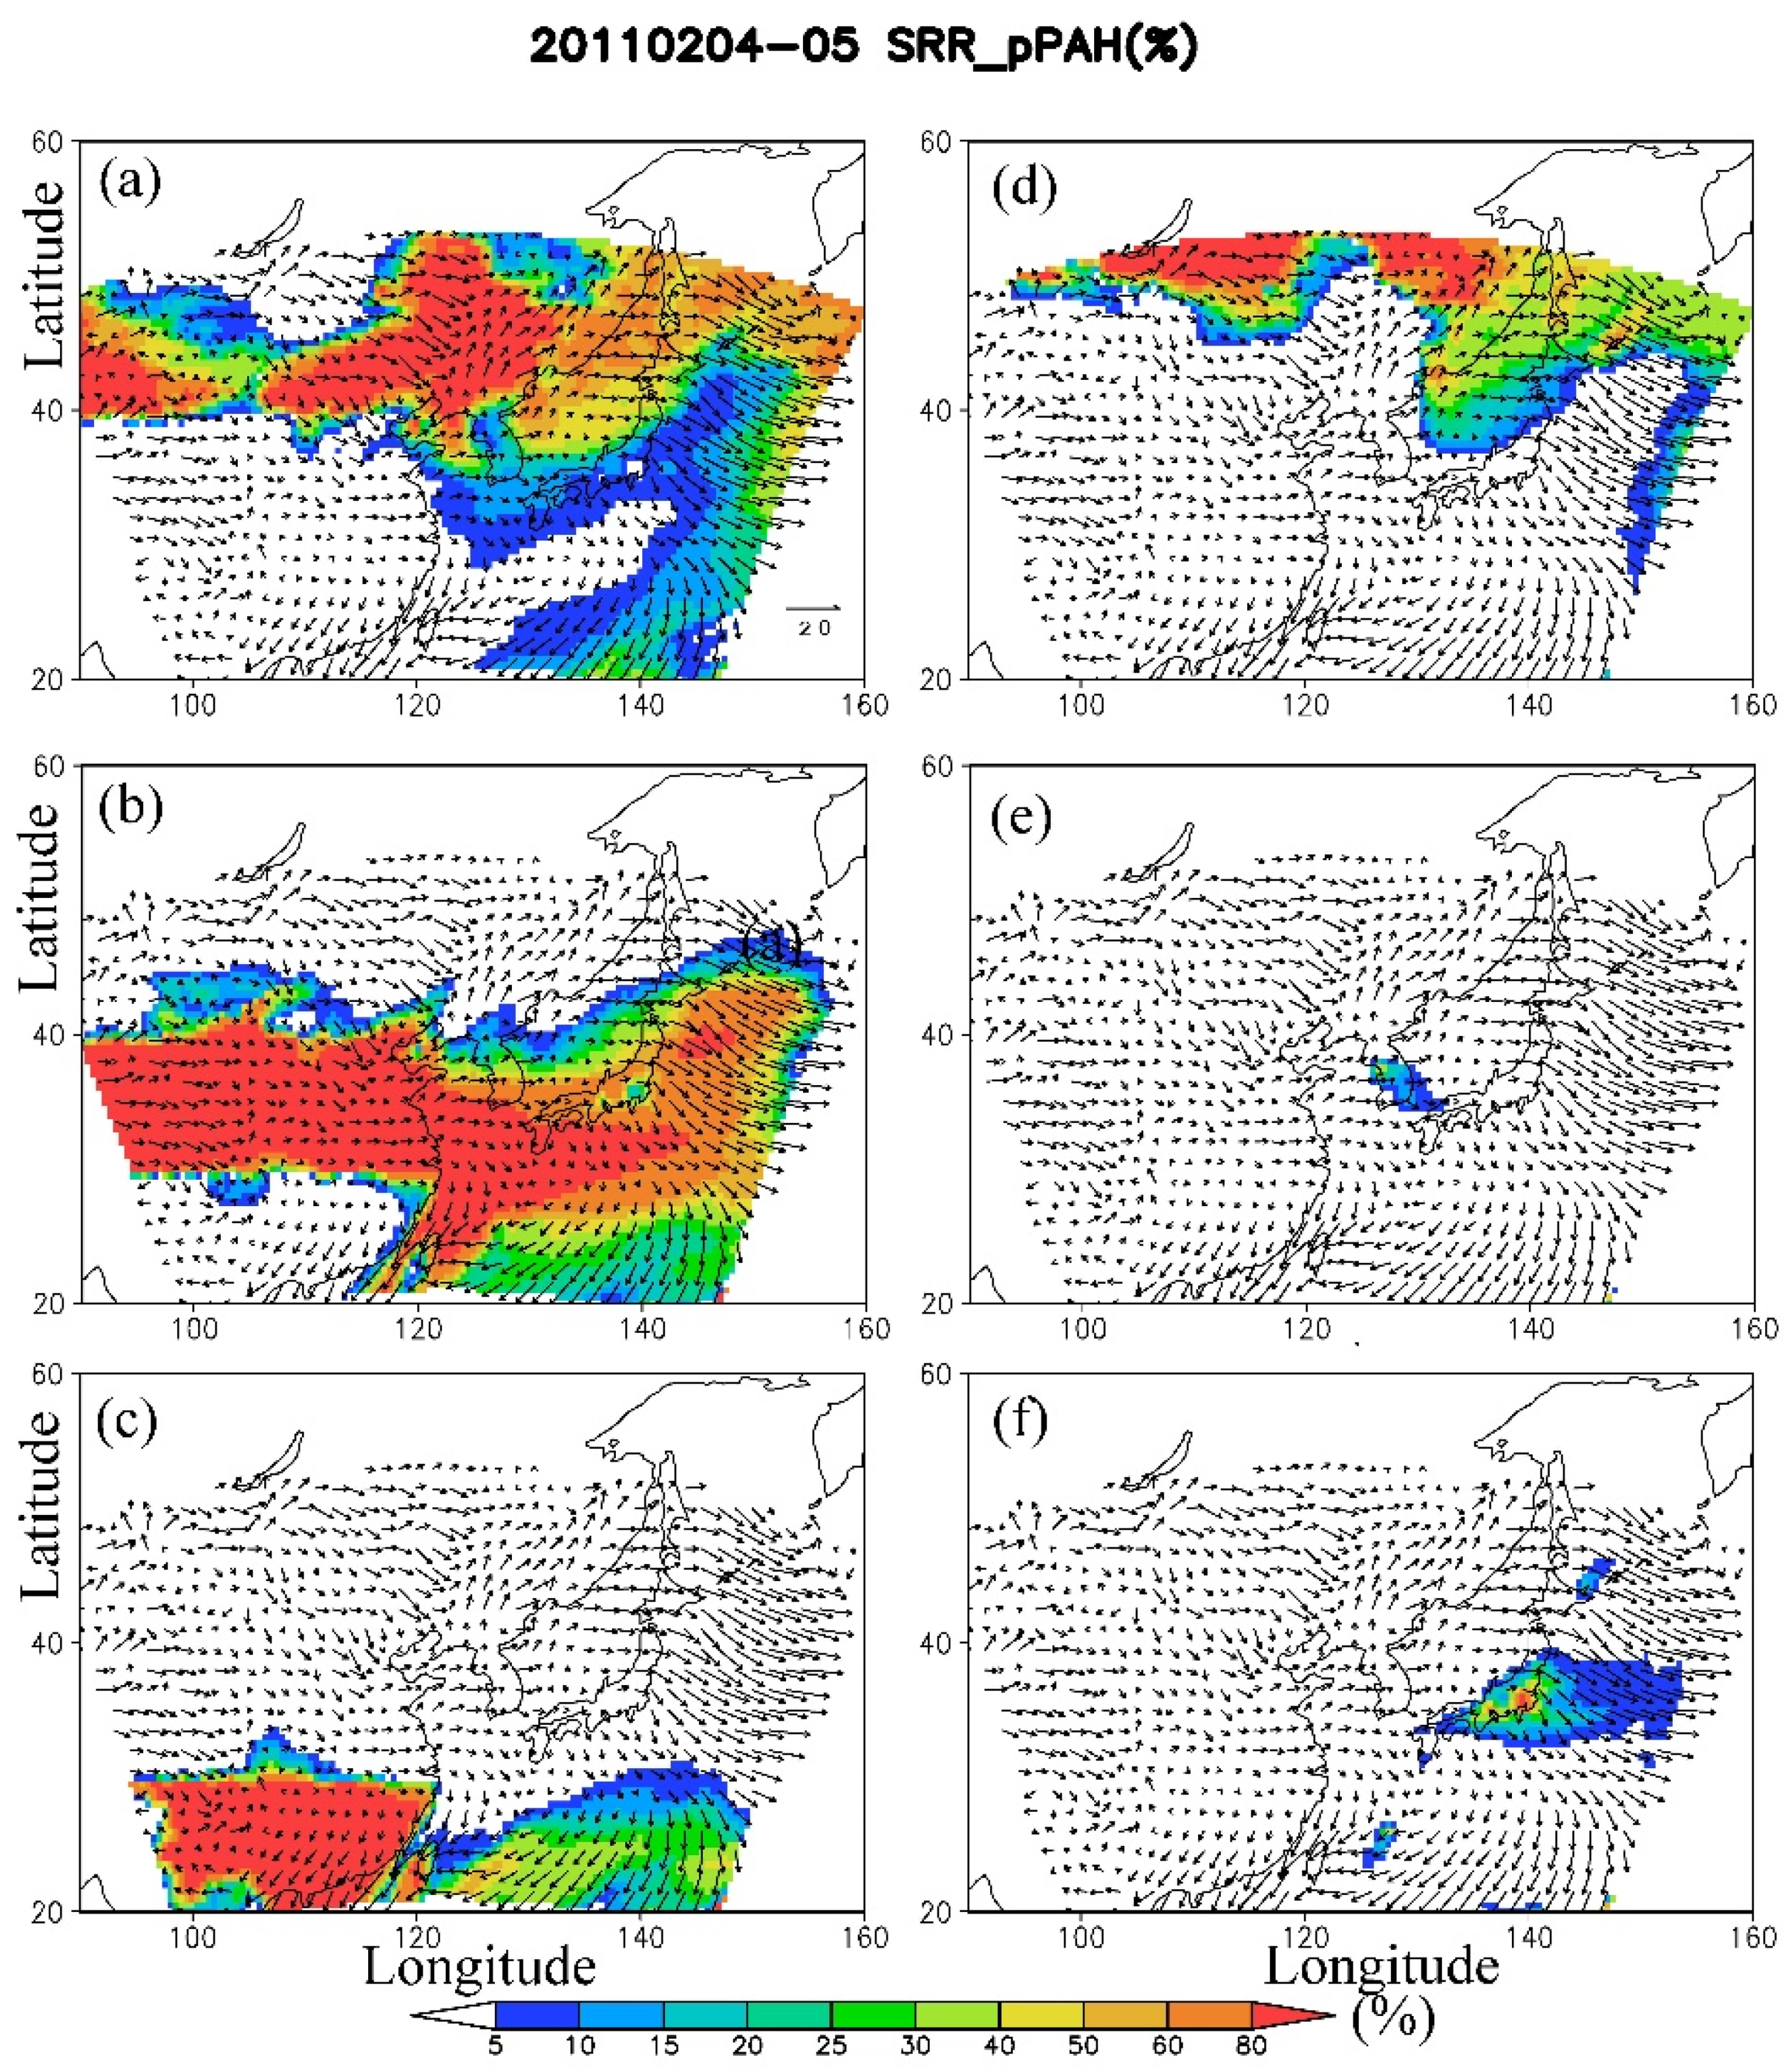
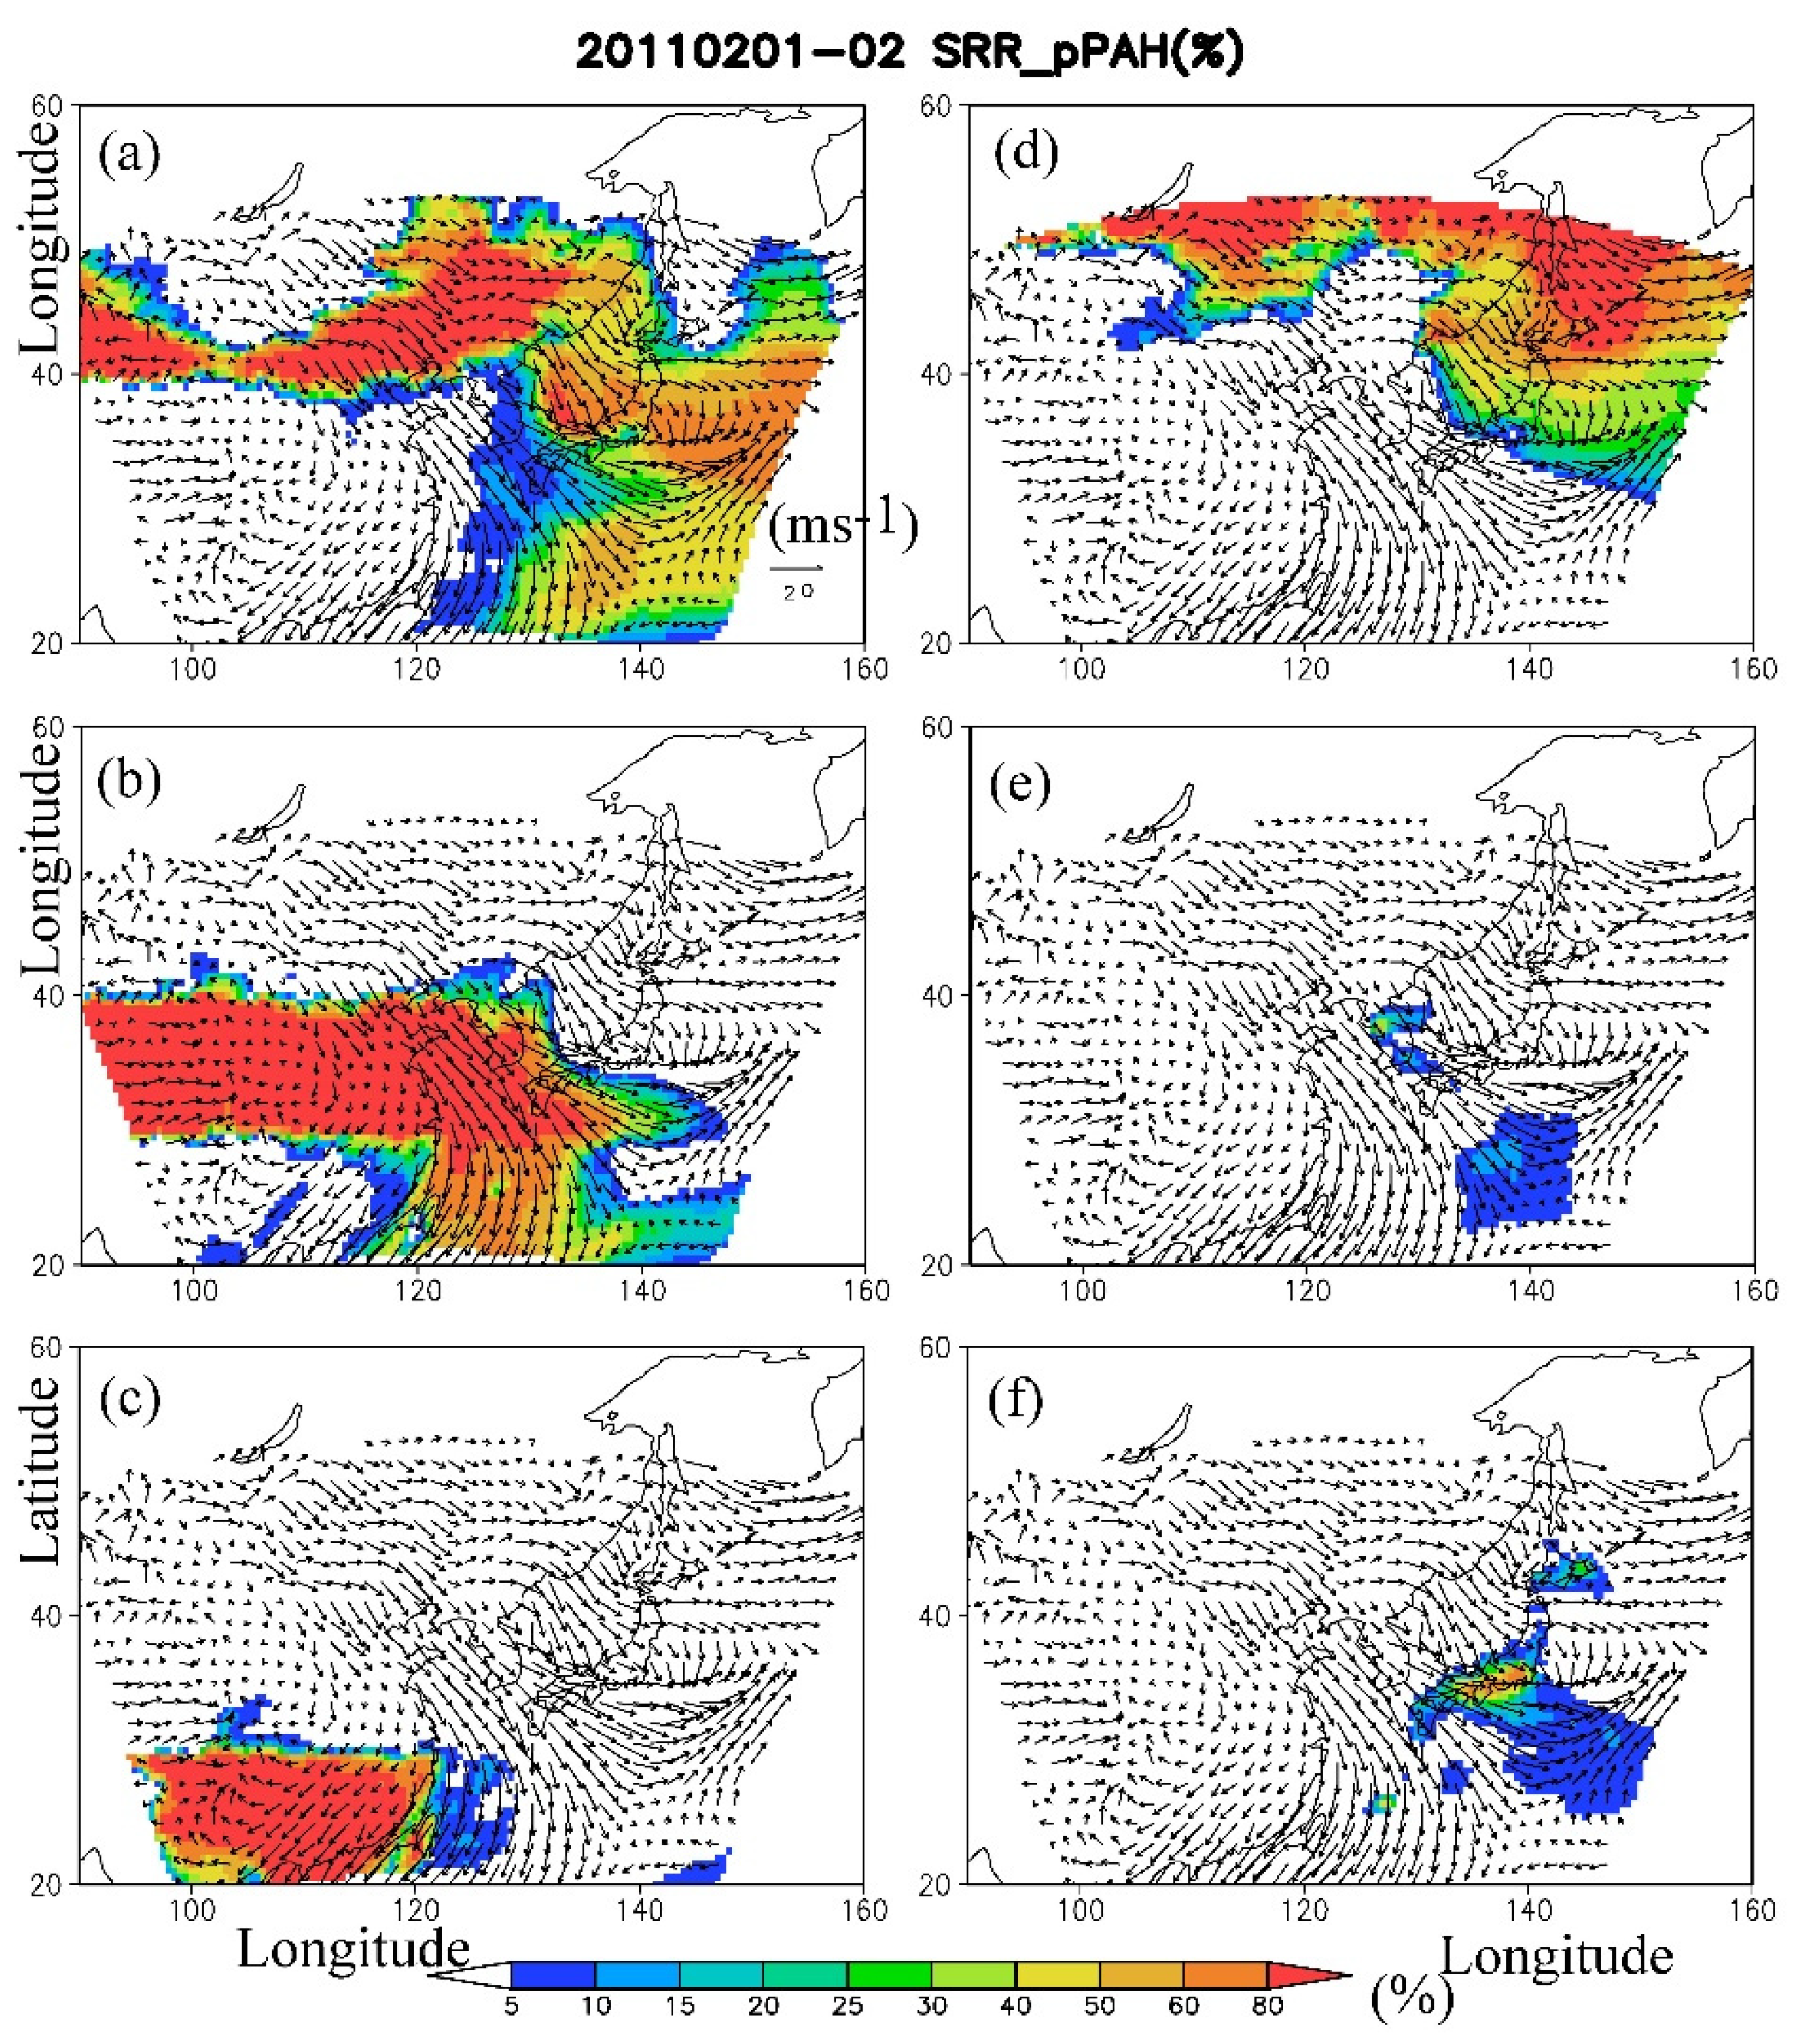
3.2. SRR Analysis of the Simulated p-PAH Concentration

Figure 4 shows the simulated p-PAH concentration in Kanazawa city. Figure 4a shows the observed (circle) and simulated (stacked bar) p-PAH concentrations, and Figure 4b shows the relative contributions of the p-PAH concentration in the different domains. During the winter season (January–February), the p-PAH concentration ranged from 478 to 7444 ng m−3, with an average value of 1706 ± 1278 ng m−3. During the winter season, significantly higher concentrations (above 3000 ng m−3) were observed several times. On the days with high p-PAH concentrations, the contribution originating from CCHN was larger than those originating from the other domains, which accounted for 53–80% of the overall concentration. According to the analysis conducted by Anyenda et al., (2016) [14], an increase in cough occurrence was found under ambient atmospheric conditions with a 1 ng m−3 increase in the p-PAH concentration. On these days (14 January, 23 January, and 4 February 2011), the contribution of the p-PAHs transported from CCHN was 46%, 52%, and 74%, respectively, of the overall concentration, followed by NCHN (45%, 43%, and 73%, respectively) and ERUS (4%, 1%, and 0.2%, respectively).
Figure 5 shows the horizontal distributions of the relative contribution of the respective source regions to the p-PAH concentration (4308 ng m−3) on 4 February 2011, which was determined as the day with the largest increase in the p-PAH concentration (2295 ng m−3) over the prior day. It should also be noted that the cough prevalence in non-asthma patients was high during the day.
In the other cases, we also found that the increase in p-PAHs occurred due to transboundary transport from NCHN, followed by ERUS. Figure 6 also shows the horizontal distribution of the p-PAH concentration on 1 February 2011 (1046 ng m−3) under a relatively high transboundary transport from NCHN. On this day, the relative contribution from NCHN reached 62%, followed by that from ERUS, which was estimated as 17%. These results suggest that the increase in p-PAHs in Kanazawa was caused by the transboundary transport of p-PAHs from CCHN and NCHN. In particular, the increase in p-PAHs was largely caused by the observed transboundary air mass transport from CCHN.
After spring, the p-PAH concentration gradually decreased. The p-PAH concentration during the spring/summer season (May–June) ranged from 65 to 1507 ng m−3, with an average value of 467 ± 268 ng m−3. With decreasing p-PAH concentrations the relative contributions from CCHN and NCHN gradually decreased, whereas the relative contributions from JPN, the self-domain, increased (88–100%) in June.

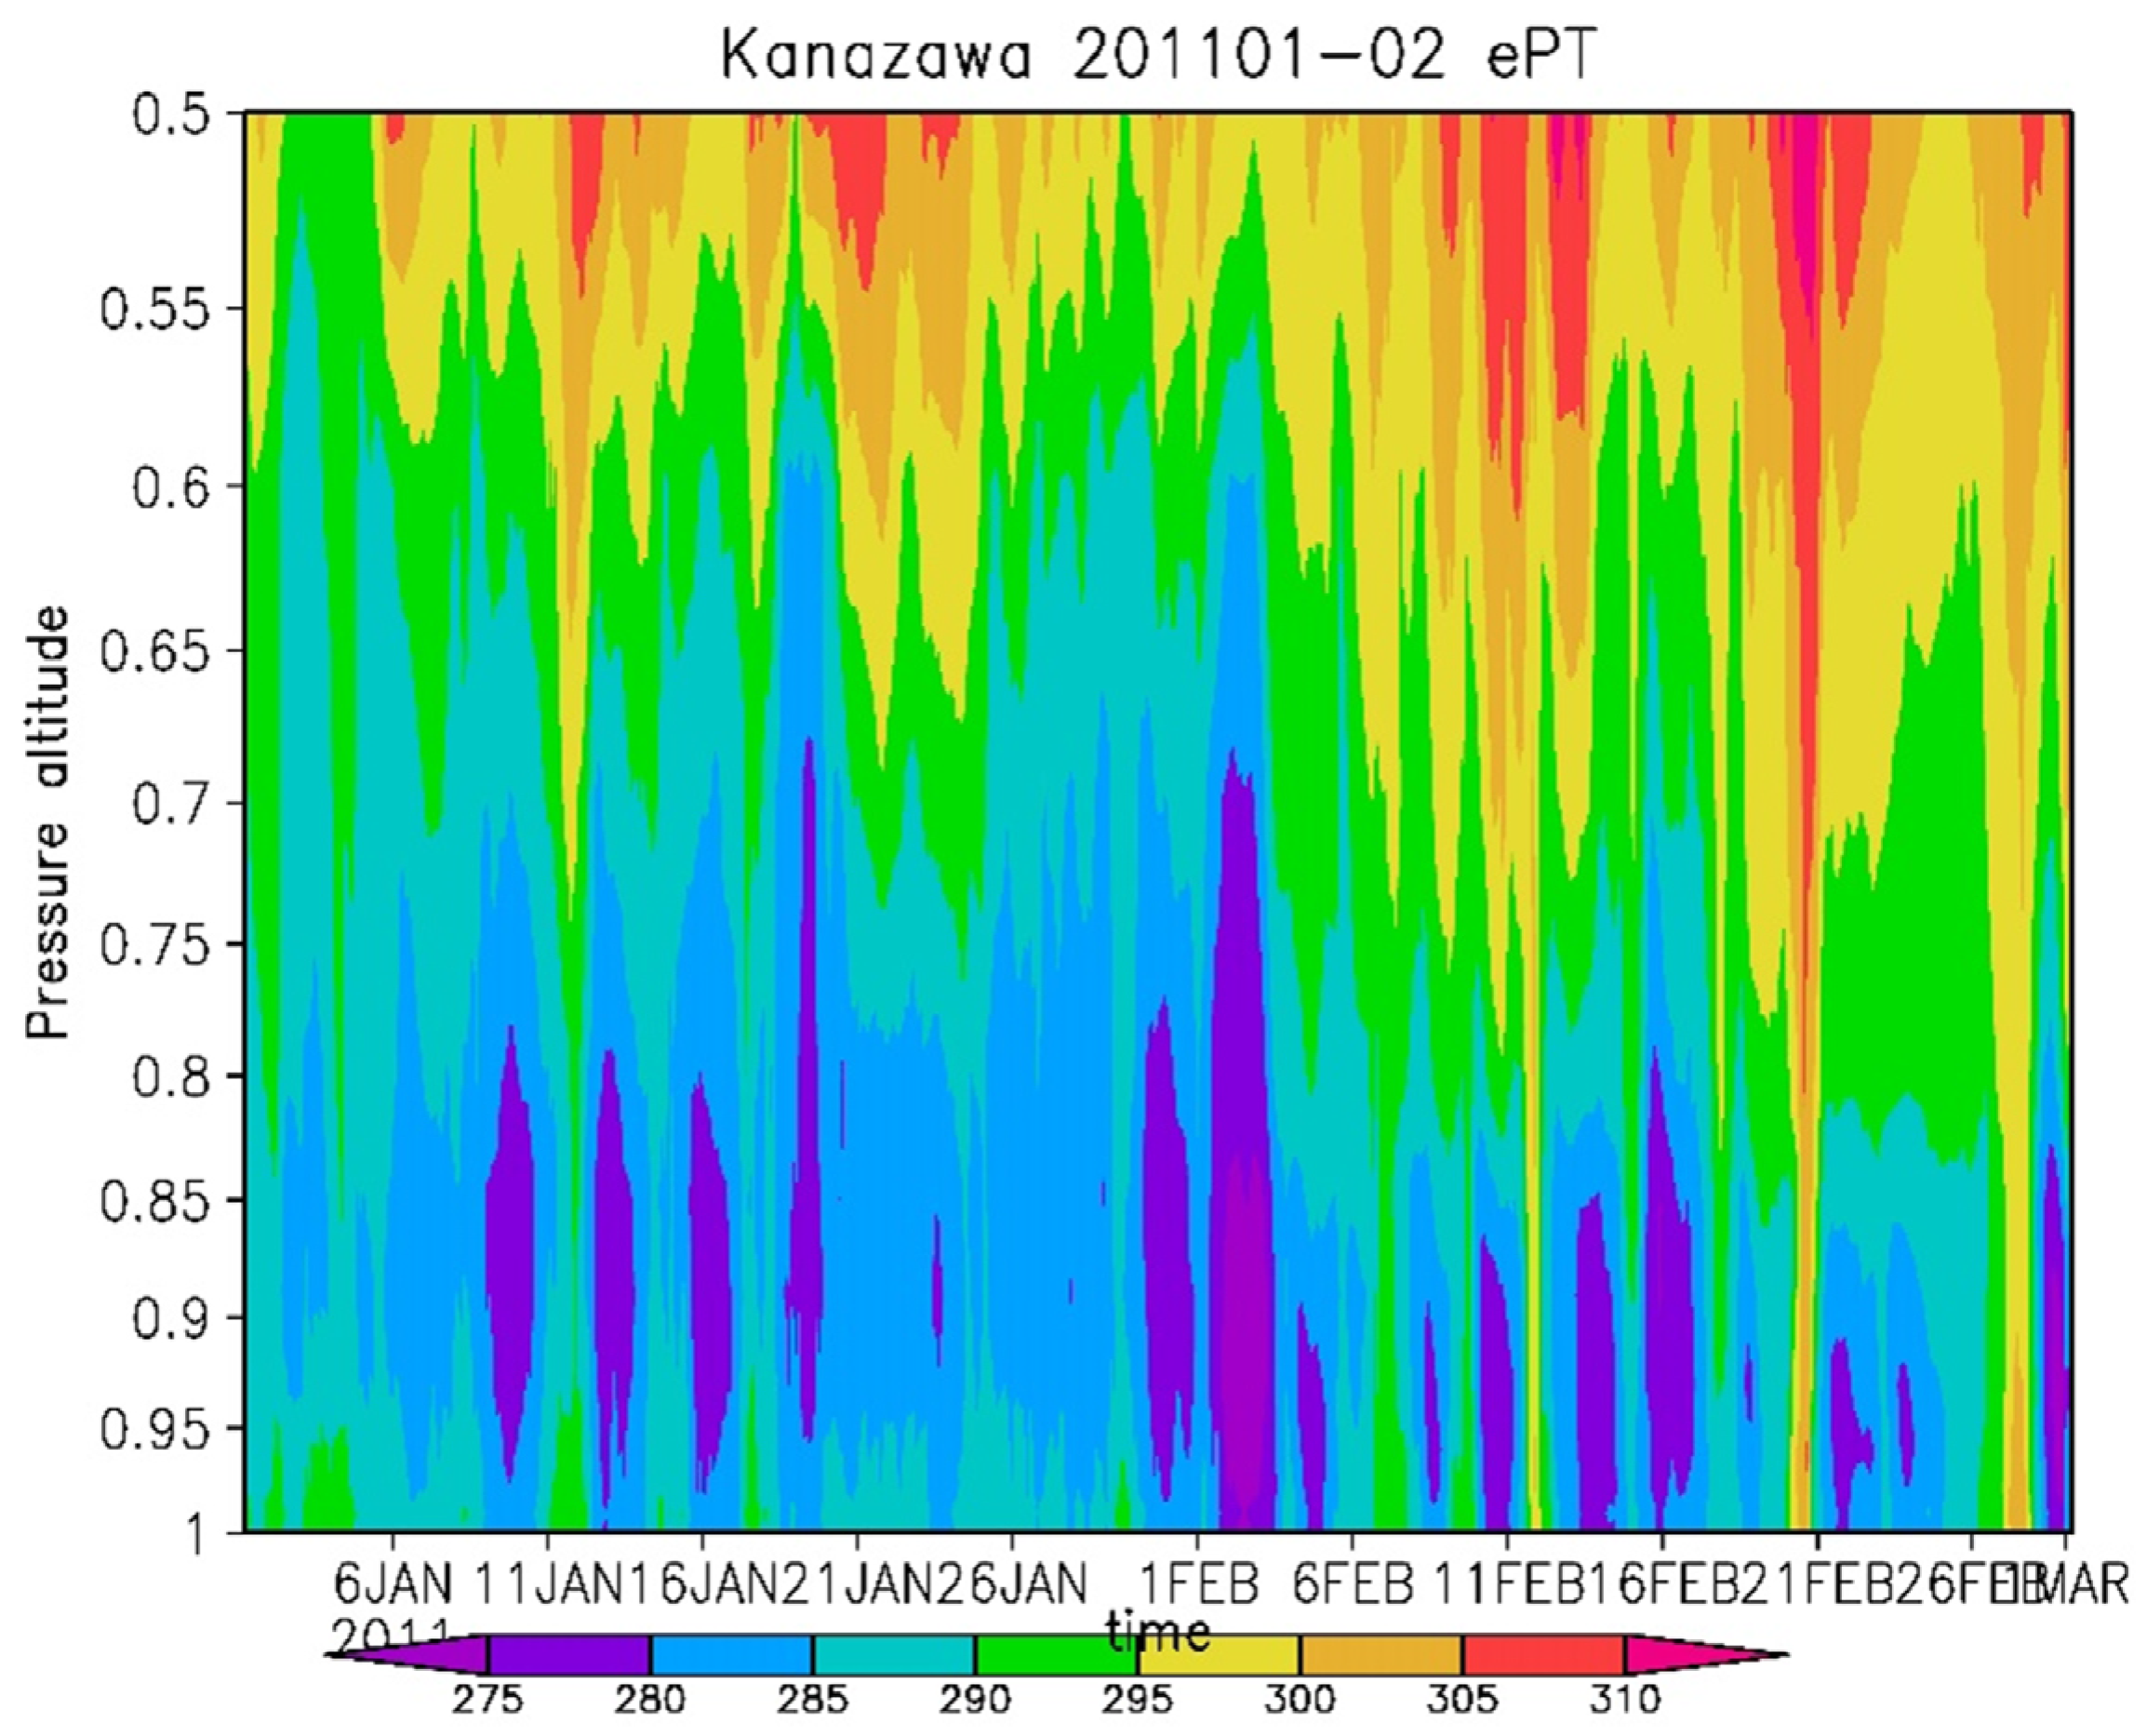
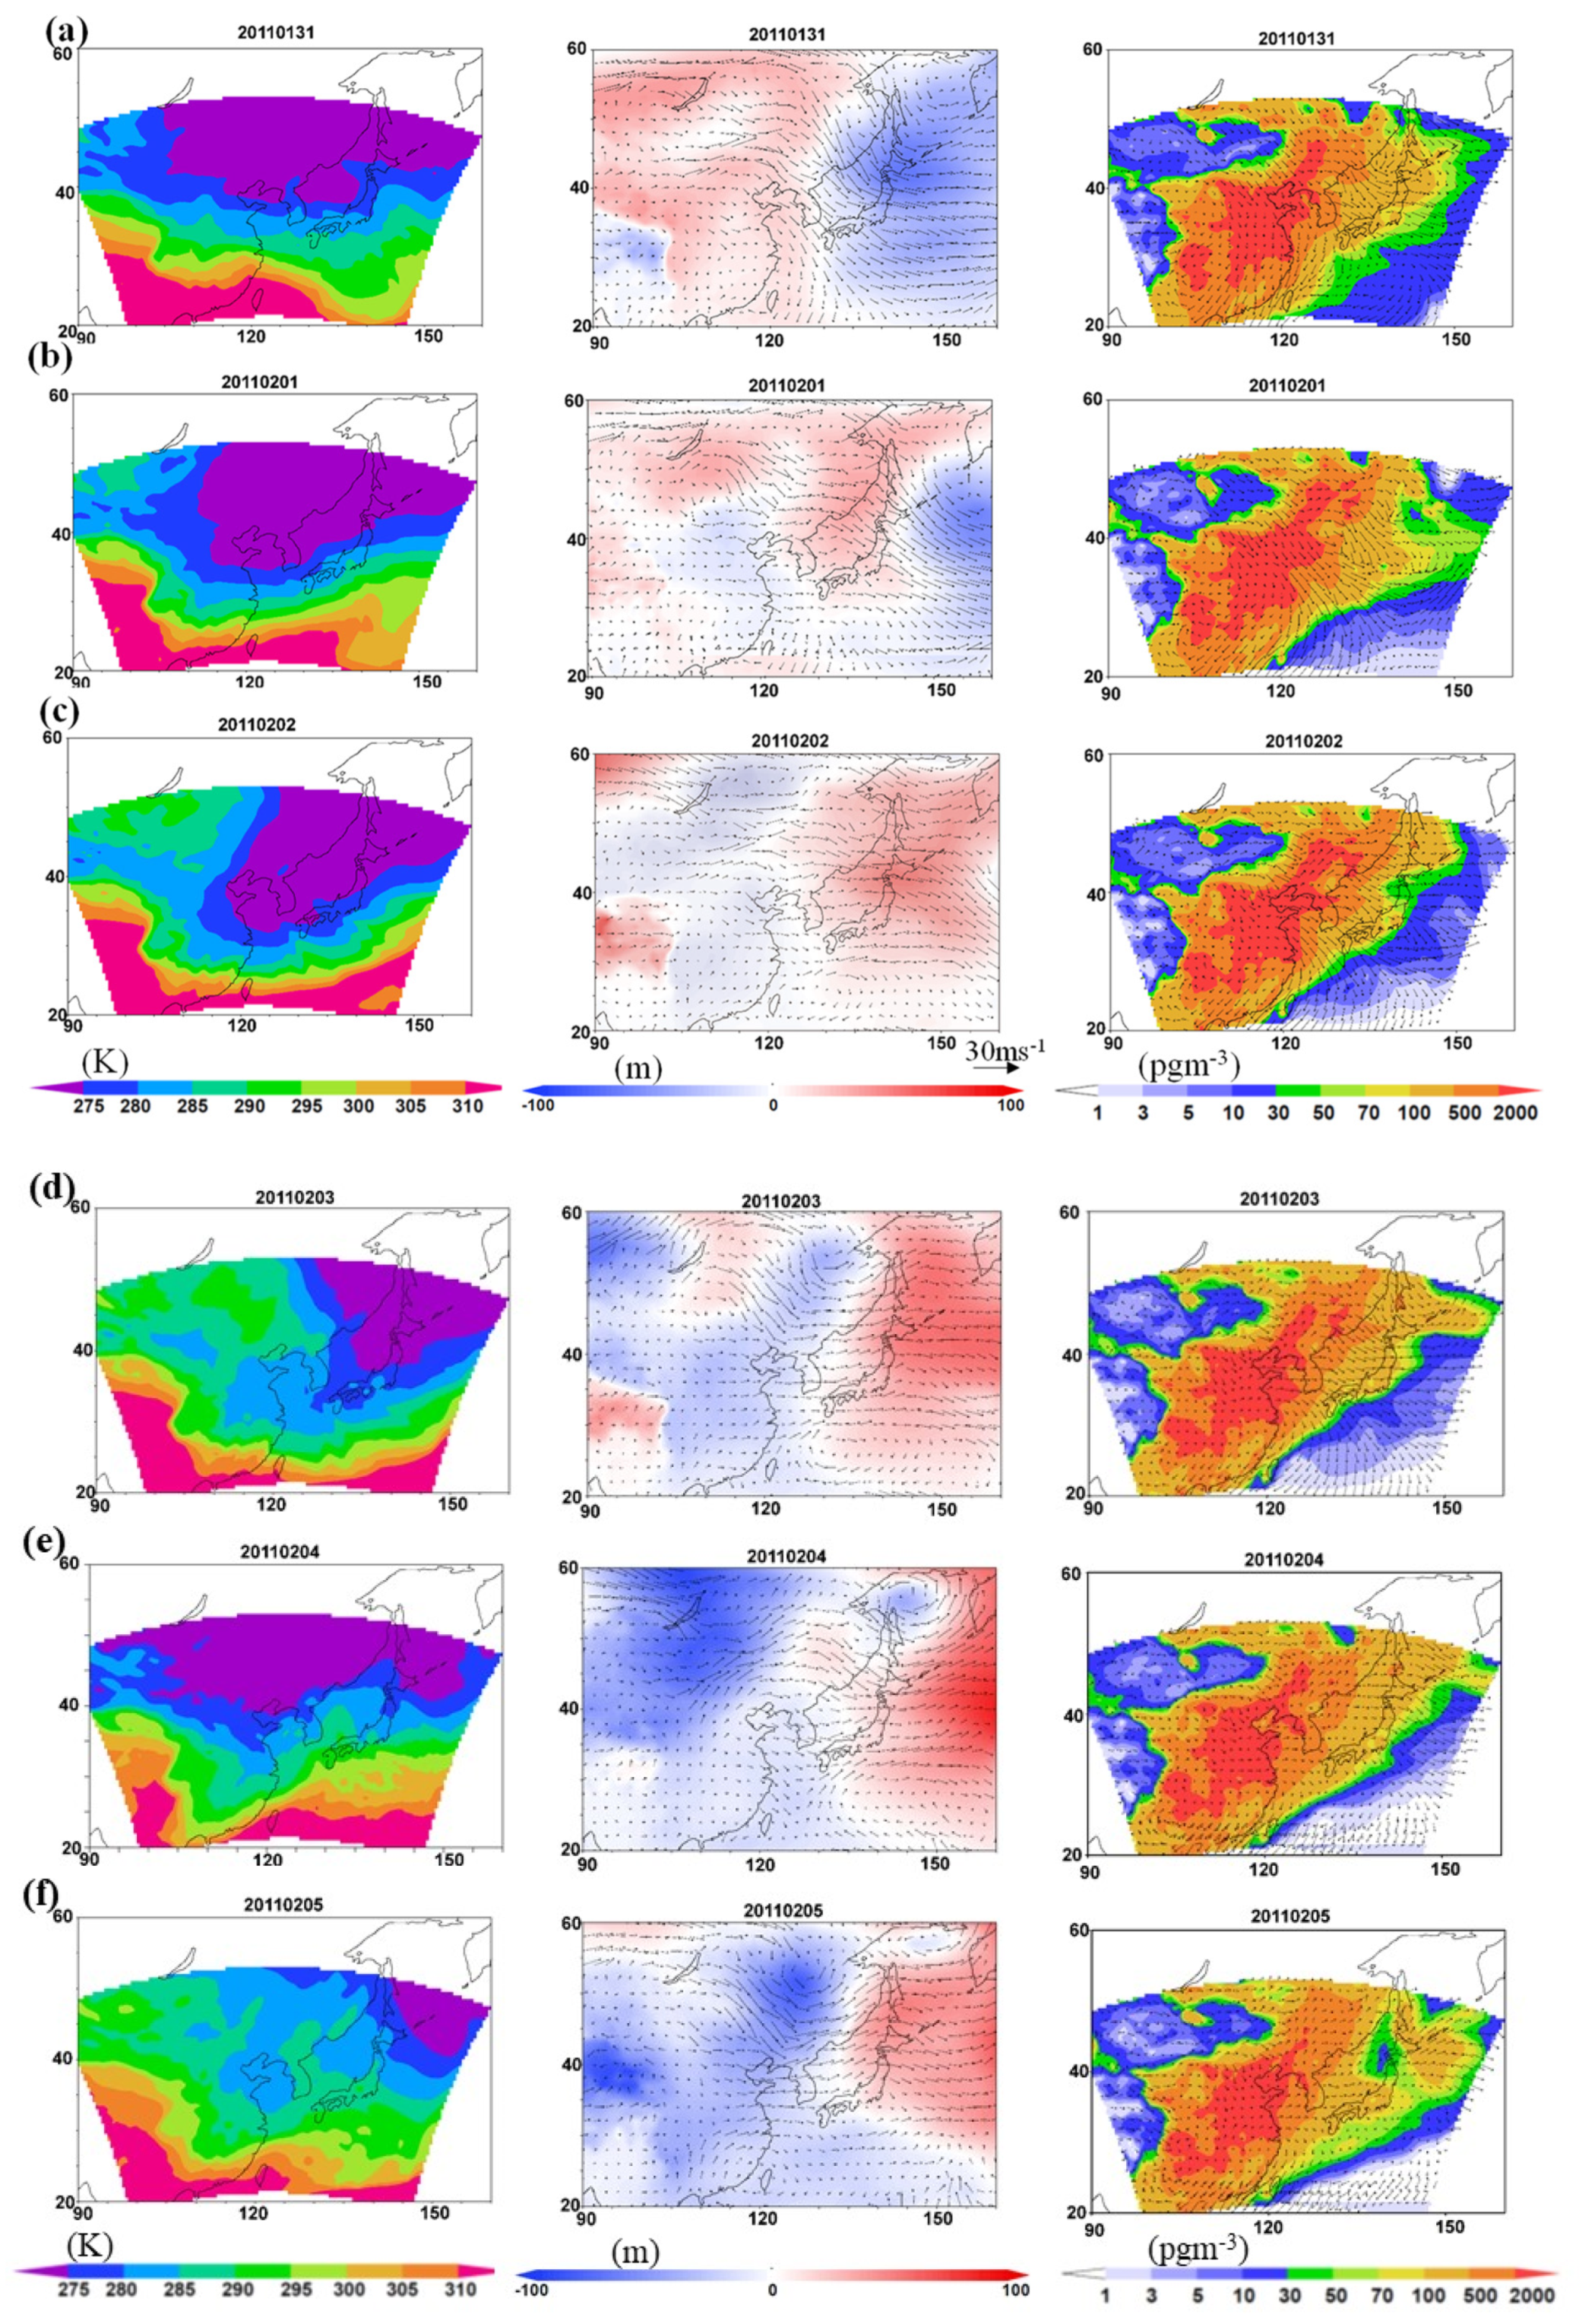
3.3. Transport of High Concentrations of p-PAHs near the Surface under Cold Conditions

These results indicate that the transboundary transport of p-PAHs from CCHN caused a high cough occurrence during the winter season in Kanazawa. To clarify the relationship between the p-PAH concentration and cough occurrence, we investigated the meteorological conditions in the Northeast Asia. In regard to the meteorology, air masses are usually transported along an equivalent potential temperature (ePT) in the atmosphere. ePT is conserved during vertical transport in the atmosphere even in the presence of water vapor condensation, suggesting that ePT is a useful conservation indicator of air mass transport [35]. Figure 7 shows the vertical distribution of ePT in Kanazawa during the period from 1 January to 28 February 2011. The observation region was covered with the air mass with low ePT at several times, indicating that cold air masses were transported near the ground surface because of the suppression of vertical air mass transport.
The horizontal distribution of ePT at 850 hPa, the geopotential height anomaly at 850 hPa, and the p-PAH concentration in the Northeast Asia from 31 January to 5 February 2011 are shown in Figure 8. As already described, ePT is a conservation indicator of air mass three-dimensional transport. The geopotential height anomaly means deviation of air mass geopotential height at constant atmospheric pressure against the average values during the target period. The region with negative geopotential height anomaly occurs with lower geopotential heights. This implies that the air mass temperature over this region is lower than those average values. The variation of ePT as well as geopotential height anomaly are closely connected with the distribution or concentrations of atmospheric pollutants such as PAH.
An air mass with a low ePT occurred over the Japanese Islands from 31 January to 2 February 2011, and the observed low ePT areas shifted northward after 3 February 2011 during this analysis period. In the later period, the geopotential height anomaly during the analytical period (31 January to 5 February 2011) was relatively low over the Japanese Islands. Under the colder air mass conditions, p-PAH concentration gradually increased over the previous day from 31 January to 4 February 2011, and the maximum concentration during the period in this study was observed on 4 February 2011. Furthermore, the simulated p-PAH concentrations at Kanazawa on 4 February 2011 were underestimated over the observed values. It is quite likely that ambient p-PAH concentrations around the air mass transport region in the Northeast Asian continent are very higher values in comparison with those in other days. These results suggest that the vertical transport of the p-PAHs emitted near the surface in the air mass transport region in Asian continent is suppressed and they are horizontally transported near the surface under the stronger north-westerly wind, resulting in the significantly high p-PAH concentrations observed in Kanazawa. Anyenda et al., (2016) [14] reported that an increase in adult chronic cough occurred at a certain time lag after high p-PAH exposure (Table S1). The longer p-PAH exposure period associated with certain meteorological conditions may also cause a time lag in the adult chronic cough occurrence increase. Although the odds ratio against per unit increase in p-PAHs at lag 2 and lag 6 for asthma and lag 2 for non-asthma have a significant correlation (95% confidence interval), these might be related with the reaction inside the body. The explanation of these time lag is beyond the scope of the chemical transport model.
After April, ePT increased, followed by an active vertical mixing of air masses and the changing synoptic-scale air mass transport pattern (weaker westerly wind and/or air mass transported from the Pacific Ocean) in Northeast Asia resulted in a p-PAH concentration decrease. It is also likely that decreased PAH emissions near the surface under the increased ambient temperature are cause to lower PAH concentrations.
Consequently, the occurrence of adult chronic cough decreased. These seasonal variations suggest that the increase in adult chronic cough occurrence is likely triggered by large-scale atmospheric circulation patterns as well as the transboundary transport of large amounts of p-PAHs.

4. Conclusions

According to epidemiological research [14], exposure to the atmospheric p-PAHs observed in Kanazawa, a coastal site of the Sea of Japan, induces the chronic cough occurrence in adult patients. The relationship between the p-PAH concentration, chronic cough occurrence, and meteorological conditions revealed that the adult chronic cough occurrence was larger when colder air masses were horizontally transported near the surface under the suppressed vertical air mass transport and was suppressed under cold atmospheric conditions. The SRR analysis suggested that the p-PAHs emitted from CCHN contributed notably to the chronic cough occurrence among adult patients in Kanazawa. These results suggest that the increase in chronic cough occurrence was triggered by the transport of a large number of p-PAHs, which was strongly connected with atmospheric transport and meteorological processes. Other air pollution might also cause the occurrence of chronic cough among adult patients.
This analysis was based on a limited dataset, including participants who provide the cough information, observed periods, and locations. It is desired to analyze by using more datasets to understand the relation of air pollutants and chronic cough.

Supplementary Materials

The following are available online at https://www.mdpi.com/article/10.3390/atmos12091163/s1, Table S1. The Odds ratio and 95% confidence interval for cough symptoms per 1 ng/m3 increase in lagged PAH exposure.

Author Contributions

Data curation for modelling, Y.I., M.T. and T.S.; Model development, M.K.; Data curation for epidemiology, N.T. and H.N.; Project administration, N.T. and K.H.; Writing original draft, Y.I. All authors have read and agreed to the published version of the manuscript.

Funding

This research was financially supported by the Japanese Ministry of Education, Culture, Sports, Science and Technology (MEXT, Project No. 16H05624) and the Environment Research and Technology Development Fund (Project Nos. 5-1951) of the Ministry of the Environment, Japan.

Institutional Review Board Statement

Not applicable.

Informed Consent Statement

Not applicable.

Data Availability Statement

Not applicable.

Conflicts of Interest

There are no conflict to declare.

References

  1. DeFlorio-Barker, S.; Lobdell, D.T.; Stone, S.L.; Boehmer, T.; Rappazzo, K.M. Acute effects of short-term exposure to air pollution while being physically active, the potential for modification: A review of the literature. Prev. Med. 2020, 139, 106195. [Google Scholar] [CrossRef]
  2. Molina, C.; Toro, A.; Manzano, C.; Canepari, S.; Massimi, L.; Leiva-Guzmán, M. Airborne Aerosols and Human Health: Leapfrogging from Mass Concentration to Oxidative Potential. Atmosphere 2020, 11, 917. [Google Scholar] [CrossRef]
  3. Almetwally, A.A.; Bin-Jumah, M.; Allam, A. Ambient air pollution and its influence on human health and welfare: An overview. Environ. Sci. Pollut. Res. 2020, 27, 24815–24830. [Google Scholar] [CrossRef]
  4. Guercio, V.; Pojum, I.C.; Leonardi, G.S.; Shrubsole, C.; Mac Gowers, A.; Dimitroulopoulou, S.; Exley, K.S. Exposure to indoor and outdoor air pollution from solid fuel combustion and respiratory outcomes in children in developed countries: A systematic review and meta-analysis. Sci. Total Environ. 2020, 755, 142187. [Google Scholar] [CrossRef] [PubMed]
  5. Cori, L.; Donzelli, G.; Gorini, F.; Bianchi, F.; Curzio, O. Risk Perception of Air Pollution: A Systematic Review Focused on Particulate Matter Exposure. Int. J. Environ. Res. Public Health 2020, 17, 6424. [Google Scholar] [CrossRef]
  6. Orellano, P.; Reynoso, J.; Quaranta, N.; Bardach, A.; Ciapponi, A. Short-term exposure to particulate matter (PM10 and PM2.5), nitrogen dioxide (NO2), and ozone (O3) and all-cause and cause-specific mortality: Systematic review and meta-analysis. Environ. Int. 2020, 142, 105876. [Google Scholar] [CrossRef]
  7. Kelly, F.J.; Fussell, J.C. Toxicity of airborne particles-established evidence, knowledge gaps and emerging areas of importance. Philos. Trans. A Math. Phys. Eng. Sci. 2020, 378, 20190322. [Google Scholar] [PubMed]
  8. Tiotiu, A.I.; Novakova, P.; Nedeva, D.; Chong-Neto, H.J.; Novakova, S.; Steiropoulos, P.; Kowal, K. Impact of Air Pollution on Asthma Outcomes. Int. J. Environ. Res. Public Health 2020, 17, 6212. [Google Scholar] [CrossRef]
  9. Sakhvidi, M.J.Z.; Lequy, E.; Goldberg, M.; Jacquemin, B. Air pollution exposure and bladder, kidney and urinary tract cancer risk: A systematic review. Environ. Pollut. 2020, 267, 115328. [Google Scholar] [CrossRef] [PubMed]
  10. Ravindra, K.; Sokhi, R.; Van Grieken, R. Atmospheric polycyclic aromatic hydrocarbons: Source attribution, emission factors and regulation. Atmos. Environ. 2008, 42, 2895–2921. [Google Scholar] [CrossRef] [Green Version]
  11. IARC Monographs on the evaluation of carcinogenic risks to humans. In Some Non-Herocycloc Polycyclic Aromatic Hydrocarbons and Some Related Exposures; World Health Organization: Lyon, France, 2020; Volume 92.
  12. Jung, K.H.; Yan, B.; Chillrud, S.N.; Perera, F.P.; Whyatt, R.; Camann, D.; Kinney, P.L.; Miller, R.L. Assessment of benzo(a)pyrene-equivalent carcinogenicity and mutagenicity of residential indoor versus outdoor polycyclic aromatic hydrocarbons exposing young children in New York City. Int. J. Environ. Res. Public Health 2010, 7, 1889–1900. [Google Scholar] [CrossRef]
  13. Miller, R.L.; Garfinkel, R.; Horton, M.; Camann, D.; Perera, F.P.; Whyatt, R.M.; Kinney, P.L. Polycyclic Aromatic Hydrocarbons, Environmental Tobacco Smoke, and Respiratory Symptoms in an Inner-city Birth Cohort. Chest 2004, 126, 1071–1078. [Google Scholar] [CrossRef] [PubMed] [Green Version]
  14. Anyenda, E.O.; Higashi, T.; Kambayashi, Y.; Thao, N.T.T.; Michigami, Y.; Fujimura, M.; Hara, J.; Tsujiguchi, H.; Kitaoka, M.; Asakura, H.; et al. Exposure to daily ambient particulate polycyclic aromatic hydrocarbons and cough occurrence in adult chronic cough patients: A longitudinal study. Atmos. Environ. 2016, 140, 34–41. [Google Scholar] [CrossRef]
  15. Inomata, Y.; Kajino, M.; Sato, K.; Ohara, T.; Kurokawa, J.-I.; Ueda, H.; Tang, N.; Hayakawa, K.; Ohizumi, T.; Akimoto, H. Emission and Atmospheric Transport of Particulate PAHs in Northeast Asia. Environ. Sci. Technol. 2012, 46, 4941–4949. [Google Scholar] [CrossRef]
  16. Inomata, Y.; Kajino, M.; Sato, K.; Ohara, T.; Kurokawa, J.-I.; Ueda, H.; Tang, N.; Hayakawa, K.; Ohizumi, T.; Akimoto, H. Source contribution analysis of surface particulate polycyclic aromatic hydrocarbon concentrations in northeastern Asia by source–receptor relationships. Environ. Pollut. 2013, 182, 324–334. [Google Scholar] [CrossRef]
  17. Kajino, M.; Inomata, Y.; Sato, K.; Ueda, H.; Han, Z.; An, J.; Katata, G.; Deushi, M.; Maki, T.; Oshima, N.; et al. Development of the RAQM2 aerosol chemical transport model and predictions of the Northeast Asian aerosol mass, size, chemistry, and mixing type. Atmos. Chem. Phys. Discuss. 2012, 12, 11833–11856. [Google Scholar] [CrossRef] [Green Version]
  18. Inomata, Y.; Kajino, M.; Sato, K.; Kurokawa, J.; Tang, N.; Ohara, T.; Hayakawa, K.; Ueda, H. Source-Receptor Relationship Analysis of the Atmospheric Deposition of PAHs Subject to Long-Range Transport in Northeast Asia. Environ. Sci. Technol. 2017, 51, 7972–7981. [Google Scholar] [CrossRef]
  19. Kajino, M.; Sato, K.; Inomata, Y.; Ueda, H. Source–receptor relationships of nitrate in Northeast Asia and influence of sea salt on the long-range transport of nitrate. Atmos. Environ. 2013, 79, 67–78. [Google Scholar] [CrossRef]
  20. Skamarock, W.C.; Klemp, J.B.; Dudhia, J.; Gill, D.O.; Barker, D.; Duda, M.G.; Huang, X.; Wang, W.; Powers, J.G. A Description of the Advanced Research WRF, Version 3; NCAR: Boulder, CO, USA, 2008. [Google Scholar]
  21. Gusev, A.; Mantseva, E.; Shatalov, V.; Strukov, B. Regional Multicompartment Model MSCE-POP; MSC-E Technical Report; Meteorological Synthesizing Centre-East: Moscow, Russia, 2005; Volume 5. [Google Scholar]
  22. Pankow, J.F. Review and comparative analysis of the theories on partitioning between the gas and aerosol particulate phases in the atmosphere. Atmos. Environ. 1987, 21, 2275–2283. [Google Scholar] [CrossRef]
  23. Pankow, J.F. Application of common y-intercept regression parameters for log kpvs lit for predicting gas-particle partitioning in the urban environment. Atmos. Environ. 1992, 26, 2489–2497. [Google Scholar] [CrossRef]
  24. Kurokawa, J.; Ohara, T.; Morikawa, T.; Hanayama, S.; Janssens-Maenhout, G.; Fukui, T.; Kawashima, K.; Akimoto, H. Emissions of air pollutants and greenhouse gases over Asian regions during 2000–2008; Regional Emission inventory in ASia (REAS) Version. Atmos. Chem. Phys. 2013, 13, 11019–11058. [Google Scholar] [CrossRef] [Green Version]
  25. Giglio, L.; Randerson, J.T.; van der Werf, G.R.; Kasibhatla, P.S.; Collatz, G.J.; Morton, D.C.; DeFries, R.S. Assessing variability and long-term trends in burned area by merging multiple satellite fire products. Biogeosciences 2010, 7, 1171–1186. [Google Scholar] [CrossRef] [Green Version]
  26. Lin, M.; Oki, T.; Bengtsson, M.; Kanae, S.; Holloway, T.; Streets, D.G. Long-range transport of acidifying substances in East Asia—Part IISource–receptor relationships. Atmos. Environ. 2008, 42, 5956–5967. [Google Scholar] [CrossRef]
  27. Wright, L.P.; Zhang, L.; Cheng, I.; Aherne, J.; Wentworth, G.R. Impacts and Effects Indicators of Atmospheric Deposition of Major Pollutants to Various Ecosystems-A Review. Aerosol Air Qual. Res. 2018, 18, 1953–1992. [Google Scholar] [CrossRef] [Green Version]
  28. Ohta, K.; Yamaguchi, M.; Akiyama, K.; Adachi, M.; Ichinose, M.; Takahashi, K.; Nishimuta, T.; Morikawa, A.; Nishima, S. Japanese Guideline for Adult Asthma. Allergol. Int. 2011, 60, 115–145. [Google Scholar] [CrossRef] [Green Version]
  29. Fujimura, M.; Ogawa, H.; Nishizawa, Y.; Nishi, K. Comparison of atopic cough with cough variant asthma is atopic cough a precursor of asthma? Thorax 2003, 58, 14–18. [Google Scholar] [CrossRef] [PubMed] [Green Version]
  30. Fujimura, M.; Sakamoto, S.; Kamio, Y.; Matsuda, T. Effects of methacholine induced bronchoconstriction and procaterol induced bronchodilation on cough receptor sensitivity to inhaled capsaicin and tartaric acid. Thorax 1992, 47, 441–445. [Google Scholar] [CrossRef] [PubMed] [Green Version]
  31. The Japanese Respiratory Society The committee for the Japanese Respiratory Society guidelines for management of cough, Concept and use of the guide line. Respirology 2006, 11 (Suppl. 4), S135–S186.
  32. Fujimura, M.; Abo, M.; Ogawa, H.; Nishi, K.; Kibe, Y.; Hirose, T.; Nakatsumi, Y.; Iwasa, K. Importance of atopic cough, cough variant asthma and sinobronchial syndrome as causes of chronic cough in the Hokuriku area of Japan. Respirology 2005, 10, 201–207. [Google Scholar] [CrossRef] [PubMed]
  33. Higashi, T.; Kambayashi, Y.; Ohkura, N.; Fujimura, M.; Nakai, S.; Honda, Y.; Saijoh, K.; Hayakawa, K.; Kobayashi, F.; Michigami, Y.; et al. Reprint of: Effects of Asian dust on daily cough occurrence in patients with chronic cough: A panel study. Atmos. Environ. 2014, 97, 544–551. [Google Scholar] [CrossRef] [Green Version]
  34. Ballinger, G.A. Using Generalized Estimating Equations for Longitudinal Data Analysis. Organ. Res. Methods 2004, 7, 127–150. [Google Scholar] [CrossRef]
  35. Seinfield, J.; Pandis, S.N. Atmospheric Chemistry and Physics; John Wiley & Sons, Inc.: New York, NY, USA, 1998. [Google Scholar]
Figure 1. Source-receptor regions used in this study: (a) SRR domains in NE Asia; NCHN, north China (>40° N); CCHN, central China (30–40° N); SCHN, south China (<30° N); ERUS, eastern Asian part of Russia; SKOR, South Korea; JPN, Japan. The receptor regions are defined as the Yellow Sea and East China Sea (YEC), Sea of Japan (SOJ), and Northwestern Pacific Ocean (NWP). (b) Location of Kanazawa.
Atmosphere 12 01163 g001
Figure 2. Comparison of the observed and simulated p-PAH concentrations in Kanazawa. (a) Temporal variations, (b) scatter plot. The straight line indicates the 1:1 relation between the observed and simulated concentrations. The short-dashed line indicates a factor of 10.
Atmosphere 12 01163 g002
Figure 3. Temporal variations in the daily prevalence of cough for the total patients and patients with and without asthma (%) versus the p-PAH concentration (ng m−3) (blue color) in Kanazawa city from 4 January to 30 June 2011. The bar (magenta color) indicates the per unit increase in the p-PAH concentration. These data were retrieved from Ayenda et al., (2016).
Atmosphere 12 01163 g003
Figure 4. Temporal variations in the p-PAH concentration in Kanazawa from 1 January to 30 June 2011. (a) Simulated and observed concentrations, (b) relative contributions of the six source regions.
Atmosphere 12 01163 g004
Figure 5. Spatial distributions of the relative contributions (%) to the p-PAH concentration of the six source domains from 4–5 February 2011. (a) NCHN, (b) CCHN, (c) SCHN, (d) ERUS, (e) SKOR, and (f) JPN.
Atmosphere 12 01163 g005
Figure 6. Spatial distributions of the relative contributions (%) to the p-PAH concentration of the six source domains from 1–2 February 2011. (a) NCHN, (b) CCHN, (c) SCHN, (d) ERUS, (e) SKOR, and (f) JPN.
Atmosphere 12 01163 g006
Figure 7. Vertical variations in ePT over Kanazawa from 1 January to 30 June 2011. Unit is K.
Atmosphere 12 01163 g007
Figure 8. Horizontal distributions of ePT (850 hPa), geopotential height anomaly (850 hPa), and p-AH concentration in Northeast Asia from 31 January to 5 February 2011. (a) 31 January 2011, (b) 1 February 2011, (c) 2 February 2011, (d) 3 February 2011, (e) 4 February 2011, and (f) 5 February 2011.
Atmosphere 12 01163 g008
Table 1. Summary of data set.
Total
(N = 88)
Atshma
(N = 54)
Non-Asthma (N = 34)
SiteKanazawa
Periods4 January–30 June 2011 *
PAH measuremetntDaily
Analysis data12,473144.2152131.8
Time periods (days) 130.2135.7121.5
Number of recorded days 36.1% (10–178)23.0% (10–178)60.2% (57–178)
* 15 days missing.
Table 2. Information of the statistical analysis for the longitudinal study.
ParticipantsClassificationTotal (N = 88) %Asthma (N = 54) %Non-Ashma (N = 34) %
AdultAsthma(Adult bronchial asthma)49 (56)49 (91)-
Cough Variant Asthma (CVA)8 (9)-8 (24)
Atopic Cough (AC)16 (18)-16 (47)
Asthma and AC5 (6)5 (9)-
AC and CVA10 (11)-10 (29)
Record days130.2135.7121.5
Publisher’s Note: MDPI stays neutral with regard to jurisdictional claims in published maps and institutional affiliations.

