
Development versus Adaptation? Facing Climate Change in Ca Mau, Vietnam

 ,
,  , ,
, ,  ,
,  and
and
Abstract
:1. Introduction
1.1. Economic Development
1.2. Threats—SLR and LS
1.3. Perceptions and Responses
- What is the likely timing of threats posed by the combined effects of SLR and LS?
- What environmental changes are most salient to farmers? Which changes are perceived as threatening? Which changes are they making adaptive responses to?
2. Materials and Methods
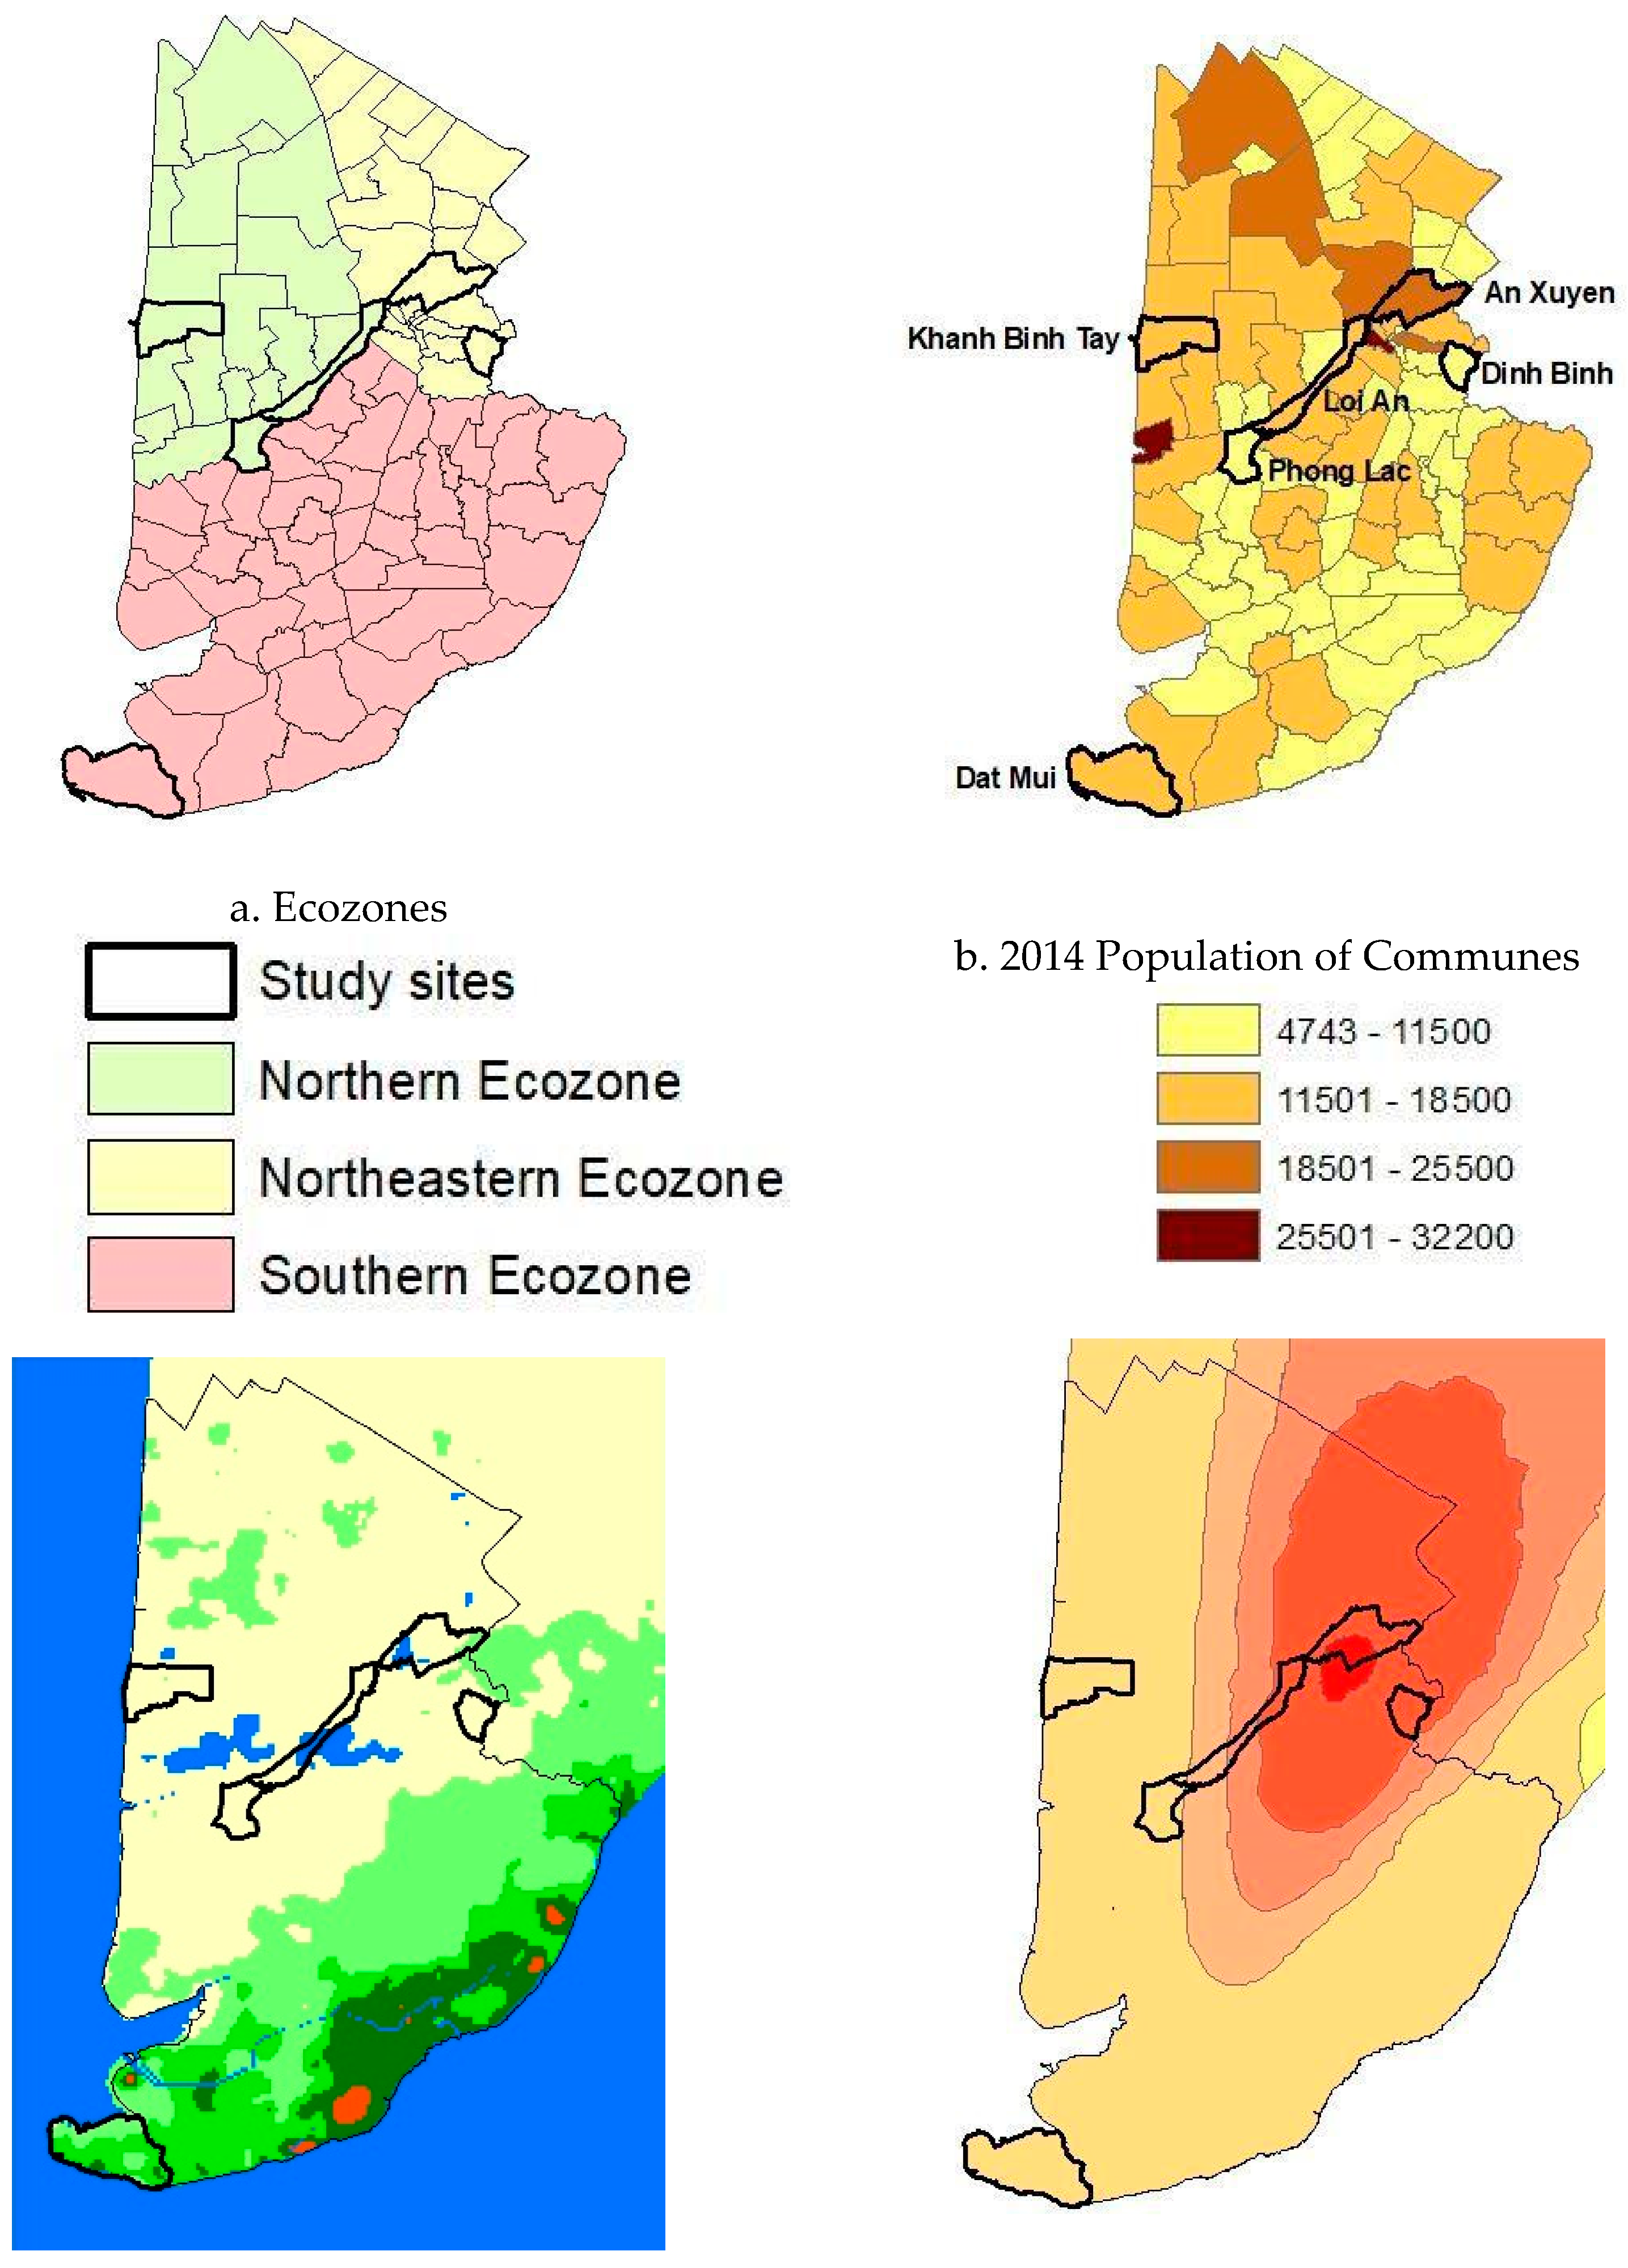
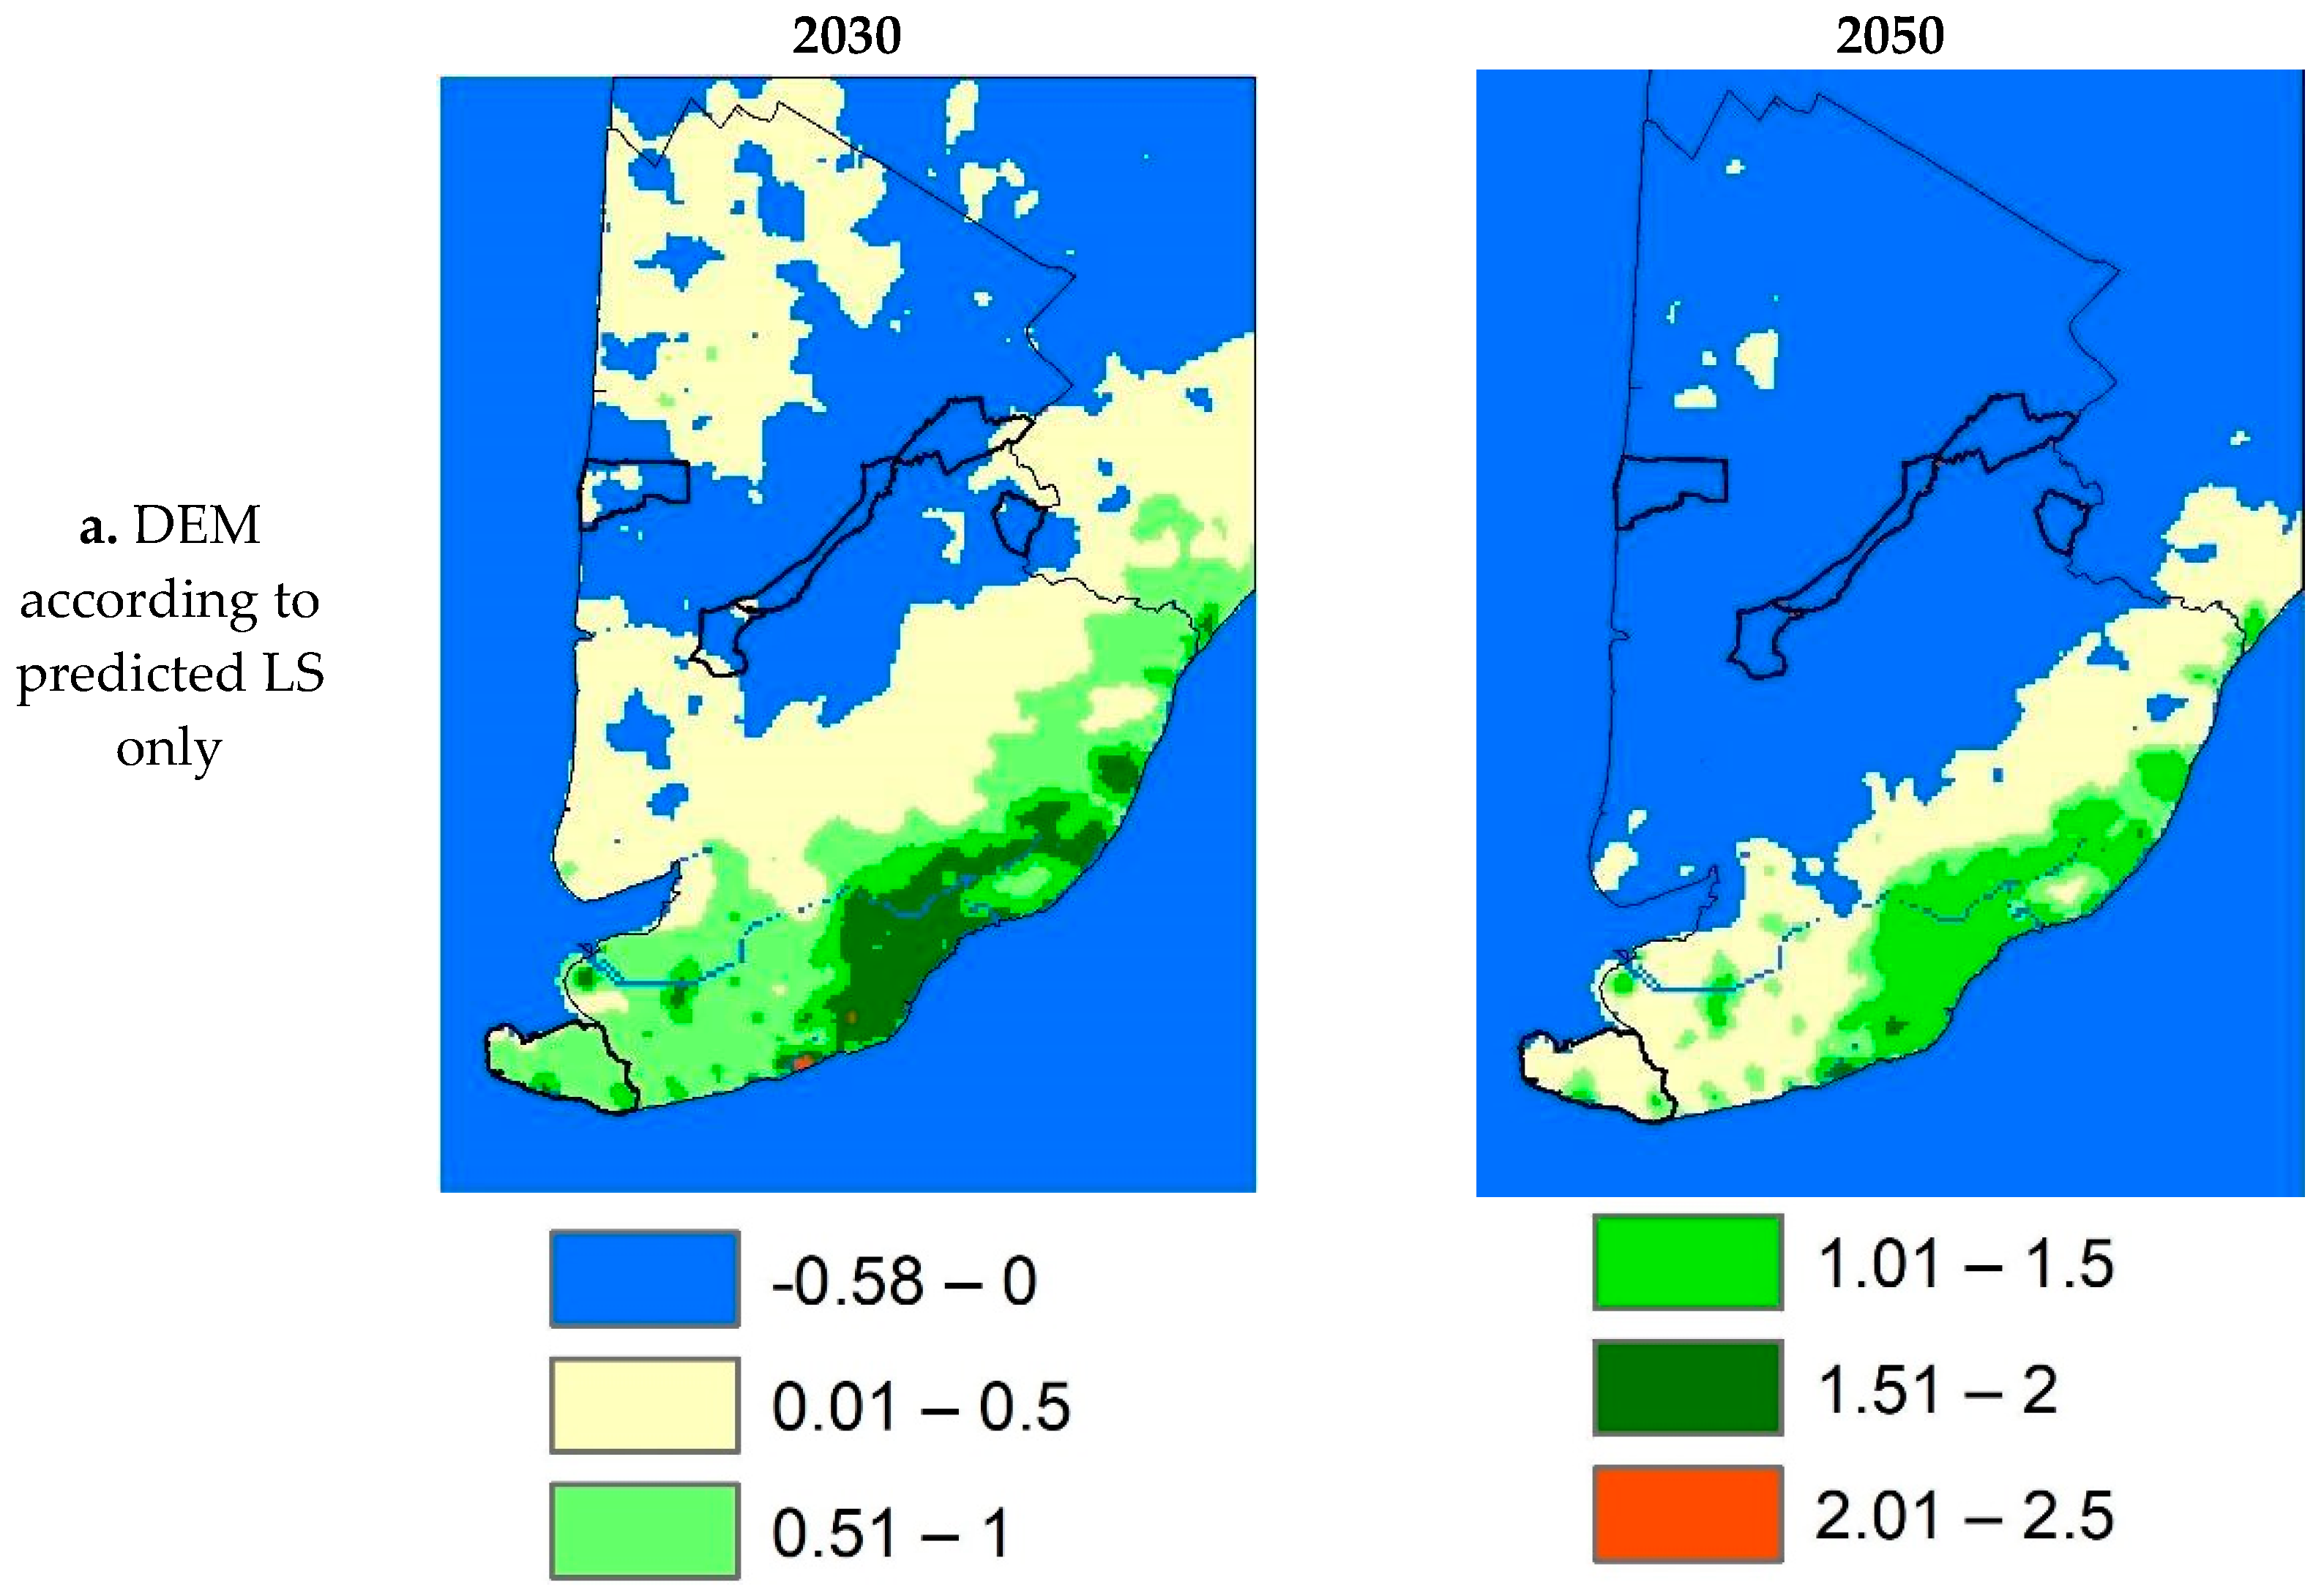
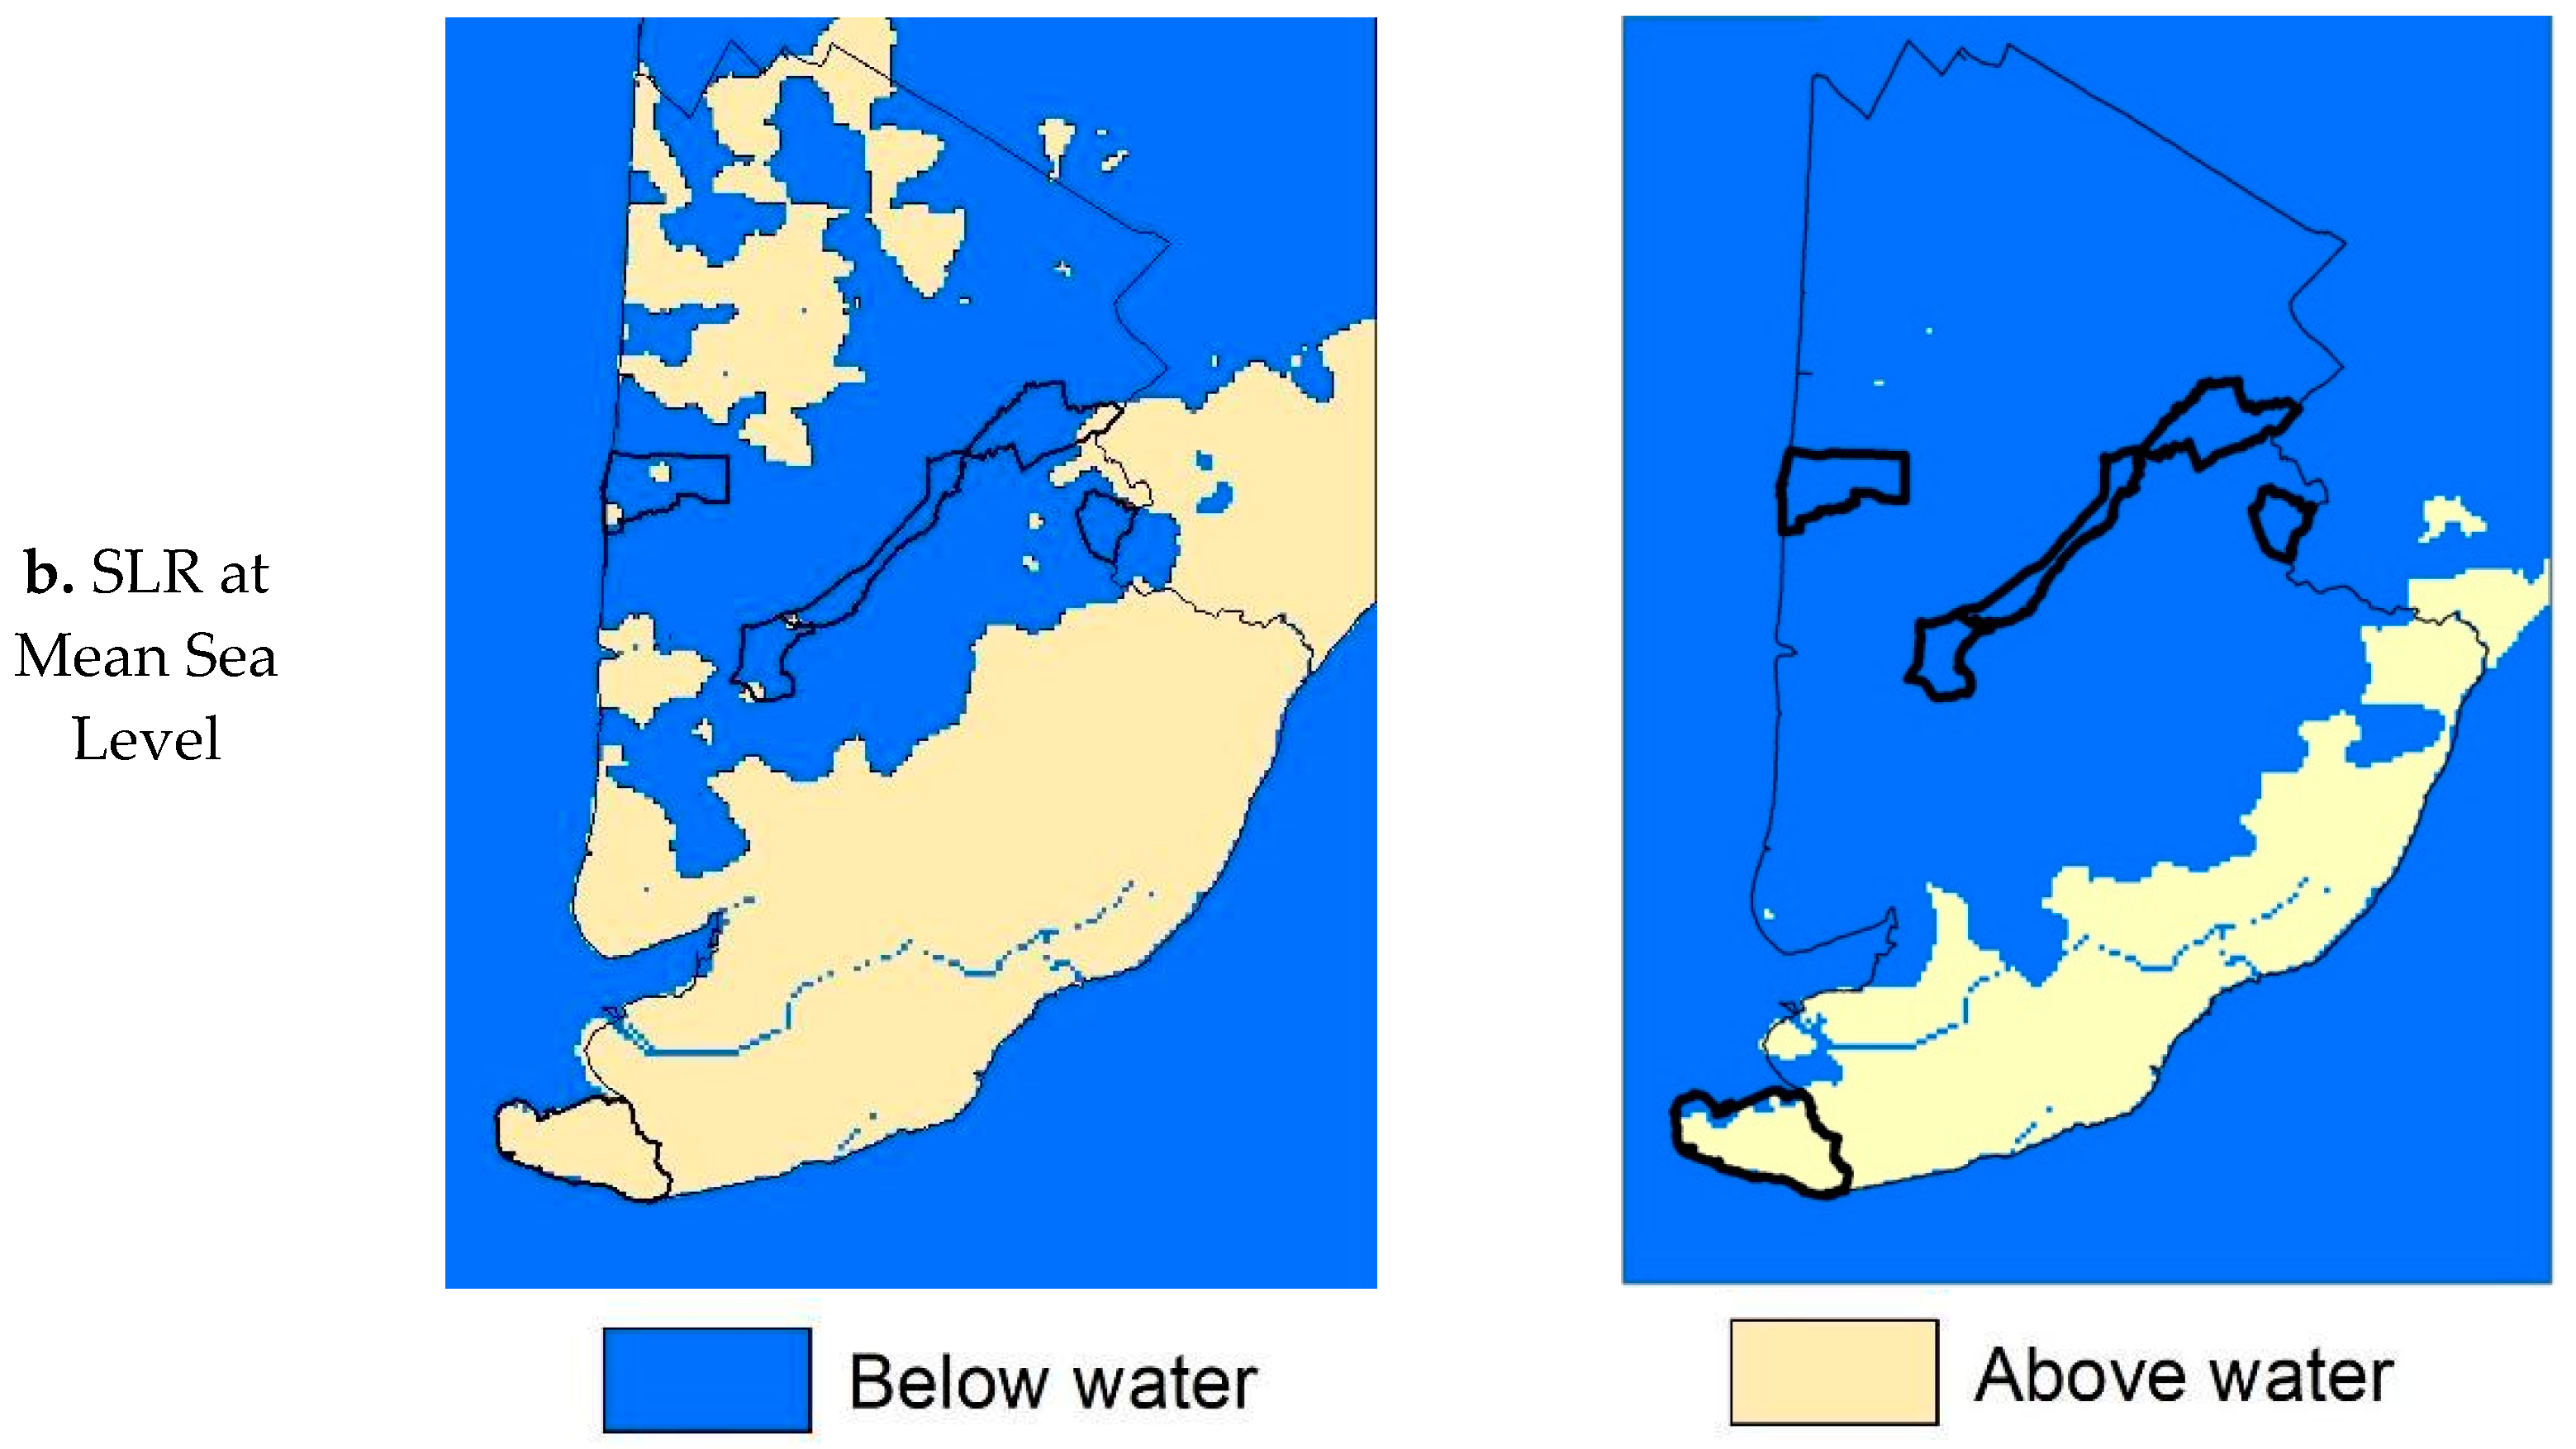
2.1. Elevation Projections, Ca Mau Province
2.2. Qualitative Interviews in Six Communes
2.2.1. Background and Goals
2.2.2. Research Sites and Participants
2.2.3. Interview Materials and Procedures
2.2.4. Statistical Analysis
3. Results
3.1. Objective Risks
3.2. Interview Results
3.2.1. Demographic Results
3.2.2. Environmental Changes (Unprompted): Salience
3.2.3. Awareness and Understanding of SLR and LS
3.2.4. Risk Perception and Adaptation for All Changes
3.2.5. SLR: Knowledge, Risk Perception and Adaptation
- Knowledge and risk perception. Only actual observation of SLR led to higher levels of risk perception. The 36 people who reported having observed SLR were more likely than the 17 who had not to perceive it as a risk to their farming practices (Mann-Whitney U = 441, p = 0.005) and to their income (U = 452, p = 0.002). However, neither simply ‘having heard about’ SLR nor being able to identify the correct causes led to greater concern. The 48 people who had heard about SLR were not more likely than the 5 people who had not to perceive it as a risk to their farming practices (U = 180, p = 0.069 exact significance) or their income (U = 182.5, p = 0.055). The 17 people who correctly understood the causes of SLR were not more likely than the 36 who had not to perceive it as a risk to their farming practices (U = 281.5, p = 0.607) and to their income (U = 276, p = 0.532).
- Risk perception and adaptation. Adaptations to SLR were more likely to be reported by farmers reporting higher levels of perceived risk to farming practices (ChiSq Linear Trend Test (DF = 1) = 3.88, p = 0.049) and to income (ChiSq Linear Trend Test (DF = 1) = 5.11, p = 0.024). See Table 6.
- Knowledge and adaptation. Farmers who correctly identified the causes of SLR were more likely to report adaptations (12/17; Fisher’s Exact = 0.018). Neither simply ‘having heard about’ SLR nor personally observing it was associated with more adaptations. Of farmers reporting having heard of SLR (48/53), 23 of 48 reported adaptations, not significantly different from those who had not heard of it (Fisher’s Exact = 0.362). Of farmers who did not report observing SLR, 29.4% (5/17) nonetheless reported adaptations, compared to 52.8% (19/36) who had reported observations; this difference was not significant (Fisher’s Exact = 0.145).
3.2.6. LS: Knowledge, Risk Perception and Adaptation
- Knowledge and risk perception. Only actual observation with LS led to higher levels of risk perception. The 12 people who had observed LS were more likely than the 41 who had not to perceive it as a risk to their farming practices (U = 313, p = 0.01) and to their income (U = 352.5, p = 0.000). The 44 people who had heard about LS were not more likely than the 9 people who had not to perceive it as a risk to their farming practices (U = 225, p = 0.245) or their income (U = 234, p = 0.171). The 19 people who correctly understood the causes of LS were not more likely than the 34 who had not to perceive it as a risk to their farming practices (U = 293, p = 0.312) and to their income (U = 303.5, p = 0.561).
- Risk perception and adaptation. In terms of adaptation, neither farmers reporting higher levels of risk perception to farming practices (ChiSq Linear Trend Test (DF = 1) = 0.628, p = 0.428) nor to income (ChiSq Linear Trend Test (DF = 1) = 0.654, p = 0.419) were more likely to report adaptations (Table 6). The farmers in Khanh Bin Tay (the commune with the most extensive freshwater polder system in our study) were significantly more likely to report adapting to LS than those of the other communes (Fisher’s Exact Test = 10.8, p = 0.011). While farmers across the province reported adding soil to embankments, only the farmers in Khanh Binh Tay reported using bulldozers to add soil to the bottoms of their fields. Khanh Binh Tay, with its freshwater polder system, may be more susceptible to saline intrusion due to its coastal location.
- Knowledge and adaptation. Farmers reporting that they had directly observed LS (12/53) were more likely to report having made adaptations (9/12 vs. 15/41) (Fisher’s Exact = 0.000). However, neither farmers who reported having heard of LS (44/53) (Fisher’s Exact = 0.334) nor those with a correct understanding of LS (19/53) (Fisher’s Exact = 1.00) were more likely to report adaptations.
4. Discussion
4.1. Objective Risks: Combined Effects of LS and SLR
4.2. The ‘Embeddedness’ of Subjective Perceptions
“I tried industrial shrimp farming. In the first several years, I succeeded, but then I failed. The government encouraged us to expand our ponds, but when we lost yields. They didn’t support us, they just gave us a little medicine to prevent shrimp disease, but not all of us received it. I changed from rice to shrimp because of government policy, and I made more profits, so I don’t think I’ll change back to rice... Salt intrusion is occurring so we cannot grow paddy rice anymore.”
4.3. Limitations and Suggestions for Future Research
5. Conclusions
Supplementary Materials
Author Contributions
Funding
Institutional Review Board Statement
Informed Consent Statement
Data Availability Statement
Acknowledgments
Conflicts of Interest
References
- General Statistics Office of Vietnam. Statistical Data. Available online: http://www.gso.gov.vn/Default_en.aspx?tabid=766 (accessed on 10 April 2020).
- Hens, L.; Thinh, N.A.; Hanh, T.H.; Cuong, N.S.; Lan, T.D.; Le, D.T. Sea-level rise and resilience in Vietnam and the Asia-Pacific: A synthesis. Vietnam. J. Earth Sci. 2018, 40, 127–153. [Google Scholar] [CrossRef] [Green Version]
- Intergovernmental Panel on Climate Change (IPCC). IPCC Special Report on the Ocean and Cryosphere in a Changing Climate; Weyer, N.M., Pörtner, H.-O., Roberts, D.C., Masson-Delmotte, V., Zhai, P., Tignor, M., Poloczanska, E., Mintenbeck, K., Alegría, A., Nicolai, M., et al., Eds.; Intergovernmental Panel on Climate Change (IPCC): Geneva, Switzerland, 2019. [Google Scholar]
- Kulp, S.A.; Strauss, B.H. New elevation data triple estimates of global vulnerability to sea-level rise and coastal flooding. Nat. Commun. 2019, 10, 4844. [Google Scholar] [CrossRef] [PubMed] [Green Version]
- Minderhoud, P.S.J.; Coumou, L.; Erkens, G.; Middelkoop, H.; Stouthamer, E. Mekong delta much lower than previously assumed in sea-level rise impact assessments. Nat. Commun. 2019, 10, 3847. [Google Scholar] [CrossRef] [PubMed]
- Ministry of Natural Resources and Environment (MONRE). Climate Change, Sea Level Rise Scenarios for Vietnam. 2016. Available online: http://www.imh.ac.vn/files/doc/2017/CCS%20final.compressed.pdf (accessed on 1 September 2021).
- Nhung, T.T.; Le Vo, P.; van Nghi, V.; Bang, H.Q. Salt intrusion adaptation measures for sustainable agricultural development under climate change effects: A case of Ca Mau Peninsula, Vietnam. Clim. Risk Manag. 2019, 23, 88–100. [Google Scholar] [CrossRef]
- Minderhoud, P.; Middelkoop, H.; Erkens, G.; Stouthamer, E. Groundwater extraction may drown mega-delta: Projections of extraction-induced subsidence and elevation of the Mekong delta for the 21st century. Environ. Res. Commun. 2020, 2, 011005. [Google Scholar] [CrossRef]
- Erban, L.E.; Gorelick, S.M.; Zebker, H.A. Groundwater extraction, land subsidence, and sea-level rise in the Mekong Delta, Vietnam. Environ. Res. Lett. 2014, 9, 084010. [Google Scholar] [CrossRef]
- Karlsrud, K.; Tunbridge, L.; Khanh, N.Q.; Dinh, N.Q. Preliminary results of land subsidence monitoring in the Ca Mau Province. In Proceedings of the International Association of Hydrological Sciences (IAHS), Tenth International Symposium on Land Subsidence, Delft, The Netherlands, 17–21 May 2021; Volume 382, pp. 111–115. [Google Scholar]
- Smajgl, A.; Toan, T.Q.; Nhan, D.K.; Ward, J.F.; Trung, N.H.; Tri, L.Q.; Tri, V.P.D.; Vu, P.T. Responding to rising sea levels in the Mekong Delta. Nat. Clim. Chang. 2015, 5, 167–174. [Google Scholar] [CrossRef]
- Environmental Justice Foundation (EJF). Risky Business: Vietnamese Shrimp Aquaculture—Impacts and Improvements. 2003. Available online: http://www.vliz.be/en/imis?module=ref&refid=203980&printversion=1&dropIMIStitle=1 (accessed on 1 September 2021).
- Nguyen, T.A.T.; Nguyen, K.A.T.; Jolly, C. Is super-intensification the solution to shrimp production and export sustainability? Sustainability 2019, 11, 5277. [Google Scholar] [CrossRef] [Green Version]
- Sen Nag, O. Top Fish and Seafood Exporting Countries. 2017. Available online: https://www.worldatlas.com/articles/top-fish-and-seafood-exporting-countries.html (accessed on 1 September 2021).
- Sen Nag, O. Top Rice Exporting and Importing Countries. 2017. Available online: https://www.worldatlas.com/articles/top-rice-exporting-and-importing-countries.html (accessed on 1 September 2021).
- Biggs, D. Fixing the Delta: History and the Politics of Hydraulic Infrastructure Development and Conservation in the Mekong Delta. In Environmental Change and Agricultural Sustainability in the Mekong Delta; Steward, M.A., Coclania, P.A., Eds.; Springer Science & Business Media: Dordrecht, The Netherlands, 2011; Volume 45, pp. 35–44. ISBN 978-940-070-933-1. [Google Scholar]
- Olson, K.R.; Morton, L.W. Polders, dikes, canals, rice, and aquaculture in the Mekong Delta. J. Soil Water Conserv. 2018, 73, 83A–89A. [Google Scholar] [CrossRef] [Green Version]
- Scherr, S.; Mankad, K.; Jaffee, S.; Negara, C. Steps Toward Green: Policy Responses to Commodity Agriculture in East and Southeast Asia; World Bank Group: Washington, DC, USA; EcoAgriculture Partners: Oakton, VA, USA, 2015; Available online: http://www.landscapes.org/publication/steps-toward-green-policy-responses-to-commodity-agriculture-in-east-and-southeast-asia/ (accessed on 1 September 2021).
- Van Quach, A.; Murray, F.; Morrison-Saunders, A. The vulnerability of shrimp farming income to climate change events. Int. J. Clim. Chang. Strat. Manag. 2017, 9, 261–280. [Google Scholar] [CrossRef]
- Ministry of Agriculture and Rural Development (MARD). Mekong Delta Integrated Climate Resilience and Sustainable Livelihoods Project, Regional Environmental Assessment Report; Ministry of Agriculture and Rural Development (MARD): Hanoi, Vietnam, 2016.
- CGIAR Research Centers in Southeast Asia. The Drought and Salinity Intrusion in the Mekong River Delta of Vietnam, Assessment Report. 2016. Available online: https://cgspace.cgiar.org/handle/10568/75633%0Apapers3://publication/uuid/1F44F90C-A3AD-4202-B9EE-EDB184F85B37 (accessed on 1 September 2021).
- Nguyen, H.S.; Bui, T.Y.; Sebastian, L. Development of Climate-Related Risk Maps and Adaptation Plans (Climate Smart MAP) for Rice Production in Vietnam’s Mekong River Delta; CGIAR Research Program on Climate Change, Agriculture and Food Security (CCAFS): Wageningen, The Netherlands, 2018; Available online: https://cgspace.cgiar.org/rest/bitstreams/148994/retrieve (accessed on 1 September 2021).
- The U.S. Global Change Research Program (USGCRP). Impacts, Risks, and Adaptation in the United States: Fourth National Climate Assessment, Volume II. 2018. Available online: https://nca2018.globalchange.gov/ (accessed on 1 September 2021).
- Minderhoud, P.S.J.; Erkens, G.; Pham, V.H.; Bui, V.T.; Erban, L.; Kooi, H.; Stouthamer, E. Impacts of 25 years of groundwater extraction on subsidence in the Mekong delta, Vietnam. Environ. Res. Lett. 2017, 12, 064006. [Google Scholar] [CrossRef]
- Minderhoud, P.; Coumou, L.; Erban, L.; Middelkoop, H.; Stouthamer, E.; Addink, E. The relation between land use and subsidence in the Vietnamese Mekong delta. Sci. Total. Environ. 2018, 634, 715–726. [Google Scholar] [CrossRef] [PubMed]
- Gesch, D.B. Best practices for elevation-based assessments of sea-level rise and coastal flooding exposure. Front. Earth Sci. 2018, 6, 230. [Google Scholar] [CrossRef] [Green Version]
- Kulp, S.; Strauss, B.H. Global DEM errors underpredict coastal vulnerability to sea level rise and flooding. Front. Earth Sci. 2016, 4, 36. [Google Scholar] [CrossRef]
- Yamazaki, D.; Ikeshima, D.; Tawatari, R.; Yamaguchi, T.; O’Loughlin, F.; Neal, J.C.; Sampson, C.C.; Kanae, S.; Bates, P.B. A high-accuracy map of global terrain elevations. Geophys. Res. Lett. 2017, 44, 5844–5853. [Google Scholar] [CrossRef] [Green Version]
- Le Dang, H.; Li, E.; Nuberg, I.; Bruwer, J. Farmers’ perceived risks of climate change and influencing factors: A study in the Mekong Delta, Vietnam. Environ. Manag. 2014, 54, 331–345. [Google Scholar] [CrossRef]
- Le Dang, H.; Li, E.; Nuberg, I.; Bruwer, J. Understanding farmers’ adaptation intention to climate change: A structural equation modelling study in the Mekong Delta, Vietnam. Environ. Sci. Policy 2014, 41, 11–22. [Google Scholar] [CrossRef]
- Tran, T.A.; Rodela, R. Integrating farmers’ adaptive knowledge into flood management and adaptation policies in the Vietnamese Mekong Delta: A social learning perspective. Glob. Environ. Chang. 2019, 55, 84–96. [Google Scholar] [CrossRef]
- Takagi, H.; Thao, N.D.; Anh, L.T. Sea-level rise and land subsidence: Impacts on flood projections for the Mekong delta’s largest city. Sustainability 2016, 8, 959. [Google Scholar] [CrossRef] [Green Version]
- Asian Development Bank (ADB). Climate Risks in the Mekong Delta: Ca Mau and Kien Giang Provinces of Viet Nam; Asian Development Bank (ADB): Manila, Philippines, 2013. [Google Scholar]
- Wassmann, R.; Phong, N.D.; Tho, T.Q.; Hoanh, C.T.; Khoi, N.H.; Hien, N.X.; Vo, T.B.T.; Tuong, T.P. High-resolution mapping of flood and salinity risks for rice production in the Vietnamese Mekong Delta. Field Crop. Res. 2019, 236, 111–120. [Google Scholar] [CrossRef]
- Tran, D.D.; van Halsema, G.; Hellegers, P.J.; Hoang, L.P.; Ludwig, F. Long-term sustainability of the Vietnamese Mekong Delta in question: An economic assessment of water management alternatives. Agric. Water Manag. 2019, 223, 105703. [Google Scholar] [CrossRef]
- International Centre for Environmental Management (ICEM). Delta Maps: Compaction-Based Subsidence. 2015. Available online: https://icem.com.au/slide/delta-maps-compaction-based-subsidence/ (accessed on 1 September 2021).
- Malik, A.; Abdalla, R. Geospatial modeling of the impact of sea level rise on coastal communities: Application of Richmond, British Columbia, Canada. Model. Earth Syst. Environ. 2016, 2, 146. [Google Scholar] [CrossRef] [Green Version]
- National Oceanic and Atmospheric Administration (NOAA). Mapping Coastal Inundation Primer; National Oceanic and Atmospheric Administration (NOAA): Silver Spring, MA, USA, 2012; pp. 1–28.
- Hodgson, M.E.; Bresnahan, P. Accuracy of airborne lidar-derived elevation. Photogramm. Eng. Remote Sens. 2004, 70, 331–339. [Google Scholar] [CrossRef] [Green Version]
- Tran, H.; Tran, T.; Kervyn, M. Dynamics of land cover/land use changes in the Mekong delta, 1973–2011: A remote sensing analysis of the Tran Van Thoi District, Ca Mau Province, Vietnam. Remote Sens. 2015, 7, 2899–2925. [Google Scholar] [CrossRef] [Green Version]
- Tran, D.B.; Dargusch, P.; Moss, P.; Hoang, T.V. An assessment of potential responses of Melaleuca genus to global climate change. Mitig. Adapt. Strat. Glob. Chang. 2012, 18, 851–867. [Google Scholar] [CrossRef]
- Minderhoud, P.S.J.; Hlavacova, I.; Kolomaznik, J.; Neussner, O. Towards unraveling total subsidence of a mega-delta—The potential of new PS InSAR data for the Mekong delta. In Proceedings of the International Association of Hydrological Sciences (IAHS), Tenth International Symposium on Land Subsidence, Delft, The Netherlands, 17–21 May 2021; Volume 382, pp. 327–332. [Google Scholar]
- Mackay, P.; Russell, M. Climate change impact and adaptation study in the Mekong Delta—Part A. In Climate Change Vulnerability & Risk Assessment Study for Ca Mau and Kien Giang Provinces, Vietnam; Institute of Meteorology, Hydrology and Environment of Vietnam (IMHEN): Hanoi, Vietnam, 2011; p. 250. [Google Scholar]
- Vietnam Environment Protection Agency (Vietnam EPA). Overview of Wetlands Status in Viet Nam Following 15 Years of Ramsar Convention Implementation; Vietnam Environment Protection Agency (Vietnam EPA): Hanoi, Vietnam, 2005. [Google Scholar]
- Resurreccion, B.P.; Sajor, E.E.; Fajber, E. Climate Adaptation in Asia: Knowledge Gaps and Research Issues in South East Asia, Full Report of the South East Asia Team; Institute for Social and Environmental Transition—International (ISET-International): Boulder, CO, USA; ISET-Nepal (Institute for Social and Environmental Transition—Nepal): Kathmandu, Nepal, 2008; Available online: http://idl-bnc.idrc.ca/dspace/handle/10625/41543 (accessed on 1 September 2021).
- Loewenstein, G.; Prelec, D. Anomalies in intertemporal choice: Evidence and an interpretation. Q. J. Econ. 1992, 107, 573–597. [Google Scholar] [CrossRef]
- Gustafson, S.; Cadena, A.J.; Hartman, P. Adaptation planning in the Lower Mekong Basin: Merging scientific data with local perspective to improve community resilience to climate change. Clim. Dev. 2016, 10, 152–166. [Google Scholar] [CrossRef]
- Veettil, B.K.; Ward, R.D.; Quang, N.X.; Trang, N.T.T.; Giang, T.H. Mangroves of Vietnam: Historical development, current state of research and future threats. Estuar. Coast. Shelf Sci. 2019, 218, 212–236. [Google Scholar] [CrossRef]
- Carew-Reid, J. Rapid Assessment of the Extent and Impact of Sea Level Rise in Viet Nam, Climate Change Discussion Paper 1; International Centre for Environmental Management (ICEM): Brisbane, Australia, 2008. [Google Scholar]
- Karlsrud, K.; Vangelsten, B.V.; Frauenfelder, R. Subsidence and shoreline retreat in the Ca Mau Province—Vietnam causes, consequences and mitigation options. Geotech. Eng. 2017, 48, 26–32. [Google Scholar]


| Mekong River Delta | Ca Mau Province | ||||||
|---|---|---|---|---|---|---|---|
| 1999 | 2017 | % Change | 1999 | 2017 | % Change | ||
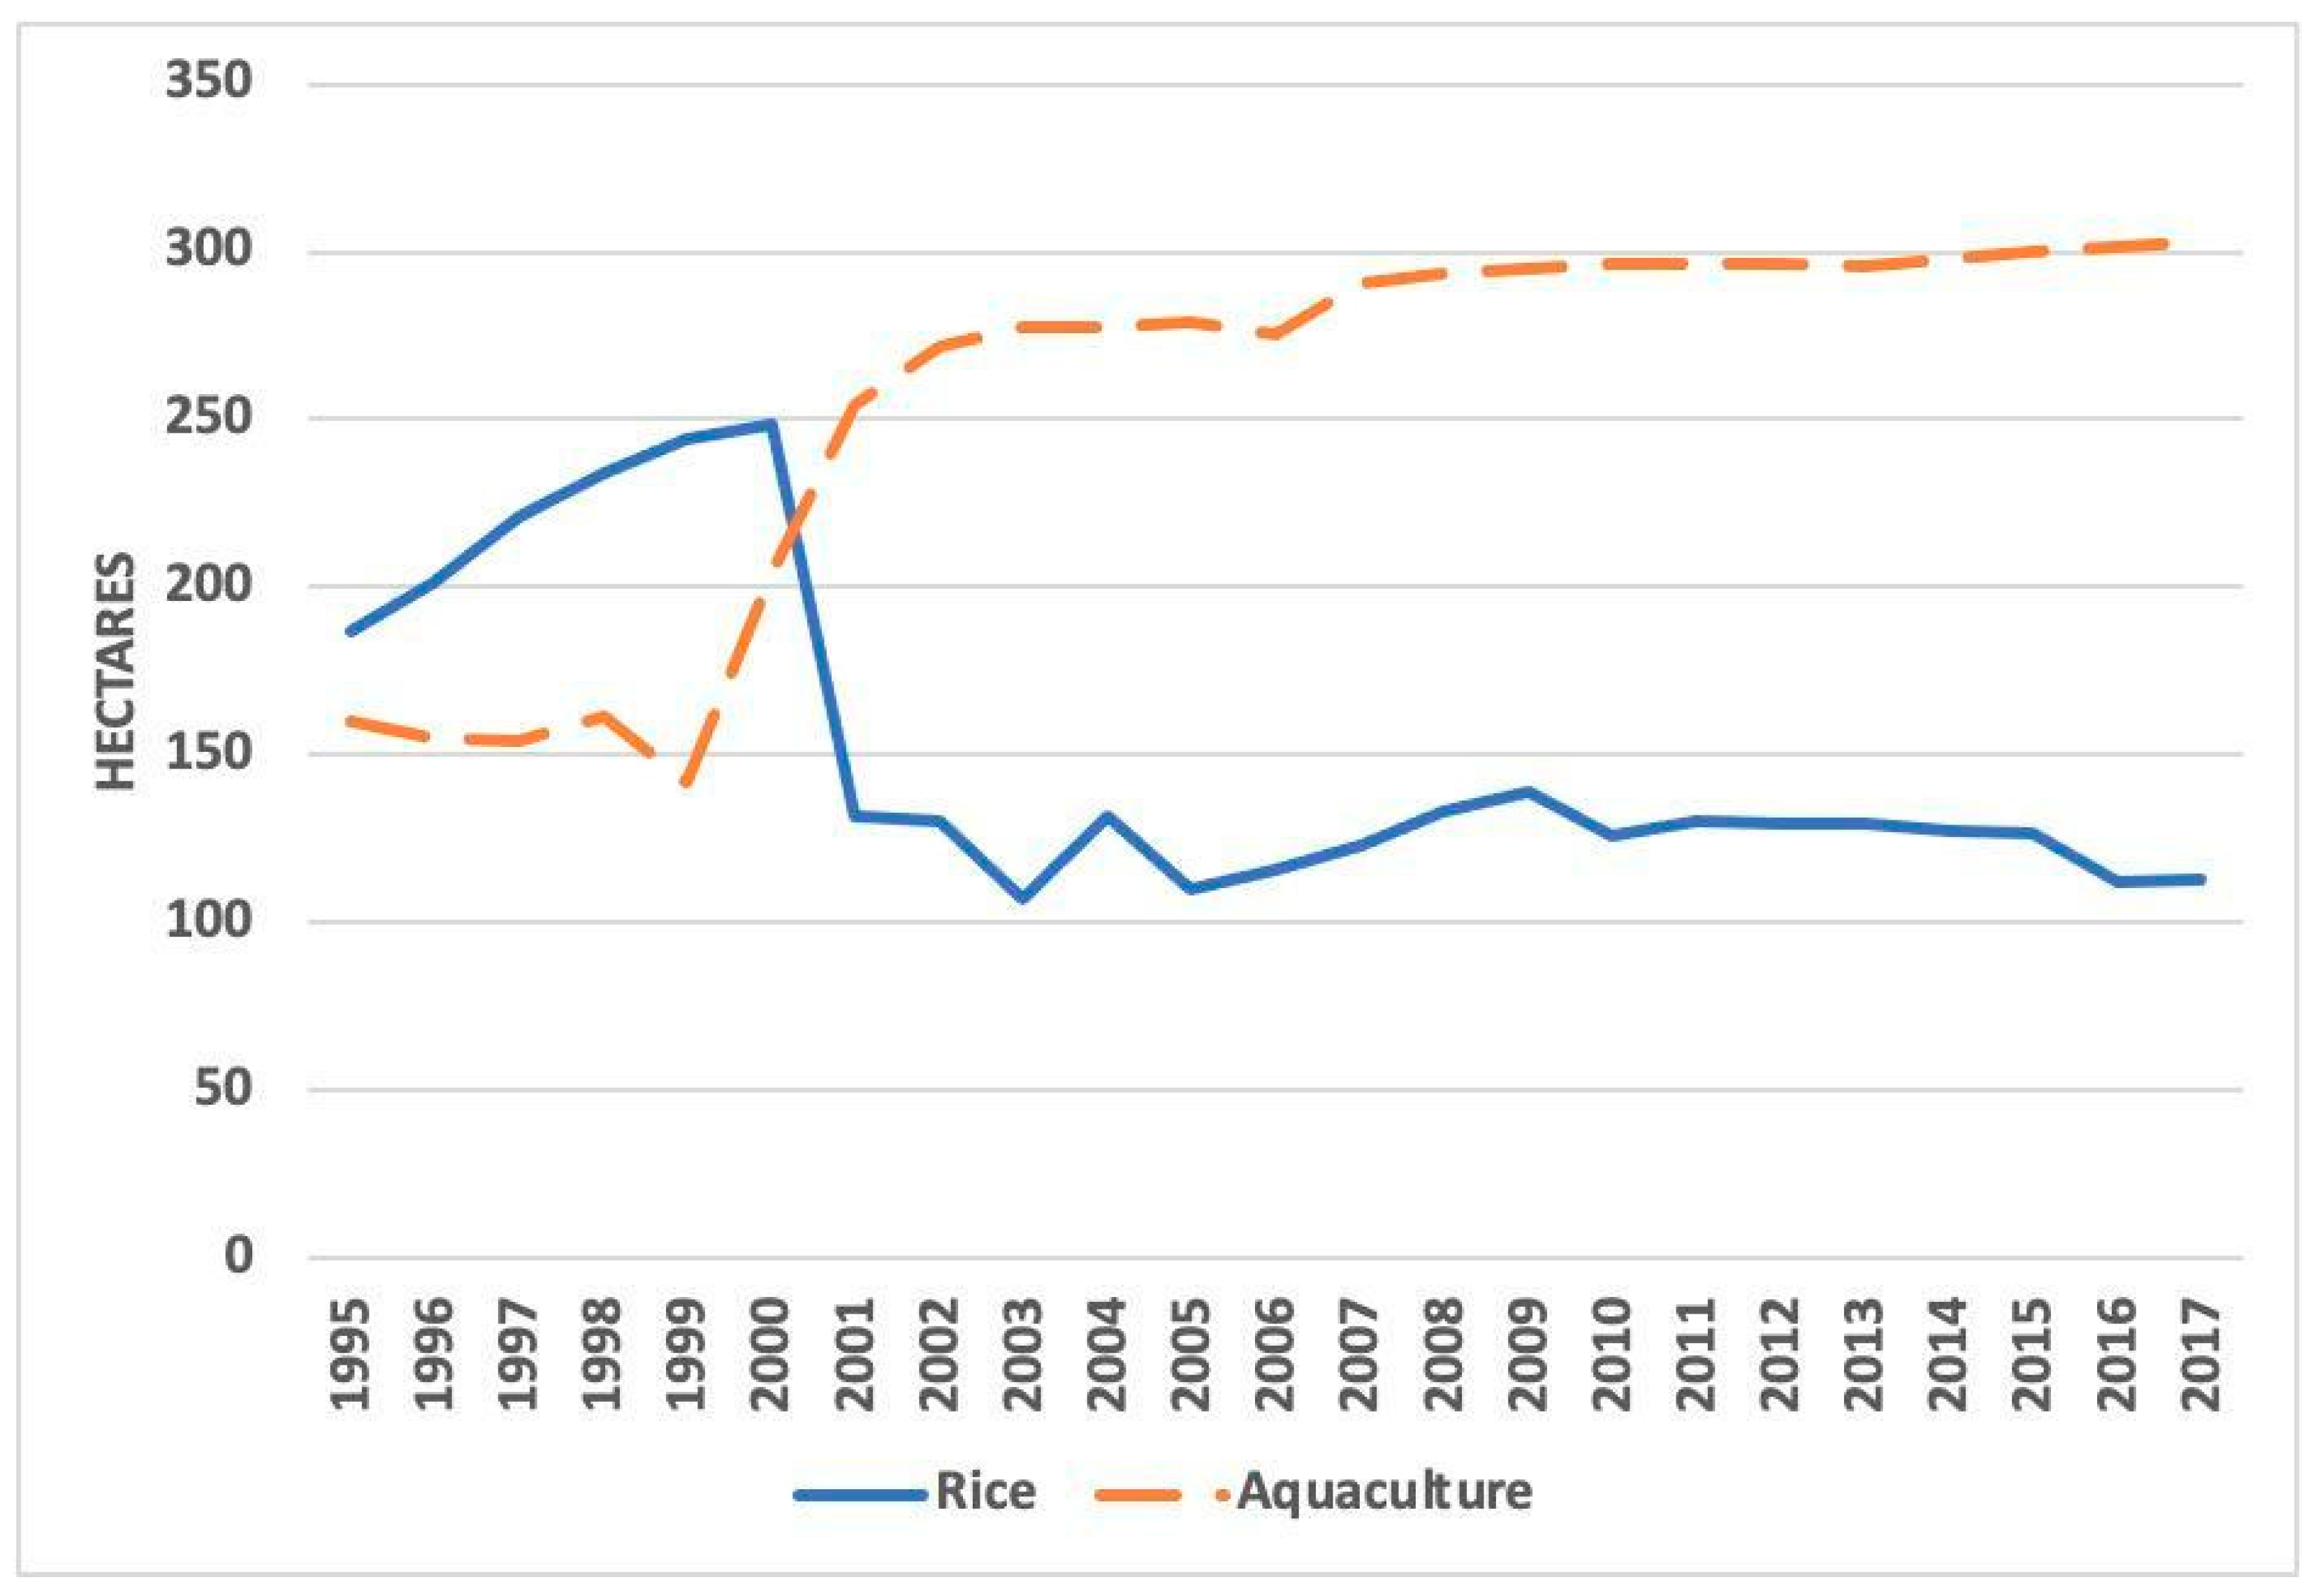
| Rice | Surface (thousands of ha) | 3,985.2 | 4,185.3 | 5.0% | 243.8 | 113.1 | −53.6% |
| Yield (tons/ha) | 4.1 | 5.6 | 37.9% | 3.5 | 3.9 | 13.9% | |
| Production (millions of tons) | 16.3 | 23.6 | 44.9% | 0.8 | 0.4 | −47.2% | |
| AQC | Surface (thousands of ha) | 332.9 | 796.0 | 139.1% | 141.5 | 302.9 | 114.1% |
| Yield (tons/ha) | 886.5 | 3410.8 | 284.8% | 330.2 | 1017.9 | 208.3% | |
| Production (millions of tons) | 295.1 | 2,715.0 | 820.0% | 46.7 | 308.3 | 560.0% | |
| Shrimp | Production (millions of tons) | 41.4 | 617.7 | 1,392.1% | 19.7 | 157.7 | 699.5% |
| Dat Mui | Dinh Binh | Kanh Binh Tay | An Xuyen | Phong Lac | Loi An | CA MAU | |
|---|---|---|---|---|---|---|---|
| Area in hectares | 10.173 | 2294 | 5859 | 5784 | 3291 | 4637 | 511.146 |
| Elevation cm (SD) | 103 (21) | 29 (6) | 25 (6) | 16 (18) | 26 (5) | 13 (12) | 59 (48) |
| Elevation min-max in cm | 45–186 | 16–45 | 14–51 | −8–62 | 16–39 | −7–40 | −16–259 |
| LS in cm yrly | 1.76–2 | 2.5–3 | 1.76–2 | 2.5–3.3 | 1.76–2 | 2.01–3 | 1.76–3.3 |
| SLR in cm yrly | 0.33 | 0.33 | 0.33 | 0.33 | 0.33 | 0.33 | 0.33 |
| 2030 * | |||||||
| LS in cm | 28.2 | 40 | 28.2 | 40 | 28.2 | 32.2 | 28.2 |
| SLR in cm | 5.3 | 5.3 | 5.3 | 5.3 | 5.3 | 5.3 | 5.3 |
| Total in cm | 33.5 | 45.3 | 33.5 | 45.3 | 33.5 | 37.5 | 33.5 |
| % below mean sea level * | 0.0% | 100% | 90.6% | 97.8% | 92.4% | 87.1% | 43.4% |
| 2050 * | |||||||
| LS in cm | 63.4 | 90.0 | 63.4 | 90 | 63.4 | 72.4 | 63.4 |
| SLR in cm | 22 | 22 | 22 | 22 | 22 | 22 | 22 |
| Total in cm | 85.4 | 112 | 85.4 | 112 | 85.4 | 94.4 | 85.4 |
| % below mean sea level | 13.3% | 100% | 100% | 100% | 100% | 100% | 75.4% |
| Commune | An Xuyen (n = 12) | Dinh Binh (n = 10) | Dat Mui (n = 10) | Khanh Binh Tay (n = 11) | Loi An (n = 6) | Phong Lac (n = 4) | Total (n = 53) |
|---|---|---|---|---|---|---|---|
| Age | 53.75 (9.19) | 51.00 (9.63) | 50.70 (11.41) | 48.09 (9.84) | 49.5 (14.2) | 37.75 (8.66) | 49.8 (10.7) |
| Gender | M = 10; F = 2 | M = 8; F = 2 | M = 8; F = 2 | M = 7 F = 4 | M = 3 F = 3 | M = 2 F = 2 | M = 38 F = 15 |
| Farmer Status | Owner = 10 Owner & Renter = 1 Renter & Laborer = 1 | Owner = 10 | Owner = 10 | Owner = 10 Owner & Renter = 1 | Owner = 6 | Owner = 4 | Owner = 50 Owner/ Renter = 2 Renter/ Laborer = 1 |
| Farm Type ** | R-SAQC = 6 SAQC = 1 R/O = 4 Orchards = 1 | SAQC = 10 | ISM = 10 | R/O = 7 R-FAQC = 3 R-SAQC = 1 | SAQC = 4 RSR = 2 | SAQC = 4 | SAQC = 19 R/O = 11 ISM = 10 R-SAQC = 9 RSR = 2 Orchards = 1 R/SWAQC = 1 |
| Farm Size (Ha) Mean (SD) | 3.04 ha (3.86 ha) | 2.67 ha (1.73 ha) | 4.31 ha (2.93 ha) | 2.73 ha (1.04 ha) | 2.48 ha (1.02 ha) | 2.12 ha (0.63 ha) | 3.02 ha (2.44 ha) |
| Reported Changes | Farmers Reporting Change (Initial, Unprompted) | Percent of Farmers Reporting Change (Prompted) * | Details of Observed Changes |
|---|---|---|---|
| Erratic/Extreme Weather | 88.7% | 92.5% | Extended rainy season/high precipitation; higher precipitation in dry season, unpredictable seasonal changes, weather and temperature; storms, hotter weather, drought, temperature decreases |
| Saline Intrusion | 35.8% | 35.8% | Faster saline intrusion, saline water is higher, higher salinity levels |
| Water Pollution | 20.8% | 22.6% | Water pollution from industrial farming |
| Soil Infertility | 17.0% | 17.0% | Barren, infertile soil |
| Diseases | 13.2% | 20.8% | Many kinds of diseases affecting shrimp and plants; more bacteria in fields |
| Flooding | 9.4% | 17.0% | Higher water level, inundation |
| Insects | 9.4% | 11.3% | Harmful insects; insects spreading diseases |
| Sea Level Rise | 9.4% | 67.9% | Higher water level, sea water flows into field more |
| Soil Pollution | 3.8% | 3.8% | Polluted land, more acidic soil |
| Land Subsidence | 3.8% | 22.6% | Sinking soil |
| An Xuyen (n = 12) | Dinh Binh (n = 10) | Dat Mui (n = 10) | Khanh Binh Tay (n = 11) | Loi An (n = 6) | Phong Lac (n = 4) | TOTAL (n = 53) | |
|---|---|---|---|---|---|---|---|
| SLR | |||||||
| Heard of | 9 | 10 | 10 | 11 | 5 | 3 | 48 |
| Observed | 8 | 8 | 7 | 7 | 3 | 3 | 36 |
| Understand * | 3.5 | 6.5 | 3.5 | 3.5 | 2 | 2 | 21 |
| LS | |||||||
| Heard of | 9 | 7 | 10 | 11 | 4 | 3 | 44 |
| Observed | 0 a | 0 | 6 a | 4 | 1 | 1 | 12 |
| Understand * | 2 | 3.5 | 3.5 | 5 | 3 | 0.5 | 17.5 |
| An Xuyen (n = 12) | Dinh Binh (n = 10) | Dat Mui (n = 10) | Khanh Binh Tay (n = 11) | Loi An (n = 6) | Phong Lac (n = 4) | TOTAL (n = 53) | |
|---|---|---|---|---|---|---|---|
| All Observed Changes | |||||||
| Risk to Farming Practices M (SD) | 3.25 (1.60) | 2.90 (1.37) | 3.80 (0.92) | 3.64 (1.36) | 3.33 (1.51) | 2.75 (1.26) | 3.34 (1.34) |
| Risk to Income M (SD) | 3.33 (1.67) | 2.70 (1.64) | 4.10 (0.88) | 3.36 (1.57) | 3.33 (1.51) | 2.75 (1.26) | 3.32 (1.48) |
| Percentage adapting | 58% | 70% | 40% | 64% | 83% | 25% | 58% |
| SLR | |||||||
| Objective Risk ** | Very High | High | High | Very High | High | High | |
| Risk to Farming Practices M (SD) | 2.00 (1.65) | 1.20 (0.42) | 3.50 (1.78) | 3.09 (1.70) | 2.00 (1.55) | 1.25 (0.50) | 2.30 (1.65) |
| Risk to Income M (SD) | 2.00 (1.65) | 1.40 (0.97) | 3.50 (1.78) | 3.41 (1.59) | 2.00 (1.55) | 1.75 (1.50) | 2.44 (1.69) |
| Percentage adapting | 42% | 40% | 70% | 45% | 33% | 25% | 45% |
| LS | |||||||
| Objective Risk * | High | High | Mod | Mod | High | Mod | |
| Risk to Farming Practices M (SD) | 1.00 (0.0) | 1.10 (0.32) | 1.05 (0.16) | 1.32 (0.64) | 1.00 (0.0) | 1.25 (0.50) | 1.11 (0.36) |
| Risk to Income M (SD) | 1.00 (0.0) | 1.30 (0.95) | 1.35 (0.94) | 1.45 (0.72) | 1.00 (0.0) | 1.25 (0.50) | 1.24 (0.68) |
| Percentage adapting | 0% | 0% | 20% | 45% | 0% | 0% | 13% |
Publisher’s Note: MDPI stays neutral with regard to jurisdictional claims in published maps and institutional affiliations. |
© 2021 by the authors. Licensee MDPI, Basel, Switzerland. This article is an open access article distributed under the terms and conditions of the Creative Commons Attribution (CC BY) license (https://creativecommons.org/licenses/by/4.0/).
Share and Cite
Giusto, B.D.; Le, T.M.N.; Nguyen, T.T.M.; Nguyen, T.T.H.; Vu, N.U.M.; Lavallee, J.P. Development versus Adaptation? Facing Climate Change in Ca Mau, Vietnam. Atmosphere 2021, 12, 1160. https://doi.org/10.3390/atmos12091160
Giusto BD, Le TMN, Nguyen TTM, Nguyen TTH, Vu NUM, Lavallee JP. Development versus Adaptation? Facing Climate Change in Ca Mau, Vietnam. Atmosphere. 2021; 12(9):1160. https://doi.org/10.3390/atmos12091160
Chicago/Turabian StyleGiusto, Bruno Di, Thi Minh Nghi Le, Thanh Thao My Nguyen, Thi Thuy Hanh Nguyen, Nguyen Uyen My Vu, and Joseph Paul Lavallee. 2021. "Development versus Adaptation? Facing Climate Change in Ca Mau, Vietnam" Atmosphere 12, no. 9: 1160. https://doi.org/10.3390/atmos12091160