
Characterization of Commercially Available Active-Type Radon–Thoron Monitors at Different Sampling Flow Rates


 ,
,  , and
, and 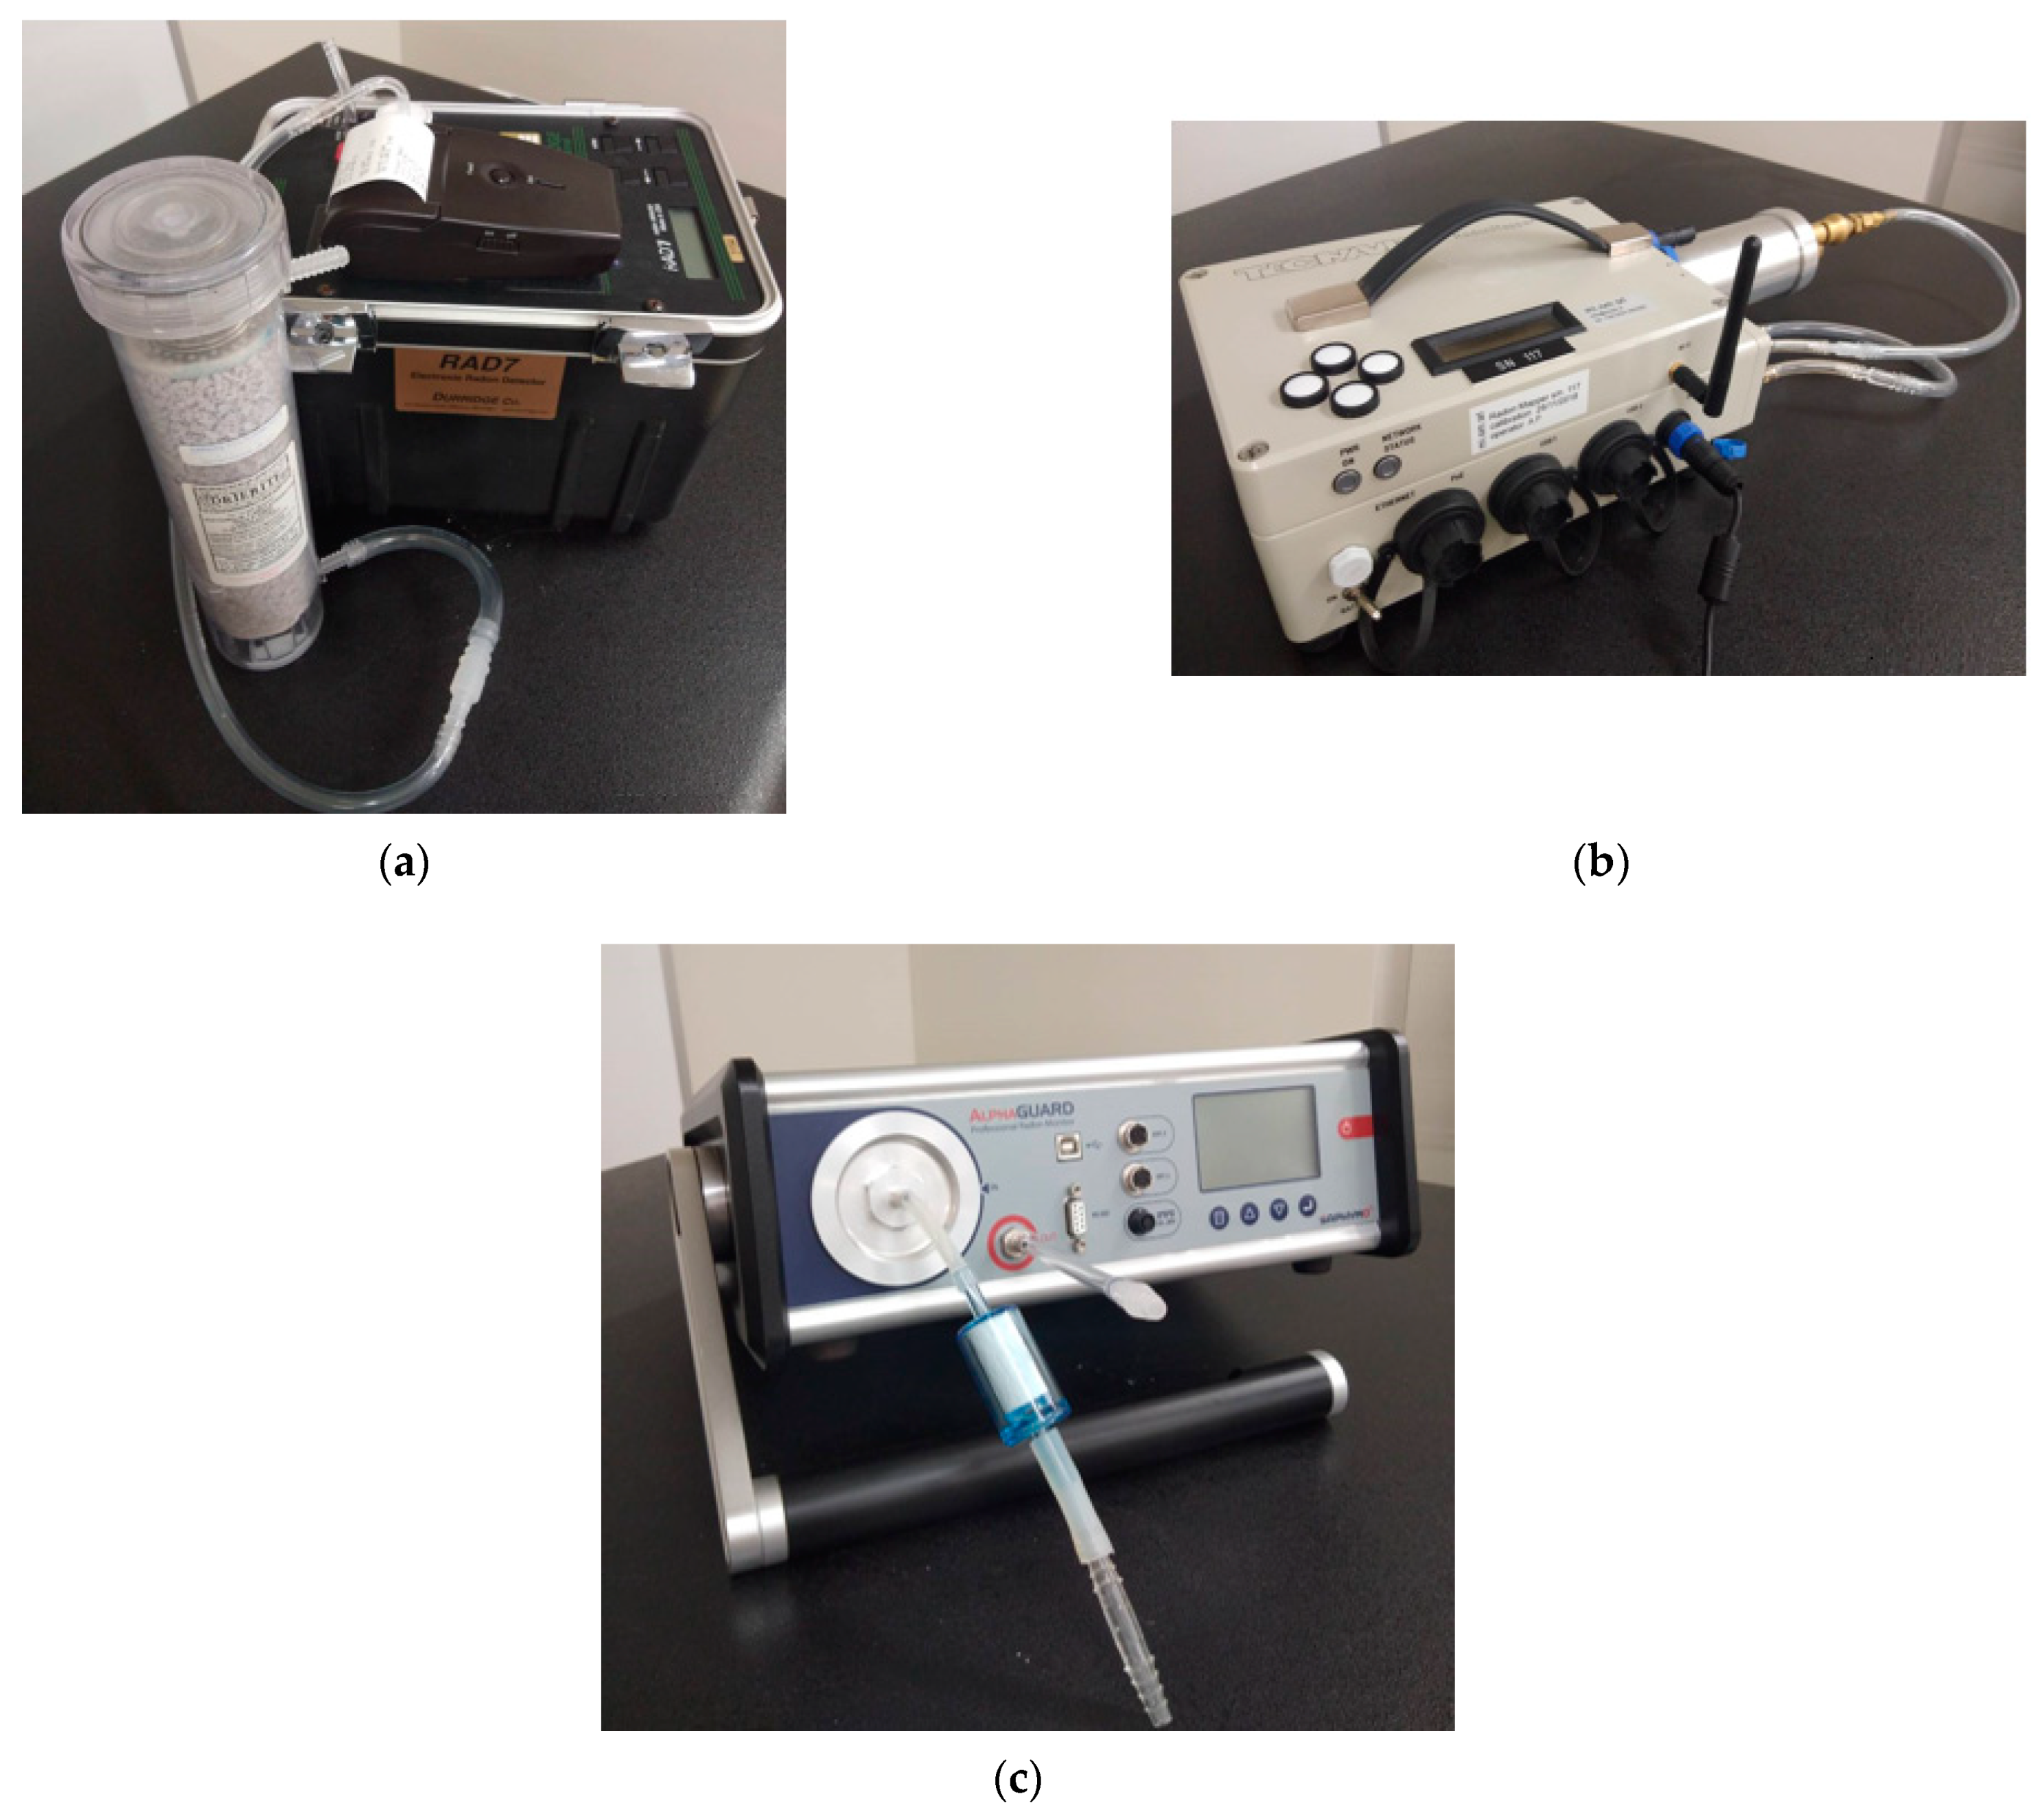
Abstract
:1. Introduction
2. Materials and Methods
2.1. Radon–Thoron Monitors
2.2. Performance Test
3. Results
4. Discussion
5. Conclusions
Author Contributions
Funding
Institutional Review Board Statement
Informed Consent Statement
Data Availability Statement
Conflicts of Interest
References
- National Research Cancer Center Japan. Cancer Registry and Statistics. Cancer Information Service, (Vital Statistics of Japan). Available online: https://ganjoho.jp/data/reg_stat/statistics/dl/cancer_mortality(1958-2019).xls (accessed on 6 June 2021).
- United Nations Scientific Committee on the Effect of Atomic Radiation (UNSCEAR). UNSCEAR 2006 Report to the General Assembly, with Scientific Annexes; United Nations: New York, NY, USA, 2006; Volume II.
- World Health Organization (WHO). WHO Handbook on Indoor Radon—A Public Health Perspective; WHO: Geneva, Switzerland, 2009. [Google Scholar]
- Tokonami, S. Why is 220Rn (thoron) measurement important? Radiat. Prot. Dosim. 2010, 141, 335–359. [Google Scholar] [CrossRef]
- Pereira, C.E.; Vaidyan, V.K.; Chougaonkar, M.P.; Mayya, Y.S.; Sahoo, B.K.; Jojo, P.J. Indoor radon and thoron levels in Neendakara and Chavara regions of southern coastal Kerala, India. Radiat. Prot. Dosim. 2012, 150, 385–390. [Google Scholar] [CrossRef]
- Kudo, H.; Tokonami, S.; Omori, Y.; Ishikawa, T.; Iwaoka, K.; Sahoo, S.K.; Akata, N.; Hosoda, M.; Wanabongse, P.; Pornnumpa, C.; et al. Comparative dosimetry for radon and thoron in high background radiation areas in China. Radiat. Prot. Dosim. 2015, 167, 155–159. [Google Scholar] [CrossRef]
- Omori, Y.; Prasad, G.; Sorimachi, A.; Sahoo, S.K.; Ishikawa, T.; Sagar, D.V.; Ramola, R.C.; Tokonami, S. Long-term measurements of residential radon, thoron, and throon progeny concentrations around the Chhatrapur placer deposit, a high background radiation area in Odisha, India. J. Environ. Radioact. 2016, 162–163, 371–378. [Google Scholar] [CrossRef]
- Omori, Y.; Tokonami, S.; Sahoo, S.K.; Ishikawa, T.; Sorimachi, A.; Hosoda, M.; Kudo, H.; Pornnumpa, C.; Nair, R.R.; Jayalekshmi, P.A.; et al. Radiation dose due to radon and thoron progeny inhalation in high-level natural radiation areas of Kerala, India. J. Radiol. Prot. 2017, 37, 111. [Google Scholar] [CrossRef]
- Hosoda, M.; Kudo, H.; Iwaoka, K.; Yamada, R.; Suzuki, T.; Tamakuma, Y.; Tokonami, S. Characteristics of thoron (220Rn) in environment. Appl. Radiat. Isot. 2017, 120, 7–10. [Google Scholar] [CrossRef]
- Omori, Y.; Hosoda, M.; Takahashi, F.; Sanada, T.; Hirao, S.; Ono, K.; Furukawa, M. Japanese population dose from natural radiation. J. Radiol. Prot. 2021, 40, 99–140. [Google Scholar] [CrossRef]
- Tokonami, S. Characteristics of thoron (220Rn) and its progeny in the indoor environment. Int. J. Environ. Res. Public Health 2021, 17, 8769. [Google Scholar] [CrossRef]
- Kochowska, E.; Kozak, K.; Kozlowska, B.; Mazur, J.; Dorda, J. Test measurements of thoron concentration using two ionization AlphaGUARD vs. radon monitor RAD7. Nukleonika 2009, 54, 189–192. [Google Scholar]
- Yasuoka, Y.; Sorimachi, A.; Ishikawa, T.; Hosoda, M.; Tokonami, S.; Fukuhori, N.; Janik, M. Separately measuring radon and thoron concentrations exhaled from soil using AlphaGUARD and liquid scintillation counter methods. Radiat. Prot. Dosim. 2010, 141, 412–415. [Google Scholar] [CrossRef]
- Iwaoka, K.; Negami, R.; Tamakuma, Y.; Hosoda, M.; Palad, L.J.H.; Tokonami, S.; Feliciano, C.P.; Kanda, R. Evaluation of the influence of thoron on portable radon measurement devices. Philipp. J. Sci. 2021, 150, 257–261. [Google Scholar]
- Sorimachi, A.; Ishikawa, T.; Janik, M.; Tokonami, S. Quality assurance and quality control for thoron measurement at NIRS. Radiat. Prot. Dosim. 2010, 141, 367–370. [Google Scholar] [CrossRef]
- Csige, I.; Szabó, Z.; Szabó, C. Experimental technique to measure thoron generation rate of building material samples using RAD7 detector. Radiat. Meas. 2013, 59, 201–204. [Google Scholar] [CrossRef] [Green Version]
- Sumesh, A.; Kumar, A.V.; Tripathi, R.M.; Nair, R.N.; Puranik, V.D. Impact of flow rate sensitivity of semiconductor type thoron monitor. Radiat. Meas. 2013, 59, 241–244. [Google Scholar] [CrossRef]
- Durridge Inc. RAD7 Radon Detector. Available online: https://durridge.com/products/rad7-radon-detector/ (accessed on 9 June 2021).
- Mi.am Srl. Radon Mapper. Available online: https://miam.it/en/radon-mapper/ (accessed on 9 June 2021).
- Bertin Technologies SAS. AlphaGUARD—Radon Monitor. Available online: https://www.bertin-instruments.com/product/radon-professional-monitoring/radon-alphaguard/ (accessed on 9 June 2021).
- Durridge Inc. RAD7 RADON DETECTOR User Manual; DURRIDGE Company Inc.: Boston, MA, USA, 2012. [Google Scholar]
- Sakoda, A.; Meisenberg, O.; Tschiersch, J. Behavior of radon progeny produced in a scintillation cell in the flow-through condition. Radiat. Meas. 2015, 77, 41–45. [Google Scholar] [CrossRef]
- Pornnumpa, C.; Oyama, Y.; Iwaoka, K.; Hosoda, M.; Tokonami, S. Development of radon and thoron exposure systems at Hirosaki University. Radiat. Environ. Med. 2018, 7, 13–20. [Google Scholar]
- Sorimachi, A.; Sahoo, S.K.; Tokonami, S. Generation and control of thoron emanated from lantern mantles. Rev. Sci. Instrum. 2009, 80, 015104. [Google Scholar] [CrossRef] [PubMed]
- Tokonami, S.; Yang, M.; Yonehara, H.; Yamada, Y. Simple, discriminative measurement technique for radon and thoron concentrations with a single scintillation cell. Rev. Sci. Instrum. 2002, 73, 69. [Google Scholar] [CrossRef]
- Machaj, B.; Urbanski, P.; Bartak, J. Measurement of radon (222Rn) and thoron (220Rn) concentration with a single scintillation cell. Nukleonika 2007, 52, 167–171. [Google Scholar]
- Thomas, J.W. Modification of the Tsivoglou method for radon daughters in air. Health Phys. 1970, 19, 691. [Google Scholar] [PubMed]
- Cliff, D.K. The measurement of low concentrations of radon-222 daughters in air, with emphasis on RaA assessment. Phys. Med. Biol. 1978, 23, 55–65. [Google Scholar] [CrossRef]
- Busigin, A.; Phillips, C.R. Uncertainties in the measurement of airborne radon daughters. Health Phys. 1980, 39, 943–955. [Google Scholar] [CrossRef]
- Scott, A.G. A field method for measurement of radon daughters in air. Health Phys. 1981, 41, 403–405. [Google Scholar]
- Wang, Y.; Sun, C.; Zhang, L.; Guo, Q. Optimized method for individual radon progeny measurement based on alpha spectrometry following the Wicke method. Radiat. Meas. 2021, 142, 106558. [Google Scholar] [CrossRef]
- Hosoda, M.; Ishikawa, T.; Sorimachi, A.; Tokonami, S.; Uchida, S. Development and application of a continuous measurement system for radon exhalation rate. Rev. Sci. Instrum. 2011, 82, 015101. [Google Scholar] [CrossRef]


Publisher’s Note: MDPI stays neutral with regard to jurisdictional claims in published maps and institutional affiliations. |
© 2021 by the authors. Licensee MDPI, Basel, Switzerland. This article is an open access article distributed under the terms and conditions of the Creative Commons Attribution (CC BY) license (https://creativecommons.org/licenses/by/4.0/).
Share and Cite
Tamakuma, Y.; Kranrod, C.; Jin, Y.; Kobayashi, H.; Nugraha, E.D.; Sanpei, A.; Kiso, M.; Hashimoto, H.; Negami, R.; Hosoda, M.; et al. Characterization of Commercially Available Active-Type Radon–Thoron Monitors at Different Sampling Flow Rates. Atmosphere 2021, 12, 971. https://doi.org/10.3390/atmos12080971
Tamakuma Y, Kranrod C, Jin Y, Kobayashi H, Nugraha ED, Sanpei A, Kiso M, Hashimoto H, Negami R, Hosoda M, et al. Characterization of Commercially Available Active-Type Radon–Thoron Monitors at Different Sampling Flow Rates. Atmosphere. 2021; 12(8):971. https://doi.org/10.3390/atmos12080971
Chicago/Turabian StyleTamakuma, Yuki, Chutima Kranrod, Yuto Jin, Hiromu Kobayashi, Eka Djatnika Nugraha, Aoi Sanpei, Mizuki Kiso, Hiroki Hashimoto, Ryoju Negami, Masahiro Hosoda, and et al. 2021. "Characterization of Commercially Available Active-Type Radon–Thoron Monitors at Different Sampling Flow Rates" Atmosphere 12, no. 8: 971. https://doi.org/10.3390/atmos12080971