
Climate Influence in Dendrochronological Series of Araucaria angustifolia from Campos do Jordão, Brazil

 , , and
Abstract
:1. Introduction
2. Materials and Methods
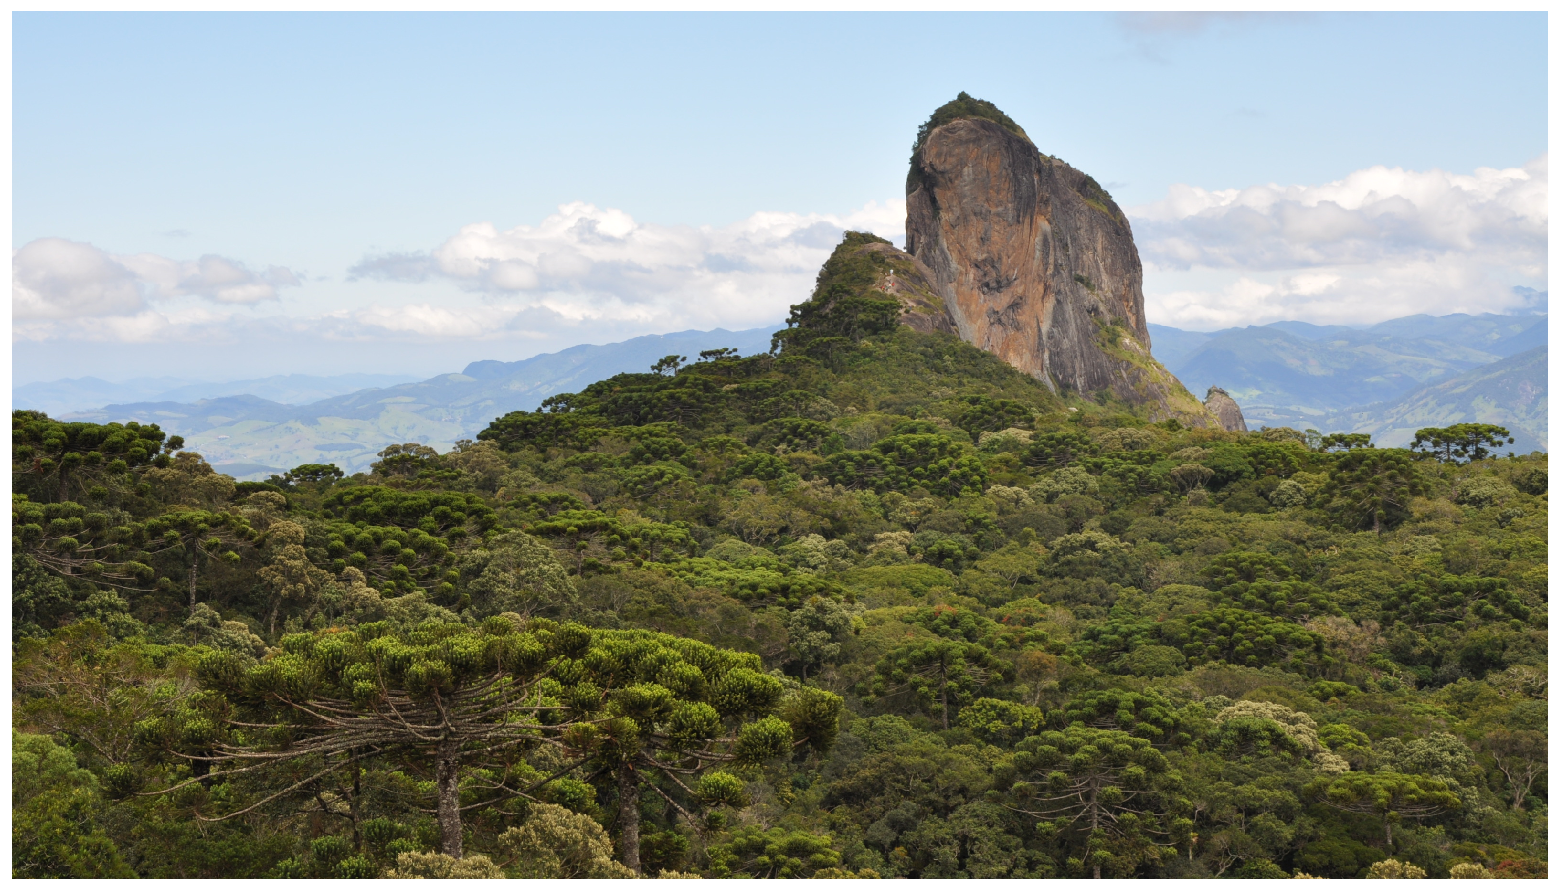
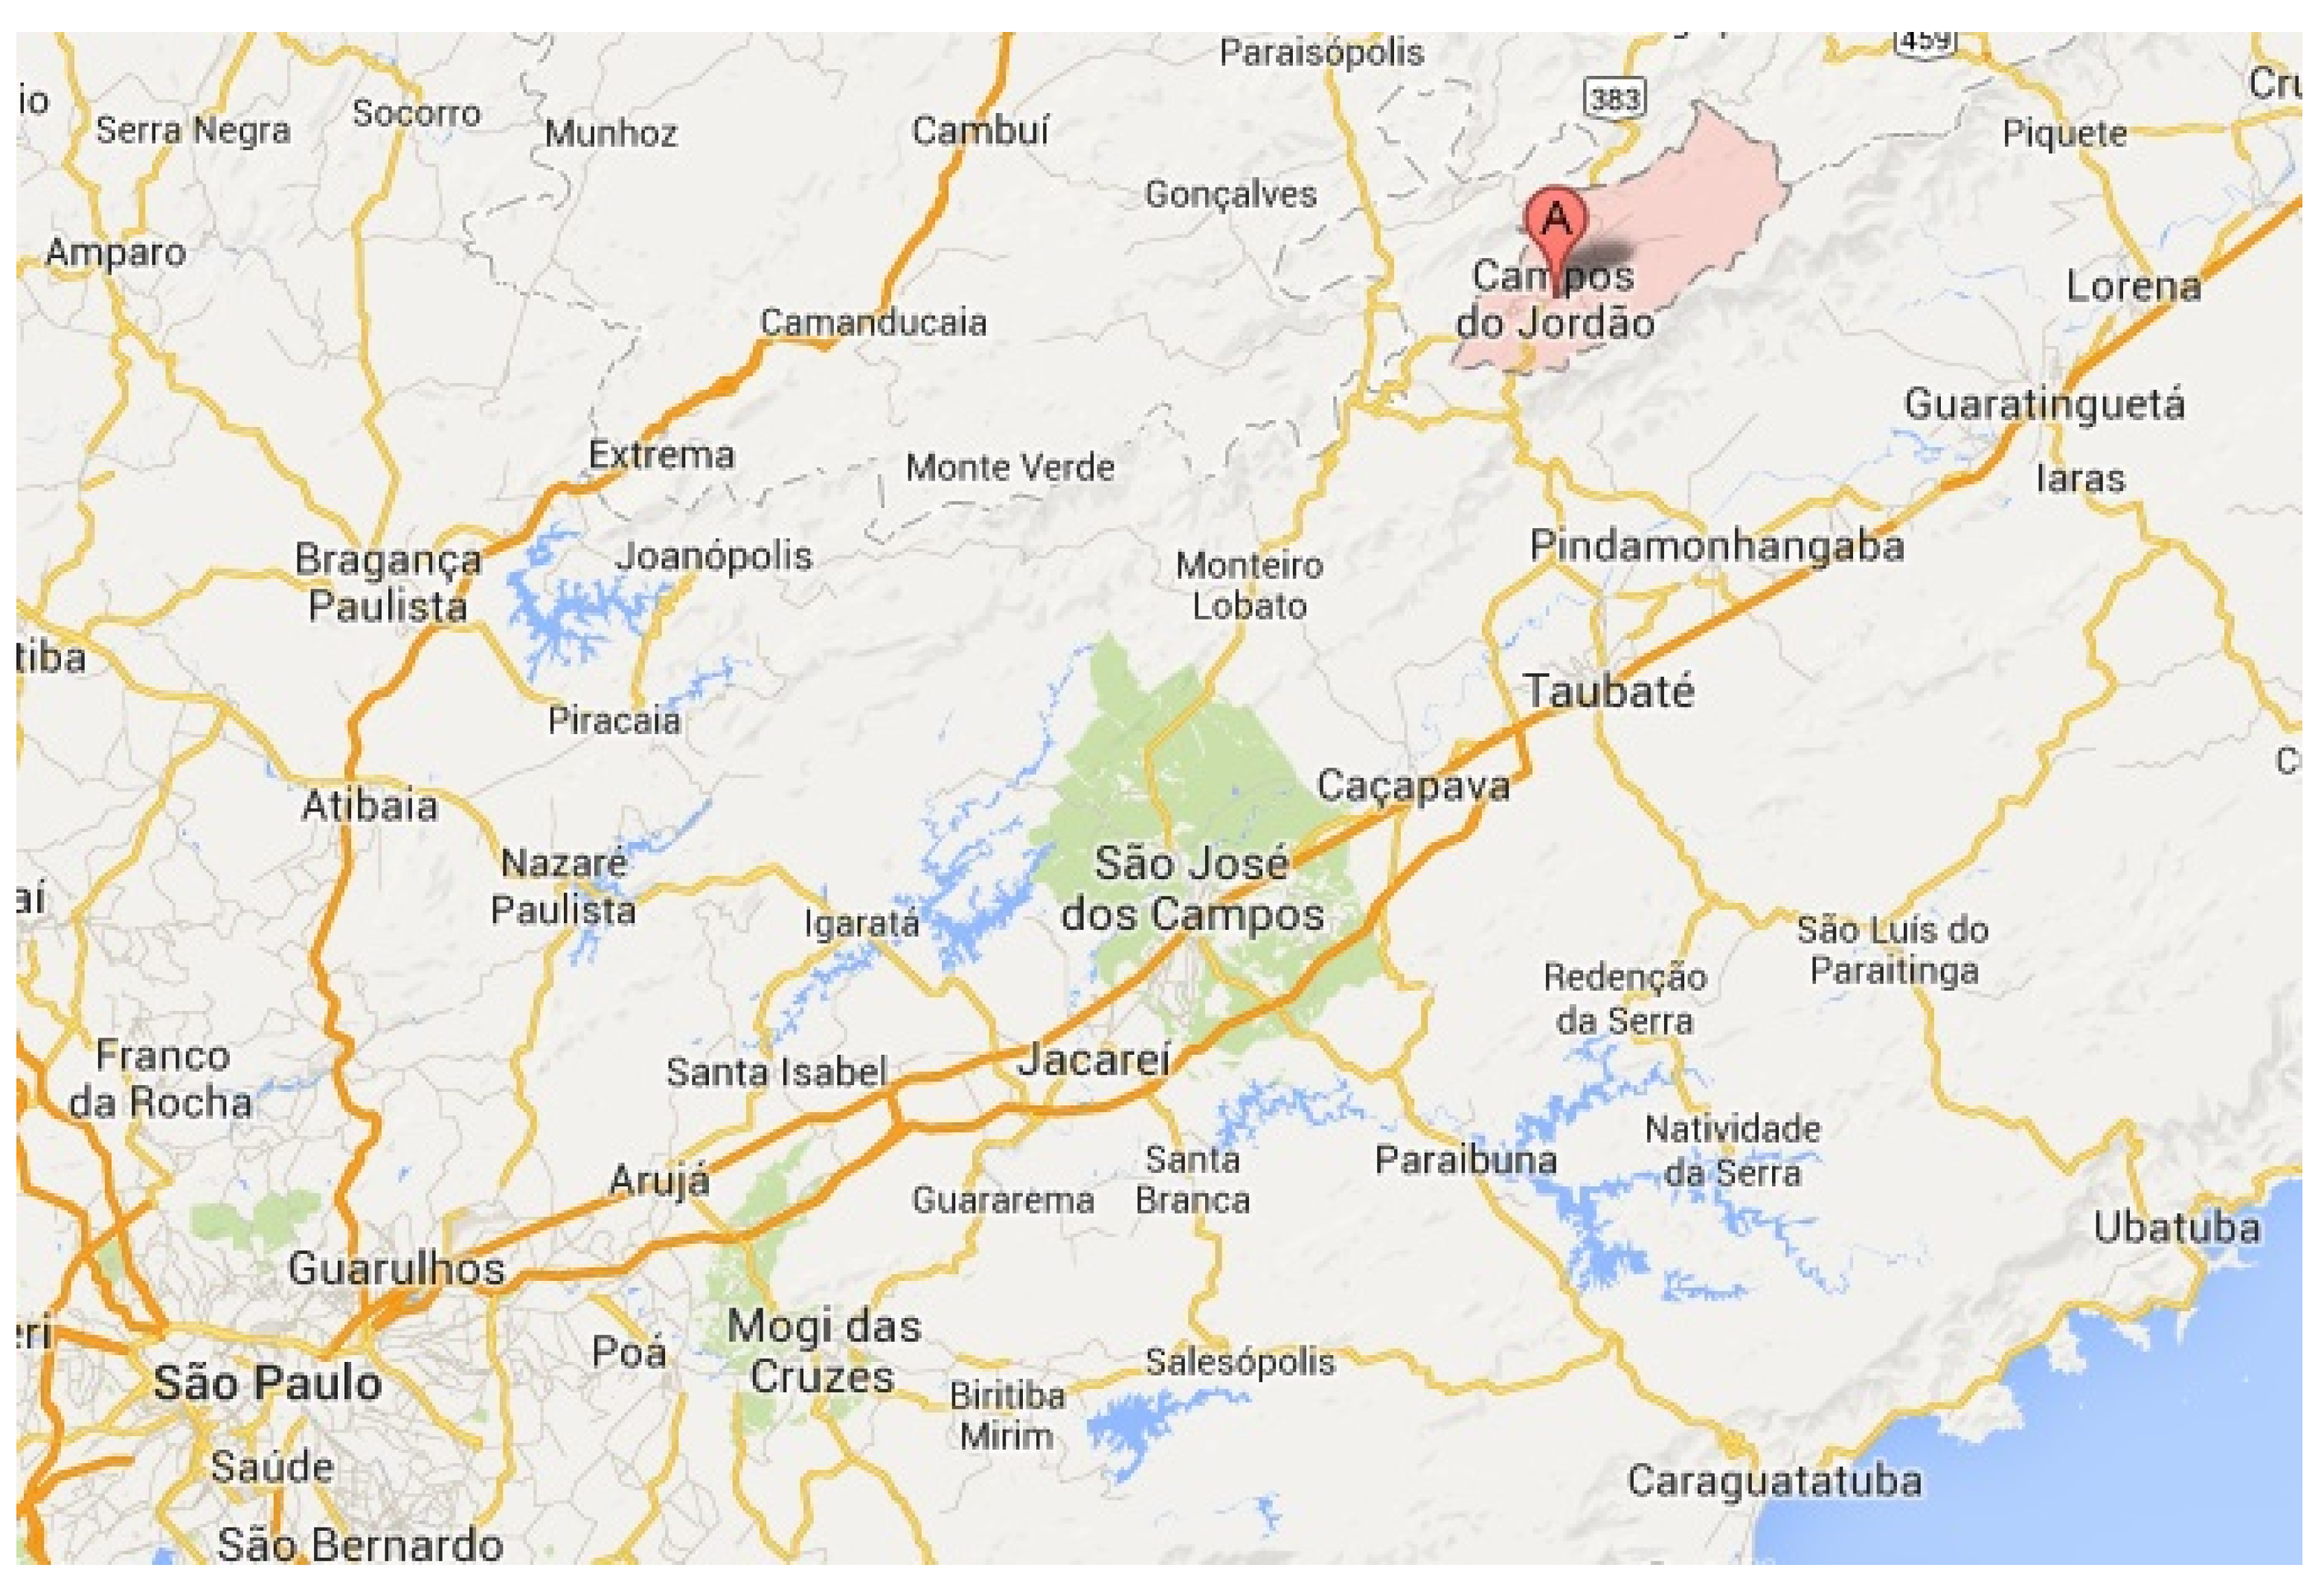
2.1. Study Area and Species
2.2. Samples Collection and Preparation
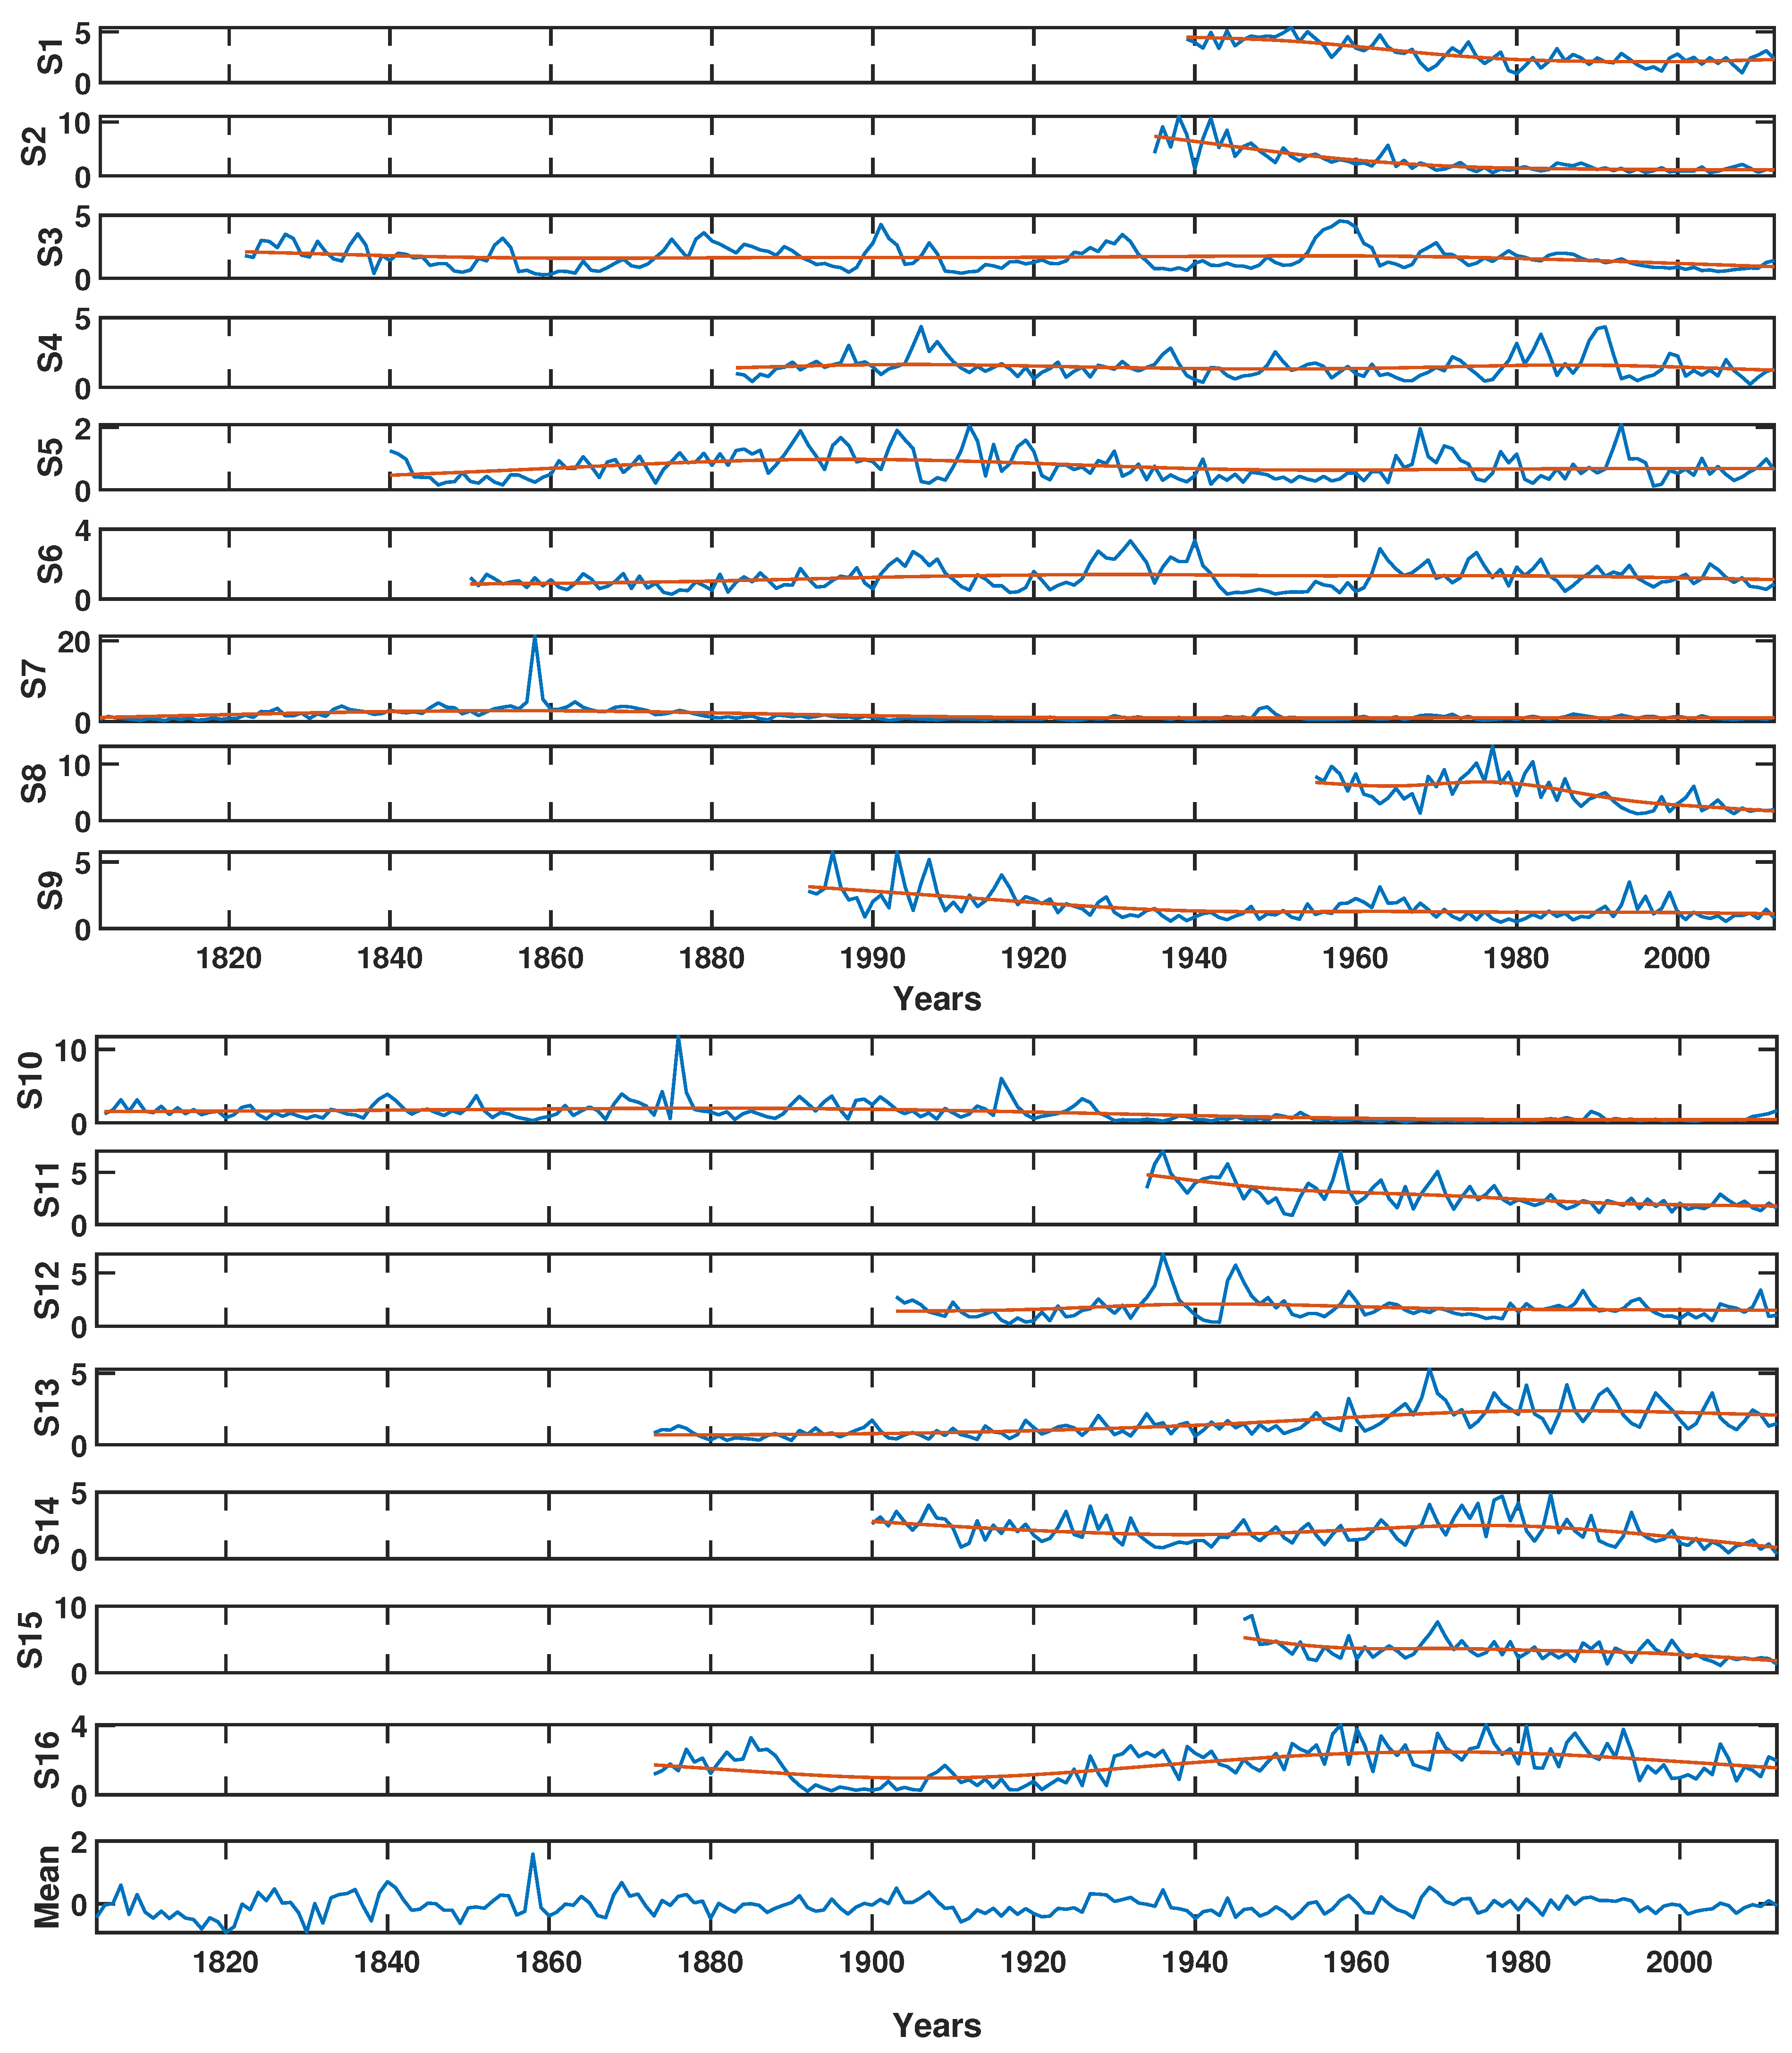
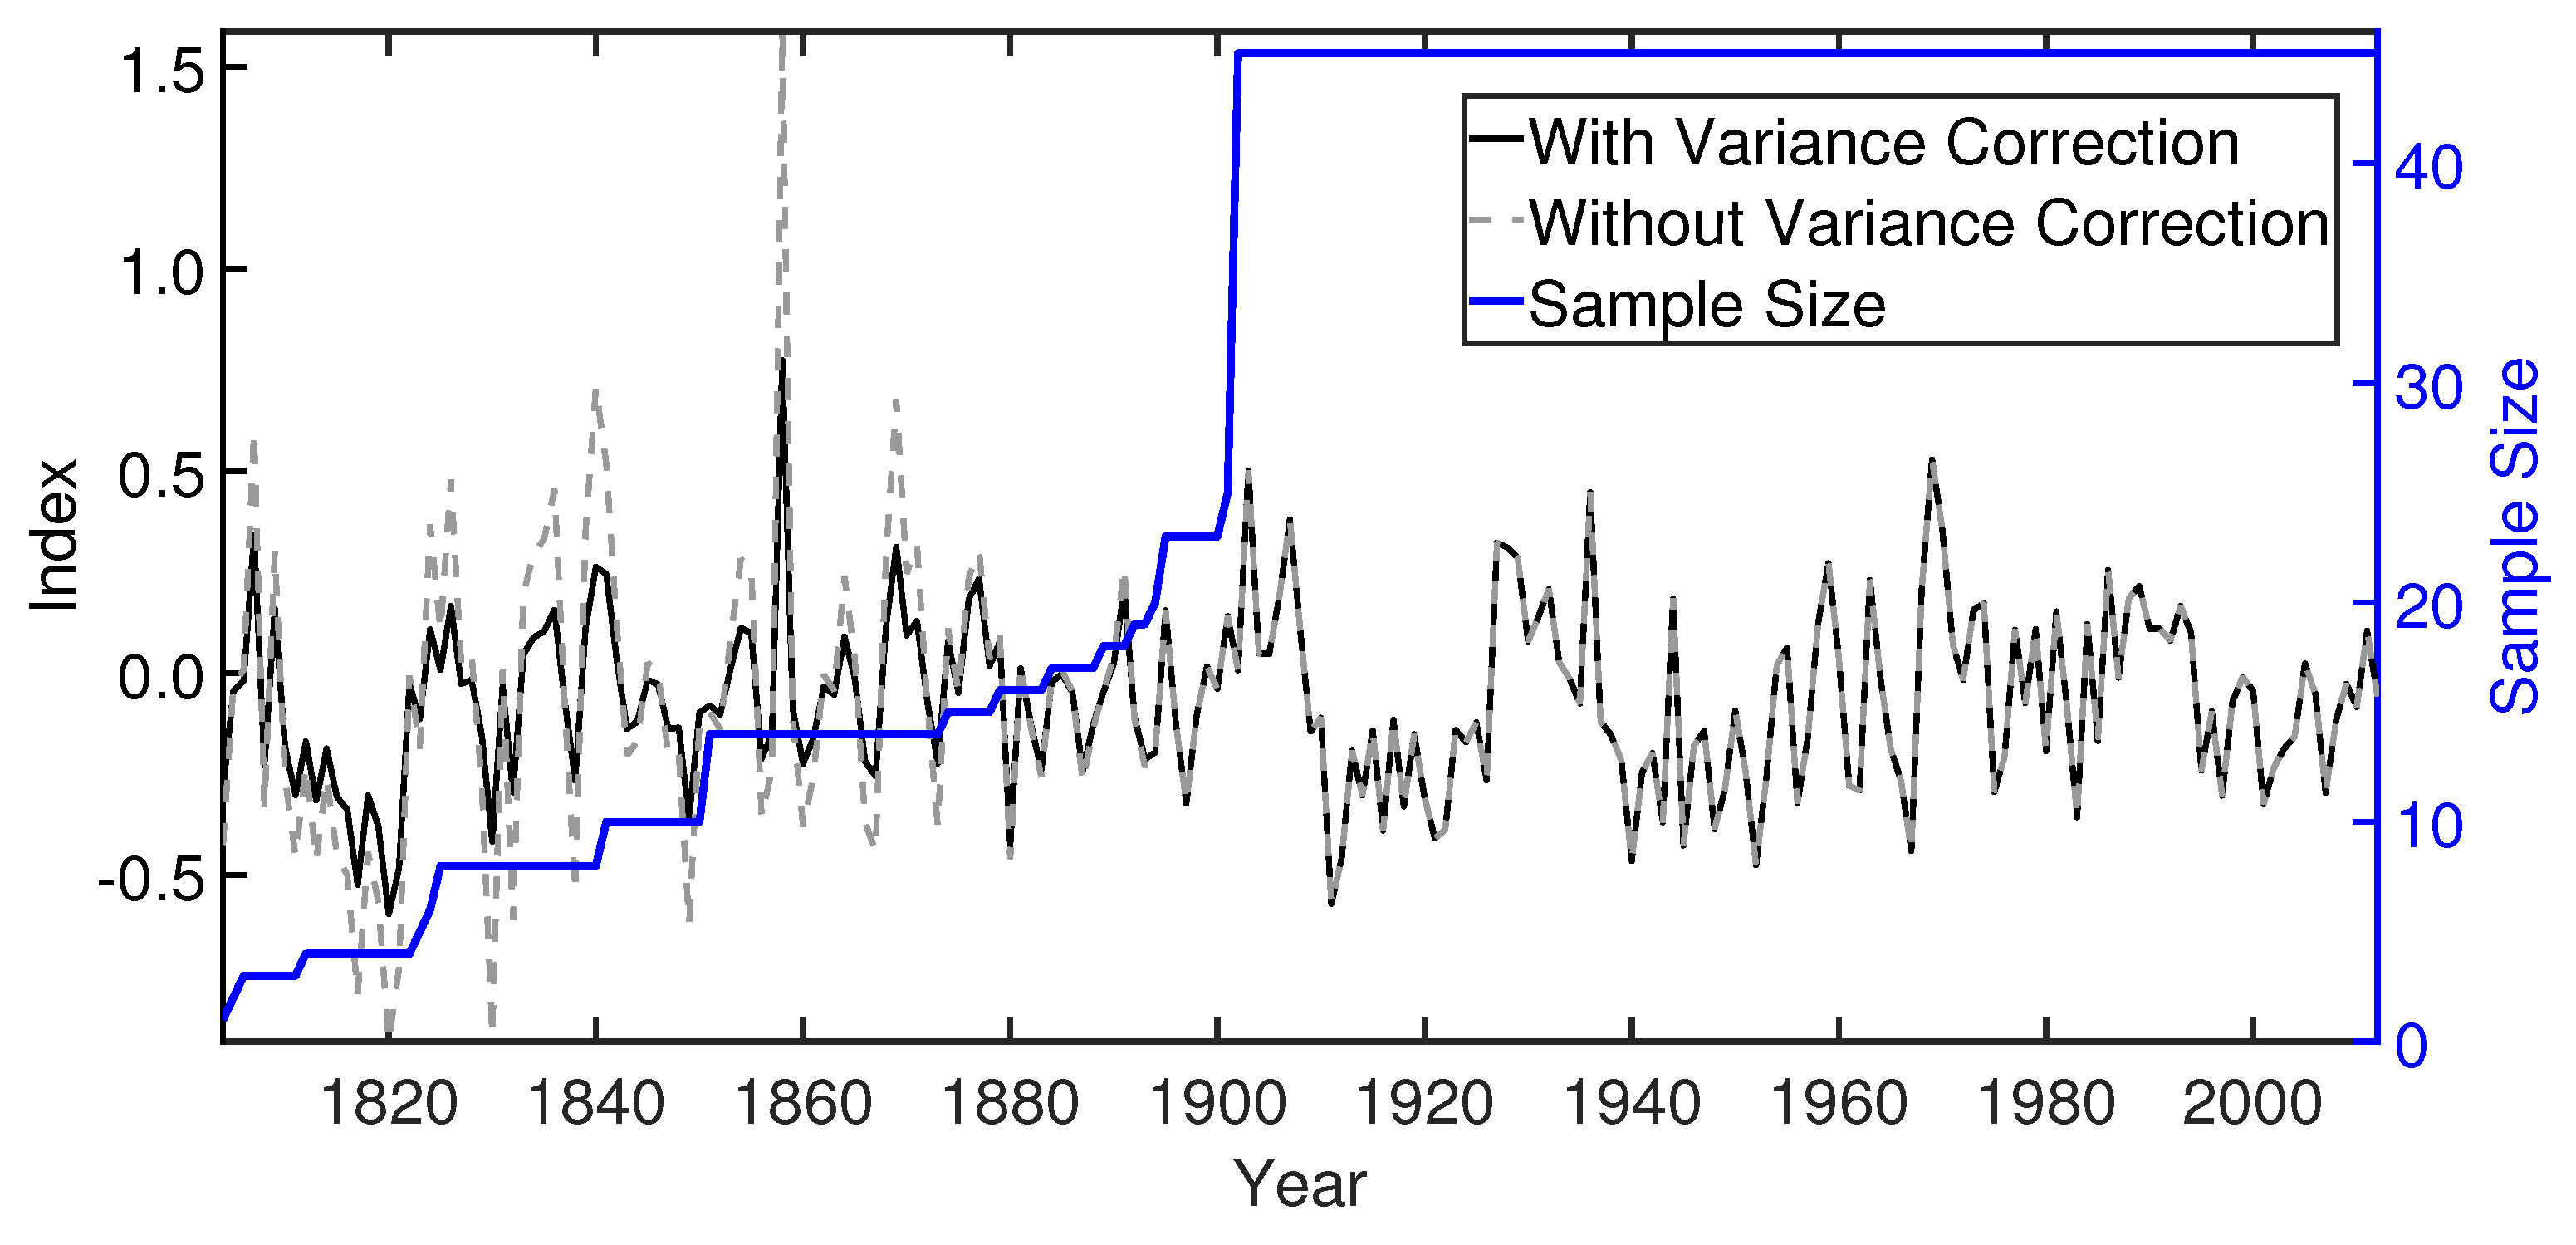
2.3. The Chronologies
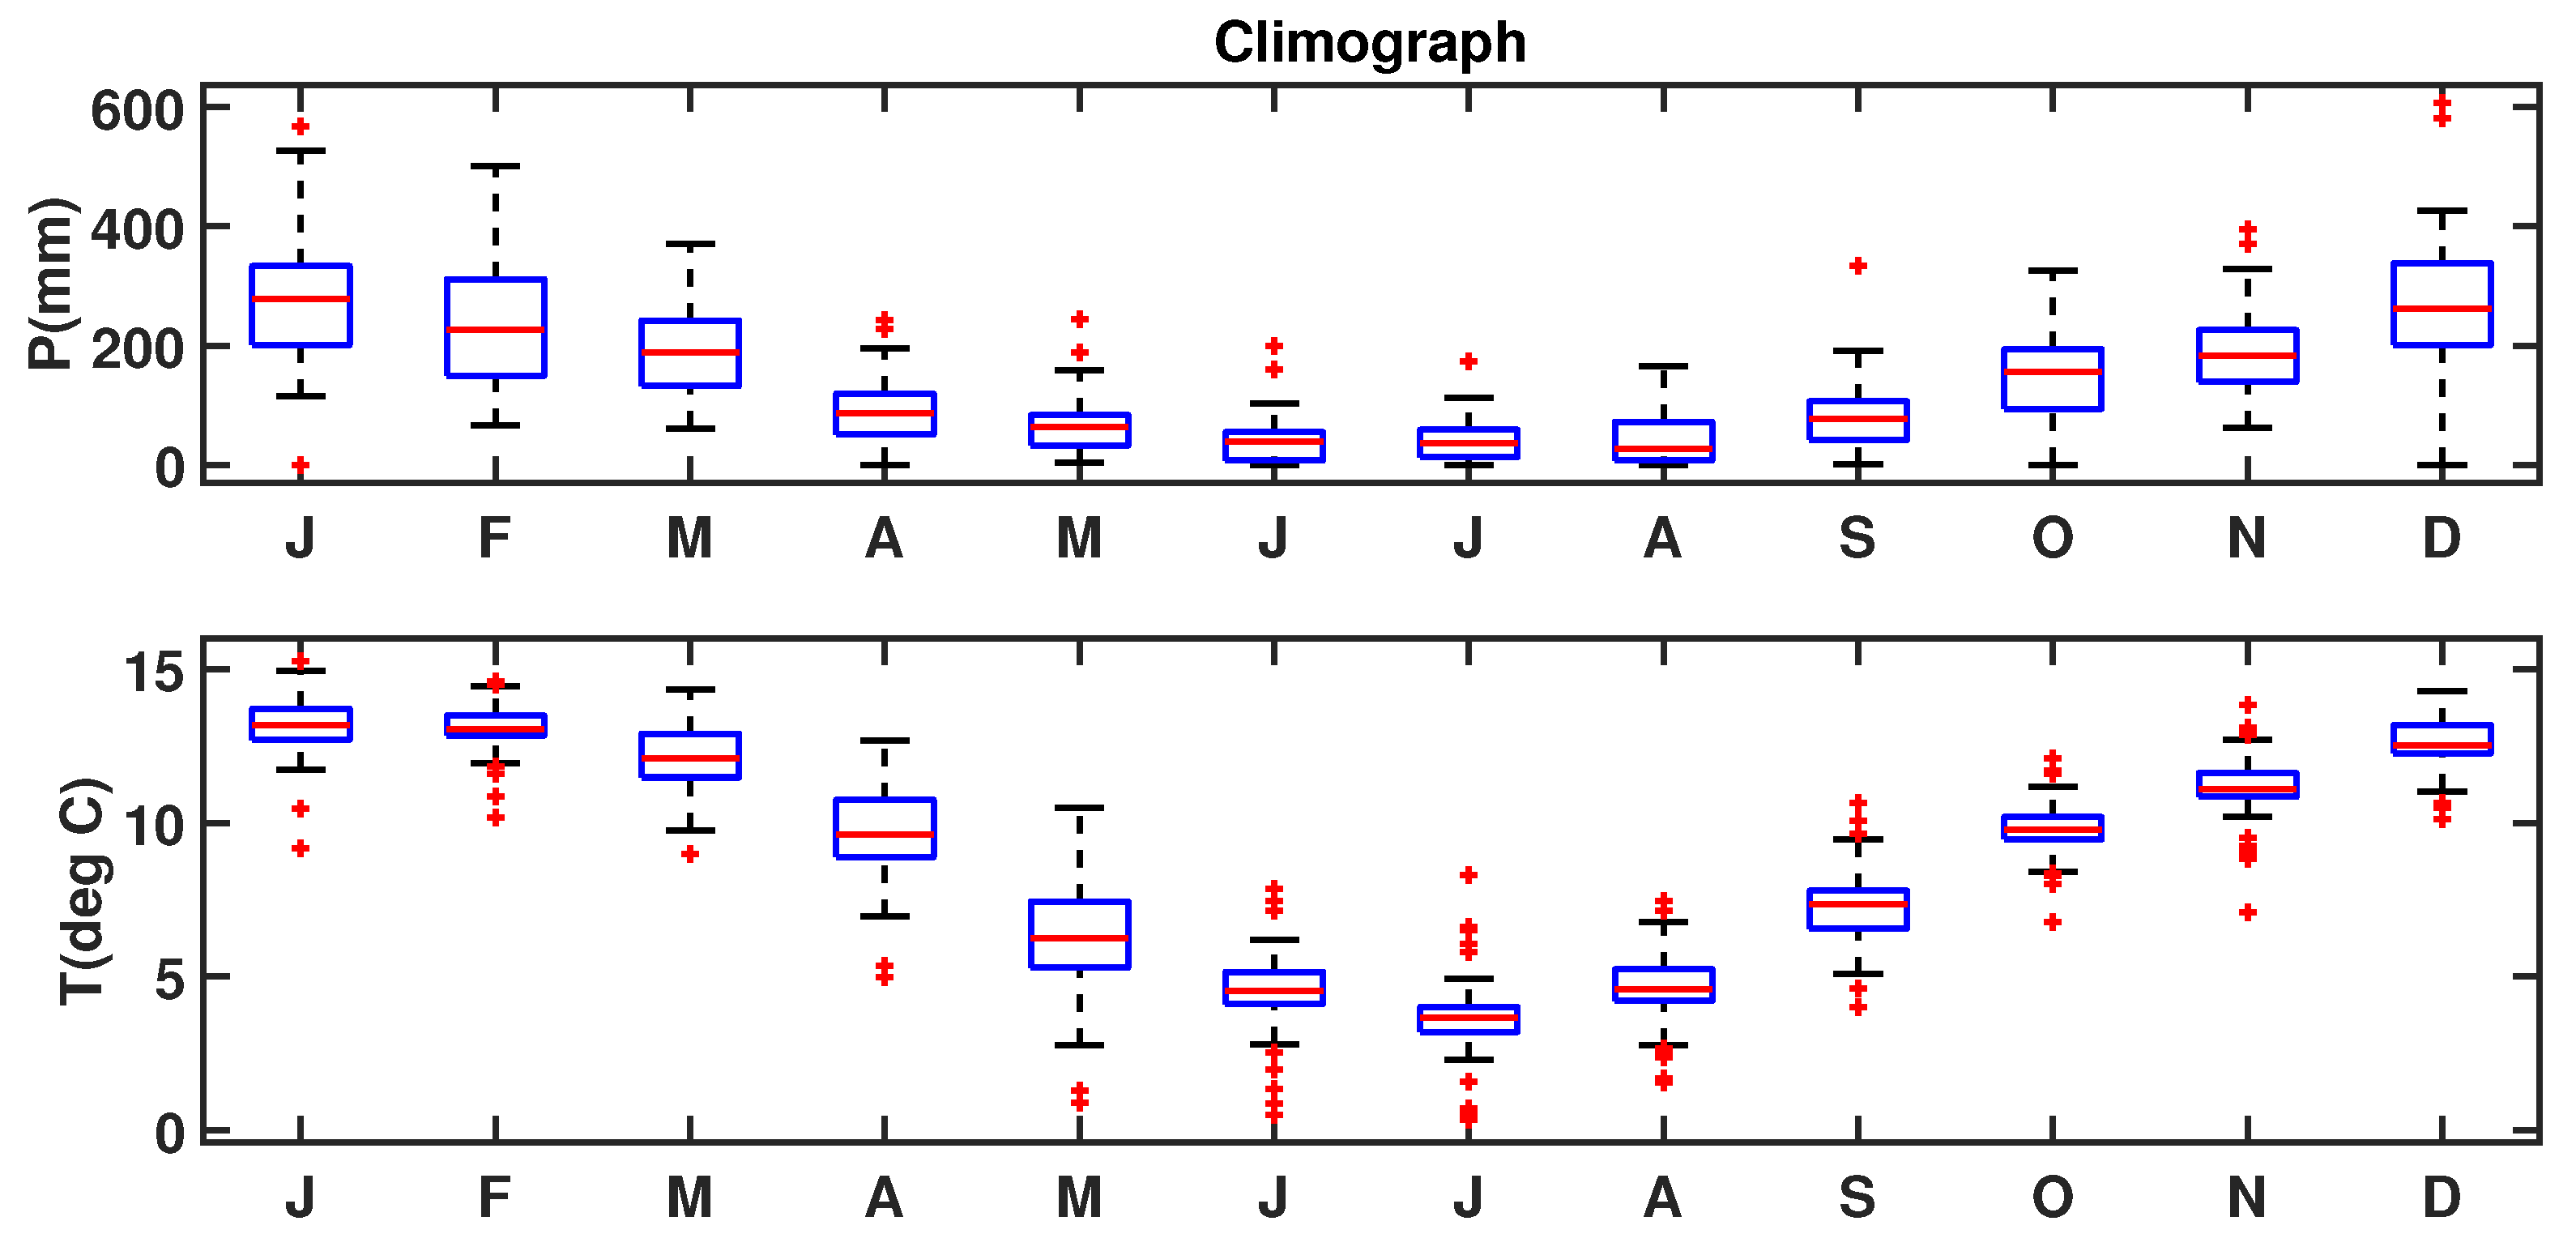
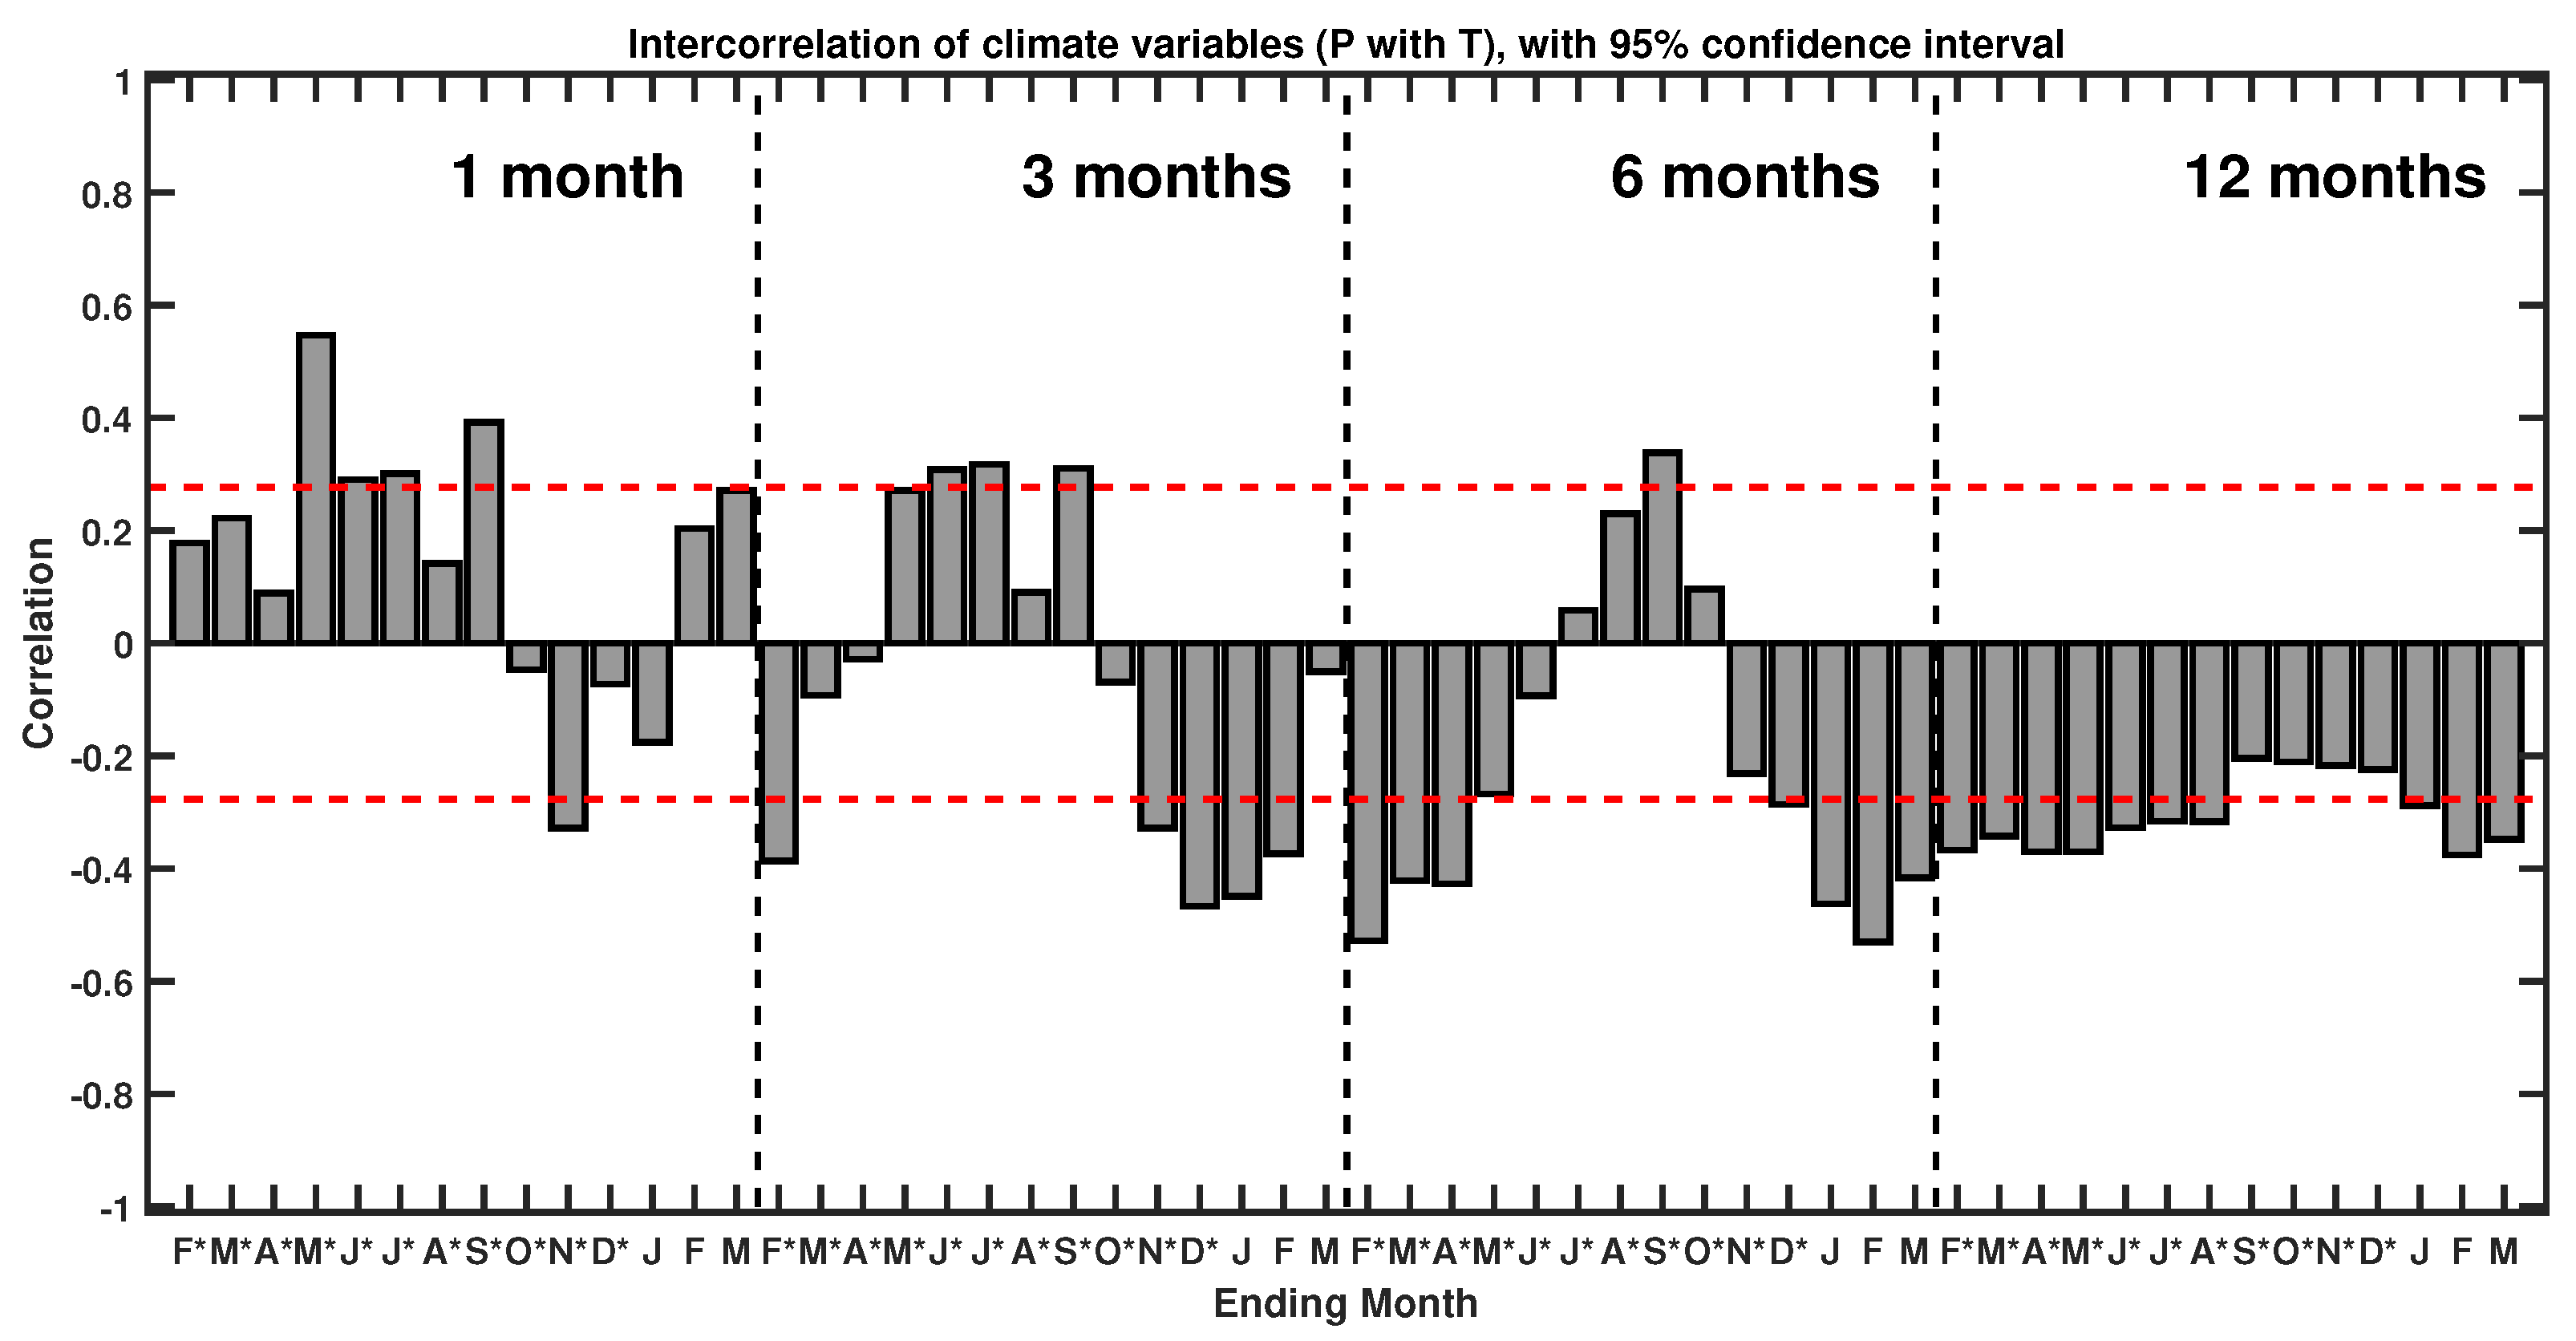
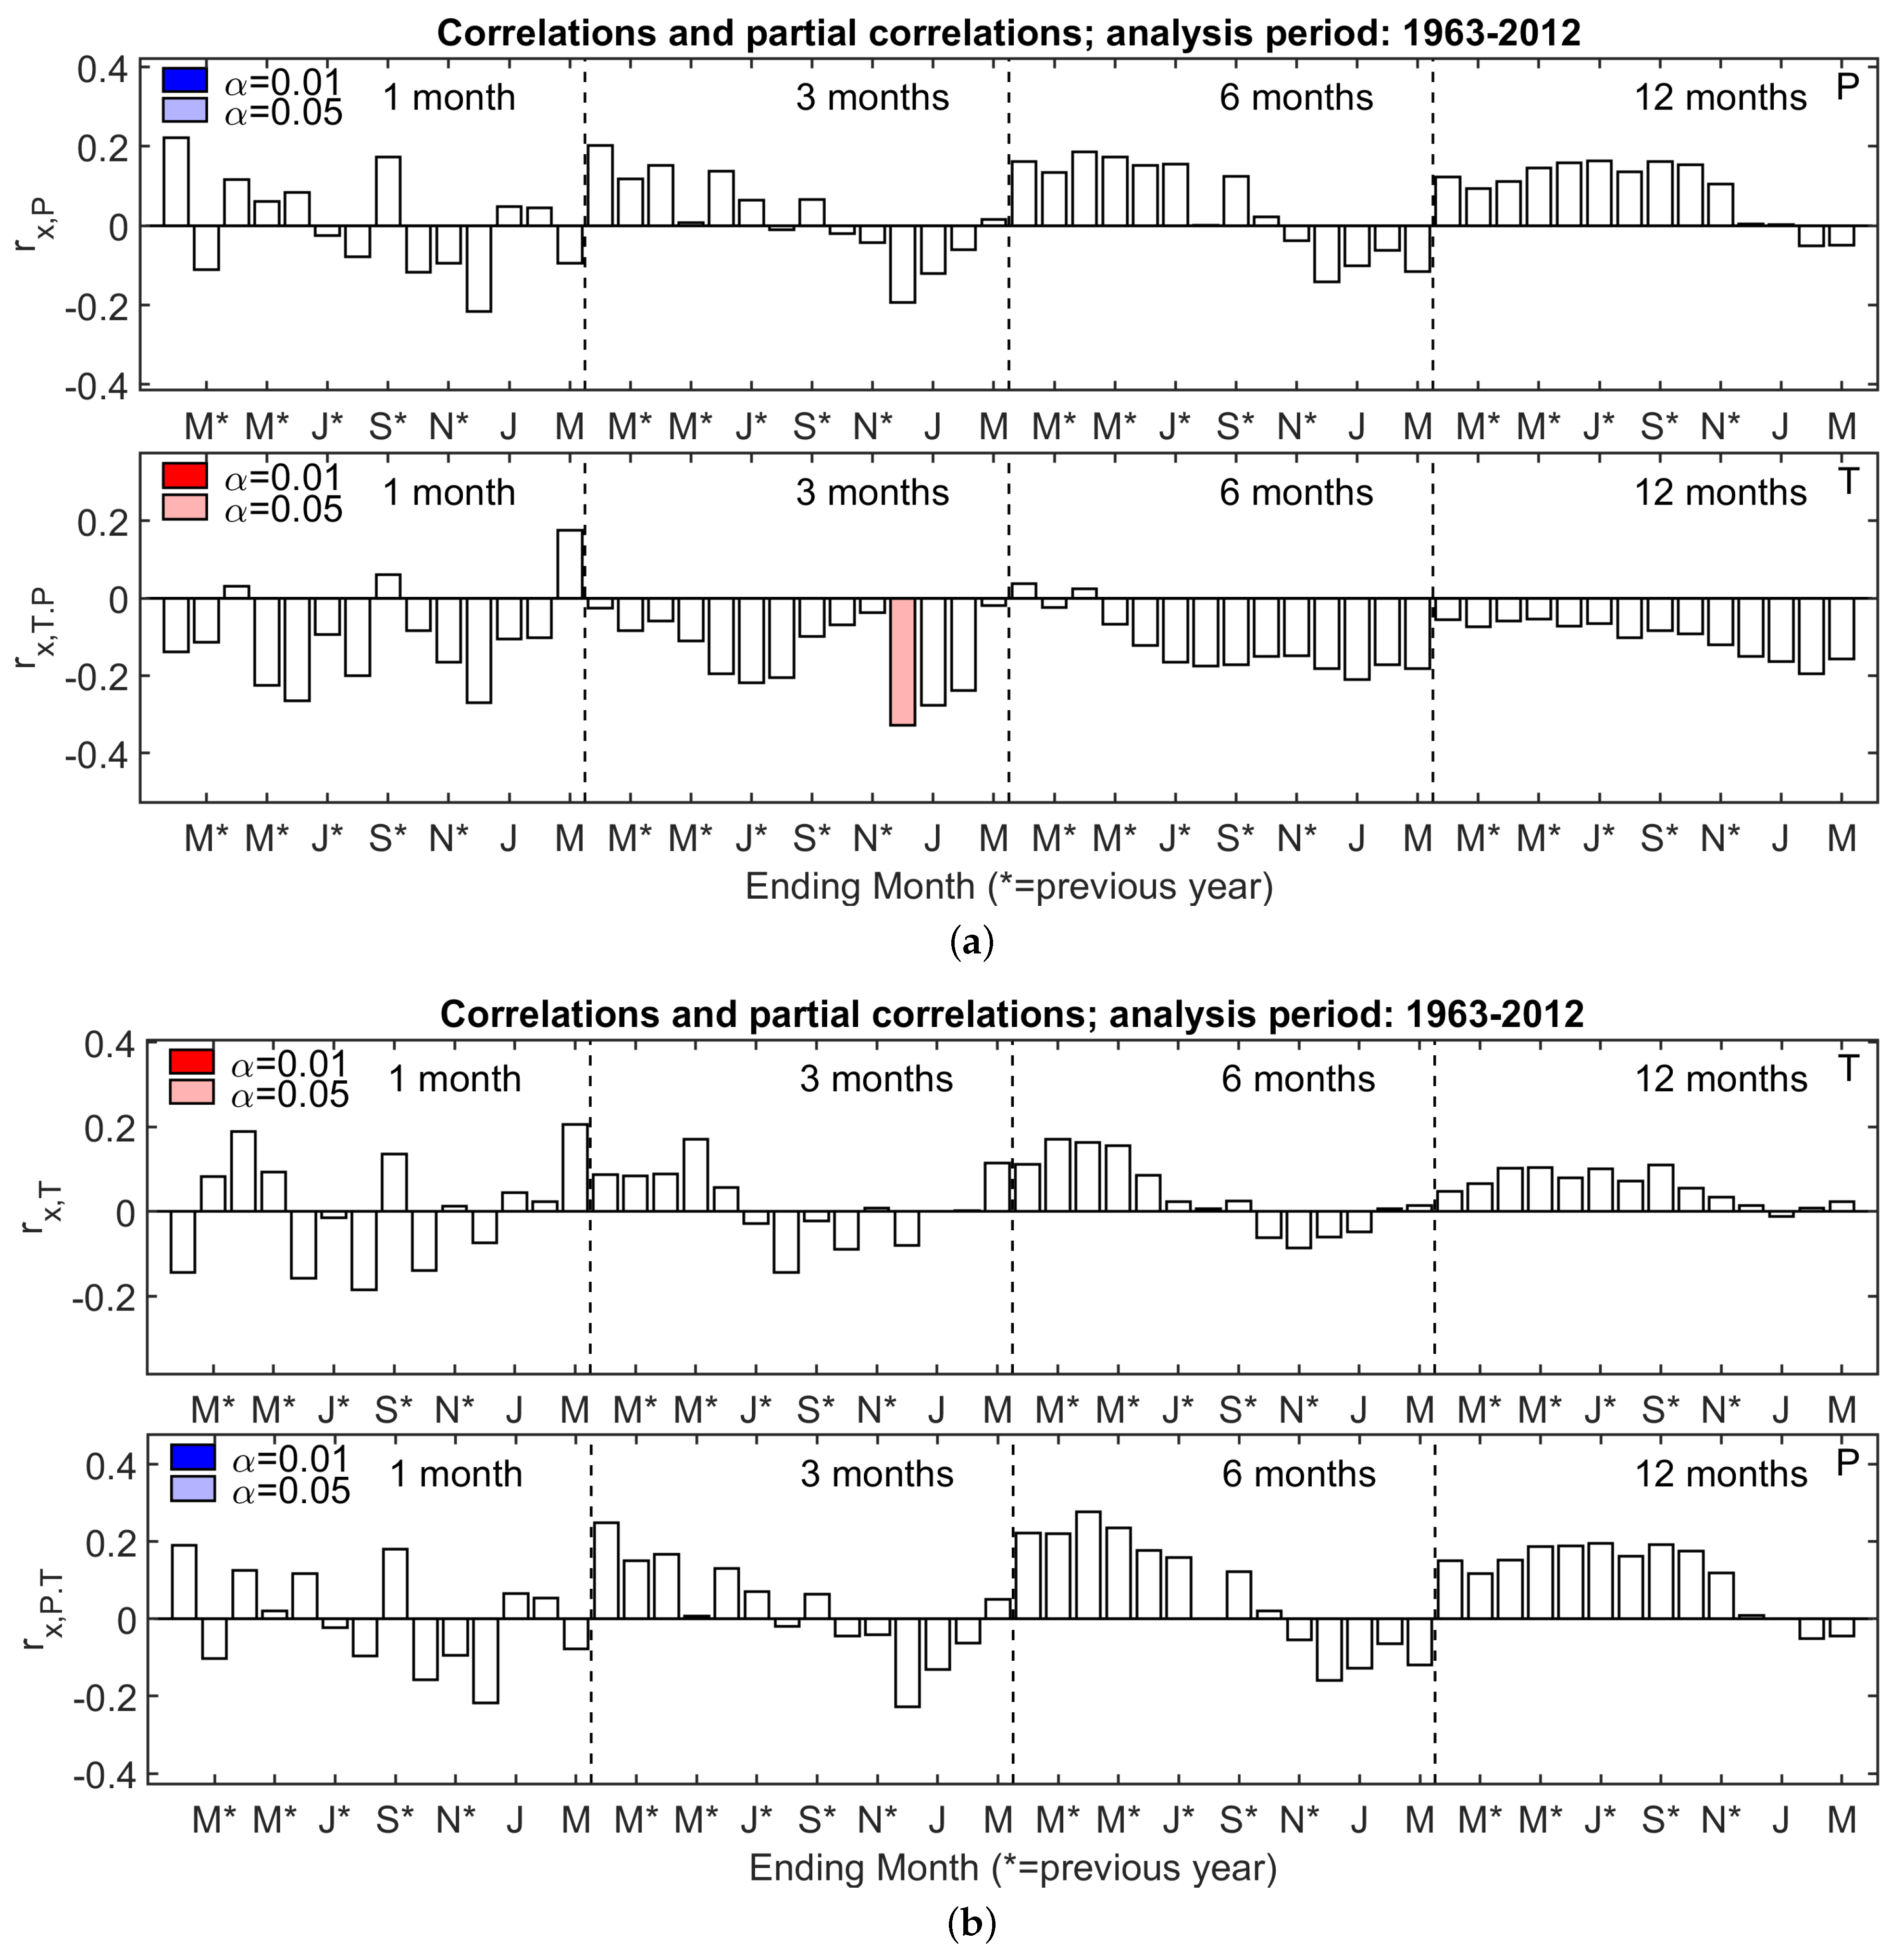
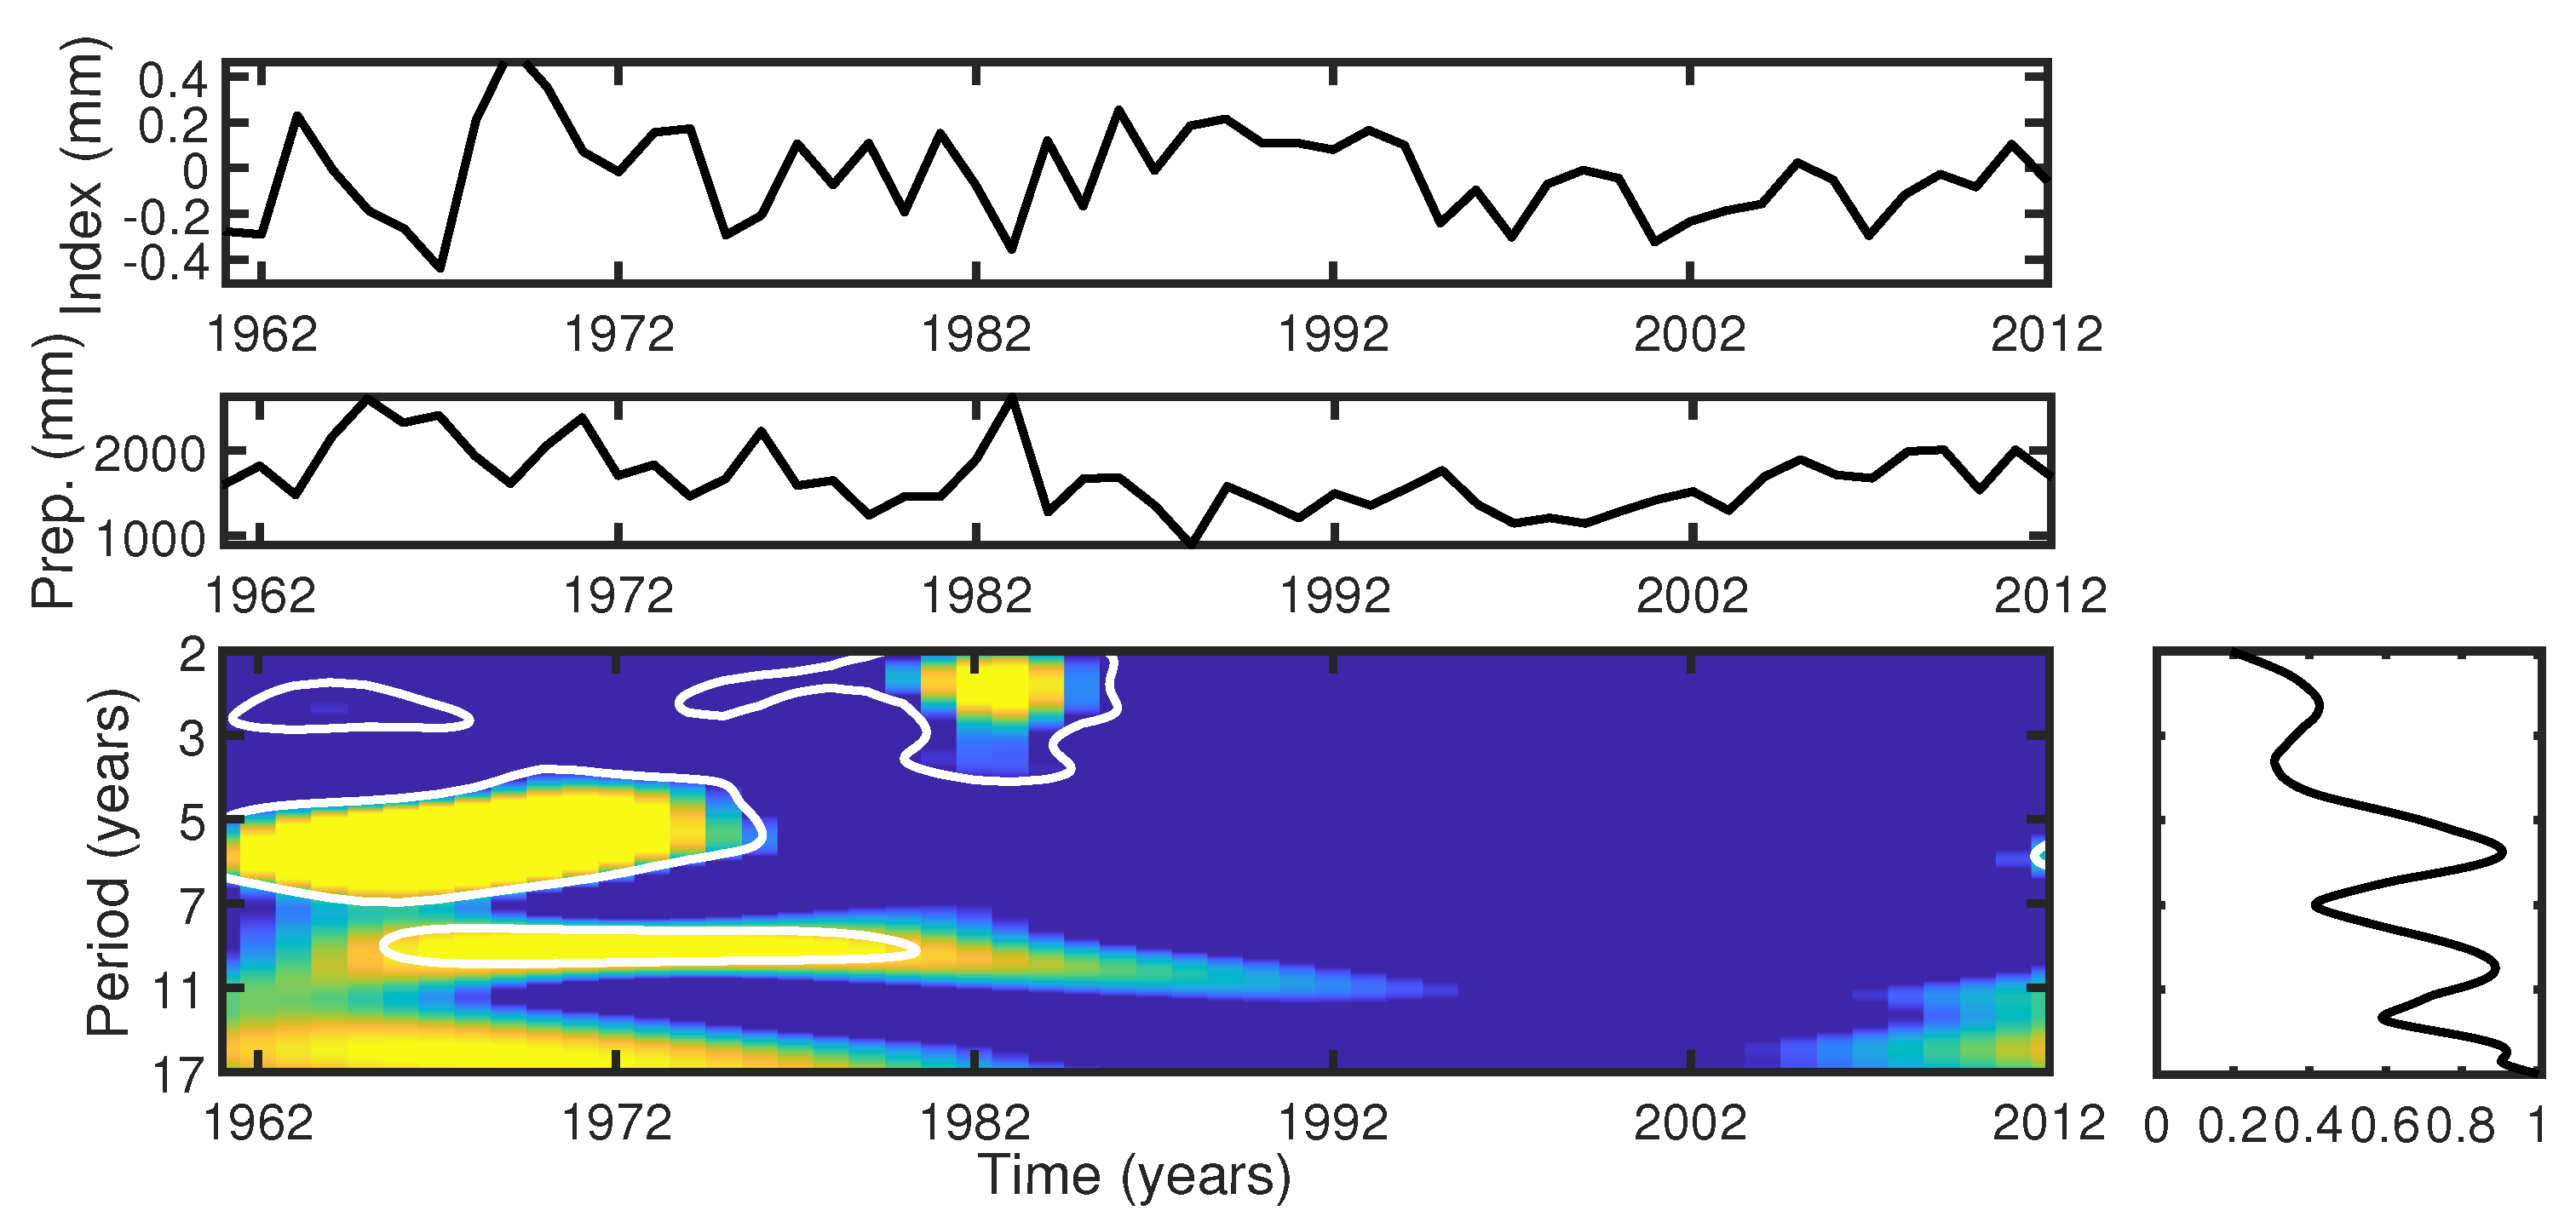
2.4. Climatic Data and Analysis
2.5. Results and Discussions
3. Conclusions
Author Contributions
Funding
Institutional Review Board Statement
Informed Consent Statement
Data Availability Statement
Acknowledgments
Conflicts of Interest
Abbreviations
| IP&D | Instituto de Pesquisa e Desenvolvimento |
| UNIVAP | Universidade do Vale do Paraíba |
References
- Das Neves Brandes, A.F.; Albuquerque, R.P.; Lisi, C.S.; de Lemos, D.N.; Nicola, L.R.M.; Melo, A.L.F.; Barros, C.F. The growth responses of Araucaria angustifolia to climate are adjusted both spatially and temporally at its northern distribution limit. For. Ecol. Manag. 2021, 487, 119024. [Google Scholar] [CrossRef]
- Venegas-González, A.; Roig, F.A.; Lisi, C.S.; Albiero-Junior, A.; Alvares, C.A.; Tomazello-Filho, M. Drought and climate change incidence on hotspot Cedrela forests from the Mata Atlântica biome in southeastern Brazil. Glob. Ecol. Conserv. 2018, 15, e00408. [Google Scholar] [CrossRef]
- Schweingruber, F.H. Tree Rings: Basics and Applications of Dendrochronology; D. Reidel Publishing Company: Dordrecht, Holland, 1988. [Google Scholar]
- Nordemann, D.J.R.; Rigozo, N.R. Árvores Contam uma História do Sol. Sci. Am. 2003, 2, 30–37. [Google Scholar]
- Luckman, B.H. Using Multiple High-Resolution Proxy Climate Records to Reconstruct Natural Climate Variability: An example from the Canadian Rockies. In Mountain Environments in Changing Climates; Routledge: London, UK, 1994; pp. 42–59. [Google Scholar]
- Rigozo, N.; Lisi, C.; Filho, M.; Prestes, A.; Nordemann, D.; Pereira de Souza Echer, M.; Echer, E.; Evangelista, H.; Rigozo, V. Solar-Terrestrial Signal Record in Tree Ring Width Time Series from Brazil. Pure Appl. Geophys. 2012, 169. [Google Scholar] [CrossRef]
- Lorensi, C.; Prestes, A. Dendroclimatological Reconstruction of Spring-Summer Precipitation for Fazenda Rio Grande, PR, with samples of Araucaria angustifolia (Bertol.) Kuntze. Rev. Árvore 2016, 40, 347–354. [Google Scholar] [CrossRef] [Green Version]
- Prestes, A.; Klausner, V.; Rojahn da Silva, I.; Ojeda-González, A.; Lorensi, C. Araucaria growth response to solar and climate variability in South Brazil. Ann. Geophys. 2018, 36, 717–729. [Google Scholar] [CrossRef] [Green Version]
- Fontana, C.; Reis-Avila, G.; Nabais, C.; Botosso, P.C.; Oliveira, J.M. Dendrochronology and climate in the Brazilian Atlantic Forest: Which species, where and how. Neotrop. Biol. Conserv. 2018, 13, 321–333. [Google Scholar] [CrossRef] [Green Version]
- Lisi, C.S.; Pessenda, L.C.R.; Tomazello Fo., M.; Rozanski, K. 14C Bomb efects on tree rings of tropical and subtropical species of Brazil. Tree-Ring Res. 2001, 57, 191–196. [Google Scholar]
- Roig, F.A. Dendrocronologia en América Latina; EDIUNC: Mendoza, Argentina, 2000. [Google Scholar]
- Carvalho, P. Pinheiro-do-Paraná. Technical Report 60, Circular Técnica Embrapa. 2002. Available online: http://www.infoteca.cnptia.embrapa.br/infoteca/handle/doc/304455 (accessed on 20 March 2021).
- Wrege, M.; Sousa, V.; Fritzsons, E.; Soares, M.; Aguiar, V.A. Predicting current and future geographical distribution of araucaria in Brazil for fundamental niche modeling. Environ. Ecol. Res. 2017, 4, 269–279. [Google Scholar] [CrossRef]
- Wrege, M.S.; Fritzsons, E.; Soares, M.T.S.; Bognola, I.A.; de Sousa, V.A.; de Sousa, L.P.; Gomes, J.B.V.; de Aguiar, A.V.; Gomes, G.C.; Matos, M.; et al. Distribuição natural e habitat da araucária frente às mudanças climáticas globais. Pesqui. Florest. Bras. 2017, 37, 331. [Google Scholar] [CrossRef] [Green Version]
- Guerra, M.; Silveira, V.; Reis, M.; Schneider, L. Exploração, manejo e conservação da araucária (Araucaria angustifolia). In Sustentável Mata Atlântica—A Exploração de Seus Recursos Florestais; Simões, L.L., Lino, C.F., Eds.; Editora Senac: São Paulo, Brazil, 2002; pp. 85–102. [Google Scholar]
- Ribeiro, M.C.; Metzger, J.P.; Martensen, A.C.; Ponzoni, F.J.; Hirota, M.M. The Brazilian Atlantic Forest: How much is left, and how is the remaining forest distributed? Implications for conservation. Biol. Conserv. 2009, 142, 1141–1153. [Google Scholar] [CrossRef]
- Carvalho, M.M.X.; Nodari, E.S. As fases da exploração madeireira na floresta com Araucária e os progressivos avanços da indústria madeireira sobre as florestas primárias (1870–1970). In Anais do Simpósio Internacional de História Ambiental e Migrações; UFSC: Florianópolis, Brazil, 2010. [Google Scholar]
- Thomas, P. Araucaria Angustifolia. The IUCN Red List of Threatened Species 2013. Technical Report, Online Document. 2013. Available online: https://doi.org/10.2305/IUCN.UK.2013-1.RLTS.T32975A2829141.en (accessed on 13 May 2021).
- Brazil. Portaria N° 443, de 17 de Dezembro de 2014. Technical Report, Diário Oficial da União. 2014; pp. 110–121. Available online: http://cncflora.jbrj.gov.br/portal/static/pdf/portaria_mma_443_2014.pdf (accessed on 21 April 2021).
- Rodrigues, R.; Brancalion, P.; Isernhagen, I. Pacto Pela Restauração da Mata Atlântica: Referencial dos Conceitos e Ações de Restauração Florestal. Technical Report, Escola Superior de Agricultura Luiz de Queiroz & Instituto BioAtlântica. 2009. Available online: https://www.ipe.org.br/ultimas-noticias/1911-ipe-esta-no-conselho-de-coordenacao-do-pacto-pela-restauracao-da-mata-atlantica?gclid=Cj0KCQjw9O6HBhCrARIsADx5qCSaSwOsx3voien-9Nz2wcP6esrNTnHLCfejR5tdMjWz5aqor-jSK8kaAvdiEALw_wcB (accessed on 20 March 2021).
- Souza, R.O.M.; Souza, V.C.; Polisel, R.T.; Ivanauskas, N.M. Estrutura e aspectos da regeneração natural de Floresta Ombrófila Mista no Parque Estadual de Campos do Jordão, SP, Brasil. Hoehnea 2012, 39, 387–407. [Google Scholar] [CrossRef] [Green Version]
- Lisi, C.S. Atividade de î4C do Fallout e Razão Isotópica î3C/î2em Anéis de Crescimento de Clima Tropical e Subtropical do Brasil. Ph.D. Thesis, CENA Science PG, Universidade de São Paulo, São Paulo, Brazil, 18 January 2001. [Google Scholar]
- Raven, P.; Evert, R.; Eichhorn, S. Biologia Vegetal, 6th ed.; Guanabara Koogan: Rio de Janeiro, Brazil, 1999. [Google Scholar]
- Do Estado de São Paulo, G. Plano de Manejo do Parque Estadual de Campos do Jordão. Technical Bulletin, Governo do Estado de São Paulo. 1975. Available online: https://www.infraestruturameioambiente.sp.gov.br/fundacaoflorestal/planos-de-manejo/planos-de-manejo-planos-concluidos/planos-de-manejo-pe-de-campos-do-jordao/ (accessed on 20 March 2021).
- Botosso, P. Identificação Macroscópica de Madeiras: Guia práTico e Noções Básicas para o seu Reconhecimento; Embrapa Florestas Colombo: Paraná, Brazil, 2011. [Google Scholar]
- Silva, D.; Klausner, V.; Prestes, A.; Gimenes, H.M.; Aakala, T.; Silva, I.R. Principal Components Analysis: An Alternative Way for Removing Natural Growth Trends. Pure Appl. Geophys. 2021. [Google Scholar] [CrossRef]
- Holmes, R.L. Computer assisted quality control in tree-ring dating and measurement. Tree Ring Bull. 1983, 43, 69–78. [Google Scholar]
- Helama, S.; Lindholm, M.; Timonen, M.; Eronen, M. Detection of climate signal in dendrochronological data analysis: A comparison of tree-ring standardization methods. Theor. Appl. Climatol. 2004, 79, 239–254. [Google Scholar] [CrossRef]
- Fowler, A.M. Variance Stabilization Revisited: A Case For Analysis Based On Data Pooling. Tree-Ring Res. 2009, 65, 129–145. [Google Scholar] [CrossRef]
- Speer, J.H. Fundalmentals of Tree-Ring Research; Library of Congress Cataloging-in-Publication Data; Library of Congress: Washington, DC, USA, 1971. [Google Scholar]
- Ferrio, J.P.; Díez-Herrero, A.; Tarrés, D.; Ballesteros-Cánovas, J.A.; Aguilera, M.; Bodoque, J.M. Using stable isotopes of oxygen from tree-rings to study the origin of past flood events: First results from the iberian peninsula. Quaternaire 2015, 26, 67–80. [Google Scholar] [CrossRef] [Green Version]
- Shiyatov, S.G.; Mazepa, V.S. Some New Approaches in the Consideration of More Reliable Dendroclimatological Series and in the Analysis of Cycle Components; Methods of Dendrochronology; Kairiukstis, L., Cook, E.R., Eds.; International Institute for Applied Systems Analysis, Laxenburg, Austria and Polish Academy of Sciences-System Research Institute: Warsaw, Poland, 1987. [Google Scholar]
- Cook, E.; Briffa, K.; Shiyatov, S.; Mazepa, V.; Jones, P.D. Data Analysis. In Methods of Dendrochronology: Applications in the Environmental Sciences; Cook, E.R., Kairiukstis, L.A., Eds.; Springer: Dordrecht, The Netherlands, 1990; pp. 97–162. [Google Scholar] [CrossRef]
- Meko, D.M.; Touchan, R.; Anchukaitis, K.J. Seascorr: A MATLAB program for identifying the seasonal climate signal in an annual tree-ring time series. Comput. Geosci. 2011, 37, 1234–1241. [Google Scholar] [CrossRef]
- Rigozo, N.R.; Echer, E.; Vieira, L.E.A.; Nordemann, D.R. Reconstruction of Wolf sunspot numbers on the basis of spectral characteristics and estimates of associated radio flux and solar Wind parameters for the last millennium. Sol. Phys. 2001, 203, 179–191. [Google Scholar] [CrossRef]
- Torrence, C.; Compo, G.P. A Practical Guide to Wavelet Analysis. Bull. Am. Meteorol. Soc. 1998, 79, 61–78. [Google Scholar] [CrossRef] [Green Version]
- Tomazello Filho, M.; Botosso, P.C.; Lisi, C.S. Análise e aplicação dos anéis de crescimento das árvores como indicadores ambientais: Dendrocronologia e dendroclimatologia. In Indicadores Ambientais: Conceitos e Aplicações; EDUC, COMPED, INEP: Piracicapa, São Paulo, Brazil, 2002; pp. 117–143. [Google Scholar]
- Cardoso, N.S. Caracterização da Estrutura Anatômica da Madeira, Fenologia e Relações com a Atividade Cambial de Arvores de Teça (Tectona Grandis)— Verbanaceae. Master’s Thesis, Escola Superior de Agricultura “Luiz de Queiroz”, Universidade de São Paulo, Piracicaba, Brazil, 1991. [Google Scholar]
- Zanon, M.L.B. Crescimento da Araucaria Angustifolia (Bertol.) Kuntze Diferenciado por Dioicia. Ph.D. Thesis, Universidade Federal de Santa Maria, Santa Maria, Brazil, 2007. [Google Scholar]
- Santarosa, E.; Oliveira, J.M.; Roig, F.A.; Pillar, V.P. Crescimento Sazonal em Araucaria angustifolia: Evidências Anatômicas. Rev. Bras. BiociêNcias 2007, 5, 618–620. [Google Scholar]
- Lambers, H.; Chapin, F.; Pons, T. Plant Physiological Ecology; Springer: New York, NY, USA, 1998. [Google Scholar]
- Kramer, P.J.; Boyer, J. Water Relations of Plants and Soils; Academic Pres: San Diego, CA, USA, 1995; p. 495. [Google Scholar]
- Jacob, G.C. Overview of tree-rings analysis in tropical regions. IAWA Bull. New Ser. 1989, 10, 99–108. [Google Scholar] [CrossRef]
- Rigozo, N.; Evangelista, H.; Nordemann, D.; Echer, E.; Pereira de Souza Echer, M.; Prestes, A. The Medieval and Modern Maximum solar activity imprints in tree ring data from Chile and stable isotope records from Antarctica and Peru. J. Atmos. Sol. Terr. Phys. 2008, 70, 1012–1024. [Google Scholar] [CrossRef]
- Scipioni, M.C.; Fontana, C.; Oliveira, J.M.; Santini Junior, L.; Roig, F.A.; Tomazello-Filho, M. Effects of cold conditions on the growth rates of a subtropical conifer. Dendrochronologia 2021, 68, 125858. [Google Scholar] [CrossRef]


| Number of Tree Series (t) | Period | Mean between-Tree Correlation (Rbt) | Expressed Population Signal (EPS) |
|---|---|---|---|
| 16 | 1803–2012 | 0.28 | 0.86 |
| Precipitation | ||||
|---|---|---|---|---|
| m | Ending Month | r | Nonexceedance Probability | |
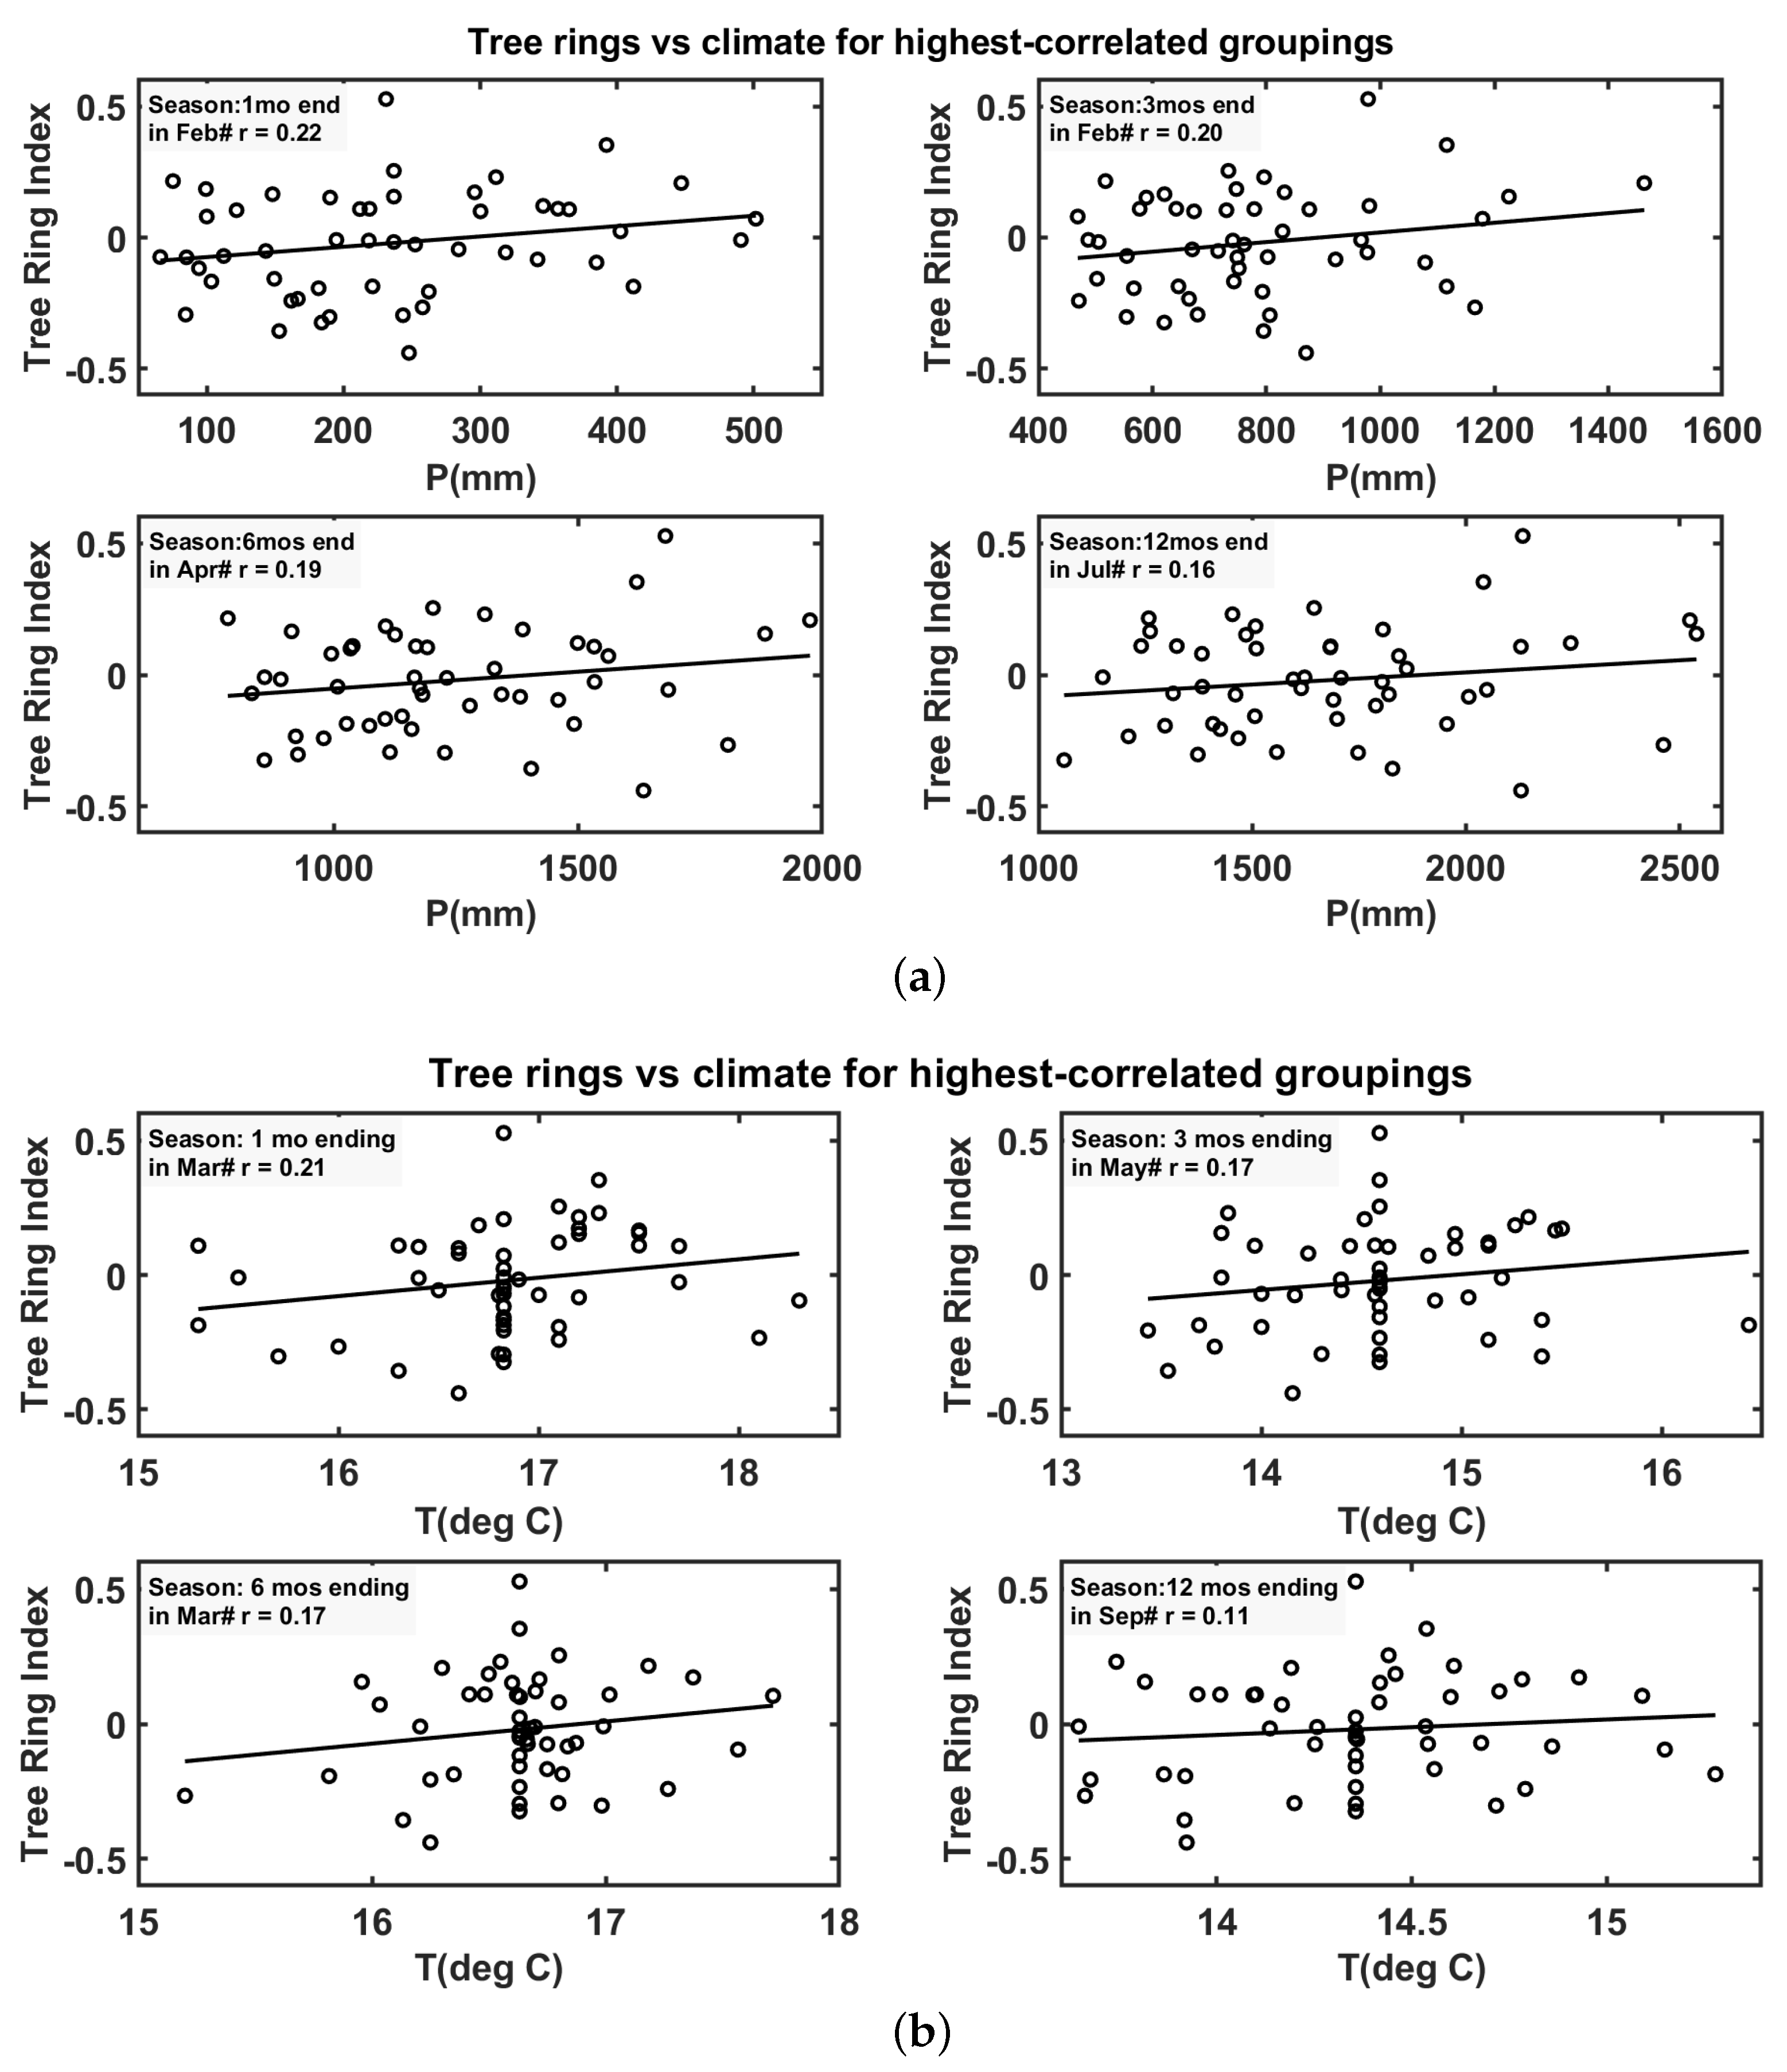
| 1 | February | 0.22 | 0.1 | 0.9462 |
| 3 | February # | 0.20 | 0.2 | 0.8866 |
| 6 | April # | 0.19 | 0.3 | 0.8477 |
| 12 | July # | 0.16 | 0.4 | 0.8092 |
| Temperature | ||||
| 1 | March | 0.21 | 0.1 | 0.9348 |
| 3 | May # | 0.17 | 0.3 | 0.8725 |
| 6 | March # | 0.17 | 0.3 | 0.8602 |
| 12 | September # | 0.11 | 0.5 | 0.7464 |
| Precipitation | ||||||||
|---|---|---|---|---|---|---|---|---|
| Season | Correlation | Sample Size | Test Results | |||||
| Months | Length | Full | Early | Late | N1 | N2 | Z | |
| February | 1 | 0.22 | 0.34 | −0.07 | 24 | 24 | 0.4286 | 0.162 |
| December–February | 3 | 0.20 | 0.25 | −0.04 | 21 | 21 | 0.2975 | 0.377 |
| November–April | 6 | 0.19 | 0.24 | −0.04 | 18 | 18 | 0.2762 | 0.445 |
| August–July | 12 | 0.16 | 0.18 | −0.03 | 17 | 17 | 0.2189 | 0.557 |
| Temperature | ||||||||
| March | 1 | 0.21 | 0.36 | 0.02 | 24 | 24 | 0.3602 | 0.243 |
| March–May | 3 | 0.17 | 0.38 | 0.03 | 22 | 22 | 0.3647 | 0.258 |
| October–March | 6 | 0.17 | 0.38 | −0.01 | 22 | 22 | 0.4190 | 0.193 |
| October–September | 12 | 0.11 | 0.41 | −0.10 | 19 | 19 | 0.5399 | 0.122 |
Publisher’s Note: MDPI stays neutral with regard to jurisdictional claims in published maps and institutional affiliations. |
© 2021 by the authors. Licensee MDPI, Basel, Switzerland. This article is an open access article distributed under the terms and conditions of the Creative Commons Attribution (CC BY) license (https://creativecommons.org/licenses/by/4.0/).
Share and Cite
da Silva, D.O.; Prestes, A.; Klausner, V.; de Souza, T.G.G. Climate Influence in Dendrochronological Series of Araucaria angustifolia from Campos do Jordão, Brazil. Atmosphere 2021, 12, 957. https://doi.org/10.3390/atmos12080957
da Silva DO, Prestes A, Klausner V, de Souza TGG. Climate Influence in Dendrochronological Series of Araucaria angustifolia from Campos do Jordão, Brazil. Atmosphere. 2021; 12(8):957. https://doi.org/10.3390/atmos12080957
Chicago/Turabian Styleda Silva, Daniela Oliveira, Alan Prestes, Virginia Klausner, and Táyla Gabrielle Gonçalves de Souza. 2021. "Climate Influence in Dendrochronological Series of Araucaria angustifolia from Campos do Jordão, Brazil" Atmosphere 12, no. 8: 957. https://doi.org/10.3390/atmos12080957