Article

Spatiotemporal Impacts of Urban Land Use/Land Cover Changes on Land Surface Temperature: A Comparative Study of Damascus and Aleppo (Syria)

by
Mohamed Ali Mohamed
Department of Geography, Humboldt University of Berlin, 10099 Berlin, Germany
Atmosphere 2021, 12(8), 1037; https://doi.org/10.3390/atmos12081037
Submission received: 5 July 2021 / Revised: 3 August 2021 / Accepted: 11 August 2021 / Published: 13 August 2021
(This article belongs to the Special Issue Remote Sensing and GIS Applications in Urban Climate Research)

Abstract

:
Monitoring the impact of changes in land use/land cover (LULC) and land surface temperature (LST) is of great importance in environmental and urban studies. In this context, this study aimed to analyze the dynamics of LULC and its impact on the spatiotemporal variation of the LST in the two largest urban cities in Syria, Damascus, and Aleppo. To achieve this, LULC changes, normalized difference vegetation index (NDVI), and LST were calculated from multi-temporal Landsat data for the period 2010 to 2018. The study revealed significant changes in LULC, which were represented by a decrease in agricultural land and green areas and an increase in bare areas in both cities. In addition, built-up areas decreased in Aleppo and increased in Damascus during the study period. The temporal and spatial variation of the LST and its distribution pattern was closely related to the effect of changes in LULC as well as to land use conditions in each city. This effect was greater in Aleppo than in Damascus, where Aleppo recorded a higher increase in the mean LST, by about 2 °C, than in Damascus, where it was associated with greater degradation and loss of vegetation cover. In general, there was an increasing trend in the minimum and maximum LST as well as an increasing trend in the mean LST in both cities. The negative linear relationship between LST and NDVI confirms that vegetation cover can help reduce LST in both cities. This study can draw the attention of relevant departments to pay more attention to mitigating the negative impact of LULC changes in order to limit the increase in LST.

1. Introduction

Land use/land cover (LULC) changes in urban areas are a critical factor affecting the physical characteristics of the Earth’s surface due to the unique characteristics that each LULC category possesses with respect to radiation and absorption energy [1,2,3]. Therefore, the occurrence of changes in LULC will lead to changes in the exchange of energy between the ground surface and the atmosphere, which, in turn, will lead to changes in the radiative and aerodynamic balance [1,4,5,6]. These changes are enough to significantly alter the microclimate in urban areas [1,6,7]. This will, therefore, have consequences for local and regional weather variables [6]. This can eventually lead to sharp transformations in urban landscapes [6,8].
Studies have shown that one of the most well-known forms of modification of landscape involving LULC changes is the microclimate modification phenomenon in urban areas, which is represented by an increase in atmospheric and land surface temperature (LST) [5,6,7,9,10]. Since LST can be considered an effective measure for predicting radiation budgets for heat balance, it can be an important indicator in understanding the interactions that occur between the environment and humans in urban environments [11,12]; thus, this reflects the health status of the ecosystem [6]. In addition, LST can be an important factor controlling the physical and biological processes of land systems [11,13].
LST is obtained from direct measurements taken on the ground. Thanks to the ability of remote sensing techniques to capture the spatial patterns of the emitted thermal radiation, data of the thermal sensors of the satellites such as Landsat Thematic Mapper (TM), Enhanced Thematic Mapper Plus (ETM+), operational land imager (OLI)/thermal infrared (TIR), ASTER, and MODIS are also used to calculate LST [14,15,16,17,18,19]. The data of these sensors, despite their low temporal accuracy compared to the data of field measurements of temperature, has wide spatial coverage in different time scales [6,16].
Studies on LST analyses have shown that LST that can be obtained from remote sensing data is the function of different land uses [6,11,20]; therefore, the LST can provide data with a high spatial resolution and continuous spatial distribution of an urban area as a large city or region [11]. This allows for adequate visualization of spatial relationships between temperature patterns and patterns of land use in urban areas, including infrastructure characteristics within these areas [5,16,21,22,23,24].
Several studies have been conducted to correlate LST derived from remote sensing data and normalized difference vegetation index (NDVI) as a predictor of LST [1,6,10,19,25,26,27,28,29] to identify surface urban heat island (UHI) distribution patterns. In view of the negative impacts of LULC changes as a result of the increase in urbanization and the loss of vegetation cover in urban areas, several studies have been conducted on the dynamics of LULC and its effects on LST based on remote sensing data [1,6,10,16,17,24,28,30,31,32,33,34]. The results of previous studies have also shown that there is a strong relationship between LST and LULC patterns [1,6,16,28,30,33]. As a result, relationships between LULC changes and LST derived from remote sensing data can be studied. Thus, qualitative studies can be useful in land use planning in urban areas. In addition, the study of the relationship between LULC and LST may be of great value in urban climate studies.
Most of the studies based on remote sensing technology in studying the pattern, density, and distribution of UHI through LST and LULC changes confuse the LST, atmospheric UHI, and the surface UHI. The UHI is detected by measuring the temperature of the air for a daily cycle using data from meteorological stations [6,35,36], which cannot be obtained from remote sensing data. Surface UHI can also be detected using remote sensing thermal infrared data [6,37]. Therefore, in this research, in order to avoid uncertainty, the term surface temperature (LST) and its relationship to changes in LULC will be used.
Despite the fact that Damascus and Aleppo possessed strong centripetal forces at the regional level and were growing rapidly in the Middle East before the conflict began in mid-2011, they are located in different geographical environments. As a result, it is assumed that both cities witnessed a major change in land use and changes in the intensity of human activities during the devastating war. In addition, extreme hot weather has occurred in Syria with increasing frequency since that time. Given the critical importance of LST and LULC change studies in determining the local climate and health as well as in advocating urban planning policies in urban areas, the subject of this research becomes very important to understanding how LULC changes in urban areas can alter the surrounding thermal environment. Therefore, the main aim of this research was to understand the changes of LULC with trends of LST retrieved from the thermal infrared band of Landsat TM and OLI in Damascus and Aleppo during the 2010–2018 conflict period as well as analyze the effects of LULC changes on LST. This involves: (1) determining the extent, direction, and patterns of LULC changes; (2) calculating the LST values and analyzing its patterns; (3) exploring the spatial relationships between LST and different LULC classes and determining the role of LULC dynamics in LST temperature changes.

2. Study Area

Damascus and Aleppo are located in the interior of Syria (Figure 1). The city of Damascus is located in southwestern Syria at the geographic coordinates of 33°30′36″ N and 36°17′28″ E and covers an area of 116.75 km2 with an average altitude of 680 m above mean sea level. Due to the existence of the Anti-Lebanon Mountains, which form the border between Syria and Lebanon, the Damascus region is sometimes subjected to drought. These mountains, which have high peaks of over 3048 m, block the passage of rain-producing weather systems from the Mediterranean Sea (rain shadow effect) [38,39,40]. Due to the concentration of intensive agriculture as irrigated agriculture in Al-Ghouta, which surrounds Damascus, these cultivated areas can affect the city’s microclimate as a thermal modifier and a cooling factor within the city. To the east of Damascus lies the desert (steppe). Damascus city experiences the cold desert climate according to the Köppen–Geiger system [39]. The winters are cold and rainy, while the summers are dry and hot with a lower moisture content. The average annual rainfall was about 131 mm for the period 1985 to 2018, falling between October and May [38,40]. The average annual temperature was 17.5 °C for the period 1985 to 2018 [38,40].
Aleppo is located on a plateau with a height of 380 m in northwestern Syria at geographical coordinates of 36°12′04″ N and 37°09′40″ E, which is approximately 120 km from the Mediterranean Sea. Aleppo occupies an area of more than 144 km2. Aleppo is surrounded by agricultural land to the north and west, while it is close to the borders of the Syrian desert to the east. In the city of Aleppo, there is the cool steppe climate according to classification by Köppen [39]. The mountain range along the Mediterranean coast largely prevents the arrival of Mediterranean influences from the west on the climate of Aleppo. The average annual precipitation was 329.4 mm for the period 1985 to 2018, 80% of this precipitation being concentrated between October and March. The average annual temperature was 17.3 °C for the period 1985 to 2018 [41].
Damascus is the administrative capital of Syria and is, therefore, the center of a large number of administrative buildings of state institutions and residential areas. Aleppo was the largest urban area in Syria before the conflict, which included a large number of major industrial and commercial institutions and offices of major companies and was known as the industrial and economic capital of Syria. Both cities have witnessed and continue to experience a different population growth during the current conflict [42,43]. The population of Damascus in 2010 was 1,749,000, as compared to 2,375,000 people in Aleppo [1]. Aleppo was the largest city in the country and one of the fastest growing cities in the Middle East until the beginning of the conflict. However, as a result of the siege of the city of Aleppo and the long battle that took place in this city, there was tremendous destruction in many parts of the city, and hundreds of thousands of its inhabitants have been displaced. Aleppo has become the second largest city in Syria after the capital, Damascus, where the population of the city of Aleppo was estimated at about 1,850,000 people in 2017 [42,44,45]. Thus, Damascus became a densely populated metropolitan area with an estimated population of five million. The rate of growth in Damascus is currently the highest in the country, due to the war conditions that imposed new demographic and urban growth. However, the population of Damascus has declined in recent years as a result of the ongoing conflict, with a population of approximately 2,048,000 people in 2018 [1]. Population density in Damascus was about 17,541 people per km2 in 2018, while the population density of Aleppo was lower, which amounted to 12,847 people per km2 in the same year [1].

3. Materials and Methods

3.1. Data Acquisition

Landsat-5 Thematic Mapper (TM) and Landsat-8 operational land imager (OLI) images taken in late spring, from April, were used to monitor the changes in LULC, calculate the LSTs and NDVI, and evaluate the response of different LULC on LST in both cities for the years 2010, 2014, and 2018. These images, processed at level-1, have been obtained free of charge from Landsat archives available on the official United States Geological Survey (USGS) website [46]. These Landsat images have radiometric information of three visible and three infrared bands with spectral characteristics, which allows LULC monitoring and mapping as well as retrieval of LST [47,48,49,50].
Since the objective is to compare the changes in LULC and LSTs in both cities, images were chosen for each year of the study period from the same year and represent the same season. In addition, the scenes covered by these images were completely free of any coverage of clouds and captured exactly at one moment in time. Therefore, Landsat images are coherent enough to be interpreted as a single set when monitoring and analyzing changes in LULC and LSTs for the target years. Table 1 shows details of Landsat TM/OLI images used in the study.
Although there were no field observations to collect ground truth data due to the ongoing conflict in Syria, there were sufficient additional data to identify the characteristics of the natural environment and land uses in the two study areas. These data included high-resolution Google Earth Pro archive data and topographic maps of Aleppo and Damascus in scales ranging from 1:25,000 to 1:50,000 which were provided by the General Organization for Survey of Syria. Some aerial photos of small areas in both cities were also obtained from the military survey and are available online (photos of drones) [51]. Ground control points (GCPs) were derived from this additional data, which were used as reference points for the geometric correction of imagery. The additional data were also used to train the classifier, to validate the accuracy of the classification, and to better visually interpret the Landsat images by deepening the background knowledge on land use, which, in turn, provides a better understanding of LULC dynamics and the reasons behind these dynamics and changes in LSTs in both cities.

3.2. Preprocessing of the Landsat TM and OLI Imageries

The Landsat images of the level-1 are geometrically and radiometrically corrected by the USGS; nonetheless, there may be difficulties in applying the pixel-based classification of LULC, because the digital number of spectral images are often affected by various atmospheric conditions, such as atmospheric scattering, absorption, and reflection, as well as numerous factors such as sensor calibration, illumination geometry, sun angle, and visible near-infrared wavelengths [1,6,49,52,53]. Therefore, radiometric calibration is a preprocessing step to overcome radiation error caused by atmospheric scattering. This process aims to accurately determine the radiation brightness values at the sensor input and to further convert these values to the actual ground-reflected radiation [3,54,55] in order to derive good estimates of incoming radiation from the ground surface [16]. Furthermore, an atmospheric correction of all used bands is essential in techniques that use band ratios (such as NDVI and NIR/red ratio) [55]. Moreover, preprocessing procedures for the medium spatial resolution data of Landsat images have a great benefit in correcting different surface reflection differences, displaying the objects of these images, and increasing the possibility of visual interpretation during the classification process [1,56].
As a result, all the acquired images were subjected to preprocessing steps, which included geometric correction, atmospheric correction, and radiometric processing. The acquired Landsat images were preprocessed individually using ENVI 5.3 software of Harris Corporation in Melbourne, FL, USA, where these correction procedures have corresponding operation modules in the toolbox. To match the pixel sizes of all bands, the nearest-neighbor algorithm was used to resample the TM and OLI thermal bands to a 30 m pixel size. This step of preprocessing was performed using ENVI 5.3 [57]. The study area was then clipped from Landsat images for each study year using ArcGIS 10.5 [58]. The color combinations of Landsat imagery bands were also chosen, which take into account the contrast and distinction between different LULC, especially vegetation formations (band 5-4-3 as RGB for Landsat 5 TM and band 6-5-4 as RGB for Landsat 8 OLI) [50].

3.3. Image Classification and Accuracy Assessment

Classification of Landsat images of urban areas is a complex process due to the spectral heterogeneity shown by different LULC [1,59]. In previous studies, which addressed the detection of change in LULC patterns in semi-arid areas as comparable environments using similar data, the maximum likelihood classifier algorithm (MLC) achieved the best results [49,60,61,62,63,64]. In addition, this classification method is known for its strong theoretical basis, its high classification accuracy, and its ability to accommodate changing spectral signatures of different LULC with appropriate selection of classifier training samples [1,49,64]. Therefore, the MLC algorithm was applied using ArcGIS 10.5 for Landsat image classification purpose for the two study areas. Classifier training samples were obtained as predefined spectral signatures for all classes of LULC from Google Earth archive data, topographic maps, and high-resolution aerial imagery (drone images). In order to achieve greater accuracy and reliability in the classification of LULC in the two study areas, additional training samples were also collected using visual interpretation from Landsat images and NDVI images, especially when detecting agricultural lands and green areas in the two study areas. Training samples were selected independently for each Landsat image in accordance with the size and location of LULC categories within the two study areas [1,49,65]. This ensures, as far as possible, to obtain different spectral signatures that represent all categories of LULC. Table A1 in Appendix A shows the number of training samples represented for the classified LULC categories. The MLC algorithm was then applied to each Landsat image containing the spectral bands in false colors composite. In order to detect LULC changes and better describe their patterns based on knowledge of the characteristics of land use, the density of development, and the social and economic levels of both cities, all images were classified into three categories of LULC (Table 2). The area of each LULC category was calculated using the number of pixels. Finally, the LULC classification results were spatially smoothed using the “majority-filter” (3 × 3 pixels), to reduce the “salt&pepper” effect [66].
In order to assess the classification accuracy, a confusion matrix was applied to classified images [67,68]. For this purpose, a stratified random sampling approach was taken by allocating random sample points outside the training areas for each LULC category based on the minimum sample size for each stratum, which is 20 validation points [49,69,70]. The selected number of these random validation points in each category corresponds to the relative size of the corresponding classified LULC category [69], with a total of 218 and 230 points for the cities of Damascus and Aleppo, respectively (Table A2). The validation points for each LULC category in both cities were evaluated based on the high-resolution Google Earth Pro imagery that match the Landsat imagery dates (±15 days); then, the accuracy was calculated. The supervised classification of LULC can contain uncertainties, which can result from misclassification, homogeneity, and autocorrelations within the validation samples selected during manual preparation induced by the interpreter [71,72,73,74]. Therefore, based on the error matrix and accuracy assessment for the LULC classification, the error-adjusted area estimates for all LULC classes as well as the 95% confidence intervals were calculated according to the statistical approach recommended by Olofsson et al. [73,74]. Then, LULC change detection was performed based on adjusted area estimates in accordance with the three levels of development (urban planning) in both cities (Table 3, Figure 2).

3.4. Derivation of NDVI

NDVI is calculated from the reflectance values of the visible (RED) and near-infrared bands (NIR) using Equation (1).
NDVI = (NIR − RED)/(NIR + RED)
where NIR = band5 and NIR = band4 are spectral reflections in OLI, and NIR = band4 and NIR = band3 are spectral reflections in TM. The value of NDVI varies in the range −1 to 1. Negative values of NDVI correspond to non-vegetative cover or uncultivated surfaces. Positive values refer to cultivated soils or areas that contain some form of vegetation cover [25,62]. NDVI was applied to preprocessed Landsat images used in this study to determine proportion of vegetation coverage (Pv) in order to calculate the emission (ε) as input for the algorithm required for calculation of the LST and to analyze the relationship between vegetation cover and LST results. The images of NDVI were also useful for separating vegetation from other LULC categories during the classification process.

3.5. Retrieval of LST

Several studies dealing with changes in LSTs in arid and semi-arid environments have recommended the use of band 6 of Landsat 5 images because it does not show radiometric saturation in the hottest regions [6,75]. Band 10 from Landsat 8 is also recommended for the LST calculation because it has the best adjustment with respect to LST computation, compared to band 11, which shows an overestimation [6,76]. Therefore, the single band method was used to retrieve LST from thermal band 6 from TM images and the thermal band 10 from the OLI images. This method, which requires fewer parameters, is effective in obtaining the surface temperature from these thermal bands [16,36].
Given that the two study regions have limited spatial ranges and Landsat images of these regions were acquired in a cloudless sky, the degree of impact of atmospheric conditions will be consistent, so the relative temperature of the land surface and its spatial distribution across the study areas will also not be affected by these conditions. The following three steps show derivation of LST from Landsat TM and OLI sensors:
  • Conversion of pixel value from digital number (DN) value to spectral radiance value at the sensor entrance of the thermal band (Lλ) using Equation (2) [77].
[Lλ = Lmin + (Lmax − Lmin/Qmax)∗Qdn]
where Lλ is the spectral radiation value in W/(m2srμm); Lmin and Lmax are the radiance minimum and radiance maximum for the thermal band, which was acquired from a Landsat image metadata file; Qmax is the maximum quantized calibrated pixel value, which was acquired from a Landsat image metadata file; and Qdn is the data value of image pixels, expressed as a digital number (for sensors TM = 255 and for Landsat 8 = 65,535).
  • Conversion of radiance value to brightness temperature (Tb) using Equation (3) [11,78].
Tb = K2/ln[(K1/Lλ + 1]
where Tb is brightness temperature at satellite (sensor) expressed in Kelvin; K1 and K2 are thermal conversion constants for thermal bands from a metadata file; and ln is a natural algorithm. K1 and K2 for band 10 OLI are 774.88 and 1321.08, respectively. K1 and K2 for band 6 TM are 607.76 and 1260.56, respectively.
  • Calculation of LST:
Land surface temperature was estimated by Equation (4) [78,79].
LST = Tb/[1 + (λ∗Tb/P)ln(ε)] − 273.15
where LST is the land surface temperature in Kelvin; λ is the wavelength of emission radiance (11.5 μm in band 6 for Landsat 5 TM and 10.8 μm in band 10 for Landsat 8 OLI); P is h∗c/s(1.4388 × 10−2 mK), where h is Planck’s constant (6.626 × 10⁻³⁴ mK), c is the velocity of light (2.998 × 10⁸ m/s), and s is the Boltzmann constant (1.38 × 10⁻²³ JK); ln is a natural algorithm; and ε is surface emissivity, which can be referred to in Equation (5). However, this result must be obtained in degrees Celsius by adding absolute zero (approx. −273.15 °C).
Due to the different ground surface materials, the corresponding pixels contain a variety of materials with different emissivity values, especially at resolutions of 100 m and 120 m [3]. This makes the calculation of emission very complicated due to its different values. To calculate the emission values for the study areas, the ground surface materials on Landsat images were divided into two types: the land of construction and the natural ground surface. The land surface emissivity of these two types was calculated using the NDVI thresholds method according to Equations (5)–(9), respectively [78,80,81,82].
ε = εsurface∗Pv + εconstruction∗(1 − Pv) + dε
where εsurface is emissivity of the natural ground surface; εconstruction is the built land emissivity; Pv is the proportion of vegetation coverage; dε is the effect of the geometrical distribution of the heterogeneous and rough surfaces as well as the internal reflections of these surfaces.
εsurface = 0.9625 + 0.0614∗Pv − 0.0461∗Pv2
εconstruction = 0.9589 + 0.086∗Pv − 0.0671∗Pv2
Pv = (NDVI − NDVIsoil/NDVIveg − NDVIsoil)2
NDVIsoil value can be approximately equal to the minimum value of NDVI, and NDVIveg value can be approximately equal to the maximum value of NDVI.
dε = (1 − εconstruction)∗(1 − Pv)∗F∗εsurface
where F is a shape factor and is equal to 55 as average value, assuming that the Earth’s surface has different geometrical distributions.

3.6. Correlation Analysis

To show a quantitative relationship between LST changes and LULC as urban parameters and to illustrate their spatial differences in both cities, a multiple linear regression analysis was used to calculate the correlation matrix between the different study variables, LULC, NDVI, and LST. To achieve this, the values of LST ranges calculated for each year and the size of the area for LULC extracted from the classification occupied by these ranges were used. To obtain the surface temperature ranges as an input parameter to calculate this correlation, the retrieved LSTs were divided into seven intervals according to the rules shown in Table 4, and then the corresponding LSTs were identified for each interval.
The study also employed quantitative analysis to determine independent changes in LST for LULCs in both cities based on LST derivation for different types of land use that was derived by visual interpretation on classified Landsat images: residential areas, non-residential areas, agricultural land, industrial areas, green areas, bare land, roads, airports, and military zones. This was achieved by converting pixels of LST into point data. Parametric values of these points were retrieved from LST maps derived from Landsat images. Sample points were then selected for comparison by overlaying the LST values of these points with the selected LULCs.

4. Results

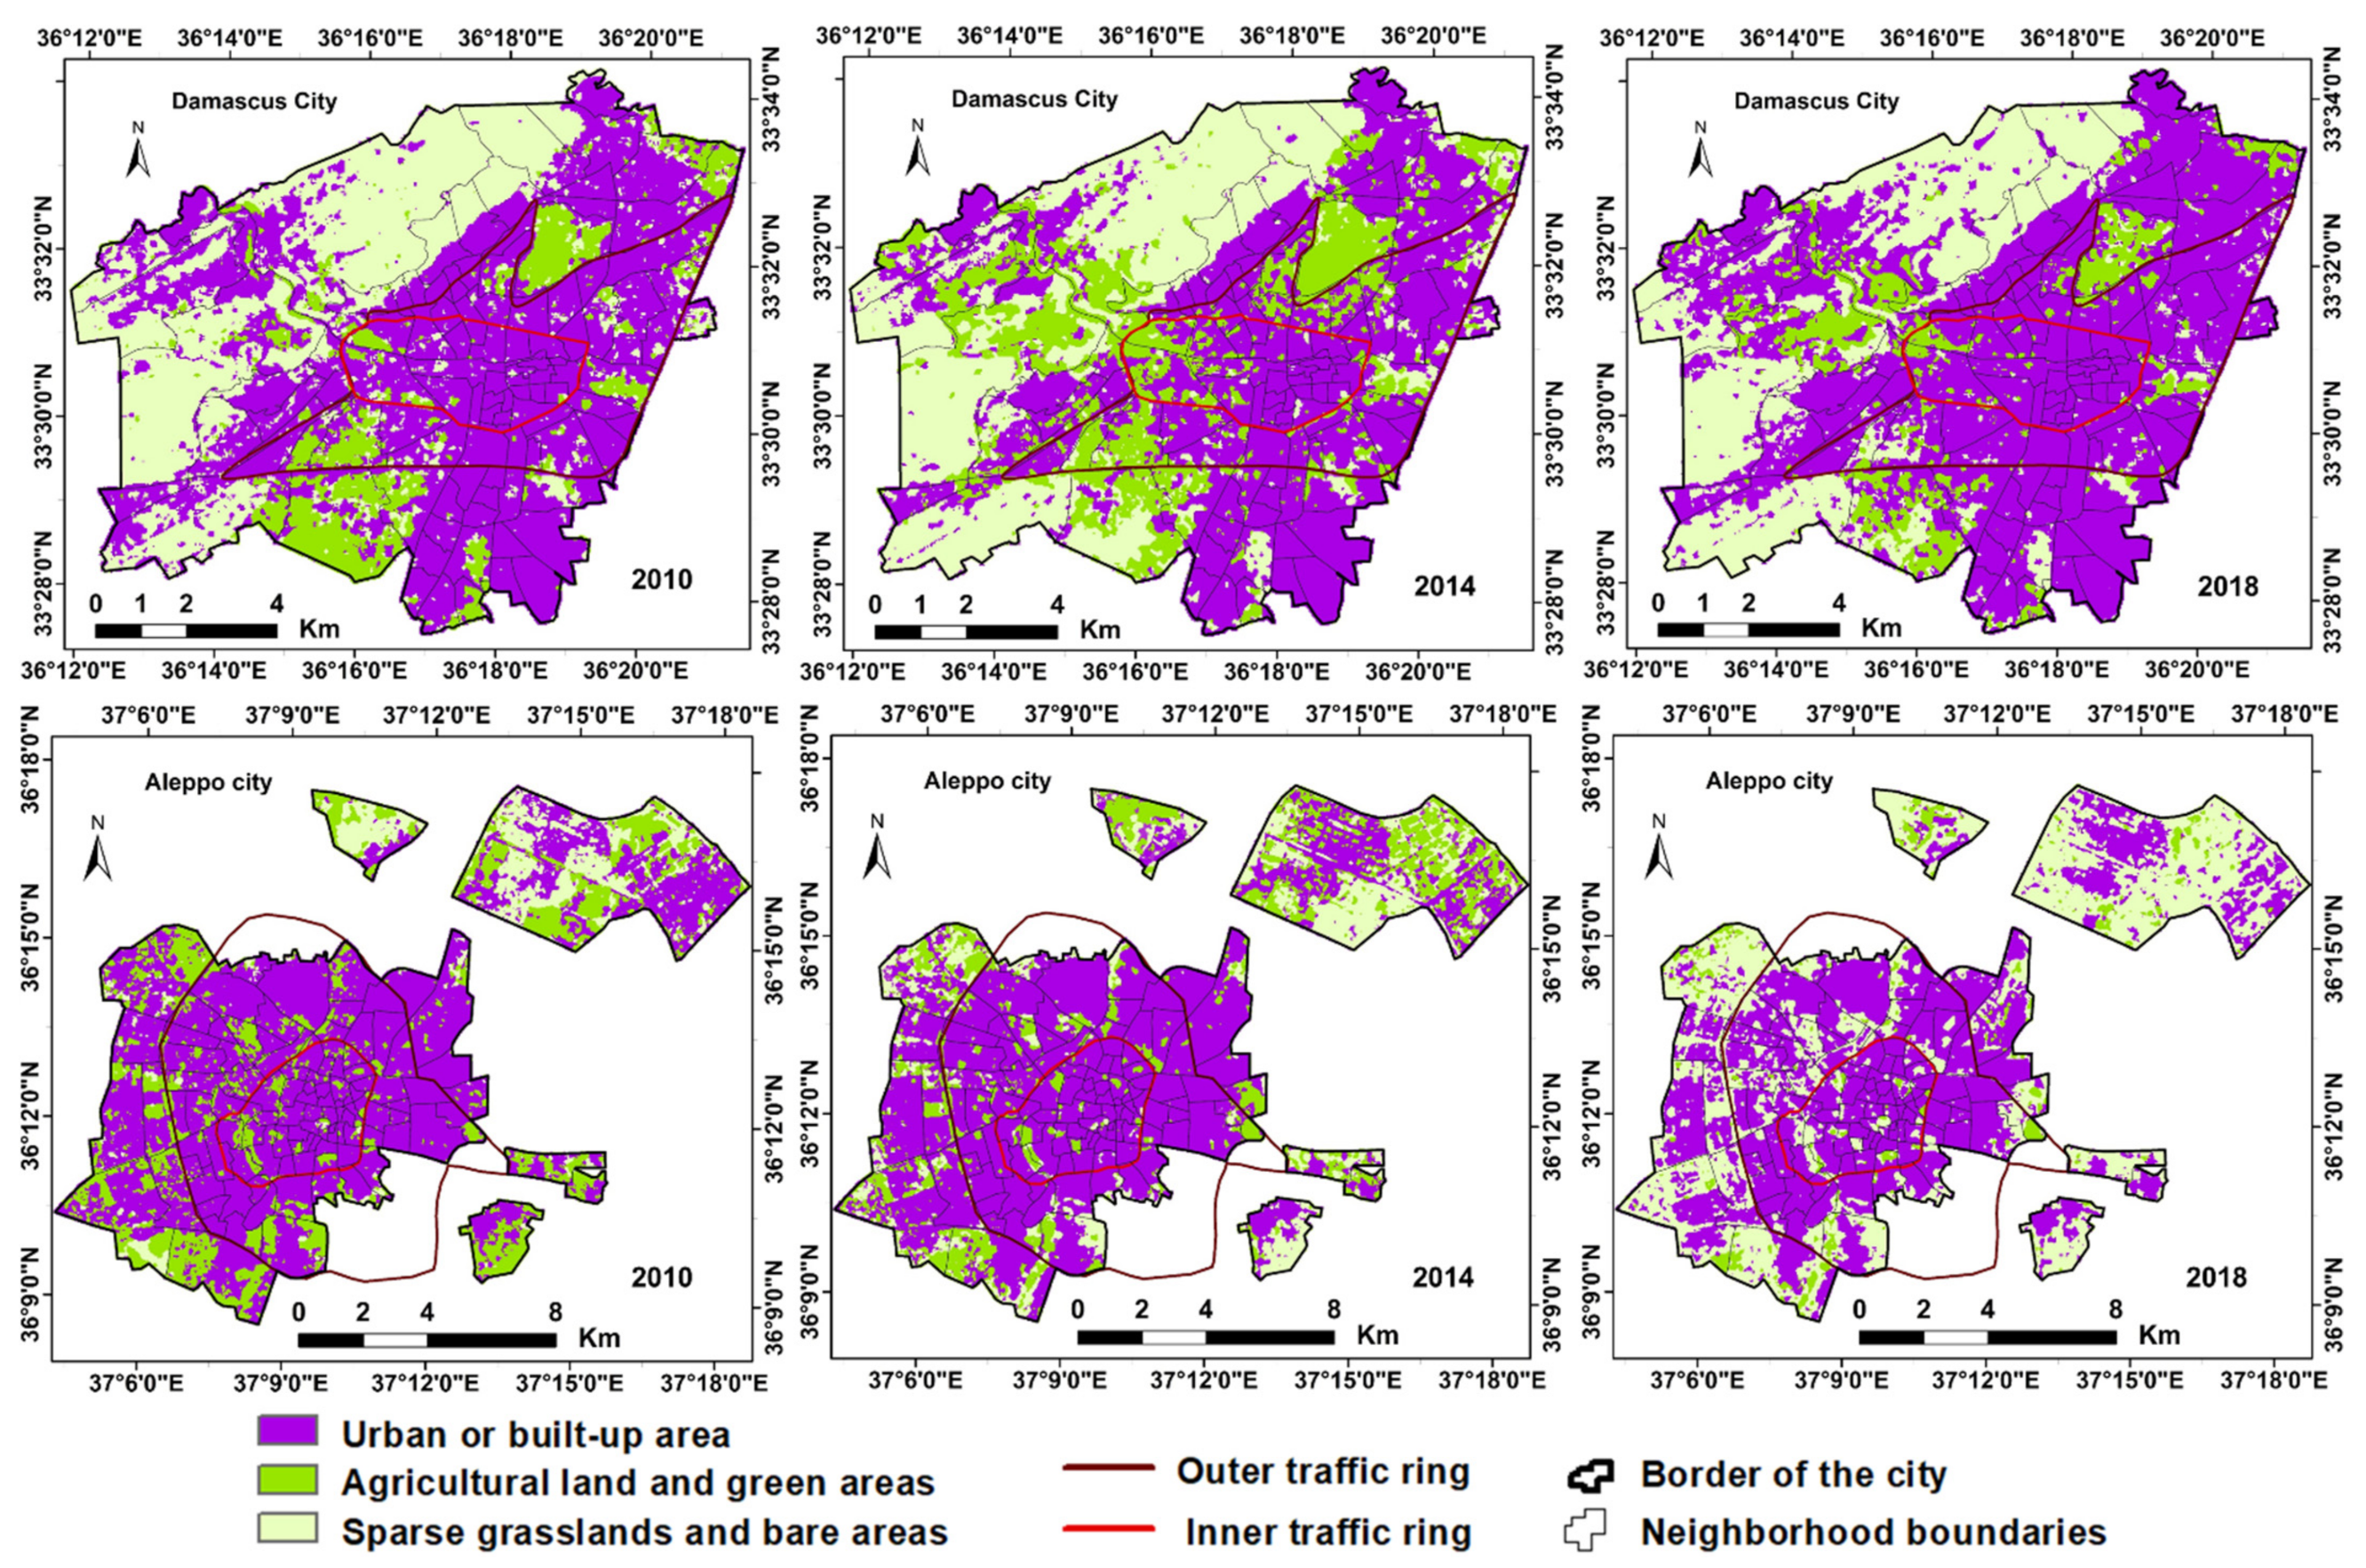
4.1. LULC Change Detection and Dynamics Analysis

Table A2 in Appendix A shows LULC classification accuracies in both cities based on the confusion matrix between 2010–2018. The area-adjusted accuracy of the final overall classification of LULC in Damascus varied between 87.1% and 89.4%, while this accuracy was between 86.1% and 90.0% in Aleppo. It is established that the standard overall accuracy for LULC classification ranges from 75% [83] to 90% [84]. Figure 3 presents the LULC pattern of Damascus and Aleppo. Table 5 also shows the results of LULC classification in both cities.
The results of the LULC change revealed significant differences in the size and trajectory of land use during the study period, particularly in the city of Aleppo, which witnessed a siege and battles between 2012 and 2016 during the conflict. Analysis of LULC maps between 2010 and 2108 showed that cultivated areas and green areas in Damascus exhibited growth and decline during of conflict between 2010–2014 and 2014–2018, respectively, especially outside the outer traffic ring, while these areas in Aleppo recorded a continuous decline between 2010 and 2118 within and outside the outer traffic ring. The most prominent changes in LULC in Damascus were the continuous growth in urban or built-up areas and sparse grasslands with bare areas between 2010 and 2018 outside the outer traffic ring, while the city of Aleppo witnessed, for all the study years, a continuous decline in urban area as well as a continuous increase in sparse grasslands and bare areas inside and outside the outer traffic ring (Figure 3 and Table 5). The results indicate that the two study areas have undergone significant and different changes in LULC during the study period. This will lead to a corresponding change in the surface characteristics of these LULC, which implies subsequent changes in land surface albedo and surface energy balance.

4.2. NDVI Analysis

Figure 4 displays the NDVI maps for the cities of Damascus and Aleppo for the three study years, i.e., 2010, 2014, and 2018. Table 6 also shows the statistical results. The results of the NDVI analysis showed that both cities had similar positive and negative values of NDVI in 2010 (before the conflict). After 2014, the NDVI values in Damascus were relatively higher than Aleppo during the study period. The changes in values of the NDVI were largely consistent with the changes in vegetation cover (agricultural land and green areas) in the two cities during the study period. Analysis of the temporal variations in the mean values of the NDVI indicates that the value of this index increased to 0.39 for 2014 in Damascus compared to a value of 0.35 in 2010, while in Aleppo, the value of this index decreased to 0.27 in 2014 after it was 0.37 in 2010 (Table 6). The mean values of the NDVI indicate that the value of the NDVI in 2018 slightly decreased to 0.37 in Damascus compared to 2014, which recorded a value of 0.39 in this city. On the contrary, the mean value of the NDVI increased to a value of 0.33 in the city of Aleppo in 2018 compared to a value of 0.27 in 2014.

4.3. LST Analyses

Figure 5 shows the distribution of spatial patterns of LST values recorded for the cities of Damascus and Aleppo from 2010 to 2018. In general, the maximum and minimum differences in LST ranges are lower in Damascus than in Aleppo during the study period. For 2010, the LST ranged between 24.2 °C and 42.8 °C across the city of Damascus, whereas the LST value ranged between 19.8 °C and 48.0 °C in the city of Aleppo. LST analysis indicates that both cities have approximately the same mean value of LST for this year. The spatial pattern of LST distribution for this year shows that high temperatures appear especially in the urban peripheries and outskirts of both cities. The center of Damascus within the inner traffic ring, where the highly urbanized area is located, exhibits a milder LST compared to the city of Aleppo. A high LST appears over the industrial areas in both cities, but the LST values are higher in Damascus. The large industrial areas in Damascus are located outside the administrative boundaries of the city, while most of the industrial areas of Aleppo are within its administrative borders. The LST for 2014 has increased in both cities. The results showed that the city of Damascus recorded an increase in the mean LST for 2014 by about 5 °C compared to in 2010, while the increase in Aleppo was about 2 °C. The city of Damascus recorded, in 2014, a higher increase in the maximum and minimum LST compared to the city of Aleppo. The difference in these LST in Damascus and Aleppo was 4 °C and 2 °C, respectively, while the difference for the mean LST was 2 °C. For the spatial distribution of LST in 2014, the largest proportion of high LST are distributed beyond the outer traffic ring in both the cities. The center of Damascus (inside the inner traffic ring) shows relatively higher LST for this year than in 2010, while the LST changes in Aleppo were greater for the same period. For the year 2018, Damascus witnessed a decrease in LST compared to Aleppo, which recorded an increase in LST compared to the previous period. The LST in Damascus ranged between 29.69 and 45.38 °C across the city, whereas the LST ranged between 30.0 and 48.1 °C in Aleppo. The mean LST in Damascus and Aleppo was 37.5 and 39.0 °C, respectively. For the spatial distribution of LST in 2018, the areas on the edges of both cities recorded the highest LST. However, in Damascus, the areas that showed high LST have increased, compared to the city of Aleppo.
From the above analysis, it is clear that there are qualitative differences in the intensity and distribution of LST in the cities of Damascus and Aleppo during the years of study. The results also indicate that the spatial pattern of LST in both cites has changed from a scatter pattern in 2010 to a more homogeneous pattern of LST in 2014. However, the scatter pattern reappeared to some extent in both cities in 2018, but with a larger proportion in Damascus.

4.4. Relationship between LST and LULC

The results shown in Table 5 and Table 7 were used to validate if changes in LST are relevant to LULC in both cities. A 2010 linear regression analysis indicates a weak correlation coefficient between LST ranges and the corresponding LULC in both cities (34% for Damascus, 10% for Aleppo) (Figure 6). The linear regression model between LST and LULC in 2014 shows a strong correlation coefficient in both cities, so that this coefficient explains 72% of the spatial relationship between these two variables in Damascus and 68% in Aleppo. For 2018, a weak correlation of 31% between LST and land cover is found for Damascus, compared with a strong correlation of 66% in Aleppo.
The results of the quantitative analysis to determine independent changes in LST for LULCs showed that LST values increased for almost all LULC types in both cities between 2010 and 2018, where this coincided with significant changes in LULC (Table 8). For residential areas, under the influence of changes in LULC, an increase in LST was recorded in Damascus by 5 °C, while this increase was 4 °C in Aleppo. However, due to the nature of the various surface materials of these areas (different canopy structures: concrete, stone, etc.), their LST were not high compared to other urban areas. The calculated results also indicate that high urban areas in both the cities have shown higher LST from 2010 to 2018 than low urban areas. These areas in the city of Damascus recorded LST of 2 to 3 °C higher than in the city of Aleppo for all the study years. The increase ranged from 2 to 4 °C for non-residential urban areas in the city of Damascus and from 2 to 5 °C in the city of Aleppo. Non-residential urban areas associated with military–industrial activity also recorded significantly higher LST than other areas, particularly outside the outer traffic ring in both cities. The increase in LST in military sites such as airports and military barracks, which largely overlap with industrial zones, was about 5 °C in Aleppo and 4 °C in Damascus between 2010 and 2018. In contrast, the LST change was negative with about −8 °C in industrial areas in Aleppo for the same period. The industrial zones located behind the outer traffic ring in the city of Damascus recorded an increase in LST by 2 °C during the study period, which tended to increase in 2018. The results showed that bare areas in both cities recorded a slight increase in temperature between 2010 and 2018 (less than 1 °C). Although agricultural land is directly related to low LST, it has recorded high LST in the cities of Damascus and Aleppo. This increase was 2 °C in Damascus, while this was greater in Aleppo at 3 °C. The results of the LST analysis for the years 2014 and 2018 indicate that the agricultural lands that recorded a high LST are concentrated in the southwest of the cities of Damascus and Aleppo. In general, the green areas of both cities showed a relatively lower LST compared to other land uses, but this was in larger areas of Damascus. These areas in Damascus also showed higher temperatures, by approximately 2 °C, than Aleppo. The spatial distribution of LST within the green areas varied between 2010 and 2018, and this distribution was strongly influenced by the structure of land use and density of vegetation cover, especially inside and beyond the outer traffic ring in both cities.

4.5. Relationship between LST and NDVI

Linear regression analysis indicates a negative relationship between the values of NDVI and the LST values in the two cities over the entire study period (Figure 7). The regression analysis for 2010 showed a strong correlation coefficient between NDVI and LST. For the city of Damascus, 75% of the relationship is explained by NDVI, whereas in Aleppo, the relationship is stronger, at 83%.
For the year 2014, the correlation coefficient in Damascus decreased significantly to 55%. By contrast, the coefficient of determination in Aleppo has increased slightly (2%), so that this coefficient explains 84% of the spatial relationship between these two variables. The low correlation between LST and NDVI in Damascus for the period 2010–2014 shows that there are other possible causes, which are responsible for LST rise. It is possible that these causes are related to uncontrolled industrial and human activities that have emerged in the city as well as local weather conditions. For 2018, the relationship between the two variables LST and NDVI increased in the case of Damascus compared with 2014, which recorded a strong correlation coefficient (70%). In the case of Aleppo, this relationship declined significantly, where the correlation became normal in 2018 (63%) after it was strong in 2014. Spatial analysis of the relationship between LST and NDVI led to the conclusion that the NDVI is largely responsible for the spatial variation patterns of LST in both the cities. This is also confirmed by the analysis of the relationship between spatial distribution of LST and LULC (Figure 6).
The analysis of the relationship between LST and NDVI also showed that the surface temperature value decreases generally with the increasing value of NDVI in both cities during the study period. It has been concluded from the above that the relationship between these two variables is linear (Figure 7).

5. Discussion

In the years preceding the war in Syria, the cities of Damascus and Aleppo experienced a high rate of urbanization. This has been reflected in the continuous construction of buildings and structures as well as the significant expansion of infrastructure. The war broke out in mid-2011, where the consequences of this devastating war represented by population displacement, military operations, and socio-economic crisis had a significant impact on the change in LULC, which appeared in a controlled and uncontrolled increase in urban areas and a decrease in agricultural lands in Damascus, while in Aleppo, this was represented by a decrease in built-up areas, a significant loss of green areas and agricultural lands, and an increase in bare areas. These changes were especially large and rapid in the city of Aleppo between 2014 and 2018 compared to the city of Damascus, which can be attributed to the intense military operations, in addition to other possible causes such as industrial and human activities related to the conflict that appeared in the city of Aleppo, especially after 2016.
As mentioned in the introduction to the study, the degradation or loss of vegetation cover and the presence of unplanned urban activities in urban environments lead to a change in the characteristics of the land surface, which leads to changes in the thermal energy balance and modification of moisture distribution, which, in turn, leads to changes in the local climate, which is represented by a local increase in LST and changes in natural environment services. Therefore, this comparative study focused on monitoring the dynamics of LULC changes and their impact on LST in the cities of Damascus and Aleppo, the two largest cities in Syria.
Quantitative analysis to determine independent changes in LST for LULCs showed that LST values increased for almost all LULC types in both cities during the study period, where this coincided with LULC changes (Table 8). For the two study areas, statistical analysis of changes in LULC between 2010 and 2018 indicates that agricultural land and green areas decreased by 22 and 23% in Damascus and Aleppo, respectively. Additionally, urban or built-up areas increased by 4% between 2010 and 2018 in Damascus. In contrast, urban or built-up areas decreased by 10% over the same period in Aleppo. There was also a corresponding change in the surface properties of these areas, implying subsequent changes in the albedo of the land surface and a significant influence on local temperature modification in urban spaces of the two cities.
The results indicate that the city of Aleppo recorded a higher LST than the city of Damascus during the study period. The results of the study showed that the mean LST had an increasing trend in both cities throughout the study period. Quantitative analysis of LST also indicates that the difference in LST between urban areas within the outer traffic ring and the urban fringe with vegetation cover (agricultural land and green areas) was, on average, 2.8 °C for Damascus and 3.1 °C for Aleppo over the study period. The mean LST differences between urban and suburban areas in both cities increased to approximately 2 °C in Damascus and 3 °C in Aleppo during the study period. This is a characteristic of large cities that have experienced changes in LULC and changes in the functioning of urban ecosystem services [16,24,28,85,86]. The results also indicated that LST values differed according to land use in both cities and the increase in heterogeneity in land cover features, especially in Damascus (Figure 4 and Figure 5).
An analysis of the relationship between LULC classes and LSTs indicates that changes in LST coincided significantly with changes in vegetation cover (agricultural land and green areas) and sparse grasslands with bare lands in both cities. Thus, the relationships between LULC and LST tend to change with changes in vegetation cover in Damascus and Aleppo. The values of the significant correlation coefficient between LST and LULC, and, in particular, in Aleppo, clearly reflect that both bare areas and non-residential areas, which increase at the expense of vegetation cover, cause a rise in LST. The results also showed that the changes in LSTs were closely related to the changes that occurred in non-residential areas in both cities as a result of the change in human activities and the accompanying changes in LULC in these areas during the study period. This can be seen by comparing LULC classes with LST imagery and values (Figure 5 and Table 8). These changes in LULC were especially large and rapid in the city of Aleppo between 2014 and 2018 compared to the city of Damascus, which can be attributed to the intense military operations, in addition to other possible causes such as industrial and human activities related to the conflict that appeared in the city of Aleppo, especially after 2016. All this had a significant impact in modifying the conditions of the near-surface atmosphere as well as the surface temperature in these areas, which was reflected in the increasing trend in LST during the study period.
The results indicate that, after 2010 (as a base year), some non-residential urban areas, especially outside the outer traffic ring, recorded a significantly higher LST than other LULC due to the change in their use and their relation to industrial and military–industrial activity during the years of conflict in both cities. In contrast, other non-residential urban areas recorded lower LST for 2014 and 2018 compared to 2010. Industrial areas that have expanded at the expense of other LULC show a higher LST than other urban areas due to the presence of many artificial heat sources and the nature of building materials with high reflectivity, especially concrete and sheet metal roofs, unlike buildings in homogeneous urban areas (concrete, stone, etc.) that trap more heat during the day [27]. Industrial areas in Damascus city located behind the outer traffic ring recorded an increase in LST of 2 °C during the study period, which tended to increase in 2018 after the fighting subsided in the outskirts of the city, which led to an increase in industrial activity. On the other hand, for the same period, the industrial areas in Aleppo showed a negative change in the surface temperature of the earth, by approximately −8 °C. This can be attributed to the massive decline in industrial activity due to the conditions of the war, as Aleppo was considered the first industrial and economic center in Syria before the conflict (Table 8).
Military sites, such as airports and military barracks, which largely overlap with industrial areas, also recorded an increase in surface temperature during the study period, by approximately 5 °C in Aleppo and 4 °C in Damascus.
The results of the analysis of the spatial pattern of LST distribution in relation to the spatial extent of LULC patterns indicated that the high LST are distributed on the urban fringe and not in the center in both cities during the study period. This is associated with a significant loss of green area and scattered and dense agricultural land, an increase in bare areas, and fragmentation of peri-urban areas. This increase in surface temperature in the edges compared to the city center may appear in large cities whose urban fringes have sparse vegetation cover as well as an increase in unplanned urban activities. Here, local climate change processes may occur at different spatial scales as a result of environmental stress in these peripheral areas [6]. This urban periphery, which is considered exposed, is characterized by a higher reflection of thermal radiation, in contrast to the buildings inside and outside the inner traffic ring, which are largely homogeneous in building materials, and which can store a large part of solar radiation energy during the day [27]. Additionally, this observed variation in the LST distribution between the center and the urban periphery in both cities can be related to what is known as the phenomenon of the urban cold pool or urban cold island (UCI) [87]. This may explain the time of capture of the Landsat images used in this study.
The study also observed that the values of NDVI in the city of Damascus were higher than the values recorded in the city of Aleppo during the study period. However, the spatial extent of the vegetation cover (agricultural land and green areas) in the city of Damascus was much lower than in the city of Aleppo. There was a clear impact of the decrease in vegetation cover and the uncontrolled human activities associated with the conflict in both cities, especially in Aleppo, on the NDVI. The change in land use indicates that the spatial extent of green areas witnessed a significant decrease from 2010 to 2018 inside and outside the inner traffic ring in Aleppo (8 and 14%, respectively), compared to a slight decrease in Damascus for the same period, where this decrease amounted to 2.5 and 4%, respectively. While the area of agricultural land outside the outer traffic ring decreased by 18% in Damascus and 13% in Aleppo. The decline in vegetation cover in the city of Aleppo is primarily due to the acute water crisis, especially in the period between 2012 and 2016, which led to a significant lack of interest in green areas, in addition to the ongoing military operations and poor institutional management during the conflict and the displacement of the population to the countryside and other cities which experienced relatively greater stability, as well as outside the country [88,89,90]. It appears that the main driving factor for the decline in agricultural land in Damascus was the battles, which were concentrated, until 2017, on the outskirts of Damascus, especially in the areas of Eastern Ghouta and Western Ghouta adjacent to agricultural areas [91]. This decline in agricultural land in Damascus can also be attributed to the uncontrolled urban growth witnessed by the city, especially outside the outer traffic ring, as well as to the marginal expansion in urban areas, which was represented by the development of military and security infrastructure at the expense of agricultural land in the north and northwest of the city, especially between 2014 and 2018 [92].
The results of the NDVI obtained in this study for both study areas indicate that the values of this index tend to decrease in general during the study period. This decrease in NDVI is accompanied by a decrease in vegetation cover in both study areas, with an increase in the alteration in the natural environment to other LULC. The results of this study identified the areas of vegetation inside and outside the inner traffic ring in both study areas as areas with higher NDVI and lower LST. With regard to the low LST in the center of the two cities, inside and outside the inner traffic ring, they are distributed in areas with dense and natural vegetation cover and gardens, as well as in fields of dense cultivation, which show high NDVI values. Here, the vegetation, by process of evapo-transpiration, helps reduce LST [6,27]. This high relationship between the high NDVI values and the accompanying low LST within the inner and outer traffic ring of both cities is reinforced by the homogeneous distribution of vegetation cover. Regarding the vegetation cover outside the outer traffic ring of the urban area for both cities, there was no good consistency between the distribution of high NDVI values and low LST values. The urban fringes show different coverage and densities of vegetation cover and clear gradations of degradation due to changes in use over short periods of time. The increase in the values of the NDVI, which is accompanied by an increase in the LST in some areas in the urban area outside the outer traffic ring in both cities, especially in the city of Aleppo, can be attributed to local natural conditions such as high relative humidity in the air, where it is likely that vegetation cover did not affect the LST in these areas. A similar study indicated this scenario [93]. Part of the reason for this could also be related to the application of the NDVI, where it is difficult to extract information on specific types of land uses in urban environments using this index, especially bare lands and urban or built-up areas due to their relative similarities in terms of spectral signature [1,94]. Among the other possible reasons for the low relationship between NDVI and LST in the urban area outside the outer traffic ring in both cities is the concentration of industrial and commercial activities as well as the intense military activity after 2014 due to the war, most notably the city of Aleppo. Due to these intensive activities as well as the use of very poor fuels on a large scale as a result of the aggravation of the energy crisis, heat energy and pollutants, such as soot and black smoke, are released. These pollutants can absorb solar radiation as well as prevent the radiation emitted from the land surface from being released into the atmosphere. All this can contribute to an increase in the LST [27].
The results of the study showed a negative linear relationship between LST and NDVI in the cities of Aleppo and Damascus during the study period, and this means that the decrease in vegetation cover in both cities contributed greatly to the increase in the LST. These findings are consistent with the results reported in other similar studies that were conducted based on the analysis of Landsat data [14,15,95,96,97,98]. In general, the detection of LULC changes and the values of the NDVI and its trend indicate that the vegetation cover within the two cities is not vigorous enough to maintain the energy balance of solar radiation and, therefore, does not contribute enough to maintain the ecosystem functions in the urban spaces of both cities.
There are no previous studies on LST changes in relation to LULC changes before and during the conflict in urban environments in Syria in order to compare the results. Additionally, there is no data on normalized LST to ensure that the LST values retrieved from the remote sensing data are comparable. However, it is possible that there are slight or significant differences in LST when compared with the results of similar studies on Syria. As mentioned in Section 3.1, the Landsat images used in this study were taken on a specific day and time. Since the surface characteristics and solar radiation balance change from time to time and from season to season, this may lead to differences in the spatial distribution of LST in both study areas. This could result in differences in the values and, thus, the power of the specific exponential relationships between LULC and LST as well as between the NDVI and LST, but these relationships are assumed to remain in the same trends. It can also be inferred that both cities are prone to increased LST for the reasons addressed in the analyses presented in this discussion.

6. Conclusions

This study is considered one of the first studies dealing with the spatial determination of land surface temperatures (LST) and their relationship with land use/land cover (LULC) changes using multi-temporal remote sensing data for Syrian cities. This study, as a comparative study on the two largest cities in Syria, Damascus, and Aleppo, which takes into account the conflict conditions and their potential effects on LST as well as LULC, can draw attention with its results. In this study, qualitative and quantitative analyses were conducted to study the relationship between land cover changes and land surface temperature between 2010 (as a base year before the war) and 2018.
In light of the advantages and disadvantages that were encountered in this research, several conclusions were reached: (1) the largest change in LULC was the decline in agricultural lands and green areas and the increase in bare areas in both the cities during the study period. Urban areas (build-up areas) also decreased in Aleppo, while these areas increased in Damascus. The main force for changing LULC in Damascus and Aleppo was the war and the consequent impact of politics, economy, and population distribution. (2) The temporal analysis of the LST showed that the increase and decrease in the LST was largely related to the land use conditions of each city during the years of study. (3) Land cover patterns and changes have contributed to the modification of the local climate and also affected the value and distribution pattern of LST as well as its spatial variation between the center and the urban fringes, primarily through the degradation and loss of vegetation cover. The effect of this was greater in Aleppo than in Damascus. This was represented by the increasing trend in the minimum and maximum LST as well as the increasing trend of the mean LST. (4) In general, the spatial variation of LST was significant between urban areas in the center and suburban areas of both cities in 2010 (before the conflict). This variation was greater in Aleppo, but during the conflict, although the city of Aleppo has a larger vegetation cover, nearly similar LST were recorded in both cities. This means that similar conflict conditions in both cities had a close impact on LULC changes and thus on LST. (5) The relationships between LULC and LST tend to change with changes in vegetation (agricultural land and green areas) cover in Damascus and Aleppo. (6) The vegetation cover effectively contributes to mitigating the LST, especially in the center of the two cities, and this is confirmed by the negative linear relationship between the high normalized difference vegetation index (NDVI) values and the low accompanying LST. (7) The vegetation cover in its current extent cannot maintain the ecosystem services in both cities, as it is still subject to continuous degradation and loss as well as change in its density within short periods of time. This is also reinforced by changes in the characteristics of the surface as well as the local natural conditions for other LULC types.
The approach used in this study was important for detecting changes in LULC, NDVI, and LST. The results also showed that the Landsat images were ideal for monitoring LULC changes and LST and analyzing their spatial relationships. However, it may be problematic to choose images with similar conditions in terms of the environmental and climatic conditions of the urban area as well as the time of acquisition. This can be verified by further studies on the two study areas. An analysis of this relationship between LULC and LST can be carried out using high-resolution satellite images for different seasons of the year in future studies, taking into account local climatic conditions, such as wind speed, relative humidity, topography, as well as functional activities in both cities in greater detail. Therefore, more future investigations will also be required. In light of the current political, social and economic conditions related to the war in Syria, it is difficult to acquire data from field measurements. Therefore, the approach applied in this study, based on remote sensing technology, allows to monitor changes in the LST of cities quickly, accurately, and at low cost.
The persistence of these changes in the sensitive LULC of the ecosystem could make both cities environmentally more vulnerable, especially Damascus, which has more grasslands and bare lands that could, in the future, be converted to built-up areas. Ultimately, this study draws the attention of responsible departments to pay more attention to mitigate the negative impact of changes in LULC, at least to limit the reduction in vegetation cover and increase the number of green spaces in densely populated urban areas that would help reduce LST and contribute to the sustainability of both cities.

Funding

This research was funded by Einstein Foundation Berlin, grant number [EJS-2019-458-2].

Institutional Review Board Statement

Not applicable.

Informed Consent Statement

Not applicable.

Data Availability Statement

To access the data please contact the author.

Acknowledgments

We would like to thank Christoph Schneider for his valuable comments. We would also like to thank the anonymous reviewers and the editors for their valuable comments and suggestions that improved the study considerably. We acknowledge support by the German Research Foundation (DFG) and the Open Access Publication Fund of Humboldt-Universität zu Berlin.

Conflicts of Interest

The author declares no conflict of interest.

Appendix A

Table A1 and Table A2 show the number of samples used to assess the accuracy of classification of LULC in Damascus and Aleppo, as well as the results of the assessment of this classification.
Table A1. Number of samples (Polygons) of each LULC class used to train the classifier in 2010, 2014, and 2018 in Damascus city and Aleppo city.
LULC CategoriesDamascusAleppo
201020142018Total201020142018Total
Urban or built-up area527373198659091246
Agricultural land and green areas556053168687566209
Sparse grasslands and bare areas546356173677870215
Total161196182539200243227670
Table A2. Confusion matrices containing the (adjusted and not-adjusted) accuracy assessment of the LULC categories in Damascus and Aleppo using a (slightly modified) stratified sample for the years 2010, 2014, and 2018. Here, the producer’s accuracy is PA and the user’s accuracy is UA.
Confusion Matrix for Land Use/Cover Classification in Damascus
LULC for 2010123TotalUA (%)
1. Urban or built-up area976811187.4
2. Agricultural land and green areas32122680.8
3. Sparse grasslands and bare areas32768193.8
Total1032986218
PA (%)94.272.488.4
PA adjusted (%)94.172.888.3
Overall accuracy (%)89.0
Overall adjusted accuracy (%)89.0
LULC for 2014123TotalUA (%)
1. Urban or built-up area9061110784.1
2. Agricultural land and green areas12622989.7
3. Sparse grasslands and bare areas53748290.2
Total963587218
PA (%)93.874.385.1
PA adjusted (%)93.874.285.0
Overall accuracy (%)87.2
Overall adjusted accuracy (%)87.1
LULC for 2018123TotalUA (%)
1. Urban or built-up area10231011588.7
2. Agricultural land and green areas11722085.0
3. Sparse grasslands and bare areas43768391.6
Total1072388218
PA (%)90.470.890.0
PA adjusted (%)95.374.086.3
Overall accuracy (%)89.5
Overall adjusted accuracy (%)89.4
Confusion Matrix for Land Use/Cover Classification in Aleppo
LULC for 2010123TotalUA (%)
1. Urban or built-up area13211314690.4
2. Agricultural land and green areas45826490.6
3. Sparse grasslands and bare areas21172085.0
Total1387022230
PA (%)95.682.977.3
PA adjusted (%)95.782.877.3
Overall accuracy (%)89.1
Overall adjusted accuracy (%)90.0
LULC for 2014123TotalUA (%)
1. Urban or built-up area1289314091.4
2. Agricultural land and green areas25055787.7
3. Sparse grasslands and bare areas33273381.8
Total1336235230
PA (%)96.280.777.1
PA adjusted (%)96.280.777.2
Overall accuracy (%)89.1
Overall adjusted accuracy (%)89.1
LULC for 2018123TotalUA (%)
1. Urban or built-up area1156711589.4
2. Agricultural land and green areas5413583.7
3. Sparse grasslands and bare areas56425793
Total1255352230
PA (%)92.077.480.8
PA adjusted (%)92.077.780.6
Overall accuracy (%)86.1
Overall adjusted accuracy (%)86.1

References

  1. Koko, A.F.; Yue, W.; Abubakar, G.A.; Alabsi, A.A.N.; Hamed, R. Spatiotemporal Influence of Land Use/Land Cover Change Dynamics on Surface Urban Heat Island: A Case Study of Abuja Metropolis, Nigeria. ISPRS Int. J. Geo-Inf. 2021, 10, 272. [Google Scholar] [CrossRef]
  2. Reid, R.S.; Kruska, R.L.; Muthui, N.; Taye, A.; Wotton, S.; Wilson, C.J.; Mulatu, W. Land-use and land-cover dynamics in response to changes in climatic, biological and socio-political forces: The case of southwestern Ethiopia. Landsc. Ecol. 2000, 15, 339–355. [Google Scholar] [CrossRef]
  3. Wang, H.; Zhang, Y.; Tsou, J.Y.; Li, Y. Surface Urban Heat Island Analysis of Shanghai (China) Based on the Change of Land Use and Land Cover. Sustainability 2017, 9, 1538. [Google Scholar] [CrossRef] [Green Version]
  4. Alexander, P.J.; Mills, G. Local Climate Classification and Dublin’s Urban Heat Island. Atmosphere 2004, 5, 755–774. [Google Scholar] [CrossRef] [Green Version]
  5. Abuloye, A.P.; Popoola, K.S.; Adewale, A.O.; Onana, V.E.; Elugoke, N.O. Assessment of Daytime Surface Urban Heat Island in Onitsha, Nigeria. In Proceedings of the 2015 International Conference & 29th Annual General Meeting of the Nigerian Meteorological Society, Sokoto, Nigeria, 23–26 November 2015; Available online: https://www.researchgate.net/publication/284720092 (accessed on 12 January 2021).
  6. Palafox-Juárez, E.B.; López-Martínez, J.O.; Hernández-Stefanoni, J.L.; Hernández-Nuñez, H. Impact of Urban Land-Cover Changes on the Spatial-Temporal Land Surface Temperature in a Tropical City of Mexico. ISPRS Int. J. Geo-Inf. 2021, 10, 76. [Google Scholar] [CrossRef]
  7. Bharath, S.; Rajan, K.S.; Ramachandra, T.V. Land Surface Temperature Responses to Land Use Land Cover Dynamics. Geoinform. Geostat. Overv. 2013, 1, 1–10. [Google Scholar]
  8. Glaeser, E.L. A World of Cities: The Causes and Consequences of Urbanization in Poorer Countries. J. Eur. Econ. Assoc. 2014, 12, 1154–1199. [Google Scholar] [CrossRef]
  9. Alavipanah, S.; Wegmann, M.; Qureshi, S.; Weng, Q.; Koellner, T. The role of vegetation in mitigating urban land surface temperatures: A case study of Munich, Germany during the warm season. Sustainability 2015, 7, 4689–4706. [Google Scholar] [CrossRef] [Green Version]
  10. Jiang, Y.; Fu, P.; Weng, Q. Assessing the Impacts of Urbanization-Associated Land Use/Cover Change on Land Surface Temperature and Surface Moisture: A Case Study in the Midwestern United States. Remote Sens. 2015, 7, 4880–4898. [Google Scholar] [CrossRef] [Green Version]
  11. Tan, K.C.; San Lim, H.; MatJafri, M.Z.; Abdullah, K. Landsat data to evaluate urban expansion and determine land use/land cover changes in Penang Island, Malaysia. Environ. Earth Sci. 2010, 60, 1509–1521. [Google Scholar] [CrossRef]
  12. Mallick, J.; Kant, Y.; Bharath, B.D. Estimation of land surface temperature over Delhi using Landsat 7 and ETM+. J. Indian Geophys. Union 2008, 12, 131–140. [Google Scholar]
  13. Liu, Y.; Hiyama, T.; Yamaguchi, Y. Scaling of land surface temperature using satellite data: A case examination on ASTER and MODIS products over a heterogeneous terrain area. Remote Sens. Environ. 2006, 105, 115–128. [Google Scholar] [CrossRef]
  14. Ogashawara, I.; Bastos, V.D.S.B. A Quantitative Approach for Analyzing the Relationship between Urban Heat Islands and Land Cover. Remote Sens. 2012, 4, 3596–3618. [Google Scholar] [CrossRef] [Green Version]
  15. Kaplan, G.; Avdan, U.; Avdan, Z.Y. Urban Heat Island Analysis Using the Landsat 8 Satellite Data: A Case Study in Skopje, Macedonia. Proceedings 2018, 2, 358. [Google Scholar] [CrossRef] [Green Version]
  16. Ramaiah, M.; Avtar, R.; Rahman, M.M. Land Cover Influences on LST in Two Proposed Smart Cities of India: Comparative Analysis Using Spectral Indices. Land 2020, 9, 292. [Google Scholar] [CrossRef]
  17. How Jin Aik, D.; Ismail, M.H.; Muharam, F.M. Land Use/Land Cover Changes and the Relationship with Land Surface Temperature Using Landsat and MODIS Imageries in Cameron Highlands, Malaysia. Land 2020, 9, 372. [Google Scholar] [CrossRef]
  18. Ștefănel-Claudiu, C.; Pavel, I.; Lucian, S. Summer urban heat island of Galați city (Romania) detected using satellite products. PESD 2020, 4, 272. [Google Scholar] [CrossRef]
  19. Porangaba, G.F.O.; Teixeira, D.C.F.; Amorim, M.C.C.T.; da Silva, M.H.S.; Dubreuil, V. Modeling the urban heat island at a winter event in Três Lagoas, Brazil. Urban Clim. 2021, 37, 100853. [Google Scholar] [CrossRef]
  20. Owen, T.; Carlson, T.; Gillies, R. An assessment of satellite remotely-sensed land cover parameters in quantitatively describing the climatic effect of urbanization. Int. J. Remote Sens. 1998, 19, 1663–1681. [Google Scholar] [CrossRef]
  21. Kaya, S.; Basar, U.G.; Karaca, M.; Seker, D.Z. Assessment of Urban Heat Islands Using Remotely Sensed Data. Ekoloji 2012, 21, 107–113. [Google Scholar] [CrossRef] [Green Version]
  22. Schwarz, N.; Lautenbach, S.; Seppelt, R. Exploring indicators for quantifying surface urban heat islands of European cities with MODIS land surface temperatures. Remote Sens. Environ. 2011, 115, 3175–3186. [Google Scholar] [CrossRef]
  23. Zhang, P.; Imhoff, M.L.; Wolfe, R.E.; Bounoua, L. Characterizing Urban Heat Islands of Global Settlements using MODIS and Nighttime Lights Products. Can. J. Remote Sens. 2010, 36, 185–196. [Google Scholar] [CrossRef] [Green Version]
  24. Rahman, M.T.; Aldosary, A.S.; Mortoja, M.G. Modeling Future Land Cover Changes and Their Effects on the Land Surface Temperatures in the Saudi Arabian Eastern Coastal City of Dammam. Land 2017, 6, 36. [Google Scholar] [CrossRef]
  25. Yuan, F.; Bauer, M.E. Comparison of impervious surface area and normalized difference vegetation index as indicators of surface urban heat island effects in Landsat imagery. Remote Sens. Environ. 2007, 106, 375–386. [Google Scholar] [CrossRef]
  26. Cao, L.; Li, P.; Zhang, L.; Chen, T. Remote sensing image-based analysis of the relationship between urban heat island and vegetation fraction. In The International Archives of the Photogrammetry, Remote Sensing and Spatial Information Sciences; 2008; Volume XXXVII, Part B7; pp. 1379–1384. Available online: https://www.isprs.org/proceedings/XXXVII/congress/7_pdf/8_ICWG-VII-IV/04.pdf (accessed on 11 January 2021).
  27. Grover, A.; Singh, B.R. Analysis of Urban Heat Island (UHI) in Relation to Normalized Difference Vegetation Index (NDVI): A Comparative Study of Delhi and Mumbai. Environments 2015, 2, 125–138. [Google Scholar] [CrossRef] [Green Version]
  28. El-Hattab, M.; Amany, S.M.; Lamia, G.E. Monitoring and assessment of urban heat islands over the Southern region of Cairo Governorate, Egypt. Egypt. J. Remote Sens. Space Sci. 2018, 21, 311–323. [Google Scholar] [CrossRef]
  29. Deng, Y.; Wang, S.; Bai, X.; Tian, Y.; Wu, L.; Xiao, J.; Chen, F.; Qian, Q. Relationship among land surface temperature and LUCC, NDVI in typical karst area. Sci. Rep. 2018, 8, 641. [Google Scholar] [CrossRef] [PubMed]
  30. Amiri, R.; Weng, Q.; Alimohammadi, A.; Alavipanah, S.K. Spatial-temporal dynamics of land surface temperature in relation to fractional vegetation cover and land use/cover in the Tabriz urban area, Iran. Remote Sens. Environ. 2009, 113, 2606–2617. [Google Scholar] [CrossRef]
  31. Falahatkar, S.; Hosseini, S.M.; Soffianian, A.R. Relationship between land cover changes and the spatial-temporal dynamics of land surface temperature. Indian J. Sci. Technol. 2011, 4, 76–81. Available online: http://www.indjst.org/index.php/indjst/article/view/29937/25894 (accessed on 11 January 2021). [CrossRef]
  32. Zhang, Z.M.; He, G.; Xiao, R.B.; Wang, W.; Ouyang, Z. Study on the Changes of Urban Heat Island in Beijing Based on Satellite Remote Sensing. 2005. Available online: https://www.researchgate.net/publication/229057155 (accessed on 12 January 2021).
  33. Effat, H.A.; Taha, L.G.; Mansour, K.F. Change detection of land cover and urban heat islands using multi-temporal landsat images, application in Tanta City, Egypt. Open J. Rem. Sens. Position. 2014, 1, 1–15. [Google Scholar] [CrossRef]
  34. Aslan, N.; Koc-San, D. Analysis of relationship between urban heat island effect and land use/cover type using Landsat 7 ETM+ and Landsat 8 OLI images. In Proceedings of the International Archives of the Photogrammetry, Remote Sensing and Spatial Information Sciences, 2016 XXIII ISPRS Congress, Prague, Czech Republic, 12–19 July 2016; Volume XLI-B8, pp. 821–828. Available online: https://www.int-arch-photogramm-remote-sens-spatial-inf-sci.net/XLI-B8/821/2016/isprs-archives-XLI-B8-821-2016.pdf (accessed on 11 January 2021).
  35. Voogt, J.A.; Oke, T.R. Thermal Remote Sensing of Urban Climates. Remote Sens. Environ. 2003, 86, 370–384. [Google Scholar] [CrossRef]
  36. Sfîcă, L.; Ichim, P.; Apostol, L.; Ursu, A. The extent and intensity of the urban heat island in Iași city, Romania. Theor. Appl. Climatol. 2018, 134, 777–791. [Google Scholar] [CrossRef]
  37. Zhou, D.; Zhao, S.; Liu, S.; Zhang, L.; Zhu, C. Surface urban heat island in China’s 32 major cities: Spatial patterns and drivers. Remote Sens. Environ. 2014, 152, 51–61. [Google Scholar] [CrossRef]
  38. Climate of Damascus and the Barada Valley. Sunshine Guide to the Damascus Area, Syria. Available online: http://www.climates.com/ASIA/SYR.htm (accessed on 12 April 2021).
  39. Kottek, M.; Grieser, J.; Beck, C.; Rudolf, B.; Rubel, F. World Map of the Köppen-Geiger climate classification updated. Meteorol. Z. 2006, 15, 259–263. [Google Scholar] [CrossRef]
  40. Climate of Damascus. Available online: https://www.meteoblue.com/en/weather/forecast/modelclimate/damascus_syria_170654 (accessed on 2 April 2021).
  41. Klimatafel von Aleppo (Halab)/Syrien. Available online: http://www.dwd.de/DWD/klima/beratung/ak/ak_400070_kt.pdf (accessed on 2 April 2019).
  42. Syrian Arab Republic: Whole of Syria Protection Sector—2018 Protection Needs Overview (October 2017). Available online: https://reliefweb.int/report/syrian-arab-republic/syrian-arab-republic-whole-syria-protection-sector-2018-protection-needs (accessed on 11 November 2018).
  43. Statistical abstracts of central Bureau of Statistics (CBS). Statistical Abstract for Years: 2010, 2014, 2017 and 2018. Available online: http://cbssyr.sy/yearbook-EN.htm (accessed on 11 February 2021).
  44. Aleppo Rebuilds Itself from Destruction of War, 25 October 2017. Available online: https://www.irishtimes.com/news/world/middle-east/aleppo-rebuilds-itself-from-destruction-of-war-1.3267526 (accessed on 11 April 2021).
  45. Aleppo Looks to Rebuild after Years of War, 8 August 2017. Available online: https://www.trtworld.com/mea/unesco-needs-local-help-to-rebuild-aleppo-417651 (accessed on 11 April 2021).
  46. USGS. Landsat Data Sets. Available online: https://earthexplorer.usgs.gov/ (accessed on 11 March 2020).
  47. Irons, J.R.; Dwyer, J.L.; Barsi, J.A. The next landsat satellite: The Landsat data continuity mission. Remote Sens. Environ. 2012, 122, 11–21. [Google Scholar] [CrossRef] [Green Version]
  48. Wulder, M.A.; Masek, J.G.; Cohen, W.B.; Loveland, T.R.; Woodcock, C.E. Opening the archive: How free data has enabled the science and monitoring promise of Landsat. Remote Sens. Environ. 2012, 122, 2–10. [Google Scholar] [CrossRef]
  49. Mohamed, M.A.; Anders, J.; Schneider, C. Monitoring of Changes in Land Use/Land Cover in Syria from 2010 to 2018 Using Multitemporal Landsat Imagery and GIS. Land 2020, 9, 226. [Google Scholar] [CrossRef]
  50. Mohamed, M.A. An Assessment of Forest Cover Change and Its Driving Forces in the Syrian Coastal Region during a Period of Conflict, 2010 to 2020. Land 2021, 10, 191. [Google Scholar] [CrossRef]
  51. Aleppo Drone HD Stock Images. Available online: https://www.shutterstock.com/de/search/aleppo+drone (accessed on 10 April 2021).
  52. Liu, J.G.; Mason, P.J. Essential Image Processing and GIS for Remote Sensing; John Wiley & Sons Ltd.: Chichester, UK, 2009; pp. 1–443. [Google Scholar] [CrossRef]
  53. Wu, C.; Du, B.; Cui, X.; Zhang, L. A post—Classification change detection method based on iterative slow feature analysis and Bayesian soft fusion. Remote Sens. Environ. 2017, 199, 241–255. [Google Scholar] [CrossRef]
  54. Zhou, J.Q.; Ye, Q.; Shao, Y.S.; Zhu, S.L.; Guan, Z.Q. Principles and Application of Remote Sensing; Wuhan University Press: Wuhan, China, 2014; pp. 1–294. [Google Scholar]
  55. Song, C.; Woodcock, C.E.; Seto, K.C.; Lenney, M.P.; Macomber, S.A. Classification and change detection using Landsat TM data: When and how to correct atmospheric effects? Remote Sens. Environ. 2001, 75, 230–244. [Google Scholar] [CrossRef]
  56. Mather, P.M.; Koch, M. Computer Processing of Remotely-Sensed Images: An Introduction, 3rd ed.; John Wiley and Sons: Chichester, UK, 2011; pp. 325–375. [Google Scholar]
  57. Image Analysis with ENVI, ENVI Tutorials. Available online: https://www.l3harrisgeospatial.com/docs/tutorials.html (accessed on 12 February 2021).
  58. ArcGIS Desktop of Esri. Available online: https://desktop.arcgis.com/en/arcmap/ (accessed on 13 January 2021).
  59. Wang, J.; Kuffer, M.; Pfeffer, K. The role of spatial heterogeneity in detecting urban slums. Comput. Environ. Urban Syst. 2019, 73, 95–107. [Google Scholar] [CrossRef]
  60. Al-Fares, W. Historical Land Use/Land Cover Classification Using Remote Sensing—A Case Study of the Euphrates River Basin in Syria; Springer: Berlin/Heidelberg, Germany, 2012; Available online: https://link.springer.com/content/pdf/10.1007%2F978-3-319-00624-6.pdf (accessed on 25 January 2021).
  61. Rahimi, A. A methodological approach to urban land-use change modeling using infill development pattern—A case study in Tabriz, Iran. Ecol. Process. 2016, 5, 1–15. [Google Scholar] [CrossRef] [Green Version]
  62. EL-Hattab, M. Applying post classification change detection technique to monitor an Egyptian Coastal Zone (Abu Qir Bay). Egypt. J. Remote Sens. Space Sci. 2016, 19, 23–36. [Google Scholar] [CrossRef] [Green Version]
  63. Doaemo, W.; Mohan, M.; Adrah, E.; Srinivasan, S.; Dalla Corte, A.P. Exploring Forest Change Spatial Patterns in Papua New Guinea: A Pilot Study in the Bumbu River Basin. Land 2020, 9, 282. [Google Scholar] [CrossRef]
  64. Hammad, M.; Mucsi, L.; Boudewijn van Leeuwen, V. Land cover change investigation in the southern syrian coastal basins during the past 30-years using Landsat remote sensing data. J. Environ. Geogr. 2018, 11, 45–51. [Google Scholar] [CrossRef] [Green Version]
  65. Foody, G.M.; Mathur, A.; Sanchez-Hernandez, C.; Boyd, D.S. Training set size requirements for the classification of a specific class. Remote Sens. Environ. 2006, 104, 1–14. [Google Scholar] [CrossRef]
  66. Lillesand, M.T.; Kiefer, R.W.; Chipman, J.W. Remote Sensing and Image Interpretation, 7th ed.; Wiley Global Education: Hoboken, NJ, USA, 2015; pp. 517–555. [Google Scholar]
  67. Congalton, R.G. A review of assessing the accuracy of classifications of remotely sensed data. Remote Sens. Environ. 1991, 37, 35–46. [Google Scholar] [CrossRef]
  68. Congalton, R.G.; Green, K. Assessing the Accuracy of Remotely Sensed Data: Principles and Practices, 2nd ed.; CRC Press Taylor & Francis Group: Boca Raton, FL, USA, 2009; pp. 121–140. [Google Scholar] [CrossRef]
  69. FAO. Map Accuracy Assessment and Area Estimation: A Practical Guide; FAO: Rome, Italy, 2016; pp. 31–34. Available online: http://www.fao.org/3/a-i5601e.pdf (accessed on 25 January 2021).
  70. Panigrahy, R.K.; Kale, M.P.; Dutta, U.; Mishra, A.; Banerjee, B.; Singh, S. Forest cover change detection of Western Ghats of Maharashtra using satellite remote sensing based visual interpretation technique. Curr. Sci. 2010, 98, 657–664. Available online: https://www.jstor.org/stable/24111818?seq=1#metadata_info_tab_contents (accessed on 25 January 2021).
  71. Köhl, M.; Magnussen, S.S.; Marchetti, M. Sampling Methods, Remote Sensing and GIS Multiresource Forest Inventory, 3rd ed.; Springer: Berlin/Heidelberg, Germany, 2006; pp. 71–195. [Google Scholar] [CrossRef]
  72. Eklund, L.; Persson, A.; Petter Pilesjo, P. Cropland changes in times of conflict, reconstruction, and economic development in Iraqi Kurdistan. Ambio 2016, 45, 78–88. [Google Scholar] [CrossRef] [PubMed] [Green Version]
  73. Olofsson, P.; Foody, G.M.; Herold, M.; Stehman, S.V.; Woodcock, C.E.; Wulder, M.A. Good practices for estimating area and assessing accuracy of land change. Remote Sens. Environ. 2014, 148, 42–57. [Google Scholar] [CrossRef]
  74. Olofsson, P.; Foody, G.M.; Foody, G.M.; Stehman, S.V.; Woodcock, C.E.; Wulder, M.A. Making better use of accuracy data in land change studies: Estimating accuracy and area and quantifying uncertainty using stratified estimation. Remote Sens. Environ. 2013, 129, 122–131. [Google Scholar] [CrossRef]
  75. Irish, R.R.; NASA. Landsat 7 Science Data Users Handbook. 2000; pp. 415–430. Available online: https://www.usgs.gov/core-science-systems/nli/landsat/landsat-7-data-users-handbook (accessed on 2 June 2020).
  76. Ihlen, V. Landsat 8 (L8) Data Users Handbook. U.S. Geological Survey. 2019. Available online: https://www.usgs.gov/core-science-systems/nli/landsat/landsat-8-data-users-handbook (accessed on 4 February 2020).
  77. Xu, H.; Chen, Y.; Dan, S.; Qiu, W. Dynamical monitoring and evaluation methods to urban heat island effects based on RS&GIS. Procedia Environ. Sci. 2011, 10, 1228–1237. [Google Scholar] [CrossRef] [Green Version]
  78. Ding, F.; Xu, H.Q. Comparison of three algorithms for retrieving land surface temperature from LANDSAT TM thermal infrared band. J. Fujian Norm. Univ. (Nat. Sci. Sci. Ed.) 2008, 24, 91–96. Available online: http://en.cnki.com.cn/Article_en/CJFDTOTAL-FJSZ200801023.htm (accessed on 13 January 2021).
  79. Weng, Q.; Lu, D. A sub-pixel analysis of urbanization effect on land surface temperature and its interplay with impervious surface and vegetation coverage in Indianapolis, United States. Int. J. Appl. Earth Obs. Geoinf. 2008, 10, 68–83. [Google Scholar] [CrossRef]
  80. Sobrino, J.A.; Jiménez-Muñoz, J.C.; Paolini, L. Land surface temperature retrieval from LANDSAT TM 5. Remote Sens. Environ. 2004, 90, 434–440. [Google Scholar] [CrossRef]
  81. Quintano, C.; Fernández-Manso, A.; Calvo, L.; Marcos, E.; Valbuena, L. Land surface temperature as potential indicator of burn severity in forest Mediterranean ecosystems. Int. J. Appl. Earth Obs. Geoinf. 2015, 36, 1–12. [Google Scholar] [CrossRef]
  82. Lim, H.S.; Jafri, M.; Abdullah, K.; Alsultan, S. Application of a simple mono window land surface temperature algorithm from Landsat ETM over Al Qassim, Saudi Arabia. Sains Malays. 2012, 41, 841–846. Available online: http://journalarticle.ukm.my/5296/1/05%2520H%2520S%2520Lim.pdf (accessed on 13 January 2021).
  83. Anderson, J.R.; Hardy, E.E.; Roach, J.T.; Witmer, R.E. A Land Use and Land Cover Classification System for Use with Remote Sensor Data; Geological Survey Professional: Paper 964; United States Government Printing Office: Washington, DC, USA, 1976. [CrossRef] [Green Version]
  84. Lins, K.S.; Kleckner, R.L. LC Mapping: An Overview and History of the Concepts. In Gap Analysis: A Landscape Approach to Biodiversity Planning; Scott, J.M., Tear, T.H., Davis, W.F., Eds.; American Society for Photogrammetry and Remote Sensing: Bethesda, MD, USA, 1996; pp. 57–65. [Google Scholar]
  85. Chen, X.L.; Zhao, H.M.; Li, P.X.; Yin, Z.Y. Remote sensing image-based analysis of the relationship between urban heat island and land use/cover changes. Remote Sens. Environ. 2006, 104, 133–146. [Google Scholar] [CrossRef]
  86. Hidalgo García, D.; Arco Díaz, J. Spatial and Multi-Temporal Analysis of Land Surface Temperature through Landsat 8 Images: Comparison of Algorithms in a Highly Polluted City (Granada). Remote Sens. 2021, 13, 1012. [Google Scholar] [CrossRef]
  87. Gonçalves, A.; Ornellas, G.; Castro Ribeiro, A.; Maia, F.; Rocha, A.; Feliciano, M. Urban Cold and Heat Island in the City of Bragança (Portugal). Climate 2018, 6, 70. [Google Scholar] [CrossRef] [Green Version]
  88. Syrian Arab Republic: 2019 Humanitarian Response Plan (January–December 2019). Available online: https://reliefweb.int/report/syrian-arab-republic/syrian-arab-republic-2019-humanitarian-response-plan-january-december-0 (accessed on 11 November 2020).
  89. Syria: ICRC Works to Avoid Massive Water Crisis in Aleppo. Available online: https://www.icrc.org/en/document/syria-icrc-water-crisis-aleppo (accessed on 22 November 2020).
  90. Syria: UN Provides Emergency Water Around Aleppo, as 1.8 Million Cut Off from Water Supply. Available online: https://news.un.org/en/story/2017/02/550932-syria-un-provides-emergency-water-around-aleppo-18-million-cut-water-supply (accessed on 22 November 2020).
  91. Breaking Ghouta: Siege, Access, and Aid. Available online: https://www.publications.atlanticcouncil.org/breakingghouta/siege-access-aid/ (accessed on 17 November 2020).
  92. IRGC Has Established Several Military Bases across Syria, Says Arab Paper. Available online: https://www.mei.edu/publications/irgc-has-established-several-military-bases-across-syria-says-arab-paper (accessed on 26 November 2020).
  93. Hua, A.K.; Ping, O.W. The influence of land-use/land-cover changes on land surface temperature: A case study of Kuala Lumpur metropolitan city. Eur. J. Remote Sens. 2018, 51, 1049–1069. [Google Scholar] [CrossRef] [Green Version]
  94. Ma, X.; Li, C.; Tong, X.; Liu, S. A New Fusion Approach for Extracting Urban Built-up Areas from Multisource Remotely Sensed Data. Remote Sens. 2019, 11, 2516. [Google Scholar] [CrossRef] [Green Version]
  95. Liu, L.; Zhang, Y. Urban heat island analysis using the Landsat TM data and ASTER data: A case study in Hong Kong. Remote Sens. 2011, 3, 1535–1552. [Google Scholar] [CrossRef] [Green Version]
  96. Kumar, K.S.; Bhaskar, P.U.; Padmakumari, K. Estimation of land surface temperature to study urban heat island effect using LANDSAT ETM+ image. Int. J. Eng. Sci. Technol. 2012, 4, 771–778. Available online: https://pdfs.semanticscholar.org/2107/2a64dc1fbf115e141e5ac98e4fc5fc69a15f.pdf (accessed on 11 January 2021).
  97. Guo, G.; Wu, Z.; Xiao, R.; Chen, Y.; Liu, X.; Zhang, X. Impacts of urban biophysical composition on land surface temperature in urban heat island clusters. Landsc. Urban Plan. 2015, 135, 1–10. [Google Scholar] [CrossRef]
  98. Duy, X.; Tran, D.X.; Pla, F.; Latorre-Carmona, P.; Myint, W.S.; Caetano, M.; Kieua, V.H. Characterizing the relationship between land use land cover change and land surface temperature. ISPRS J. Photogramm. Remote Sens. 2017, 124, 119–132. [Google Scholar] [CrossRef] [Green Version]
Figure 1. Location of the study areas Damascus and Aleppo in Syria. The background is Landsat 8 OLI images of 2018 (false colors composite of band 6-5-4 as red, green, and blue (RGB) color).
Atmosphere 12 01037 g001
Figure 2. Divisions of the study areas in three levels in accordance with the classification of land use patterns and the traffic rings. The background is Landsat 8 OLI images of 2018 (band 6-5-4 as RGB).
Atmosphere 12 01037 g002
Figure 3. Time series of LULC maps of the study area between 2010 and 2018. The area (in %) of LULC categories after calculating adjusted area estimates.
Atmosphere 12 01037 g003
Figure 4. NDVI Spatial Distribution in Damascus and Aleppo between 2010 and 2018.
Atmosphere 12 01037 g004
Figure 5. Spatial distribution of LST in Damascus and Aleppo between 2010 and 2018.
Atmosphere 12 01037 g005
Figure 6. Linear regression analysis between the LST ranges (mean in °C) and the size of the corresponding LULC for Damascus in 2010 (a), 2014 (b), and 2018, (c) and for Aleppo in 2010 (d), 2014 (e), and 2018 (f).
Atmosphere 12 01037 g006
Figure 7. Linear regression analysis between LST and NDVI for Damascus in 2010 (a), 2014 (b), and 2018 (c) and for Aleppo in 2010 (d), 2014 (e), and 2018 (f).
Atmosphere 12 01037 g007
Table 1. Characteristics of Landsat-5 Thematic Mapper (TM) and Landsat-8 operational land imager (OLI) images used in the study [46].
Damascus
Year201020142018
SensorLandsat-5 TMLandsat-8 OLILandsat8 OLI
Scene path-row174–37174–37174–37
Date (yyyy/mm/dd)2010/04/232014/04/182018/04/13
Spatial resolution30 × 30 m30 × 30 m30 × 30 m
Time (GMT)08:01:3308:10:3708:09:32
Thermal channelsBand 6 = TIR
10.4–12.5 µm (120 × 120 m)
Band 10 = TIRS 1
10.6–11.19 µm (100 × 100 m)
Band 10 = TIRS 1
10.6–11. 19 µm (100 × 100 m)
Aleppo
Year201020142018
SensorLandsat-5 TMLandsat-8 OLILandsat8 OLI
Scene path-row174–35174–35174–35
Date (yyyy/mm/dd)2010/04/232014/04/182018/04/13
Time (GMT)08:00:4508:10:1908:09:44
Spatial resolution30 × 30 m30 × 30 m30 × 30 m
Thermal channelsBand 6 = TIR
10.4–12.5 µm (120 × 120 m)
Band 10 = TIRS 1
10.6–11.19 µm (100 × 100 m)
Band 10 = TIRS 1
10.6–11.19 µm (100 × 100 m)
Table 2. Definitions of land use/land cover (LULC) categories in study area.
LULCDefinitions
Urban or built-up areaBuilt-up areas and settlements; non-built-up areas (pen structures related to human activities, such as quarries).
Agricultural land and green areasAreas cultivated with crops: horticultural crops (tree crops, field and vegetable crops, which are grown on small plots receiving intensive inputs). Green and open areas in the urban areas (gardens parks, and green belts). Forest areas and other wooded areas.
Sparse grasslands and bare areasSparse grasslands and shrublands of rocky hills and arid lands. Unvegetated land, exposed rocks, bare areas and burnt out areas.
Table 3. Development Levels according to urban planning in Damascus and Aleppo in accordance with the traffic rings.
Development LevelsDefinitions
City center (inner-city core) within the inner traffic ringWhich is characterized by very dense residential areas and commercial buildings.
Semi-urban/urban fringe between the inner and outer traffic ringsWhich is characterized by dense residential areas, commercial and industrial structure and some small farming areas.
Rural outer fringe beyond the outer traffic ringWhich is characterized by low to moderate density residential neighborhoods, farming lands, and natural environment such as sparse grasslands and bare areas, except several major industrial areas such as the Aleppo industrial area in the northeast (industrial area Sheikh Najjar) and in the south of Aleppo (industrial area Ar-Ramouseh) and the industrial areas in the south of Damascus.
Table 4. Rules for dividing the intervals and ranges of land surface temperature (LST) into seven categories for both study areas, adapted from [3].
Interval of LSTRange of LST (°C)
Low temperatureLst < Tavg + 2Std
Sub-low temperatureTavg − 2StdLst ≤ Tavg − Std
Sub-medium temperatureTavg − StdLst ≤ Tavg − Std/2
Medium temperatureTavg − Std/2Lst ≤ Tavg + Std/2
Sub-high temperatureTavg + Std/2Lst ≤ Tavg + Std
High temperatureTavg + StdLst ≤ Tavg + 2Std
Extreme high temperatureLst > Tavg + 2Std
Lst is land surface temperature. Tavg is the average Lst. Std is standard deviation.
Table 5. Area estimates in hectare (ha) and percentage share (%) of each LULC category between 2010 and 2018 in Damascus and Aleppo after computing adjusted area estimate.
Area Estimate for LULC in Damascus for 2010 (in ha)
LULC CategoryArea Calculated Based on PixelsAdjusted Area EstimateAdjusted Area of Total AreaConfidence Interval (±)
1. Urban or built-up area5948.05521.147.3%447.0
2. Agricultural land and green areas1418.91573.913.5%364.0
3. Sparse grasslands and bare areas4308.04579.939.2%395.0
Area Estimate for LULC in Damascus for 2014 (in ha)
LULC CategoryArea Calculated Based on PixelsAdjusted Area EstimateAdjusted Area of Total AreaConfidence Interval (±)
1. Urban or built-up area5754.25160.044.2%472.0
2. Agricultural land and green areas1546.71869.016.0%355.0
3. Sparse grasslands and bare areas4374.04645.039.8%460.0
Area Estimate for LULC in Damascus for 2018 (in ha)
LULC CategoryArea Calculated Based on PixelsAdjusted Area EstimateAdjusted Area of Total AreaConfidence Interval (±)
1. Urban or built-up area6170.25739.949.2%426.0
2. Agricultural land and green areas1074.51234.410.6%307.0
3. Sparse grasslands and bare areas4430.24700.540.3%440.0
Area Estimate for LULC in Aleppo for 2010 (in ha)
LULC CategoryArea Calculated Based on PixelsAdjusted Area EstimateAdjusted Area of Total AreaConfidence Interval (±)
1. Urban or built-up area9164.18659.960.1%528.0
2. Agricultural land and green areas3987.64366.930.3%502.0
3. Sparse grasslands and bare areas1253.11378.09.6%339.0
Area Estimate for LULC in Aleppo for 2014 (in ha)
LULC CategoryArea Calculated Based on PixelsAdjusted Area EstimateAdjusted Area of Total AreaConfidence Interval (±)
1. Urban or built-up area8761.28324.057.8%488.0
2. Agricultural land and green areas3574.43887.027.0%514.0
3. Sparse grasslands and bare areas2069.22194.015.2%437.0
Area Estimate for LULC in Aleppo for 2018 (in ha)
LULC CategoryArea Calculated Based on PixelsAdjusted Area EstimateAdjusted Area of Total AreaConfidence Interval (±)
1. Urban or built-up area7996.37812.854.2%562.0
2. Agricultural land and green areas3117.63356.023.3%522.0
3. Sparse grasslands and bare areas3290.93236.022.5%526.0
Table 6. Value of normalized difference vegetation index (NDVI) for Damascus and Aleppo for the period between 2010 and 2018.
YearDamascusAleppo
NDVI, min.NDVI, max.NDVI, Mean (All Pixels)NDVI, min.NDVI, max.NDVI, Mean (All Pixels)
2010−0.140.640.35−0.150.630.37
2014−0.030.580.39−0.020.440.27
2018−0.030.570.36−0.050.550.33
Table 7. LST interval values (°C) and corresponding LULC size (ha) during the analyzed time period.
Damascus
Interval of LSTRange of LST (°C) 2010Area (ha) 2010Range of LST (°C) 2014Area (ha) 2014Range of LST (°C) 2018Area (ha) 2018
Low temperature24.2–28.91060.029.6–33.11684.329.7–33.61120.0
Sub-low temperature28.9–30.63052.033.1–34.43442.233.6–34.92590.5
Sub-medium temperature30.6–32.22835.334.5–35.82740.834.9–36.22626.8
Medium temperature32.2–33.82175.935.8–37.42151.836.2–37.62316.1
Sub-high temperature33.8–35.81588.737.4–39.61213.437.6–39.21606.1
High temperature35.8–38.6722.139.6–43.6445.839.2–41.3998.2
Extreme high temperature38.6–42.8252.0043.6–49.27.841.3–45.4428.4
Aleppo
Interval of LSTRange of LST (°C) 2010Area (ha) 2010Range of LST (°C) 2014Area (ha) 2014Range of LST (°C) 2018Area (ha) 2018
Low temperature19.8–30.5798.427.9–31.62247.330.0–35.12223.2
Sub-low temperature30.5–32.22559.331.6–33.02936.135.07–36.42946.7
Sub-medium temperature32.9–33.42705.033.0–34.52365.036.4–37.92494.4
Medium temperature33.4–35.02918.234.5–36.02448.637.9–39.42323.2
Sub-high temperature35.0–36.92723.936.0–37.52100.439.4–41.02159.1
High temperature37.0–38.91797.837.5–39.31549.941.0–42.91477.4
Extreme high temperature38.9–48.7902.239.3–43.4757.543.0–48.1780.8
Table 8. LST values (mean in °C) for each LULC type in Damascus and Aleppo between 2010 and 2018.
DamascusAleppo
LULC201020142018201020142018
Residential areas30.231.634.929.730.433.9
Non-residential areas33.834.336.733.036.138.4
Agricultural land32.232.34.138.635.1641.7
Industrial areas37.038.639.448.041.441.6
Green areas32.232.334.329.329.734.6
Bare land36.536.637.437.037.838.0
Road35.035.037.835.436.437.7
Airport42.843.045.439.440.141.6
Military zone36.637.140.334.635.439.8
Publisher’s Note: MDPI stays neutral with regard to jurisdictional claims in published maps and institutional affiliations.

