Article

Levels, Sources, and Health Damage of Dust in Grain Transportation and Storage: A Case Study of Chinese Grain Storage Companies

1
Academy of National Food and Strategic Reserves Administration, Beijing 100037, China
2
School of Emergency Management and Safety Engineering, China University of Mining and Technology-Beijing, Beijing 100083, China
*
Author to whom correspondence should be addressed.
Atmosphere 2021, 12(8), 1025; https://doi.org/10.3390/atmos12081025
Submission received: 16 July 2021 / Revised: 5 August 2021 / Accepted: 9 August 2021 / Published: 11 August 2021
(This article belongs to the Special Issue Assessing Atmospheric Pollution and Its Impacts on the Human Health)

Abstract

:
A large amount of mixed dust exists in grain, which can easily stimulate the respiratory system and cause diseases. This study explored contamination levels and health effects of this grain dust. A total of 616 dust samples from different stages and types of grain were collected in China—in Hefei (Anhui), Shenzhen (Guangdong), Chengdu (Sichuan), Changchun (Jilin), and Shunyi (Beijing)—and analyzed using the filter membrane method and a laser particle size analyzer. A probabilistic risk assessment model was developed to explore the health effects of grain dust on workers in the grain storage industry based on the United States Environmental Protection Agency risk assessment model and the Monte Carlo simulation method. Sensitivity analysis methods were used to analyze the various exposure parameters and influencing factors that affect the health risk assessment results. This assessment model was applied to translate health risks into disability-adjusted life years (DALY). The results revealed that the concentration of dust ranged from 25 to 70 mg/m3, which followed normal distribution and the proportion of dust with a particle size of less than 10 μm exceeded 10%. Workers in the transporting stage were exposed to the largest health risk, which followed a lognormal distribution. The average health risks for workers in the entering and exiting zones were slightly below 2.5 × 10⁻⁵. The sensitivity analysis indicated that average time, exposure duration, inhalation rate, and dust concentration made great contributions to dust health risk. Workers in the grain storage and transportation stage had the health damage, and the average DALY exceeded 0.4 years.

Graphical Abstract

1. Introduction

Grain is an important foundation of national security. The scale of grain storage and the function of facilities determine the national grain circulation capacity. There are many occupational hazards that can affect the health of workers in the process of grain storage. Grain contains a large amount of mixed dust, including grain husks, bacteria, pests, microorganisms, and mixed fine sand [1]. Grain dust is a companion in the whole life cycle of modern grain, from purchase to storage, transportation, and processing. It is produced due to friction, collision, extrusion, crushing, etc. [2]. The particle size distribution of dust is approximately normal, ranging in size from 0 to 9.6 × 10⁵ nm, with a true density within the range of 1.1–1.8 g/m3 [3]. During the storage process, grain is constantly tumbling, and the dust particles are continuously separated under the influence of air flow. The instantaneous contact mass concentration can reach up to 1000 mg/m3, and the time-weighted average allowable concentration is about 40 mg/m3. Workers are often exposed to inhalable dust of >10 mg/m3, and higher exposures can be found at the grain in-warehousing and out-warehousing stages [4].
Dust can cause serious environmental pollution, grain quality decline, mechanical equipment wear, and, more importantly, it also threatens the health of grain warehouse operators. Studies have shown that long-term exposure to high-concentration grain storage dust can easily irritate the respiratory system [5]. When accumulated after inhalation, it can cause allergic reactions [6] and cereal fever syndrome [7]. In severe cases, it may cause respiratory diseases such as pneumoconiosis, hardening of the respiratory organs, and recurrent nocturnal asthma [8]. Dust can also enter the blood with human cells, which can cause further cardiovascular and cerebrovascular diseases [9]. Due to its potential hazards, monitoring grain dust, studying its distribution rules, and quantifying the health damage are important steps in effectively recognizing and measuring the health hazards of dust.
Researchers have recently begun to pay more attention to the physical and chemical properties [10], sources [11], explosive characteristics [12,13,14], prevention measures [15], and mycotoxin content [16,17] of grain dust. When conducting occupational hazard analysis, the toxicological characteristics [18], the mechanism of action on the respiratory tract [19], and the clinical manifestations of diseases [20] related to grain dust have mostly been analyzed from a medical perspective, and there is a lack of quantitative evaluation of its health damage.
Dust health damage assessment has been carried out with reference to coal mines, construction, atmospheric environment, and other fields using deterministic analysis methods. For example, Behrooz et al. assessed the carcinogenic and non-carcinogenic health risks for three exposure pathways in airborne dust samples (TSP and PM2.5) in Zabol, Iran during the summer dust period [21]; Guney et al. characterized contaminated soils (n = 6) and mine tailings samples (n = 3) for As, Cu, Fe, Mn, Ni, Pb, and Zn content and assessed elemental lung bioaccessibility in fine fraction [22]; Donghua et al. proposed an occupational health hazard risk assessment matrix method to rank the hazards of various risk factors in mining and mineral processing [23]; Lim et al. investigated the contamination levels and dispersion patterns of heavy metals and assessed the risk of health effects on the residence in the vicinity of the abandoned Songcheon Au-Ag mine, Korea [24]; Kan et al. calculated the health damage of air particulate pollution based on the epidemiological exposure–response function [25]; Zhang M. et al. assessed particulate pollution risk and quantified the public health damage caused by air emissions in Beijing in the period 2000–2004 [26]; Liu E. et al. labeled the indicative metals relating to non-exhaust traffic emissions and assessed anthropogenic sources of metals in TR dusts, combining their spatial pollution patterns, principal component analysis, and Pb isotopic compositions [27]; Zhang Y. et al. analyzed eight heavy metals (Cr, Ni, Cu, Cd, Pb, Zn, Mn, and Co) in the PM2.5, collected during four different seasons in Taiyuan, a typical coal-burning city in northern China [28]; Chen X. et al. established a health risk assessment system based on on-site measurements and assessed the health risks for a tunnel machine employee [29]; Zheng et al. investigated the heavy metal contamination in the street dust due to metal smelting in the industrial district of Huludao city and elucidated the spatial distribution of Hg, Pb, Cd, Zn, and Cu in the street dust [30]; Tahir et al. described the estimation of particulate matter (cotton dust) with different sizes in small-scale weaving industry (power looms) situated in district Hafizabad, Punjab, Pakistan, and the assessment of health problems of workers associated with these pollutants [31]; Zazouli et al. investigated the mineralogy, micro-morphology, chemical characteristics, and oxidation toxicity of respirable dusts generated in underground coal mines and assessed the health risk by EPA’s health risk model [32]; and Li X et al. introduced the disability-adjusted life year (DALY) model for damage to human health caused by construction dust, to evaluate the environmental impact during the construction process [33]. Scholars have studied the health risks of dust from the perspective of components of heavy metals and the construction of a risk assessment model, which have laid the foundation for the risk assessment of grain dust. However, there are few studies evaluating the health damage caused by grain dust, despite the importance of grain storage and transport in the process of ensuring grain security. This study is particularly timely, as the circulation of grain in the market is accelerating, so a large amount of grain dust will be generated in specific areas. Inhalation is considered to be the main route of human exposure to grain dust [34]. The present research is of great significance for understanding the health status of grain warehouse personnel, as there is a need to evaluate the hazard to human health posed by the grain dust present in granaries.
Current research on quantitative occupational health risk assessment in other industries has yielded instructive conclusions and methods [35,36,37]. In fact, risk assessment methods include deterministic analysis methods and uncertainty analysis methods. The accuracy of the conclusions drawn from the deterministic method cannot be guaranteed, as the method calculates the health risk through the most probable and maximum value of human exposure parameters and pollutant content [38], resulting in large or small results [39]. However, the problem of uncertainty is inherent in health risk assessment and runs through the whole process [40,41]. The operation area, time, and season of the grain warehouse make the dust concentration uncertain. The uncertainty of human exposure parameters, temperature and humidity changes, and meteorological conditions in the relatively open working environment of the grain warehouse also causes uncertainty in the evaluation results. Hence, this study used the uncertainty analysis method (i.e., the Monte Carlo method) to evaluate the health damage caused by grain dust in warehouses.
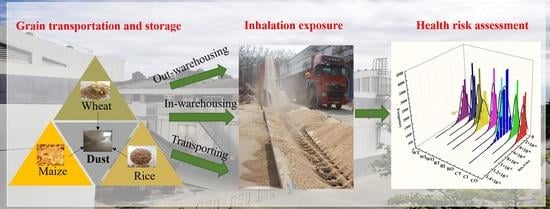
To address the uncertainty in grain dust health hazard assessment, a total of 616 samples were collected in China in Hefei (Anhui), Shenzhen (Guangdong), Chengdu (Sichuan), Changchun (Jilin), and Shunyi (Beijing). Additionally, a risk assessment model for the health damage caused by grain dust through inhalation was proposed, considering the dust concentration and the uncertainty of the exposure parameters, and grouping them according to different operation processes and grain varieties (i.e., maize, rice, and wheat) based on the current health risk evaluation system of the United States Environmental Protection Agency (USEPA). The Monte Carlo simulation and Crystal Ball 11.1 software were used to quantify the health damage and to analyze the impact of various parameters on health risks. The results provide guidance for occupational health risk management in the grain storage industry. To our knowledge, this is one of the first studies to analyze and evaluate the hazards of grain dust to human health through inhalation by the uncertainty analysis method.

2. Materials and Methods

2.1. Dust Sampling and Analytical Method

Five grain storage warehouses in China—in Hefei (Anhui), Shenzhen (Guangdong), Chengdu (Sichuan), Changchun (Jilin), and Shunyi (Beijing)—were selected as samples due to their representative and relatively standardized management, large storage capacity, complete variety of grain, and high-quality personnel (see Figure 1 for location information). As national reserves, the low-temperature storage method was used in these five grain storage warehouses with the same management mode. Additionally, the warehouse types were tall, square warehouses. The equipment used for grain storage and transportation were similar, including belt conveyor, grain raking machine, etc. These five grain warehouses are the example for evaluating the hazards of dust during grain storage, as well as the occupational health risks caused by that dust.
Three months of regular site monitoring was carried out from March 2021 to May 2021 due to the increased in-warehousing, out-warehousing, and transporting at the grain storage warehouses in spring, which is convenient for sampling. The sampling plan was designed according to China National Standards GBZ 159-2004 and GBZT 192.1-2007, and the concentration of grain dust was calculated using the filter membrane incremental method. A combination of fixed-point and individual sampling was used at three operating stages for three different grains—maize, wheat, and rice—including in-warehousing, out-warehousing, and transporting. The dust concentration of each warehouse was maintained within a certain range during our sampling process, and there was no systematic reduction in individual warehouses. The sampling height was set to 1.5 m (the breathing height of the workers), and the sampling time was set to 60 min. The gas flow rate was set to 2 L/min. A total of 616 samples were obtained. The detailed information is shown in Table 1.
The monitoring tool was a dust sampler (AKFC-92 A) made in Changshu, China. The AKFC-92A determines dust concentration, the size of the sampler inlet was 19.63 cm2, and has the advantages of pulsating airflow, negative pressure, large load capacity, automatic timing sampling, and being explosion proof. The main instrument is shown in Figure 2. The operation procedure was as follows. First, the filter membrane was numbered and weighed to record its quality before sampling. Second, the sampler was fixed horizontally on a tripod platform and placed at the sampling point close to the operator. Third, a trap with the filter membrane was installed on the sampling head, and a certain volume of dusty air was extracted to keep the dust in the filter membrane. Fourth, the filter membrane was removed in a clean area, the dust-receiving surface was folded twice, and then the samples were accurately weighed in the laboratory with an electronic balance (the test accuracy can reach 0.01 mg/m3) after drying and removing static electricity. Finally, the total dust concentration per unit was calculated from the weight gain of the filter membrane.

2.2. Health Risk Assessment Model

The dust samples used for evaluation in this study came from the warehouses of a large grain storage company to assess the health risks for workers. The inhalation risk assessment model in the Risk Assessment Guidance for Superfund: Human Health Evaluation Manual, Part F, Vol. 1, issued in 2009 by the USEPA [42], was selected to evaluate the occupational health risks of the grain storage dust. The key to the model is that the human-absorbed dose is quantified by exposure parameters. Determining the route of exposure is thus a prerequisite for risk assessment. The main exposure pathways for dust that can affect the health of workers are inhalation, which refers to breathing in air containing dust; ingestion, which refers to consumption of food, water, or soil containing dust; and dermal contact, which refers to physical contact of the skin with water or soil containing dust. As an air pollutant, dust mainly enters the human body via inhalation [43], so this study focused on the respiration-based health risks to workers.
An occupational health damage model was constructed with reference to the USEPA modeling principles on health risk and damage quantification. This model included the range determination, dust concentration analysis, health risk characterization, and health damage analysis. The dust generated in rice, wheat, and maize during in-warehousing, out-warehousing, and transporting were the evaluation objects; the collected grain dust data were simulated to select the best distribution; the probability of dust to harm the human health was calculated according to the dose–response relationship; and the dust concentration was transformed into a health risk [44], which was in turn transformed into a life loss caused by disease, expressed in DALY [45]. The dust damage model is shown in Figure 3.

2.2.1. Dust Exposure Dose

The dust exposure dose refers to the assessment of individual exposure parameters, which is calculated by monitoring the concentration of dust, exposure duration, and exposure method. However, China has not yet established a complete human exposure parameter database, therefore, due to this lack, the exposure parameter method proposed by the USEPA was used to convert the monitored grain dust concentration into the average daily exposure dose (ADD) of the grain warehouse workers. The calculation formula is as follows [46]:
ADD = C × IR   × ED   × EF   × ET BW   × AT ,
where ADD is the average daily exposure dose of grain storage workers (mg/kg∙d−1); C is the dust concentration on site (obtained by sampling, mg/m3); IR is the inhalation rate of workers (obtained by on-site interview and testing, m3/h); ED is the exposure duration (obtained by on-site interview, a); EF is the exposure frequency (obtained by on-site interview, d/a); ET is the exposure time (obtained by on-site interview, h/d); BW corresponds to the average worker (adult) weight (kg); and AT is the average time (AT = ED × 365 days for health risk, d).

2.2.2. Quantizing the Health Risk of Dust

Due to the “threshold” effect, the hazard index R represents the hazard of grain storage dust to the human body. The formula is as follows:
R = A D D R f D × 10 6
where RfD is a reference dose of dust and R is the health risk of dust. The reference doses for different compounds in the workplace air differ, and the exposure parameter manual issued by the USEPA has been divided. The reference dose standards for different types of dust are different. The RfD of silica, cement, wood, and gypsum dust have been calculated as 0.40, 1.20, 1.60, and 3.20, respectively, and a health risk assessment has been completed [47]. However, grain dust contains organic and inorganic substances such as protein, starch, cellulose, and ash, and elements such as Si, Ca, K, Ti, and Cr. The composition is complex, and the RfD of grain storage dust is not given. In the present study, dibutyl phthalate (DBP) was selected as a reference for calculation. With reference to the linear relationship between grain dust concentration and DBP in GBZ 2.1 Occupational Exposure Limits for Hazardous Agents in the Workplace [48], considering that the standard value of exposure dose and the standard value of environmental concentration have a certain proportional relationship, and the calculation method of Li X.D. [35], it is believed that the linear relationship between DBP and the exposure dose of grain dust is still satisfied, so the RfD value of grain dust was calculated to be 1.6 mg/(kg⋅d).

2.2.3. Dust Health Damage

The DALY model was jointly proposed by Murray and the World Health Organization to quantify the extent of human health damage [49]; it is composed of years of life lost (YLL) and years lived with disability (YLD) [50,51]. The parameters of the DALY are clear, and have been applied to construction, automobile casting, and other industries [52]. Its feasibility and operability have been verified. As dust mainly causes death, chronic obstructive pulmonary disease, cardiovascular disease, cerebrovascular disease, and acute respiratory infections, for this study the damage caused by dust was divided into these five types according to a certain proportion, and the normalized conversion DALY was used to characterize the damage. The formula is as follows:
D A L Y = n × R × P × i Q i × W i × L i
where Qi is the disease risk factor for disease category I; Wi is the effect factor of disease i and takes values between 0 and 1; Li is the damage factor for disease i (years); P is the number of people affected by specific diseases; and n is the amount of human exposure, namely, the days of operation (days).
The risk and effect factors for the five types of health damage were obtained by referring to the literature [35,37]. The value of the damage factor depends on the evaluated objects. For the five grain warehouses sampled, most of the operators were men from all over China. The life value used in the calculation was derived from the China Statistical Yearbook [53]. The values are shown in Table 2.

2.3. Exposure Parameter Determination

Exposure parameters are important in health risk assessments, including exposure time, exposure frequency, average time, and exposure duration. Factors such as workers’ labor intensity and region have an impact on the assessment results and can interfere with exposure parameters. On-site interviews were conducted with workers in the grain warehouses in five different cities. Additionally, inhalation rate testing was carried out. A total of 45 workers were selected in the in-warehousing operational stage, 49 in the out-warehousing operational stage, and 52 in the transporting operational stage. Their parameter characteristics were obtained, including personal information such as age, gender, height, and weight, as well as work information, such as daily working and rest hours. Crystal Ball 11.1 was used to analyze the survey data in combination with the relevant literature [54,55,56]. Crystal Ball is a Monte Carlo simulation software launched by Oracle, which can be used for predictive modeling, prediction, simulation, and optimization, random simulation and uncertain risk analysis. It provides a realistic and easy-to-understand uncertainty modeling method, which can achieve the goal and improve the understanding of impact risk by analyzing data and making correct tactical decisions [57]. The results showed that inhalation rate, exposure duration, exposure frequency, exposure time, and average time formed a triangle distribution; body weight followed a normal distribution [58]. The distribution characteristics for the exposure parameters of grain warehouse workers are shown in Table 3.

3. Results and Discussion

3.1. Dust Concentration and Dispersity

After dust sampling, the agglomeration phenomenon in the transportation process was eliminated by ultrasonic treatment, and then the original sample was screened. The particle size distribution of the different grain dust samples was obtained by a laser particle size analyzer. The calculated sample dust concentration data were input into Crystal Ball 11.1 software for fitting, and the results are shown in Table 4.
The dust concentration was at a relatively high level near the conveyor, between 100 and 500 mg/m3, during the continuous monitoring of the dust concentration. The principle of sampling was to be as close as possible to the working area of the operator, and the position of the sensor was a certain distance from the conveyor, so the concentration of the dust reached 25–70 mg/m3, which seriously exceeded the standard. Long-term work in such an environment would certainly cause great harm to health. The concentration of maize at each stage was also generally greater than that of rice and wheat, which may be related to the true density.
The three kinds of grain dust have a wide particle size distribution, ranging from 0.6 μm to 950 μm. The deposition sites of the different size particles in respiratory system are also different. Smaller particles can be deposited more deeply and cause greater harm to the human body. It is generally believed that particles with a diameter of less than 2.5 μm have the most impact on human health as they can enter the trachea, bronchus, and alveoli. The proportion of grain dust particles smaller than 2.5 μm exceeded 2%, which could seriously threaten the workers’ respiratory system.

3.2. Dust Health Damage Analysis

3.2.1. Health Risks

During risk assessment, uncertainty arose from human parameters and dust concentration. These factors could affect the real reflection of the calculation results to the actual risk values to different degrees, resulting in uncertainty [59,60]. The Monte Carlo simulation effectively solves the problem of uncertainty in risk assessment. Combined with the above formulas, the Crystal Ball 11.1 software was used to simulate and calculate the dust health risk for three kinds of grain and three operation states using the Monte Carlo method. The number of random simulation iterations was set as 10,000, and the confidence level was determined as 95% [61]. The risk results were processed and mapped with OriginPro 9.0. The acceptable risk value recommended by USEPA is 1 × 10⁻⁶ [47]. If the risk value for pollutants is less than 1 × 10⁻⁶, it is considered acceptable; if it is greater than 1 × 10⁻⁴, the risk is unacceptable. The results for the dust health risk at different stages for each grain were obtained by this running simulation, as shown in Table 5 and Figure 4 and Figure 5.
Considering grain type, the health risk of maize in each stage of storage was the largest and followed a lognormal distribution. The out-warehousing stage was 1.42 × 10⁻⁶ ± 9.14 × 10⁻⁷, the in-warehousing stage was 1.24 × 10⁻⁶ ± 8.27 × 10⁻⁷, and the transporting stage was 2.34 × 10⁻⁶ ± 1.32 × 10⁻⁶. The maximum values were 9.63 × 10⁻⁶, 8.28 × 10⁻⁶, and 1.25 × 10⁻⁶ for the out-warehousing stage, in-warehousing stage, and transporting stage, respectively, and the average values at each stage were, respectively, 1.42, 1.24, and 2.34 times the acceptable values. The probability of exceeding 10−6 was 63%, 53%, and 90%, respectively, but none exceeded the upper limit of the acceptable risk value of ×10−4. The health risk of maize in each storage stage was quite large, especially in the transporting stage, and this indicates the need to take urgent and effective dust reduction measures. The health risk of rice in each storage stage is the second highest and followed a lognormal distribution. The out-warehousing stage was 1.12 × 10⁻⁶ ± 8.04 × 10⁻⁷, the in-warehousing stage was 1.05 × 10⁻⁶ ± 7.20 × 10⁻⁷, and the transporting stage was 2.07 × 10⁻⁶ ± 1.16 × 10⁻⁶. The median values were 9.51 × 10⁻⁷, 8.91 × 10⁻⁷, and 1.82 × 10⁻⁶, respectively. For workers in the storage and transportation of rice, the probability of exceeding value 10−6 is 47%, 43%, and 86% in the process of out-warehousing, in-warehousing, and transporting, respectively. Although these values are not more than 1 × 10⁻⁴, it is still very harmful. The health risks of wheat in each storage stage were relatively small, with 1.21 × 10⁻⁶ ± 8.13 × 10⁻⁷ at the out-warehousing stage, 9.03 × 10⁻⁷ ± 6.83 × 10⁻⁷ at the in-warehousing stage, and 1.90 × 10⁻⁶ at the transporting stage. The average value of the out-warehousing stage was slightly higher than that of rice, which may be due to the smaller standard deviation in the concentration distribution. In long-term wheat storage and transportation operation, the possibility of exceeding the value 10−6 was greater than 35%; hence, it also deserves attention.
Based on the storage and transporting stages, the risk of the transporting stage for the three grains is greater than out-warehousing, which is in turn greater than the in-warehousing stage. The health risk value for the maize transporting stage was 1.67 times that of out-warehousing and 1.88 times that of in-warehousing. The maximum, mean, and minimum values were greater than those in the out-warehousing and in-warehousing stage, indicating that workers in the transporting stage are more likely to be more seriously affected by dust. The risk value in the out-warehousing stage was 1.15 times that of in-warehousing, which should also be controlled. The risk value produced by rice transporting was 85% higher than out-warehousing and 97% higher than in-warehousing. The risk value in out-warehousing was seven percentage points higher than in-warehousing. Although the maximum risk value for wheat transporting was slightly less than out-warehousing, the overall risk value was still greater than in the out-warehousing and in-warehousing stages. The main reasons for the high risk in the transfer stage include the use of protective measures (e.g., underground conveyance channels, airtight covers, and dust collectors) and a smaller scale of grain exposure to air during out-warehousing and in-warehousing; the grain also passes through multiple pieces of operation equipment during the transporting stage, and grain dust particles are constantly produced through overturning, flow, impact, and machinery, with particles precipitated under induction, traction, and shear airflow. The risk value in the out-warehousing stage is greater than in-warehousing, mainly as the fumigation and preservation of the grain after entering the warehouse creates pest residues, residual drugs, and powder after pests eat the grain.

3.2.2. Sensitivity Analysis

When the exposure parameters are uncertain, the health risk value may be misleading during decision-making. The sensitivity of each parameter was therefore further analyzed to compare the impact of each parameter on health risk. If the sensitivity analysis is positive, this means that the parameter is positively correlated with risk; if the sensitivity analysis is negative, it means that there is a negative correlation. The correlation is determined by the absolute sensitivity value.
The sensitivity of each exposure parameter for the different grains at different stages is shown in Figure 6. Among the exposure parameters that affect human health, C had the greatest positive impact on maize, rice, and wheat in the out-warehousing and in-warehousing stages, with sensitivities of 57%, 61%, 69%, respectively, in the out-warehousing stage, and 64%, 62%, and 71%, respectively, in the in-warehousing stage; this was followed by ED, with a sensitivity of 46%, 42%, 37%, respectively, in the out-warehousing stage, and 41%, 44%, and 38%, respectively, in the in-warehousing stage. The last was IR, with a sensitivity of about 30%. In the grain transporting stage, the most positive impact is ED, with sensitivities of 55%, 53%, and 52%, respectively, for maize, rice, and wheat. The sensitivity of C and IR differed from ED by about 15 percentage points. ET and EF had relatively small effects on the risk of health damage at each stage, at less than 20% and 5%, respectively. AT and BW had negative sensitivity and were negatively correlated with risk results. The absolute value of the sensitivity of AT for each stage was all greater than 37%, while the absolute value of the sensitivity of BW was less than 19%.
In general, C, ED, IR, and AT are highly sensitive to the health risks of grain storage and transportation, and have a greater impact; BW, ET, and EF are less sensitive, and have only a slight impact on the evaluation results. However, as the same parameters have different effects on different stages of grain production, different measures should be taken to reduce the health risk to workers. At the stages of grain out-warehousing and in-warehousing, dust control should be strengthened to reduce health risks, and the average exposure time to high concentration dust should be reduced. At the grain transporting stage, personnel access to high-concentration dust areas should be strictly monitored and limited, and dust reduction and removal measures should be taken to reduce the average exposure time.

3.2.3. Health Damages

The health damages and the DALY caused by dust were calculated, as shown in Table 6, and the overall trend was obtained through simulation, as shown in Figure 7, Figure 8 and Figure 9. Dust caused the greatest damage to health in the maize in-warehousing stage, with an average DALY of 1.1 years. The transporting stage of rice and wheat followed, which were 0.89 and 0.83 years, respectively. The other stages were smaller, all within 1.6 years. At the same time, there were no significant differences in the DALY between different grains and stages. Uncertainty analysis of the DALY showed that the DALY of maize out-warehousing, in-warehousing, and transporting were concentrated in the range of 0.14–1.11, 0.15–0.86, and 0.39–1.57 years, respectively; for rice, they were concentrated in the range of 0.10–0.88, 0.09–0.80, and 0.33–1.43 years, respectively; and for wheat, they were concentrated in range of 0.15–1.01, 0.05–0.69, and 0.28–1.38 years for each stage, respectively.
According to the data, the DALY caused by dust in the coal mine production process is more than 2 years [62]; for construction engineering, it is more than 3.4 years [37]; and for automobile casting it is more than 3.89 years [52]. By comparison, the health damage caused by grain dust is not as serious as that cased by these three industries. The main reason for this is that the grain storage and transportation process has a certain periodicity, fewer workers, and only a short exposure time. Additionally, the dust of other industries contains a large amount of heavy metal contamination and polycyclic aromatic hydrocarbons, which make the risk value and DALY greater [63]. It should be noted, however, that its dust concentration is comparable to those of the other industries. To reduce the health risk, the generation and diffusion of dust should thus be controlled as much as possible.

3.2.4. Uncertainty Analysis

The dust concentration level in the grain storage and transportation process is affected by the year, season, region, process, and equipment due to the different equipment, technology, and processes involved in different stages of grain storage and transportation; the sampling time for dust in this health risk assessment was from March to May, so the parameters for dust concentration have certain limitations. However, in this study, a unified calculation of the employee exposure parameters at different stages was carried out, which also creates uncertainty. Exposure parameters such as EF, ED, and ET also refer to the Chinese population exposure parameter manual obtained from the 2011–2012 survey; the use of these data after 10 years may also lead to uncertainties. The RfD in the Chinese population exposure parameter manual differs from that provided by USEPA.

3.3. Implication and Limitations

The findings of the research presented in this paper have important significance. Previous studies have shown that a large amount of mixed dust is generated during the storage and transportation of grain, and this dust is seriously harmful to human beings. This risk to human health was, however, rarely evaluated further. This study has made a significant contribution to quantifying the health damage caused by grain dust. Based on the analysis of parameter uncertainty, the method of probabilistic risk assessment was used to ensure the comprehensiveness, objectivity, and accuracy of the evaluation result. The Monte Carlo method in the Crystal Ball software was used to deal with uncertainty in the process of risk assessment. The maximum, minimum, standard deviation, quantile, and other numerical risk characteristics were obtained to reflect the harm level of dust from multiple angles. The effects of AT, ED, ET, EF, BW, and C were explored by the sensitivity analysis of the evaluation results, which can effectively help managers choose reasonable prevention and control measures to reduce harm.
The evaluation method used in this study still has some limitations. As mentioned earlier, dust sampling is not universal. The uncertainty caused by the exposure parameter cannot be eliminated. The dermal contact [64,65] and ingestion pathways [66,67] also had an impact on human health. Only the inhalation pathway was considered, which may cause the health risk value presented here to be smaller than the actual risk. In addition, although the researchers tried to select the same grain warehouse for experiment and analysis during the sampling process, system differences were possible between the 616 samples, which will lead to errors in the results.

4. Conclusions

The dust concentration, levels, and sources, as well as the resulting health damage created during transportation and storage at Chinese grain storage companies were thoroughly investigated in this study. First, 616 dust samples from different stages (out-warehousing, in-warehousing, and transporting) and types of grain (maize, wheat, and rice) in five cities were collected and analyzed using the filter membrane method and a laser particle size analyzer. A risk assessment model for grain dust inhalation was established based on the current USEPA health risk assessment system. The health damage of grain dust was quantified by Monte Carlo simulation and Crystal Ball 11.1 software. The DALY was chosen as the final indicator to quantify the health damage. The results showed that the concentration of grain dust ranged from 25 to 70 mg/m3, and the distribution was normal. The proportion of dust with a particle size less than 10 μm exceeded 10%, which could seriously threaten workers’ respiratory system. Based on grain type, the dust risk in each stage followed a lognormal distribution, and the health risk of maize at each stage was the largest, at 1.42 × 10⁻⁶ ± 9.14 × 1 0−7 during out-warehousing, 1.24 × 10⁻⁶ ± 8.27 × 1 0−7 during in-warehousing, and 2.34 × 10⁻⁶ ± 1.32 × 10⁻⁶ during transport. By stage, the health risk of grain dust can be ranked as follows: the transporting stage > the out-warehousing stage > the in-warehousing stage. The sensitivity analysis indicated that average time (AT), exposure duration (ED), inhalation rate (IR), and dust concentration (C) made the greatest contribution to dust health risk, while AT and body weight exhibited a negative sensitivity. The DALY caused by dust during grain storage was between 0.1 and 3.3 years. The DALY of maize was the largest during the in-warehousing stage, with an average value of 1.01 years, while the DALY of rice and wheat were the largest during the transporting stage, with an average value of 0.89 and 0.83 years, respectively.
The results of this study provide a new perspective for grain storage dust damage assessment. The dust concentration, particle size, and distribution characteristics of three kinds of grain at three storage stages were described, and preventive measures were proposed. The maximum, minimum, standard deviation, and quantile of risk were obtained by the probability risk assessment method to guarantee the comprehensiveness of the results. Furthermore, the DALY can directly reflect the damage of dust to human beings. To resolve the uncertainty of the results caused by various factors and the limitations of the evaluation method, future studies could increase the data sampling and investigation of exposure parameters, and assess the risk for the dermal contact and ingestion pathways to ensure the results are more accurate.

Author Contributions

P.C.: Conceptualization, Writing—Original Draft, Resources, Validation. T.Z.: Methodology, Funding acquisition, Projrct administration; X.C.: Formal analysis, Investigation; X.Y.: Writing—Review & Editing, Data Curation. All authors have read and agreed to the published version of the manuscript.

Funding

This research was funded by the Academy of National Food and Strategic Reserves Administration (No. ZX2006) and National Key R&D Program of China (No. 2018YFD0401403-02).

Institutional Review Board Statement

Not applicable.

Informed Consent Statement

Not applicable.

Acknowledgments

This work was supported by the Academy of National Food and Strategic Reserves Administration (No. ZX2006) and National Key R&D Program of China (No. 2018YFD0401403-02).

Conflicts of Interest

The authors declare no conflict of interest.

References

  1. Martin, C.R.; Sauer, D.B. Physical and biological characteristics of grain dust. Trans. ASAE 1976, 19, 720–723. [Google Scholar] [CrossRef]
  2. Hurst, T.S.; Dosman, J.A. Characterization of health effects of grain dust exposures. Am. J. Ind. Med. 1990, 17, 27–32. [Google Scholar] [CrossRef] [PubMed]
  3. Parnell, C.B., Jr.; Jones, D.D.; Rutherford, R.D.; Goforth, K.J. Physical properties of five grain dust types. Environ. Health Perspect. 1986, 66, 183–188. [Google Scholar] [CrossRef] [PubMed]
  4. Spankie, S.; Cherrie, J.W. Exposure to grain dust in Great Britain. Ann. Occup. Hyg. 2012, 56, 25–36. [Google Scholar] [PubMed] [Green Version]
  5. Chan, M.; Yeung, D.A.E.; Kennedy, S.M. The Impact of Grain Dust on Respiratory Health1-3. Am Rev. Respir. Dis. 1992, 145, 476–487. [Google Scholar] [CrossRef] [PubMed]
  6. Warren, P.; Cherniack, R.M.; Kam, S.T. Hypersensitivity reactions to grain dust. J. Allergy Clin. Immunol. 1974, 53, 139–149. [Google Scholar] [CrossRef]
  7. Flaherty, D.; Bhansali, P.; Chavaje, N. Grain fever syndrome induced by inhalation of airborne grain dust. J. Allergy Clin. Immunol. 1982, 69, 435–443. [Google Scholar]
  8. Davies, R.J.; Green, M.; Schofield, N.M.C. Recurrent ncturnal asthma after exposure to grain dust. Am. Rev. Respir. Dis. 1976, 114, 1011–1019. [Google Scholar]
  9. Rushton, L. Chronic obstructive pulmonary disease and occupational exposure to silica. Rev. Environ. Health 2007, 22, 255–272. [Google Scholar] [CrossRef] [PubMed]
  10. Cotton, D.J.; Dosman, J.A. Grain dust and health. III. Environmental factors. Ann. Intern. Med. 1978, 89, 420–421. [Google Scholar] [CrossRef]
  11. Chan-Yeung, M.; Enarson, D.; Grzybowski, S. Grain dust and respiratory health. Can. Med. Assoc. J. 1985, 133, 969. [Google Scholar]
  12. Eckhoff, R.K.; Fuhre, K. Dust explosion experiments in a vented 500 m3 silo cell. J. Occup. Accid. 1984, 6, 229–240. [Google Scholar] [CrossRef]
  13. Lebecki, K.; Cybulski, K.; Śliz, J.; Dyduch, Z.; Wolanski, P. Large scale grain dust explosions-research in Poland. Shock Waves 1995, 5, 109–114. [Google Scholar] [CrossRef]
  14. Lesikar, B.J.; Parnell, C.B.; Garcia, A. Determination of grain dust explosibility parameters. Trans. ASAE 1991, 34, 571–0576. [Google Scholar] [CrossRef]
  15. doPico, G.A.; Reddan, W.; Anderson, S.; Dennis, F.; Eugene, S. Acute effects of grain dust exposure during a work shift. Am. Rev. Respir. Dis. 1983, 128, 399–404. [Google Scholar] [CrossRef] [PubMed]
  16. Krysinska-Traczyk, E.; Perkowski, J.; Dutkiewicz, J. Levels of fungi and mycotoxins in the samples of grain and grain dust collected from five various cereal crops in eastern Poland. Ann. Agric. Environ. Med. 2007, 14, 159–167. [Google Scholar] [PubMed]
  17. Halstensen, A.S.; Nordby, K.C.; Elen, O.; Eduard, W. Ochratoxin a in grain dust- estimated exposure and relations to agricultural practices in grain production. Ann. Agric. Environ. Med. 2004, 11, 245–254. [Google Scholar]
  18. Deetz, D.C.; Jagielo, P.J.; Quinn, T.J.; Thorme, P.S.; Bleuer, S.A.; Schwartz, D.A. The kinetics of grain dust-induced inflammation of the lower respiratory tract. Am. J. Respir. Crit. Care Med. 1997, 155, 254–259. [Google Scholar] [CrossRef]
  19. Von Essen, S.G.; Robbins, R.A.; Thompson, A.B.; Ertl, R.F.; Linder, J.; Rennard, S. Mechanisms of neutrophil recruitment to the lung by grain dust exposure. Am. Rev. Respir. Dis. 1998, 138, 921–927. [Google Scholar] [CrossRef] [PubMed]
  20. Clapp, W.D.; Becker, S.; Quay, J.; Quay, J.; Watt, J.L.; Thorne, P.S.; Frees, K.L.; Zhang, X.; Koren, H.S.; Lux, C.R.; et al. Grain dust-induced airflow obstruction and inflammation of the lower respiratory tract. Am. J. Respir. Crit. Care Med. 1994, 150, 611–617. [Google Scholar] [CrossRef]
  21. Behrooz, R.D.; Kaskaoutis, D.G.; Grivas, G.; Mihalopoulos, N. Human health risk assessment for toxic elements in the extreme ambient dust conditions observed in Sistan, Iran. Chemosphere 2021, 262, 127835. [Google Scholar] [CrossRef]
  22. Guney, M.; Bourges, C.M.J.; Chapuis, R.P.; Zagury, G.J. Lung bioaccessibility of As, Cu, Fe, Mn, Ni, Pb, and Zn in fine fraction (<20 mm) from contaminated soils and mine tailings. Sci. Total Environ. 2017, 579, 378–386. [Google Scholar] [CrossRef] [PubMed]
  23. Donoghue, A.M. The design of hazard risk assessment matrices for ranking occupational health risks and their application in mining and minerals processing. Occup. Med. 2000, 51, 118–123. [Google Scholar] [CrossRef] [PubMed] [Green Version]
  24. Lim, H.-S.; Lee, J.-S.; Chon, H.-T.; Sager, M. Heavy metal contamination and health risk assessment in the vicinity of the abandoned Songcheon Au-Ag mine in Korea. J. Geochem. Explor. 2008, 96, 223–230. [Google Scholar] [CrossRef]
  25. Kan, H.; Chen, B. Particulate air pollution in urban areas of Shanghai, China: Health-based economic assessment. Sci. Total Environ. 2004, 322, 71–79. [Google Scholar] [CrossRef]
  26. Zhang, M. A health-based-assessment of particulate air pollution in urban areas of Beijing in 2000–2004. Sci. Total Environ. 2007, 376, 100–108. [Google Scholar] [CrossRef]
  27. Liu, E.; Yan, T.; Birch, G.; Zhu, Y. Pollution and health risk of potentially toxic metals in urban road dust in Nanjing, a mega-city of China. Sci. Total Environ. 2014, 476–477, 522–531. [Google Scholar] [CrossRef]
  28. Zhang, Y.; Ji, X.; Ku, T.; Li, G.; Sang, N. Heavy metals bound to fine particulate matter from northern China induce season-dependent health risks: A study based on myocardial toxicity. Environ. Pollut. 2016, 216, 380–390. [Google Scholar] [CrossRef] [Green Version]
  29. Chen, X.; Guo, C.; Song, J.; Wang, X.; Cheng, J. Occupational health risk assessment based on actual dust exposure in a tunnel construction adopting road header in Chongqing, China. Build. Environ. 2019, 165, 106415. [Google Scholar] [CrossRef]
  30. Zheng, N.; Liu, J.; Wang, Q.; Liang, Z. Health risk assessment of heavy metal exposure to street dust in the zinc smelting district, northeast of China. Sci. Total Environ. 2021, 408, 726–733. [Google Scholar] [CrossRef]
  31. Tahir, M.W.; Mumtaz, M.W.; Tauseef, S.; Sajjad, M.; Nazeer, A.; Farheen, N.; Iqbal, M. Monitoring of cotton dust and health risk assessment in small-scale weaving industry. Environ. Monit. Assess. 2012, 184, 4879–4888. [Google Scholar] [CrossRef] [PubMed]
  32. Zazouli, M.A.; Dehbandi, R.; Mohammadyan, M.; Aarabi, M.; Dominguez, A.O.; Kelly, F.J.; Khodabakhshloo, N.; Rahman, M.M.; Naidu, R. Physico-chemical properties and reactive oxygen species generation by respirable coal dust: Implication for human health risk assessment. J. Hazard. Mater. 2021, 405, 124185. [Google Scholar] [CrossRef]
  33. Li, X.; Zhu, Y.; Zhang, Z. An LCA-based environmental impact assessment model for construction processe. Build. Environ. 2010, 45, 766–775. [Google Scholar] [CrossRef]
  34. Dong, T.; Li, T.X.; Zhao, X.G.; Cao, S.Z.; Wang, B.B.; Ma, J.; Duan, X.L. Source and Health Risk Assessment of Heavy Metals in Ambient Air PM10 from One Coking Plant. Environ. Sci. 2014, 35, 1238–1244. [Google Scholar]
  35. Li, X.D.; Su, S.; Huang, T.J. Health damage assessment model for construction dust. J. Tsinghua Univ. Sci. Technol. 2015, 55, 50–55. [Google Scholar]
  36. Öberg, T.; Bergbäck, B. A review of probabilistic risk assessment of contaminated land (12 pp). J. Soils Sediments 2005, 5, 213–224. [Google Scholar] [CrossRef]
  37. Zhang, Z.H.; Wu, F. Health impairment due to building construction dust pollution. J. Tsinghua Univ. Sci. Technol. 2008, 48, 922–925. [Google Scholar]
  38. Peng, C.; Cai, Y.M.; Wang, T.Y.; Xiao, R.B.; Chen, W.P. Regional probabilistic risk assessment of heavy metals in different environmental media and land uses: An urbanization-affected drinking water supply area. Sci. Rep. 2016, 6, 37084. [Google Scholar] [CrossRef] [PubMed] [Green Version]
  39. Koupaie, E.H.; Eskicioglu, C. Health risk assessment of heavy metals through the consumption of food crops fertilized by biosolids: A probabilistic-based analysis. J. Hazard. Mater. 2015, 300, 855–865. [Google Scholar] [CrossRef] [PubMed]
  40. Li, F.; Huang, J.H.; Zeng, G.M.; Yuan, X.Z.; Liang, J.; Wang, X.Y. Multimedia health risk assessment: A case study of scenario-uncertainty. J. Cent. South Univ. 2012, 19, 2901–2909. [Google Scholar] [CrossRef]
  41. Chen, S.C.; Liao, C.M. Health risk assessment on human exposed to environmental polycyclic aromatic hydrocarbons pollution sources. Sci. Total Environ. 2006, 366, 112–123. [Google Scholar] [CrossRef]
  42. USEPA. Risk Assessment Guidance for Superfund. Human Health Evaluation Manual. Part F; USEPA: Washington, DC, USA, 2009; Volume 1. [Google Scholar]
  43. Shen, Z.X.; Cao, J.; Arimoto, R.; Han, Z.; Zhang, R.; Han, Y.; Liu, S.; Okuda, T.; Nakao, S.; Tanako, S. Ionic composition of TSP and PM2.5 during dust storms and air pollution episodes at Xi’an, China. Atmos. Environ. 2009, 43, 2911–2918. [Google Scholar] [CrossRef]
  44. USEPA. Appendix A to 40 CFR, Part 423–126 Priority Pollutants; USEPA: Washington, DC, USA, 2003. [Google Scholar]
  45. Murray, C.J.; Lopez, A.D. Regional patterns of disability-free life expectancy and disability-adjusted life expectancy: Global Burden of Disease Study. Lancet 1997, 349, 1347–1352. [Google Scholar] [CrossRef]
  46. USEPA. Exposure Factors Handbook: 2011 Edition EPA/600/R-090/052F; USEPA: Washington, DC, USA, 2011. [Google Scholar]
  47. Tong, R.P.; Cheng, M.Z.; Zhang, L.; Liu, M.; Yang, X.Y.; Li, X.D.; Yin, W. The construction dust-induced occupational health risk using Monte Carlo simulation. J. Clean. Prod. 2018, 184, 598–608. [Google Scholar] [CrossRef]
  48. GBZ 2.1. Occupational Exposure Limits for Hazardous Agents in the Workplace Part 1: Chemical Hazardous Agents; The Central People’s Government of the People’s Republic of China: Beijing, China, 2007.
  49. Murray, C.J. Quantifying the burden of disease: The technical basis for disability-adjusted life years. Bull. WHO 1994, 72, 429–445. [Google Scholar] [PubMed]
  50. Soerjomataram, I.; Lortet-Tieulent, J.; Ferlay, J.; Forman, D.; Mathers, C.; Parkin, D.M.; Bray, F. Estimating and validating disability-adjusted life years at the global level: A methodological framework for cancer. BMC Med. Res. Methodol. 2012, 12, 1. [Google Scholar] [CrossRef] [Green Version]
  51. Pan, S.; An, W.; Li, H.Y.; Su, M.; Zhang, J.L.; Yang, M. Cancer risk assessment on trihalomethanes and haloacetic acids in drinking water of China using disability-adjusted life years. J. Hazard. Mater. 2014, 280, 288–294. [Google Scholar] [CrossRef]
  52. Tong, R.; Cheng, M.; Ma, X.; Yang, Y.; Liu, Y.; Li, J. Quantitative health risk assessment of inhalation exposure to automobile foundry dust. Environ. Geochem. Health 2019, 41, 2179–2193. [Google Scholar] [CrossRef]
  53. National Bureau of Statistics. China Statistical Yearbook 2011; China Statistics Press: Beijing, China, 2011. [Google Scholar]
  54. Wang, Z.; Duan, X.; Liu, P.; Nie, J.; Zhang, J. Human exposure factors of Chinese people in environmental health risk assessment. Res. J. Environ. Sci. 2009, 22, 1164–1175. [Google Scholar]
  55. Xiang, H.L.; Yang, J.; Qiu, Z.Z.; Lei, W.X.; Zeng, T.T.; Lan, Z.C. Health Risk Assessment of Tunnel Workers Based on the Investigation and Analysis of Occupational Exposure to PM10. Environ. Sci. 2015, 36, 2768–2774. [Google Scholar]
  56. Brochu, P.; Ducre-Robitaille, J.F.; Brodeur, J. Physiological daily inhalation rates for free -living individuals aged 1 month to 96 years, using data from doubly labeled water measurements: A proposal for air quality criteria, standard calculations and health risk assessment. Hum. Ecol. Risk Assess. 2006, 12, 675–701. [Google Scholar] [CrossRef]
  57. Charnes, J. Financial Modeling with Crystal Ball and Excel, +Website; John Wiley & Sons: New York, NY, USA, 2012. [Google Scholar]
  58. Hou, J.; Qu, Y.; Ninf, D.; Wang, H. Impact of Human Exposure Factors on Health Risk Assessment for Benzene Contaminated Site. Environ. Sci. Technol. 2014, 37, 191–195. [Google Scholar]
  59. Qu, C.; Li, B.; Wu, H.; Wang, S.; Giesy, J.P. Multipathway assessment of human health risk posed by polycyclic aromatic hydrocarbons. Environ. Geochem. Health 2015, 37, 587–601. [Google Scholar] [CrossRef] [PubMed]
  60. Othman, M.; Latif, M.T.; Mohamed, A.F. Health impact assessment from building life cycles and trace metals in coarse particulate matter in urban office environments. Ecotoxicol. Environ. Saf. 2018, 148, 293–302. [Google Scholar] [CrossRef]
  61. Chiang, K.C.; Chio, C.P.; Chiang, Y.H.; Liao, C.M. Assessing hazardous risks of human exposure to temple airborne polycyclic aromatic hydrocarbons. J. Hazard. Mater. 2009, 166, 676–685. [Google Scholar] [CrossRef] [PubMed]
  62. Tong, R.P.; Cheng, M.Z.; Ma, X.; Xu, S.R. Ecaluation method of coal dust occupational health damage under uncertainty condition and its application. China Saf. Sci. J. 2018, 28, 139–144. [Google Scholar]
  63. Martin, C.R. Characterization of grain dust properties. Trans. ASAE 1981, 24, 738–742. [Google Scholar] [CrossRef]
  64. Tarafdar, A.; Sinha, A. Health risk assessment and source study of PAHs from roadside soil dust of a heavy mining area in India. Arch. Environ. Occup. Health 2019, 74, 252–262. [Google Scholar] [CrossRef] [PubMed]
  65. Li, F.; Zhang, J.; Huang, J.; Huang, D.; Yang, J.; Song, Y.; Zeng, G. Heavy metals in road dust from Xiandao District, Changsha City, China: Characteristics, health risk assessment, and integrated source identification. Environ. Sci. Pollut. Res. 2016, 23, 13100–13113. [Google Scholar] [CrossRef] [PubMed]
  66. Ghorbel, M.; Munoz, M.; Courjault-Radé, P.; Destrigneville, C.; de Parseval, P.; Souissi, R.; Souissi, F.; Mammou, A.B.; Abdeljaouad, S. Health risk assessment for human exposure by direct ingestion of Pb, Cd, Zn bearing dust in the former miners’ village of Jebel Ressas (NE Tunisia). Eur. J. Miner. 2010, 22, 639–649. [Google Scholar] [CrossRef]
  67. Liu, Y.; Ma, J.; Yan, H.; Ren, Y.; Wang, B.; Lin, C.; Liu, X. Bioaccessibility and health risk assessment of arsenic in soil and indoor dust in rural and urban areas of Hubei province, China. Ecotoxicol. Environ. Saf. 2016, 126, 14–22. [Google Scholar] [CrossRef] [PubMed]
Figure 1. Location of sampling points.
Atmosphere 12 01025 g001
Figure 2. Dust concentration measuring instrument.
Atmosphere 12 01025 g002
Figure 3. Dust damage model.
Atmosphere 12 01025 g003
Figure 4. Distribution of health risk values in different storage stages for each grain. Remarks: CO refers to the out-warehousing stage of maize; CI refers to the in-warehousing stage of maize; CT refers to the transporting stage of maize; RO refers to the out-warehousing stage of rice; RI refers to the in-warehousing stage of maize; RT refers to the transporting stage of maize; WO refers to the out-warehousing stage of maize; WI refers to the in-warehousing stage of maize; and WT refers to the transporting stage of maize. The rest of the paper is the same.
Atmosphere 12 01025 g004
Figure 5. Health risks at different storage stages for each grain. Remarks: O-W refers to the out-warehousing stage; I-W refers to the in-warehousing stage; and TS refers to the transporting stage.
Atmosphere 12 01025 g005
Figure 6. Sensitivity analysis at different stages for each grain.
Atmosphere 12 01025 g006
Figure 7. Maize simulation results of the DALY.
Atmosphere 12 01025 g007
Figure 8. Rice simulation results of the DALY.
Atmosphere 12 01025 g008
Figure 9. Wheat simulation results of the DALY.
Atmosphere 12 01025 g009
Table 1. Sample information.
GrainStageSample Size
MaizeOut-warehousing57
In-warehousing62
Transporting79
RiceOut-warehousing73
In-warehousing81
Transporting67
WheatOut-warehousing83
In-warehousing61
Transporting53
Table 2. Health damage parameter values.
Disease EndpointsQWL/a
Death0.131.0042.2
Chronic obstructive pulmonary disease0.160.1510
Cardiovascular disease0.160.2437.2
Cerebrovascular disease0.200.2037.2
Acute respiratory infections0.350.080.04
Table 3. Chinese residents (adults) exposure parameter characteristic.
Exposure ParametersAbbreviationUnitDistributionProbable ValueMinMaxSD
Inhalation rateIRm3/hTriangular1.80.92.75
Body weightBWkgNormal56.842.171.65.8
Exposure durationEDaTriangular15525
Exposure frequencyEFd/aTriangular104.3198.62110.54
Exposure timeETh/dTriangular5.946.5
Average timeATdTriangular547518259125
Table 4. Distribution characteristics of grain dust concentration.
GrainDust Concentration
WorkplaceDistributionMean (mg/m3)SD
MaizeOut-warehousingNormal41.8614.31
In-warehousingNormal35.9213.12
TransportingNormal67.2511.57
RiceOut-warehousingNormal32.5415.32
In-warehousingNormal30.9112.69
TransportingNormal59.6810.67
WheatOut-warehousingNormal35.2913.29
In-warehousingNormal26.4312.67
TransportingNormal55.6111.12
Table 5. Statistical values of health risk in different stages of each grain.
GrainStageHealth Risk ValueQuantiles
MeanSD5%20%50%90%100%
MaizeOut-warehousing1.42 × 10−69.14 × 10−73.74 × 10−77.09 × 10−71.21 × 10−62.56 × 10−69.63 × 10−6
In-warehousing1.24 × 10−68.27 × 10−73.25 × 10−76.06 × 10−71.56 × 10−62.27 × 10−68.28 × 10−6
Transporting2.34 × 10−61.32 × 10−68.38 × 10−71.30 × 10−62.05 × 10−63.98 × 10−61.24 × 10−5
RiceOut-warehousing1.12 × 10−68.04 × 10−71.80 × 10−74.82 × 10−79.51 × 10−72.14 × 10−69.55 × 10−6
In-warehousing1.05 × 10−67.20 × 10−72.33 × 10−74.94 × 10−78.91 × 10−71.96 × 10−66.89 × 10−6
Transporting2.07 × 10−61.16 × 10−67.41 × 10−71.15 × 10−61.82 × 10−63.54 × 10−61.12 × 10−5
WheatOut-warehousing1.21 × 10−68.13 × 10−72.92 × 10−75.74 × 10−71.02 × 10−62.24 × 10−61.08 × 10−5
In-warehousing9.03 × 10−66.83 × 10−71.25 × 10−73.84 × 10−77.59 × 10−71.74 × 10−68.09 × 10−6
Transporting1.90 × 10−61.06× 10−66.89 × 10−71.07 × 10−61.67 × 10−63.23 × 10−61.04 × 10−5
Table 6. Statistical values of the DALY in different stages of each grain.
GrainStageDALY/aQuantiles
MinMaxMean5%20%50%90%100%
MaizeOut-warehousing0.012.760.630.200.350.571.072.76
In-warehousing0.123.281.010.430.640.941.583.28
Transporting0.012.310.540.150.290.490.932.31
RiceOut-warehousing0.012.280.480.090.230.430.892.28
In-warehousing0.012.200.460.110.240.420.822.20
Transporting0.143.050.890.380.570.841.403.05
WheatOut-warehousing0.012.380.530.150.290.480.942.38
In-warehousing0.012.640.400.070.190.360.732.64
Transporting0.112.830.830.350.530.771.312.83
Publisher’s Note: MDPI stays neutral with regard to jurisdictional claims in published maps and institutional affiliations.

