Article

Spatial and Temporal Analysis of Dry and Wet Spells in the Wadi Cheliff Basin, Algeria

1
Laboratory of Water & Environment, Faculty of Nature and Life Sciences, University Hassiba Benbouali of Chlef, Chlef 02180, Algeria
2
National Higher School of Agronomy, ENSA, Hassan Badi, El Harrach, Algiers 16200, Algeria
3
Department of Civil Engineering and NOAA-CREST, The City College of New York, New York, NY 10031, USA
4
Department of Sanitary Engineering and Water Management, University of Agriculture in Krakow, Mickiewicza 24/28 Street, 30-059 Krakow, Poland
5
National Research Council of Italy, Institute for Agriculture and Forest Systems in the Mediterranean (CNR-ISAFOM), 87036 Rende (CS), Italy
*
Author to whom correspondence should be addressed.
Atmosphere 2021, 12(6), 798; https://doi.org/10.3390/atmos12060798
Submission received: 14 May 2021 / Revised: 16 June 2021 / Accepted: 17 June 2021 / Published: 21 June 2021

Abstract

:
The Mediterranean Basin, located in a transition zone between the temperate and rainy climate of central Europe and the arid climate of North Africa, is considered a major hotspot of climate change, subject to water scarcity and drought. In this work, dry and wet spells have been analyzed in the Wadi Cheliff basin (Algeria) by means of annual precipitation observed at 150 rain gauges in the period 1970–2018. In particular, the characteristics of dry and wet spells (frequency, duration, severity, and intensity) have been evaluated by means of the run theory applied to the 12-month standardized precipitation index (SPI) values. Moreover, in order to detect possible tendencies in the SPI values, a trend analysis has been performed by means of two non-parametric tests, the Theil–Sen and Mann–Kendall test. The results indicated similar values of frequency, severity, duration, and intensity between the dry and the wet spells, although wet events showed higher values in the extreme. Moreover, the results of the trend analysis evidenced a different behavior between the northern side of the basin, characterized by a negative trend in the 12-month SPI values, and the southern side, in which positive trends were detected.

1. Introduction

Drought, similar to floods, is a dangerous natural hazard that can affect almost every region of the world at any time. Its genesis and course depend on many factors, both natural and those resulting from human pressure. Unlike floods, drought develops gradually and exhibits a high temporal inertia, so its symptoms are often underestimated and mistakenly perceived as less of a threat to humans compared to other natural disasters. Long-term droughts affect all sectors of the economy and, as a result, society as a whole. Drought is mainly related to a rainfall deficit leading to a decrease in water supplies affecting the flora and fauna of a given region [1,2]. Meteorological drought is characterized by a deficit of precipitation, an elevated temperature, and low humidity. These anomalies then propagate to impact the surface water and groundwater sources, ecosystems, and human activities. The impact of drought on society, the environment, and the economy depends on its duration and spatial extent. Water stress or water deficit caused by drought has a substantial influence on low production in major agricultural crops [3,4].
The extent of the water deficit on the land surface can be quantified by various indices based on meteorological variables. These include the Palmer Drought Severity Index (PDSI), the Crop Moisture Index (CMI), the Surface Water Supply Index (SWSI), the Rainfall Anomaly Index (RAI), the Standardized Precipitation Index (SPI), and the Standardized Precipitation Evapotranspiration Index (SPEI) [5,6]. The World Meteorological Organization has recommended that the standardized precipitation index (SPI) developed by McKee et al. [7] is used as a universal meteorological drought index because of its standardized form and the lower requirement of available data that is needed [8,9,10,11]. For example, a study described by Ekewzuo and Ezeh [12] and performed in West Africa used a 3-month SPI and showed that the most exposed area to extreme drought conditions occurs over the northern Sahel domain though the frequency of occurrence is very low.
In general, climate change has worsened the extremes of high temperature and both low and high precipitation, and thus has increased the risk of drought [13,14]. For example, Vilaj et al. [15] reported that the SPI reveals an increasing occurrence of droughts in Kerala, India, caused by a decreasing trend of extreme precipitation indexes and an increasing trend of extreme temperature indexes. Algeria is a good example of the worrying manifestations of climate change. As Hadour et al. [16] reported for the RCP8.5 scenario, a decrease in winter rains for the 2039, 2069, and 2099 horizons is projected, while the temperatures will increase. To help with water management under this increasing risk of drought, spatially detailed long-term meteorological data are needed. These data can inform an analysis of the tendency of meteorological drought indicators and better represent their spatiotemporal complexity. The western part of Algeria has experienced several droughts over the last century [16,17,18]. Drought effects within the country are modulated by the high heterogeneity of the spatial distribution of the rainfall [19].
The variability of precipitation and thus the variability of the drought intensity is linked with many physical mechanisms. For example, in the Iberian Peninsula, Vicente-Serrano et al. [20] linked the increasing drought tendency with greater atmospheric evaporative demand associated with temperature rises. Markonis et al. [21] showed that drier conditions over the Mediterranean are in accordance with a recent north–south polarization of drought patterns over Europe. Parry et al. [22] analyzed three major pan-European droughts in the second half of the twentieth century through synoptic conditions and large-scale circulation patterns, emphasizing that each major drought episode had its own unique spatiotemporal signature. Studies performed by Littman [23] evidenced the influence of the phase pace of the NAO (North Atlantic Oscillation) teleconnection pattern on the precipitation and temperature variability in Turkey. Kingston et al. [24] found that the combination of the NAO and the EA/WR circulation patterns was the most important driver of drought that the European land area was experiencing on a monthly time scale. López-Moreno and Vicente-Serrano [25] found opposing NAO–SPI relationships between northern and southern Europe. Precipitation and drought are also linked to sea surface temperature (SST) anomalies [26,27].
The Wadi Cheliff is the longest river in Algeria and plays a vital role in its socio-economic development. The Wadi originates from the Saharan Atlas, near Aflou in the mountains of the Jebel Amour, and has a length of approximately 750 km, flowing into the Mediterranean Sea. Accordingly, the present paper shows the results from an analysis of meteorological drought performed on a large number of (150) rainfall stations with long-term precipitation records, which is a unique contribution for the Wadi Cheliff basin.
The aim of the paper is the spatiotemporal analysis of the Standardized Precipitation Index (SPI) variability on the Wadi Cheliff basin in the period 1970–2018. Run theory has been applied on the 12-month SPI series and some characteristics of the drought and wet spells have been identified. Additionally, trends of annual 12-month SPI are shown.

2. Materials and Methods

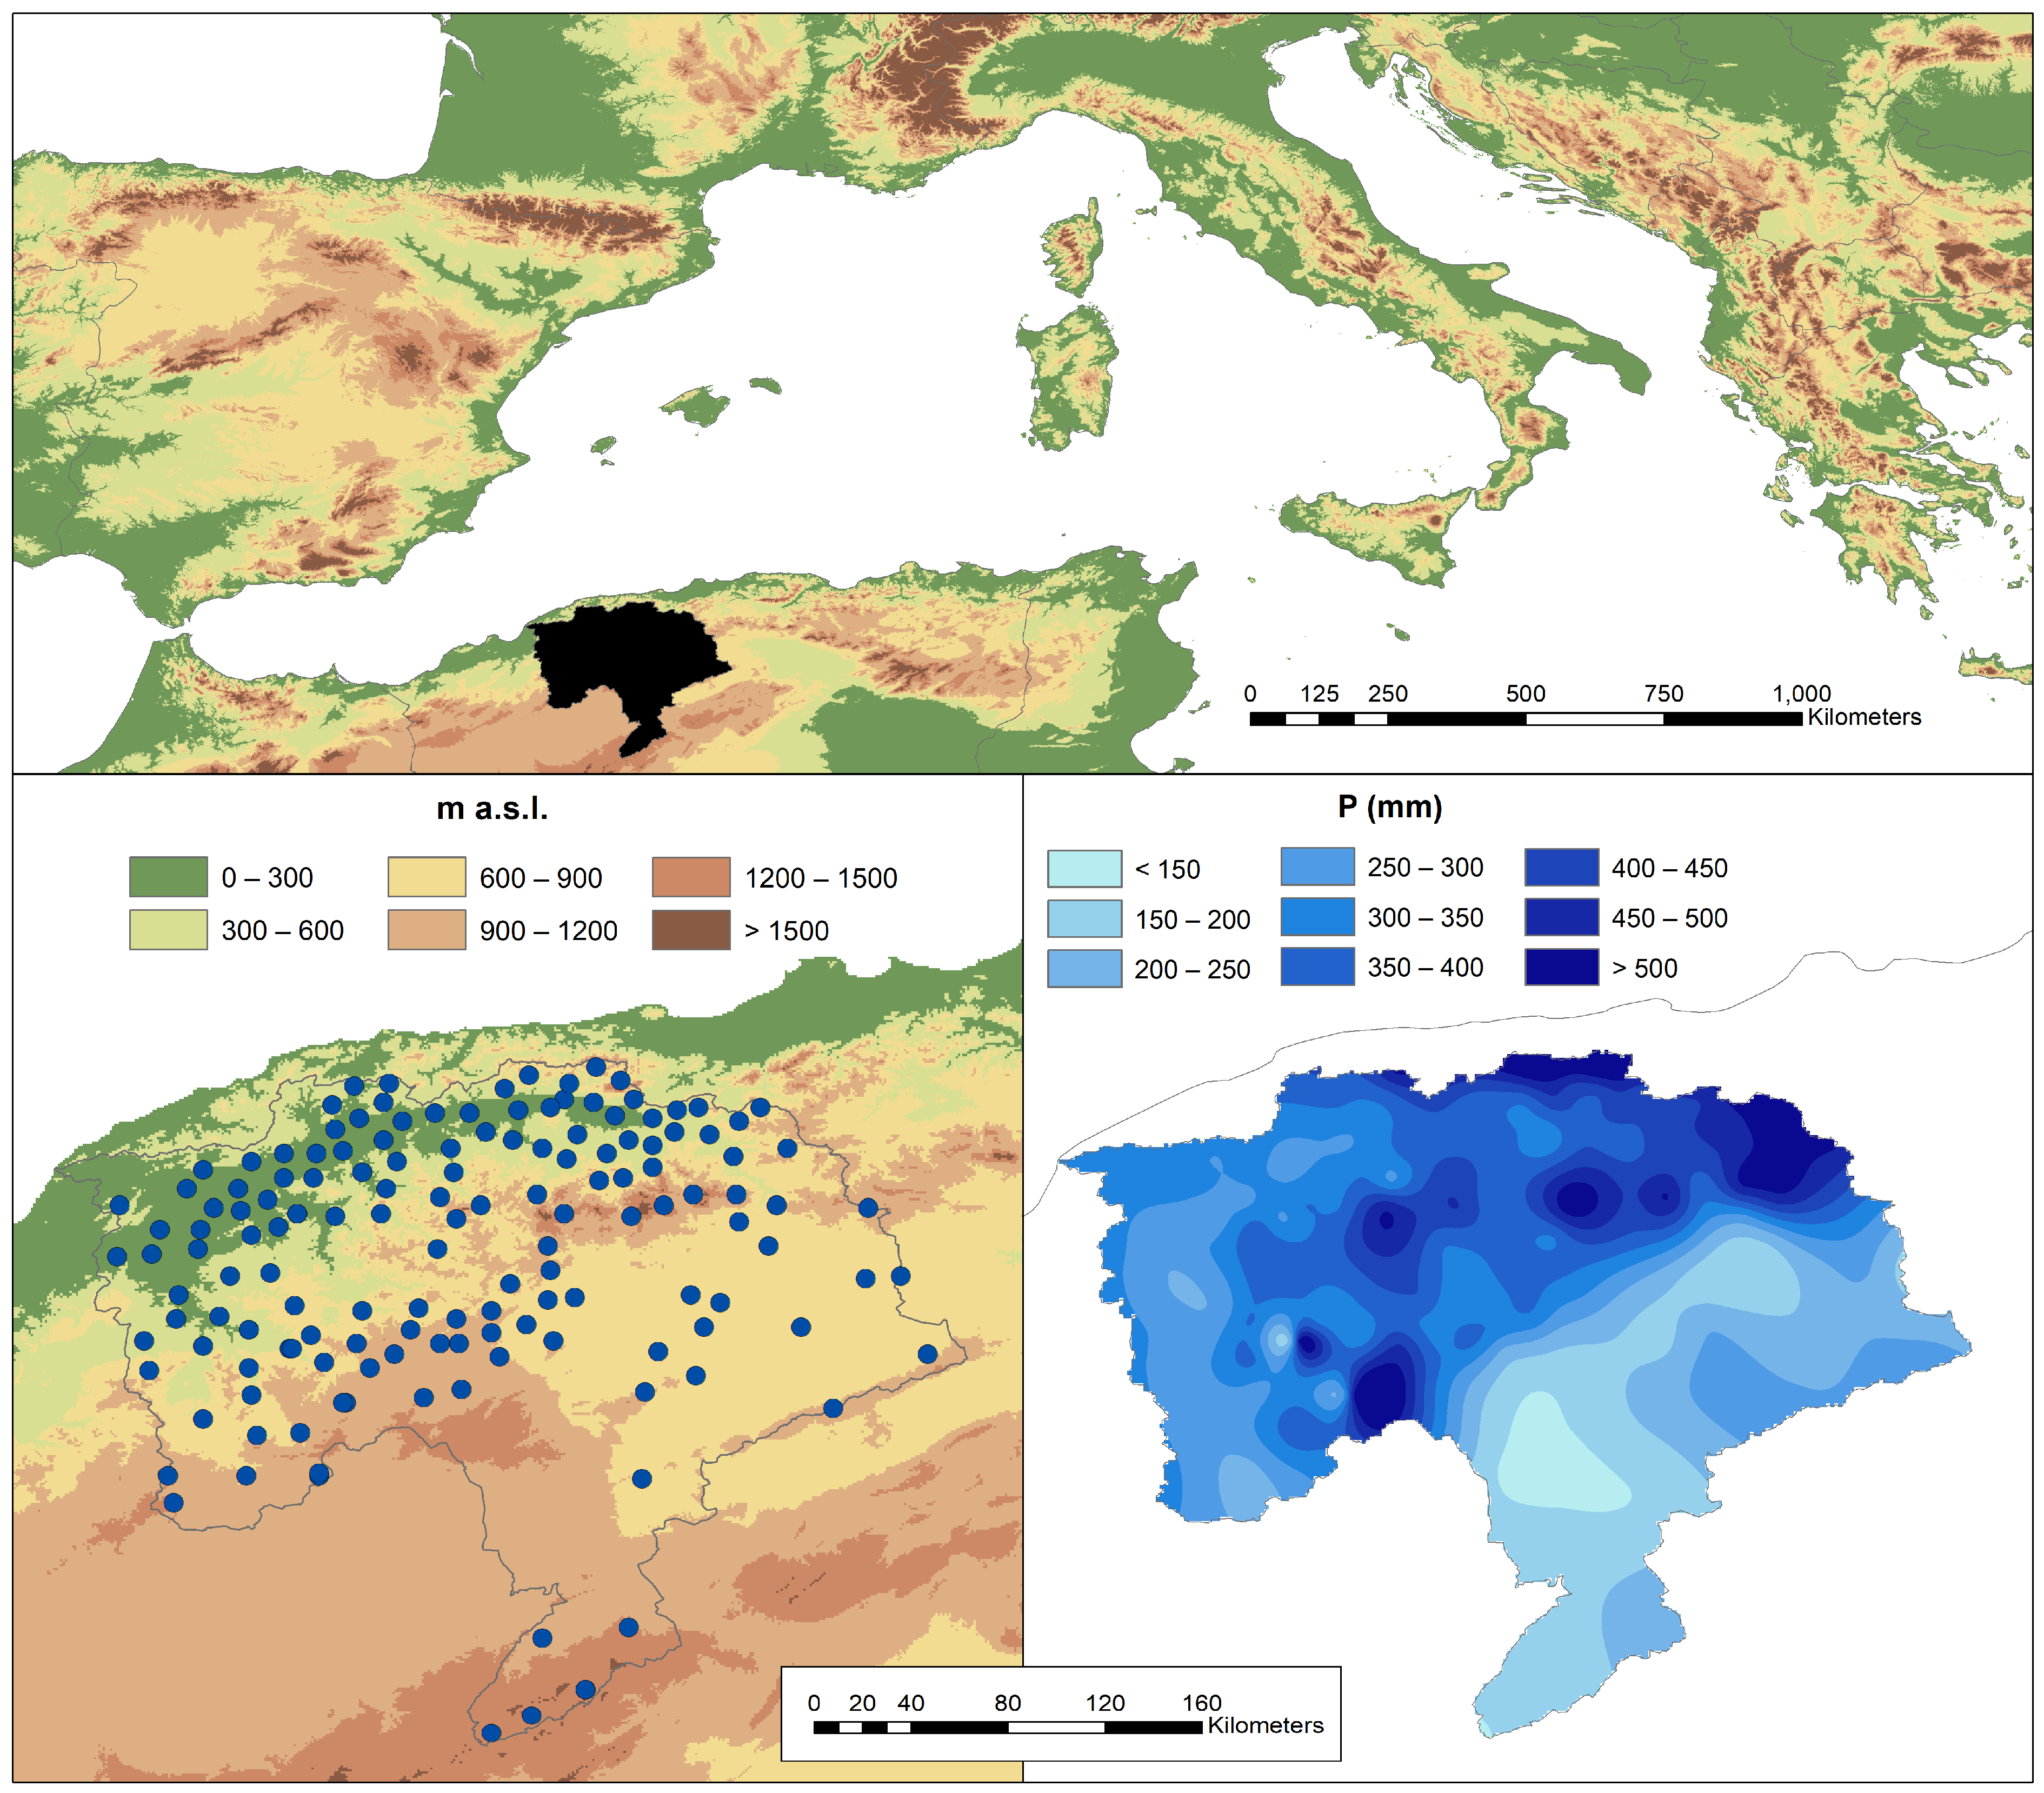
2.1. Study Area and Data

The Wadi Cheliff Basin (WCB) covers an area of 43,750 km2 and lies between 00°07′44″ E and 03°31′07″ E and between 33°53′13″ N and 36°26′34″ N (Figure 1). The topography of the basin is complex and rugged. The altitude varies from −4 m to 1969 m.
Climatically, the basin is arid and semi-arid. The mean annual temperature decreases gradually from the north to south as the elevation increases going upstream [28]. The mean annual precipitation recorded at different stations (1970–2018) ranged from 161 mm to 662 mm, 80% of which fell between November and March. For this study, datasets of several rainfall stations (Figure 1) with long-term annual precipitation records from 1970 to 2018 across the WCB were taken from the National Agency of the Water Resources (ANRH). However, the period of the records for these stations varies and some have missing records. To improve the data quality, only the observing stations with data series accounting for 70% or more of the overall period were chosen for our study. After excluding the stations with too many missing values, the double mass curve technique was used to analyze the remaining missing data. The data was subjected to quality control and data gap filling using the linear regression method. The period of study was chosen as 1970–2018, which is as long as possible based on the availability of recorded data for the majority of the stations in the region [29].

2.2. The Standardized Precipitation Index (SPI)
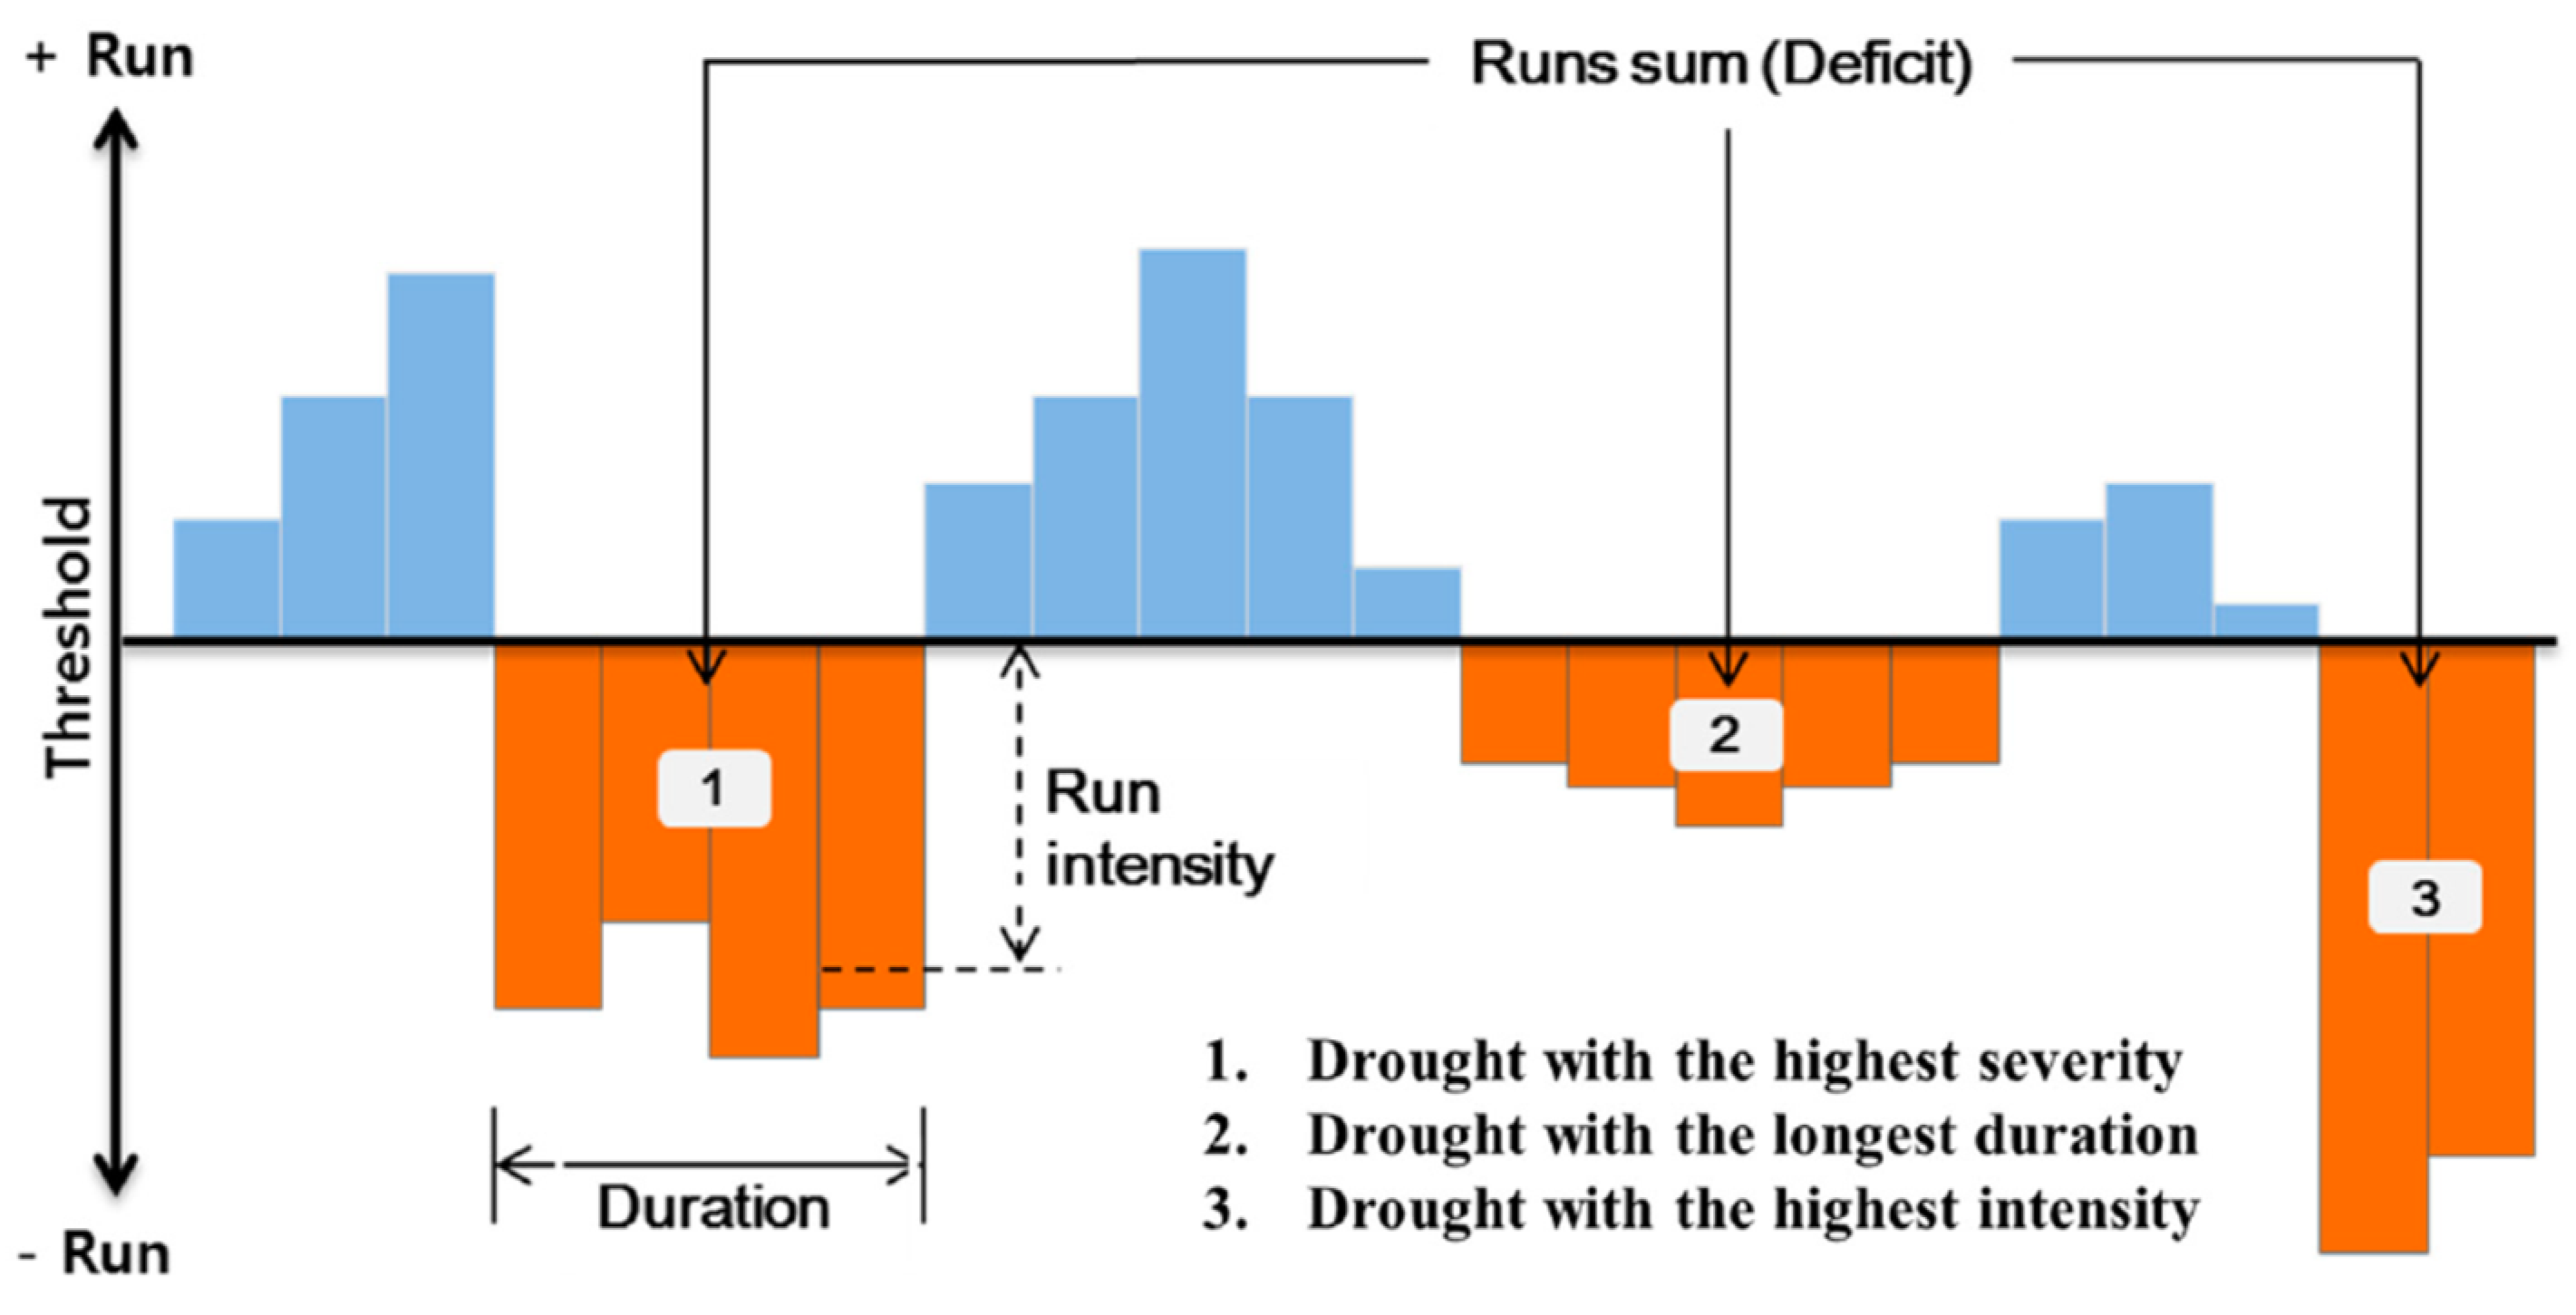
The SPI is an index by which we can evaluate wet and the dry spells for any region in the world. According to McKee et al. [7], drought has a beginning date, an end date, a drought intensity and a drought magnitude. The SPI quantifies the intensity of a drought or wet spell and is mathematically based on the cumulative probability of the precipitation amount recorded at each station.
A period of observation at one meteorological station was used to determine the parameters of scaling and the forms of precipitation probability density function:
g ( x ) = 1 β α Γ ( α ) x α 1 e x / β   for   x > 0
where α and β are the shape and scale parameters respectively, x is the precipitation amount and Γ(α) is the gamma function. The gamma function is defined as follows:
Γ ( α ) = 0 y α 1 e y dy .
The shape and scale parameters can be estimated using the approximation of Thom [30]:
α = 1 4 A ( 1 + 1 + 4 A 3 ) ,
and
β = x ¯ α ,
with
A = ln ( x ¯ )   ln ( x ) n ,
where x ¯ is the mean value of the precipitation quantity; n is the precipitation measurement number; x is the quantity of the precipitation in a sequence of data.
The acquired parameters were further applied to determine the cumulative probability of a certain precipitation for a specific time period in a time scale of all the recorded precipitation. The cumulative probability can be presented as:
G ( x ) = 0 x g ( x ) dx = 1 β α Γ ( α ) 0 x x α 1 e x / β dx ,
Since the gamma distribution is undefined for a rainfall amount x = 0, in order to take into account the zero values that occur in a sample set, a modified cumulative distribution function (CDF) must be considered.
H ( x ) = q + ( 1 q ) G ( x ) ,
with G(x) the CDF and q the probability of zero precipitation, given by the ratio between the number of zeros in the rainfall series (m) and the number of observations (n).
The calculation of the SPI is presented on the basis of the following equation [31,32]
SPI = { ( t c 0 + c 1 t + c 2 t 2 1 + d 1 t + d 2 t 2 + d 3 t 3 ) 0   <   H ( x ) 0.5 + ( t c 0 + c 1 t + c 2 t 2 1 + d 1 t + d 2 t 2 + d 3 t 3 ) 0.5   <   H ( x ) 1.0 ,
where t is determined as:
t = { ln ( 1 ( H ( x ) ) 2 ) 0 <   H ( x ) 0.5 ln ( 1 ( 1 H ( x ) ) 2 ) 0.5   <   H ( x ) 1.0 ,
and c0, c1, c2, d1, d2 and d3 are coefficients whose values are:
c0 = 2.515517, c1 = 0.802853, c2 = 0.010328
d1 = 1.432788, d2 = 0.189269 d3 = 0.001308
According to the criteria of McKee et al. [7], severe and extreme droughts correspond to categories of negative SPI (below-average precipitation amount), as shown in Table 1.

2.3. Run Theory

The run theory proposed by Yevjevich [33] refers to the occurrence of consecutive comparable conditions, such as wet or dry periods, allowing the characterization of each spell by assessing some characteristics such as duration, frequency, severity, and intensity. Figure 2 shows an example of the run theory for a fixed threshold.
A “run” is defined as an interval in which the values are all above (positive run) or below (negative run) the threshold [33]. Once the runs, and thus the dry (SPI below the threshold) or wet (SPI over the threshold) spells, have been identified, it is possible to extract some characteristics. The percentage of dry or wet spells over the study period constitute the dry (DF) and wet (WF) frequencies. The dry and wet durations (DD and WD) are the time period lengths in which SPI values are constantly below or above the threshold. Durations can be expressed in weeks, months, years or any other time period. The average drought and wet durations (ADD and AWD) are the ratio between the sum of the durations of all the drought and wet spells and the number of drought and wet spells (ND and NW). The cumulated drought and wet values during each spell represent the drought and wet severities (DS and WS). The average drought and wet severities (ADS and AWS) are the ratio between the sum of the DS and WS of all the spells and ND and NW, respectively. The drought and wet intensities (DI and WI) were evaluated, for each event, as the ratio between the DS and DD and the WS and WD, respectively, thus the average drought and wet intensities (ADI and AWI) are the ratios between the sum of the DI and WI of all the spells and ND and NW, respectively.
In this study, drought and wet periods were evaluated considering the SPI thresholds of −1 and 1, respectively. Moreover, duration, severity, and intensity were estimated using the run theory applied to the 12-month SPI series, and thus DD and WD are expressed in years. This methodology has been applied in past studies performed for several areas of the world [35].

2.4. Theil–Sen Estimator

Considering that precipitation is often non normally distributed, the Theil–Sen estimator is generally considered more powerful than the linear regression methods in trend magnitude evaluation, because it is not subject to the influence of extreme values [36]. Given x1, x2, …, xn precipitation observations at times t1, t2,…, tn (with t1 < t2 < … < tn), for each N pairs of observations xj and xi taken at times tj and ti, the gradient Qk can be calculated as:
Q k = x j x i t j t i   for   k = 1 , , N ,
with 1 < i < j < n and tj > ti.
The estimate of the trend in the data series x1, x2, …, xn can then be calculated as the median Qmed of the N values of Qk, ranked from the smallest to the largest:
Q m e d = { Q [ ( N + 1 ) / 2 ] i f N i s o d d Q [ N / 2 ] + Q [ ( N + 2 ) / 2 ] 2 i f N i s e v e n
The Qmed sign reveals the trend behavior, while its value indicates the magnitude of the trend.

2.5. Mann–Kendall Test
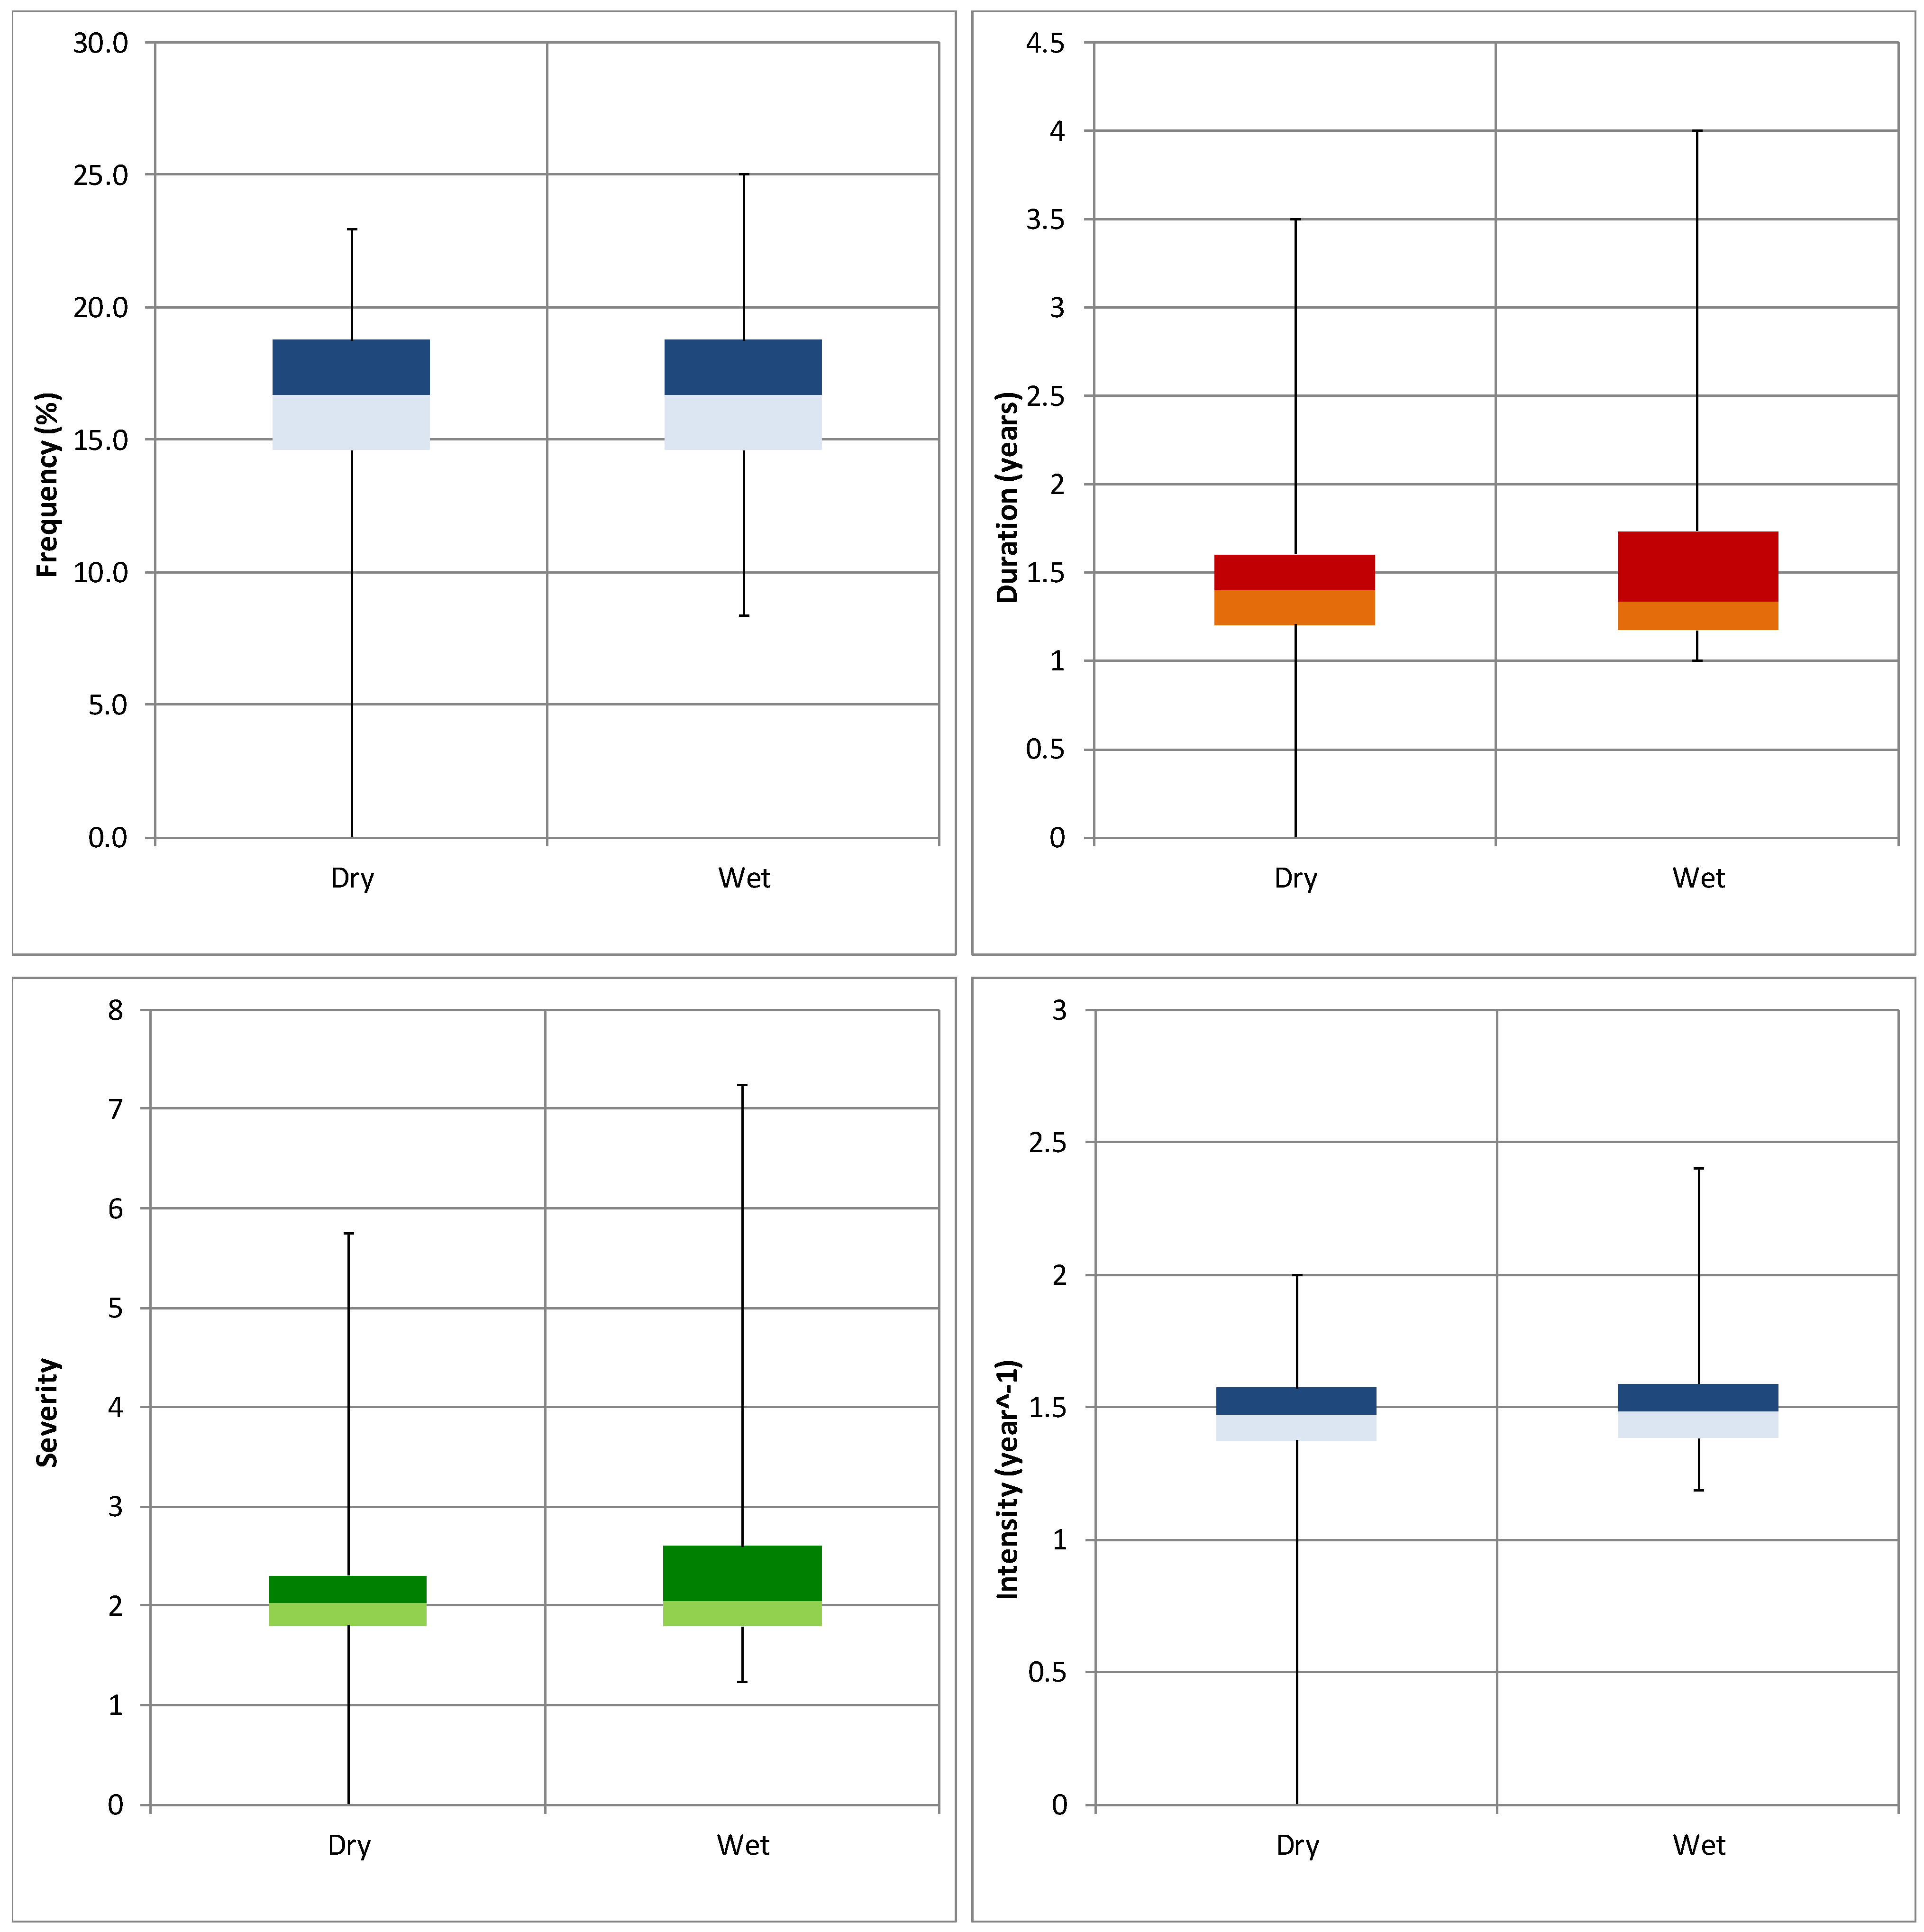
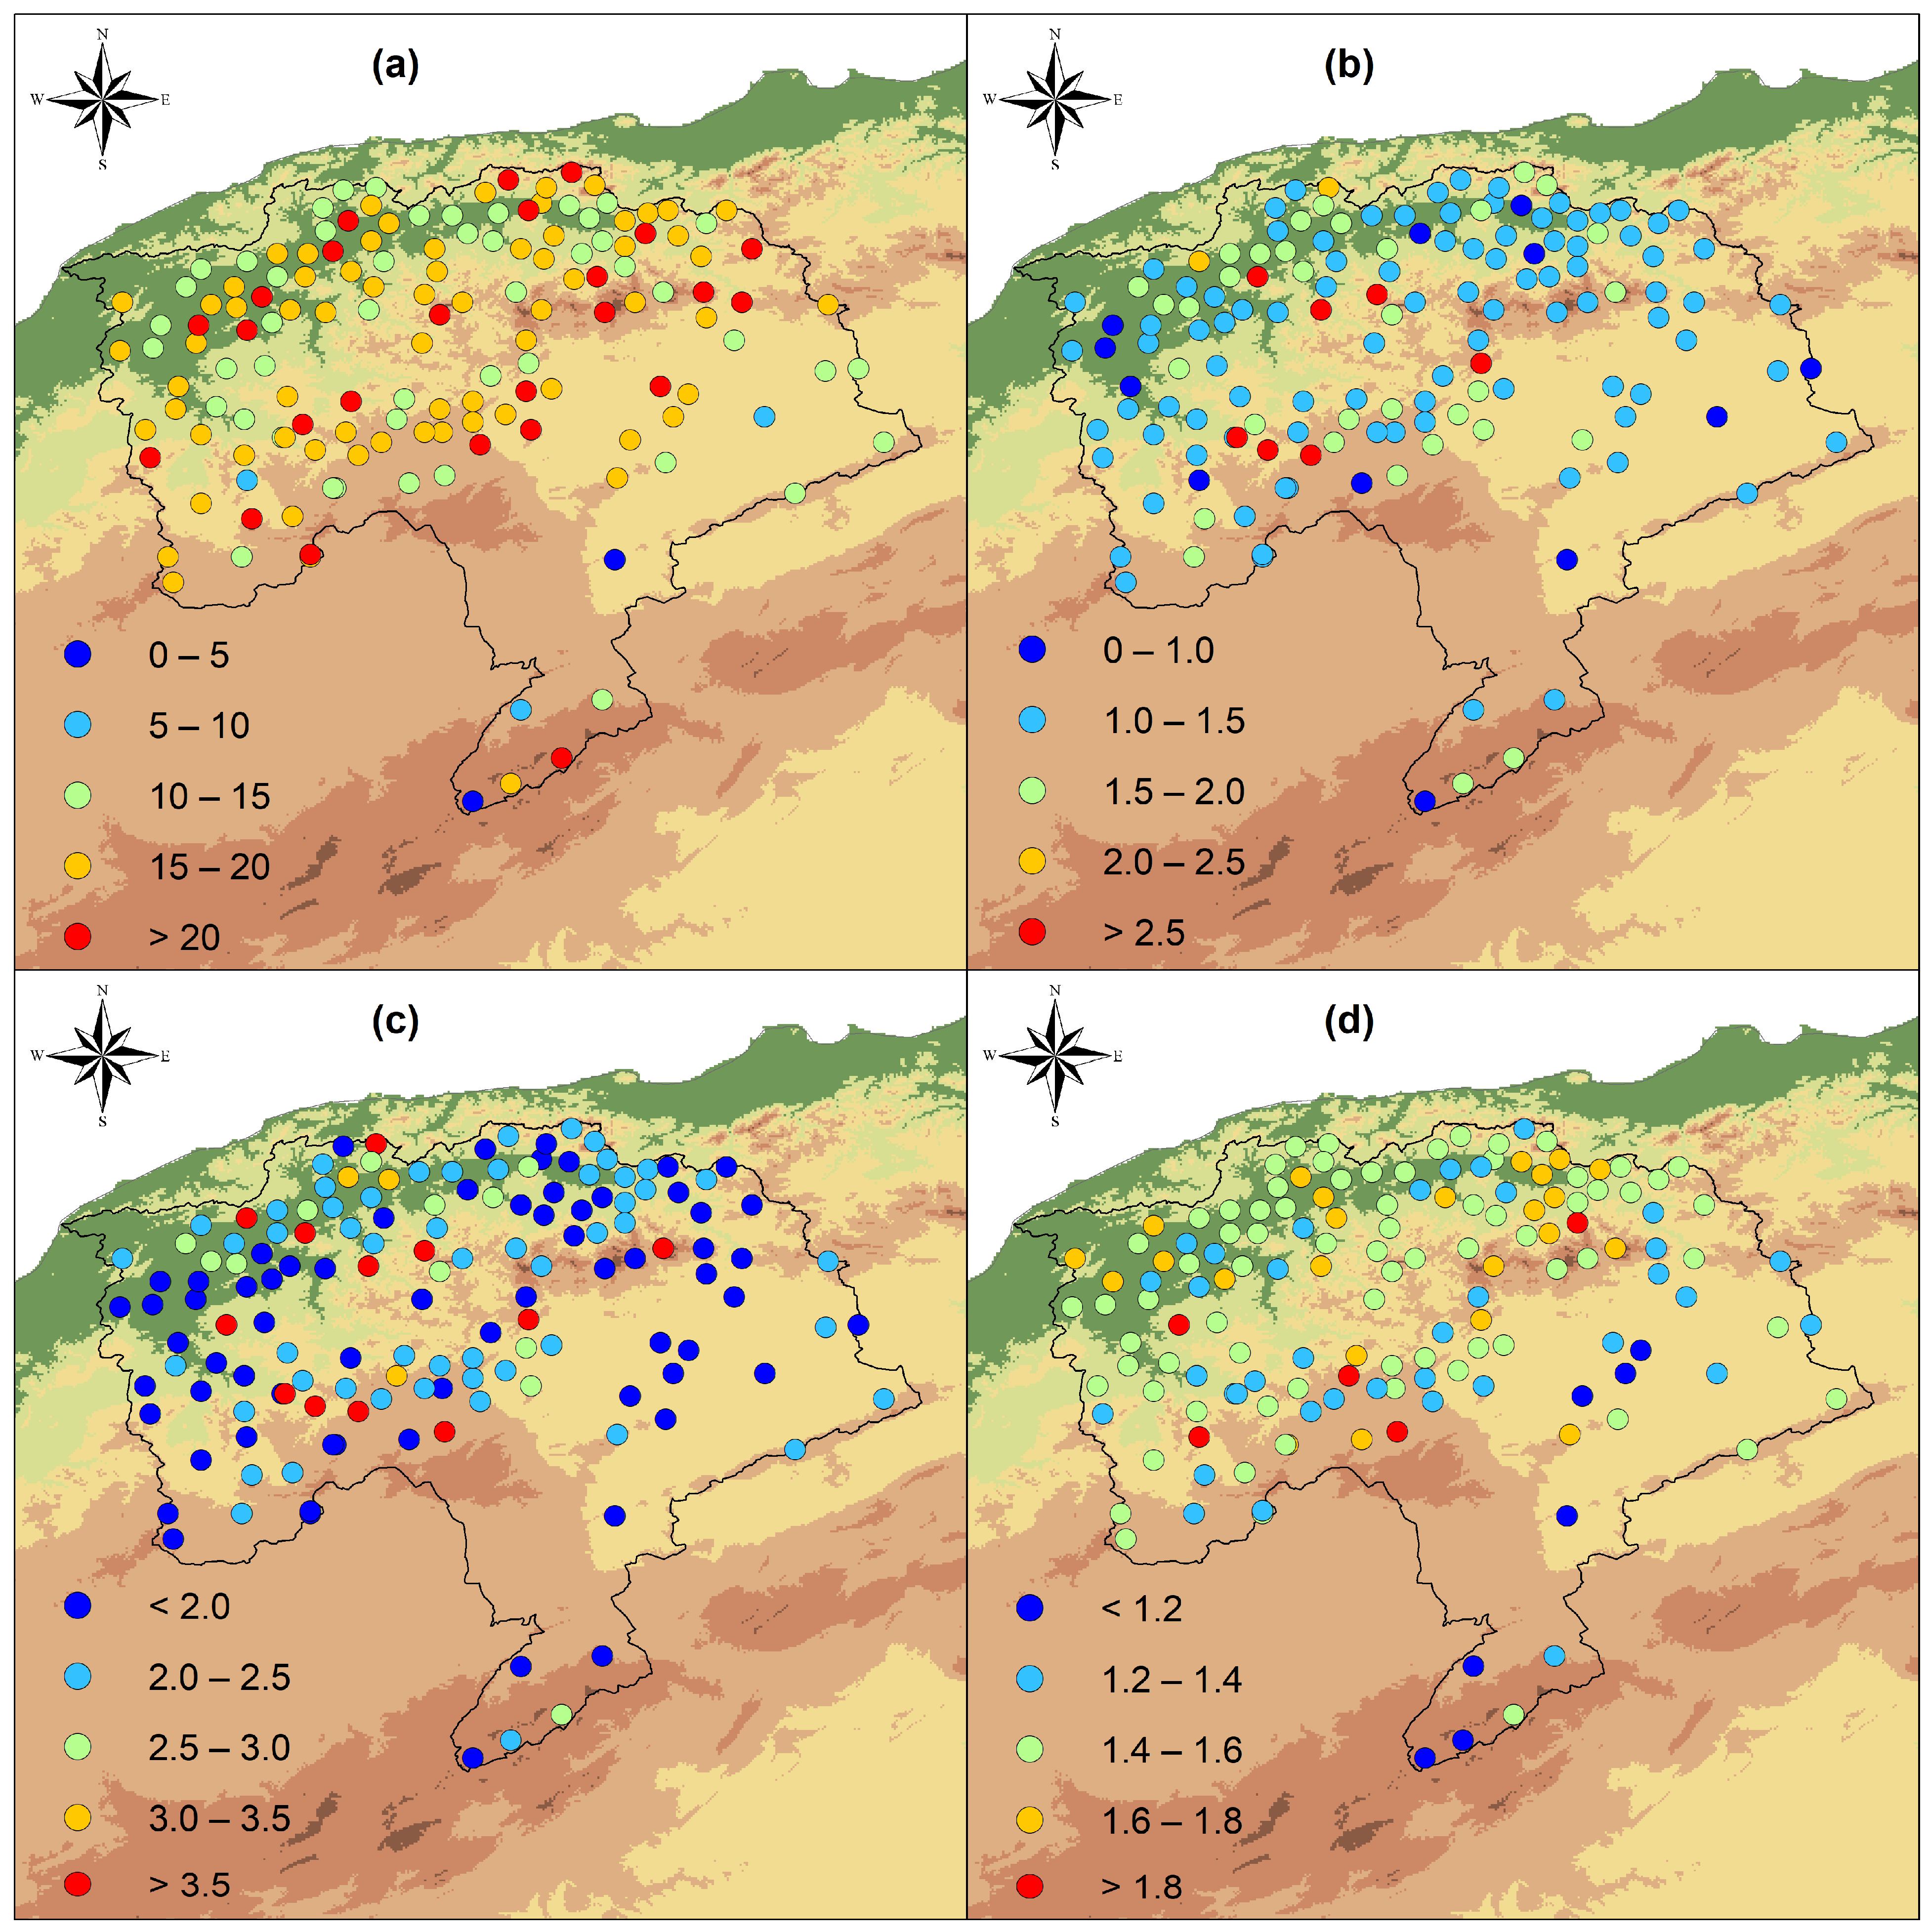
As regards the MK test [37,38], in order to evaluate the trend significance, the statistic S based on the rank sums is calculated as:
S = i = 1 n 1 j = i + 1 n sgn ( x j x i )   where   sgn ( x j x i ) = { 1   if   ( x j x i ) > 0 0   if   ( x j x i ) = 0 1   if   ( x j x i ) < 0
In which xj and xi are the observations taken at times j and i (with j > i), respectively, and n is the dimension of the series.
Under the null hypothesis H0, the distribution of S is symmetrical and is normal in the limit as n becomes large, with zero mean and variance:
Var ( S ) = [ n ( n 1 ) ( 2 n + 5 ) i = 1 m t i i ( i 1 ) ( 2 i + 5 ) ] / 18
in which ti indicates the number of ties with extend i.
Given the variance of S, it is possible to evaluate the standardized statistic ZMK as:
Z MK = { S 1 Var ( S ) for   S > 0 0 for   S = 0 S + 1 Var ( S ) for   S < 0
By applying a two-tailed test, for a specified significance level α, the significance of the trend can be evaluated.

3. Results

Figure 3 shows the boxplots with the main statistics of DF, WF, ADD, AWD, ADS, AWS, ADI, and AWI. Generally, similar values were evaluated between the dry and the wet spells although higher frequencies and durations of wet events were detected in the minimum and in the maximum values across the 150 stations. In fact, as regards the frequency, the DF ranged between 0 and almost 23% while the WF ranged between 8.3 and 25%. Similarly, considering the duration, ADD and AWD showed almost the same median, but maximum values of 3 and 4 years were obtained for ADD and AWD, respectively. This behavior has been confirmed also for the severity and the intensity, with AWS and AWI showing minimum and maximum values higher than the ones obtained for ADS and ADI.
Figure 4 shows the spatial distribution of DF, ADD, ADS and ADI. With respect to the dry frequency, the highest values largely involved the northern side of the basin, although in one station on the southern side a DF value higher than 20% was detected. Conversely, the southern side of the basin, which is the area with the highest elevation in which few rain gauges are located, was characterized by the lowest values of DF, and two rain gauges did not show any dry event (Figure 4a).
The average dry duration did not present any noteworthy spatial behavior. In fact, the lowest values (≈1 year) were distributed across the basin, while the highest ones (>2.5 years) were localized in the central part of the basin, but without any clear connection with orography (Figure 4b).
A spatial behavior similar to ADD was detected for ADS (Figure 4c). Indeed, from the spatial distribution of the average dry severity it is not possible to identify definite areas characterized by the highest values (>3.5 year), which were spread across the central part of the basin.
Finally, the spatial distribution of the average dry intensity evidenced some differences between the northern and the southern side of the basin (Figure 4d). In fact, the ADI values showed a distribution quite similar to the one obtained for the DF values, with intensities lower than 1.2 localized in the southeastern part of the basin, especially in the stations characterized by the highest elevations.
Figure 5 is similar to Figure 4 but for the wet events and, thus, it shows the spatial distribution of WF, AWD, AWS, and AWI.
Regarding the frequency of the wet events, values higher than 20% were detected in several areas of the basin, without any particular geographical difference and without any connection with the orography (Figure 5a). Similarly, the average wet duration did not show any significant spatial behavior with the lowest values (<1.5 years) distributed across the basin and only two stations showed AWD values higher than 3 years (Figure 5b).
Differently from DF and ADD, the spatial distributions of the average wet severity and intensity evidenced some differences between the northern and the southern side of the basin (Figure 5c,d). In fact, for both AWS and AWI the highest values were localized in the southern part of the basin, especially in the stations characterized by the highest elevations.
In order to detect the temporal evolution of drought in the period 1970–2018, the 12-month SPI series were tested for trends through the Theil–Sen estimator and the Mann–Kendall test. As a result, for a SL = 95%, 26 out of 150 stations (i.e., 39%) showed a negative trend while an opposite behavior was detected in 13 out of 150 stations (i.e., 19.5%). Spatially, the negative trend mainly involved the northern areas of the basin, with a maximum decrease of more than −0.3/10 years (Figure 6). On the contrary, a positive trend was evidenced in the southern part of the basin reaching values between 0.2 and 0.3/10 years.
Finally, with the aim to assess the drought response to the global circulation variability, a correlation analysis between the SPI values and the NAO was computed for each station. As a result, a clear link between drought and the NAO was evidenced. In particular, negative correlation values (<−0.4) mainly involved the northern areas of the basin, while a positive correlation was evidenced in the southern part of the basin (Figure 7).

4. Discussion

Although a lack of precipitation can be considered an ordinary part of the seasonal climatic cycle within the Mediterranean basin, future climate projections have identified the Mediterranean region as an area particularly subject to water scarcity and drought [39]. In order to monitor the drought phenomenon and to assess the climate anomalies quantitatively in terms of intensity, duration, frequency, recurrence probability, and spatial extent, several indices have been developed [40]. Among the several indices, the SPI has been applied in the trend detection of drought in many areas of the world [41]. While a trend analysis on the SPI values can only point out the possible changes in the expected precipitation amount over the years, the study of some of the main drought characteristics such as frequency, duration, severity, and intensity is essential for politicians, local communities, and stakeholders to identify the most vulnerable areas and their drought features.
The detection of these characteristics is particularly relevant for Algeria, which some studies have identified as one of the countries in North Africa that will become a global hot spot for drought by the end of the twenty-first century [42]. In fact, the results of this study evidenced a great spatiotemporal variability in wet and dry episodes in the Cheliff Basin, with different results obtained between the northern side of the basin, characterized by the highest annual rainfall values, and the southern part, where annual rainfall values below 250 mm have been registered. In particular, the results in this area could be influenced by the low total amount of precipitation, which makes it more difficult to accurately detect drought development. The main outcomes of this study allow an identification of the areas, in the northern side of the basin, that could also face water stress conditions in the future, thus requiring drought monitoring and adequate adaptation strategies. At the same time, in the area currently suffering from a water deficit, an increase in the wet episodes has been detected, which is an important result that can inform people involved in the water resource management of the changing potential for flooding and water storage. The different behavior between the northern and the southern part of the basin has been pointed out in previous works e.g., in [29], the authors of which evidenced an annual rainfall decrease of more than 20 mm/10 years on the northern side and an increase of about 5 mm/10 years on the southern side. These results can be influenced by both global and local factors. Global factors which impact on the intra-annual precipitation distribution include teleconnection patterns [43,44]. In fact, as evidenced in Figure 7, a clear link exists between drought and the NAO. This result agrees with the results obtained by several authors e.g., [29], which evidenced that the Mediterranean rainfall regime is strongly linked to general atmospheric circulation patterns such as the El Niño Southern Oscillation (ENSO), the Mediterranean Oscillation (MO), the Western Mediterranean Oscillation (WeMO), and especially the North Atlantic Oscillation indices that are negatively correlated with precipitation in Algeria [45]. Indeed, positive NAO phases can cause dry conditions across large parts of the Mediterranean Basin, from Spain and Morocco across to the Balkans and western Turkey [46]. Specifically, a predominant negative phase of the NAO occurred between 1940 and 1980, corresponding to a period when precipitation was above normal. This was followed by a predominant positive phase, which significantly contributed to the rainfall reduction observed from the beginning of the 1980s in the Mediterranean basin, and also in Algeria [29]. Moreover, another regional-scale system that could influence the rainfall conditions in North Africa is the well-documented Sahelian drought and its multidecadal variability, which resulted from the response of the African summer monsoon to oceanic forcing and was amplified by land–atmosphere interactions [47].
In order to better appreciate the results of this study, an important final remark must be made concerning the database. In this study a high-quality database in the period 1970–2018 has been used. Unfortunately, only annual data (evaluated for water year) were available and thus it was not possible to perform a detailed analysis at a monthly scale. This study is nevertheless a valuable contribution not only to the quality of the database but also to its spatial resolution, which covers almost all the basin, with some gaps only in the central area. Continuous and spatially distributed data allowed a reliable analysis of the drought characteristics in the basin. Although globally gridded satellite-based precipitation products have become available in recent years as potential sources of data, ground-based precipitation measurements still remain the main and most accurate source in any climatological analysis [48].

5. Conclusions

This study aimed to analyze some of the main characteristics of the wet and dry events affecting the Cheliff Basin in the period 1970–2018 using the 12-month SPI, which is a broad proxy for water resource availability, evaluated from 150 rain gauges distributed across the basin. Generally, the analysis of the main statistics of the frequency, severity, duration, and intensity were evaluated for both dry and wet events, and it was found that their median values were similar, although higher minimum and maximum values were detected for the wet events. These results clearly indicate that the Cheliff Basin is at risk for extreme wet events as well as dry events. From the spatial distribution of the wet and dry characteristics, the basin areas facing water stress were identified. Finally, the results of the trend analysis performed on the 12-month SPI values evidenced a decreasing trend on the northern side of the basin and an opposite behavior on the southern side, characterized by the highest elevations and the lowest annual rainfall values, in which positive values were detected. These results, probably linked with the predominant positive NAO phase which significantly contributed to the rainfall reduction observed from the beginning of the 1980s in Algeria, could be highly relevant for people involved in natural resource management decision-making for sustainable long-term water resource management in semi-arid regions.

Author Contributions

Conceptualization, M.A.; methodology, M.A. and T.C.; software, M.A. and T.C.; formal analysis, M.A. and T.C.; validation: M.A., T.C., A.W. and N.Y.K.; investigation, M.A., T.C., A.W. and N.Y.K.; data curation, M.A.; writing—original draft preparation, M.A., T.C., A.W. and N.Y.K.; writing—review and editing, M.A., T.C., A.W. and N.Y.K.; visualization, T.C.; supervision, A.W. and N.Y.K. All authors have read and agreed to the published version of the manuscript.

Funding

This research received no external funding.

Institutional Review Board Statement

Not applicable.

Informed Consent Statement

Not applicable.

Data Availability Statement

The data presented in this study are available on request from the corresponding authors.

Conflicts of Interest

The authors declare no conflict of interest.

References

  1. Dracup, J.A.; Lee, K.S.; Edwin, G.; Paulson, J.R. On the definition of droughts. Water Resour. Res. 1980, 16, 297–302. [Google Scholar] [CrossRef]
  2. Wilhite, D.A.; Glantz, M.H. Understanding: The Drought Phenomenon: The Role of Definitions. Water Int. 1985, 10, 111–120. [Google Scholar] [CrossRef] [Green Version]
  3. Kováčová, M.; Bárek, V.; Kišš, V. DENDROMETRIC CHANGES AS WATER STRESS INDICATOR FOR SUNFLOWER (HELIANTHUS ANNUS L.) AND MAIZE (ZEA MAYS L.)—BASIC RESEARCH IN LABORATORY CONDITIONS. Acta Sci. Pol. Form. Circumiectus 2020, 19, 77–85. [Google Scholar] [CrossRef]
  4. Almendra-Martín, L.; Martínez-Fernández, J.; González-Zamora, Á.; Benito-Verdugo, P.; Herrero-Jiménez, C.M. Agricultural Drought Trends on the Iberian Peninsula: An Analysis Using Modeled and Reanalysis Soil Moisture Products. Atmosphere 2021, 12, 236. [Google Scholar] [CrossRef]
  5. Palmer, W.C. Meteorological droughts. In U.S. Department of Commerce Weather Bureau Research Paper 45; US Deptartment of Commerce: Washington, DC, USA, 1965; p. 58. [Google Scholar]
  6. Zhou, J.; Wang, Y.; Su, B.; Wang, A.; Tao, H.; Zhai, J.; Kundzewicz, Z.; Jiang, T. Choice of potential evapotranspiration formulas influences drought assessment: A case study in China. Atmos. Res. 2020, 242, 104979. [Google Scholar] [CrossRef]
  7. McKee, T.B.; Doesken, N.J.; Kleist, J. The relationship of drought frequency and duration to time scales. In Proceedings of the 8th Conference on Applied Climatology, Boston, MA, USA, 17–22 January 1993; Volume 17, pp. 179–183. [Google Scholar]
  8. WMO. Drought Monitoring and Early Warning: Concepts, Progress and Future Challenges, WMO-No. 1006; World Meteorological Organization: Geneva, Switzerland, 2006; 26p. [Google Scholar]
  9. Svoboda, M.; Hayes, M.; Wood, M. (Eds.) WMO Standardized Precipitation Index User Guide; World Meteorological Organization Report WMO-No. 1090; World Meteorological Organization: Geneva, Switzerland, 2012. [Google Scholar]
  10. Hayes, M.J.; Svoboda, M.; Wall, N.A.; Widhalm, M. The Lincoln Declaration on Drought Indices: Universal Meteorological Drought Index Recommended. Bull. Am. Meteorol. Soc. 2011, 92, 485–488. [Google Scholar] [CrossRef] [Green Version]
  11. Fellag, M.; Achite, M.; Wałęga, A. Spatial-temporal characterization of meteorological drought using the Standardized precipitation index. Case study in Algeria. Acta Sci. Pol. Form. Circumiectus 2021, 20, 19–31. [Google Scholar]
  12. Ekwazuo, C.S.; Ezeh, C.U. Regional characterization of meteorological drought and floods over West Africa. Sustain. Water Resour. Manag. 2020, 6, 1–15. [Google Scholar]
  13. Ojeda, M.G.-V.; Gámiz-Fortis, S.R.; Romero-Jiménez, E.; Rosa-Cánovas, J.J.; Yeste, P.; Castro-Díez, Y.; Esteban-Parra, M.J. Projected changes in the Iberian Peninsula drought characteristics. Sci. Total Environ. 2021, 757, 143702. [Google Scholar] [CrossRef]
  14. Zechiel, P.; Chiao, S. Climate Variability of Atmospheric Rivers and Droughts over the West Coast of the United States from 2006 to 2019. Atmosphere 2021, 12, 201. [Google Scholar] [CrossRef]
  15. Vijay, A.; Sivan, S.D.; Mudbhatkal, A.; Mahesha, A. Long-Term Climate Variability and Drought Characteristics in Tropical Region of India. J. Hydrol. Eng. 2021, 26, 05021003. [Google Scholar] [CrossRef]
  16. Hadour, A.; Mahé, G.; Meddi, M. Watershed based hydrological evolution under climate change effect: An example from North Western Algeria. J. Hydrol. Reg. Stud. 2020, 28, 100671. [Google Scholar] [CrossRef]
  17. Taibi, S.; Meddi, M.; Mahé, G.; Assani, A. Relationships between atmospheric circulation indices and rainfall in Northern Algeria and comparison of observed and RCM-generated rainfall. Theor. Appl. Clim. 2015, 127, 241–257. [Google Scholar] [CrossRef]
  18. Zeroual, A.; Meddi, M.; Bensaad, S. The impact of climate change on river flow in arid and semi-arid rivers in Algeria. In Climate and Land-Surface Changes in Hydrology, Proceedings of the H01, IAHS-IAPSO-IASPEI Assembly, Gothenburg, Sweden, 22–26 July 2013; IAHS Publicaions: Wallingford, UK, 2013; Volume 359, pp. 105–110. [Google Scholar]
  19. Meddi, H.; Meddi, M. Variabilité spatiale et temporelle des précipitations du Nord-Ouest de l’Algérie. Géogr. Tech. 2007, 2, 49–55. [Google Scholar]
  20. Vicente-Serrano, S.M.; Lopez-Moreno, J.I.; Beguería, S.; Lorenzo-Lacruz, J.; Sanchez-Lorenzo, A.; García-Ruiz, J.M.; Azorin-Molina, C.; Morán-Tejeda, E.; Revuelto, J.; Trigo, R.M.; et al. Evidence of increasing drought severity caused by temperature rise in southern Europe. Environ. Res. Lett. 2014, 9, 044001. [Google Scholar] [CrossRef]
  21. Markonis, Y.; Hanel, M.; Máca, P.; Kyselý, J.; Cook, E.R. Persistent multi-scale fluctuations shift European hydroclimate to its millennial boundaries. Nat. Commun. 2018, 9, 1767. [Google Scholar] [CrossRef] [PubMed] [Green Version]
  22. Parry, S.; Prudhomme, C.; Hannaford, J.; Lloyd-Hughes, B. Examining the spatio-temporal evolution and characteristics of large-scale European droughts. In Proceedings of the BHS Third International Symposium, Newcastle, UK, 19–23 July 2010; British Hydrological Society: Loindon, UK, 2010; pp. 135–142. [Google Scholar]
  23. Littmann, T. An empirical classification of weather types in the Mediterranean Basin and their interrelation with rainfall. Theor. Appl. Clim. 2000, 66, 161–171. [Google Scholar] [CrossRef]
  24. Kingston, D.G.; Stagge, J.H.; Tallaksen, L.M.; Hannah, D.M. European-Scale Drought: Understanding Connections between Atmospheric Circulation and Meteorological Drought Indices. J. Clim. 2015, 28, 505–516. [Google Scholar] [CrossRef]
  25. López-Moreno, J.I.; Vicente-Serrano, S.M. Positive and negative phases of the winter time North Atlantic Oscillation and drought occurrence over Europe: A multi temporal scale approach. J. Clim. 2008, 21, 1220–1243. [Google Scholar] [CrossRef] [Green Version]
  26. Zhang, Y.; Wu, R. Asian meteorological droughts on three time scales and different roles of sea surface temperature and soil moisture. Int. J. Climatol. 2021, 1–18. [Google Scholar] [CrossRef]
  27. Hu, Y.; Wang, S. Associations between winter atmospheric teleconnections in drought and haze pollution over Southwest China. Sci. Total Environ. 2021, 766, 142599. [Google Scholar] [CrossRef] [PubMed]
  28. Elmeddahi, Y.; Mahmoudi, H.; Issaadi, A.; Goosen, M.F.; Ragab, R. Evaluating the Effects of Climate Change and Variability on Water Resources: A Case Study of the Cheliff Basin in Algeria. Am. J. Eng. Appl. Sci. 2016, 9, 835–845. [Google Scholar] [CrossRef] [Green Version]
  29. Achite, M.; Caloiero, T.; Wałęga, A.; Krakauer, N.; Hartani, T. Analysis of the Spatiotemporal Annual Rainfall Variability in the Wadi Cheliff Basin (Algeria) over the Period 1970 to 2018. Water 2021, 13, 1477. [Google Scholar] [CrossRef]
  30. Thom, H.C.S. A Note on the Gamma Distribution. Mon. Weather. Rev. 1958, 86, 117–122. [Google Scholar] [CrossRef]
  31. Abramowitz, M.; Stegun, I.A. Handbook of Mathematical Functions with Formulas, Graphs, and Mathematical Tables; Dover Publications, Inc.: New York, NY, USA, 1970. [Google Scholar]
  32. Lloyd-Hughes, B.; Saunders, M. Seasonal prediction of European spring precipitation from El Niño-Southern Oscillation and Local sea-surface temperatures. Int. J. Clim. 2002, 22, 1–14. [Google Scholar] [CrossRef]
  33. Yevjevich, V. An Objective Approach to Definitions and Investigation of Continental Hydrologic Droughts. In Hydrology Paper 23; Colorado State University: Fort Collins, CO, USA, 1967. [Google Scholar]
  34. Lee, S.-H.; Yoo, S.-H.; Choi, J.-Y.; Bae, S. Assessment of the Impact of Climate Change on Drought Characteristics in the Hwanghae Plain, North Korea Using Time Series SPI and SPEI: 1981–2100. Water 2017, 9, 579. [Google Scholar] [CrossRef] [Green Version]
  35. Caloiero, T.; Caroletti, G.; Coscarelli, R. IMERG-Based Meteorological Drought Analysis over Italy. Climate 2021, 9, 65. [Google Scholar] [CrossRef]
  36. Sen, P.K. Estimates of the regression coefficient based on Kendall’s tau. J. Am. Stat. Assoc. 1968, 63, 1379–1389. [Google Scholar] [CrossRef]
  37. Kendall, M.G. Rank Correlation Methods; Hafner Publishing Company: New York, NY, USA, 1962. [Google Scholar]
  38. Mann, H.B. Nonparametric tests against trend. Econometrica 1945, 13, 245–259. [Google Scholar] [CrossRef]
  39. Caloiero, T.; Veltri, S.; Caloiero, P.; Frustaci, F. Drought Analysis in Europe and in the Mediterranean Basin Using the Standardized Precipitation Index. Water 2018, 10, 1043. [Google Scholar] [CrossRef] [Green Version]
  40. Tsakiris, G.; Pangalou, D.; Vangelis, H. Regional Drought Assessment Based on the Reconnaissance Drought Index (RDI). Water Resour. Manag. 2007, 21, 821–833. [Google Scholar] [CrossRef]
  41. Caloiero, T. SPI Trend Analysis of New Zealand Applying the ITA Technique. Geosciences 2018, 8, 101. [Google Scholar] [CrossRef] [Green Version]
  42. Schilling, J.; Hertig, E.; Tramblay, Y.; Scheffran, J. Climate change vulnerability, water resources and social implications in North Africa. Reg. Environ. Chang. 2020, 20, 15. [Google Scholar] [CrossRef] [Green Version]
  43. Vicente-Serrano, S.M.; López-Moreno, J.I.; Lorenzo-Lacruz, J.; Kenawy, A.; Azorin-Molina, C.; Morán-Tejeda, E.; Pasho, E.; Zabalza, J.; Beguería, S.; Angulo-Martínez, M. The NAO Impact on Droughts in the Mediterranean Region. In Advances in Global Change Research; Springer Science and Business Media LLC: Berlin, Germany, 2011; pp. 23–40. [Google Scholar]
  44. Hoerling, M.P.; Eischeid, J.K.; Perlwitz, J.; Quan, X.; Zhang, T.; Pegion, P.J. On the Increased Frequency of Mediterranean Drought. J. Clim. 2012, 25, 2146–2161. [Google Scholar] [CrossRef] [Green Version]
  45. Meddi, H.; Meddi, M.; Assani, A.A. Study of Drought in Seven Algerian Plains. Arab. J. Sci. Eng. 2013, 39, 339–359. [Google Scholar] [CrossRef]
  46. Quadrelli, R.; Pavan, V.; Molteni, F. Wintertime variability of Mediterranean precipitation and its links with large-scale cir-culation anomalies. Clim. Dyn. 2001, 17, 457–466. [Google Scholar] [CrossRef]
  47. Giannini, A.; Saravanan, R.; Chang, P. Oceanic Forcing of Sahel Rainfall on Interannual to Interdecadal Time Scales. Science 2003, 302, 1027–1030. [Google Scholar] [CrossRef] [PubMed] [Green Version]
  48. Sun, Q.; Miao, C.; Duan, Q.; Ashouri, H.; Sorooshian, S.; Hsu, K.L. A review of global precipitation data sets: Data sources, estimation, and intercomparisons. Rev. Geophys. 2018, 56, 79–107. [Google Scholar] [CrossRef] [Green Version]
Figure 1. Location of the study area and of the selected 150 rain gauges on an elevation map, along with the distribution of the average annual precipitation evaluated from the 150 rain gauges with a spline interpolation.
Atmosphere 12 00798 g001
Figure 2. Example of drought characteristics evaluated using the run theory for a given threshold level [34].
Atmosphere 12 00798 g002
Figure 3. Characterization through boxplots of frequency (%), average duration (in years), average severity, and average intensity (year−1). The top and the bottom of the boxes are the third and the second quartiles, respectively; the band inside the box is the median and the ends of the whiskers represent the minimum and maximum of all of the data.
Atmosphere 12 00798 g003
Figure 4. Spatial distribution of the (a) dry frequency in %, (b) average dry duration in years, (c) average dry severity and (d) average dry intensity in year−1.
Atmosphere 12 00798 g004
Figure 5. Spatial distribution of the (a) wet frequency in %, (b) average wet duration in years, (c) average wet severity and (d) average wet intensity in year−1.
Atmosphere 12 00798 g005
Figure 6. Spatial results of the trend analysis performed on the SPI values. The trend magnitude has been evaluated with the Theil–Sen estimator; the statistical significance of the trends, with a SL = 95%, has been assessed with the Mann–Kendall test. Colored points indicate significant trends.
Atmosphere 12 00798 g006
Figure 7. Spatial results of the correlation analysis computed, with the Pearson method and for each station, between the SPI values and the NAO. Large sized points reveal a significant correlation, while small points show non-significant correlations.
Atmosphere 12 00798 g007
Table 1. Climate classification according to the SPI values.
SPI ValueClassProbability (%)
SPI ≥ 2.00Extremely wet2.3
1.50 ≤ SPI < 2.00Severely wet4.4
1.00 ≤ SPI < 1.50Moderately wet9.2
0.00 ≤ SPI < 1.00Mildly wet34.1
−1.00 ≤ SPI < 0.00Mild drought34.1
−1.50 ≤ SPI < −1.00Moderate drought9.2
−2.00 ≤ SPI < −1.50Severe drought4.4
SPI < −2.00Extreme drought2.3
Publisher’s Note: MDPI stays neutral with regard to jurisdictional claims in published maps and institutional affiliations.

