Article

Effectiveness of Tree Pattern in Street Canyons on Thermal Conditions and Human Comfort. Assessment of an Urban Renewal Project in Historical District in Lodz (Poland)

by
Anna Dominika Bochenek
* and
Katarzyna Klemm
Institute of Environmental Engineering and Building Installations, Faculty of Civil Engineering, Architecture and Environmental Engineering, Lodz University of Technology, 90-924 Lodz, Poland
*
Author to whom correspondence should be addressed.
Atmosphere 2021, 12(6), 751; https://doi.org/10.3390/atmos12060751
Submission received: 9 May 2021 / Revised: 3 June 2021 / Accepted: 6 June 2021 / Published: 10 June 2021

Abstract

:
The implementation of adaptation strategies has become an essential activity of spatial planning departments. Passive technologies related to the introduction of natural components in the form of vegetation are used, especially in urban development plans, to mitigate the effects of climate change and thus improve the quality of citizen life. Nature-Based Solutions are of particular importance in the areas of strict city centers, where historical building structures are subject to legal protection. In this study, the authors tested the influence of high greenery on the microclimatic conditions in the areas of typical street canyons (east–west and north–south orientations). Authors included the established greenery strategy by the City Planning Department. To estimate the impact of the assumed scenarios, a CFD tool was used—the ENVI-met application, which is commonly used in the field of urban microclimatology. Studies have shown that the introduction of 10% of green area contributed to a maximum air temperature reduction of 0.80 °C (17:00) in an east–west-oriented canyon, 0.49 °C (10:00) in a north–south canyon. The scenarios, assumed by the City Planning Department, related to the introduction of a greater amount of greenery turned out to be a less effective solution. The impact of greenery on the thermal comfort felt by humans was also determined. The reduction in the PET index was a maximum of 10.80 °C (14:00) in an east–west canyon; 6.66 °C (14:00) in a canyon area with a north–south orientation. This research might constitute the foundations to a re-evaluation of the urban development plans. The outcomes can lead to taking alternative direction of city layout transformations.

1. Introduction

The constantly increasing number of city residents and the observed changes in climate cause the improvement in the quality of life in cities to gain particular importance. Changes in the atmospheric environment and modification of the climate of cities are mostly influenced by:
  • Intensive emission of pollutants into the atmosphere;
  • Emission of waste heat or heat lost in technological processes and energy devices as well as heat used for heating buildings;
  • Large share of artificial substrate (roofs and walls of buildings, street surfaces, etc.) and small amount of greenery;
  • Decrease in global air exchange with compact buildings.
The result is an emerging phenomenon of urban heat islands in urban areas, characterized by an increase in air temperature in densely built-up central areas relative to undeveloped areas. Along with increasing heat waves in recent years, it is a serious problem from the human comfort and health point of view, especially in relation to vulnerable groups (elderly and sick people, young children) [1,2,3]. Extensive research conducted in four districts with different urban development patterns and geographic conditions in Shanghai indicated the local interplay between urban heat islands and heat waves [4]. The highest urban heat island intensity amplification was observed in the case of less urbanized districts regardless of main parameters identifying the heat waves (air temperature, WBGT, apparent temperature). From the thermal comfort standpoint, air moisture and wind flow had an alleviating effect on heat increase. Due to global warming, it is very likely that the frequency and intensity of UHI and heat waves will increase in the future [5,6,7,8].
Preparation and adaptation of cities to changing climatic conditions has become one of the key challenges in recent years. Many cities have already started implementing adaptation strategies to improve the urban thermal environment and pedestrian thermal comfort. Common measures include changing the urban geometry, plating vegetation, using cool materials, or incorporating water elements. Examples include ‘the Rethink Athens’ [9,10], ‘Knowledge for Climate’ [9,11,12], ‘REALCOOL’ [13], ‘Greening Aspang’ [14,15] projects. In some cases, such as historic city centers, making changes to the layout of buildings or the geometry of buildings is impossible. In this situation, a common solution is to introduce small green areas (pocket parks), rows or single trees [16,17,18,19]. The presence of greenery affects microclimate and human comfort through evapotranspiration, shading, and interaction with air movement. The impact of greenery depends on many factors, such as the climatic zone, local climatic conditions, the structure of buildings and materials, or the type of greenery. As indicated by studies, the key microclimatic parameter, the temperature can be reduced by 0.12 °C (Japan, [20]), 0.43 °C (USA [21]), 1 °C (Hungary, [22]), and even 2 °C (China [23]). The positive impact on mental well-being is also significant. Even a view of rich and varied greenery from the home has demonstrated lower levels of cortisol (a stress hormone), and an improved sense of well-being [24]. Greener living environments are associated with a lower risk of stress-related conditions, such as cardiovascular disease, depression and anxiety disorders [25].
In the present study, the center of third largest city in Poland—Lodz, has been selected as the study area. The historical core was formed in the 19th century. Its structure is a chessboard-shaped street layout (Figure 1). The perpendicular streets are assessed as east–west and north–south oriented. The street canyons created in this way with a 0.9 H/W ratio contribute to the modification of microclimate conditions. Weakened ventilation and excess heat are the characteristic features of this layout. As shown by the studies conducted by Kłysik [26], it is the tight development of the city center that constitutes the core of UHI in Lodz and leads to a significant increase in its intensity.
For years, the historical city center has been a point of interest for planners and municipal authorities. This area, considered the most degraded part of the city with an area of 1783 ha (over 6% of the total area of Lodz), was included in the revitalization programme [27]. One of the project’s activities, supported very intensively by the city’s residents, is the transformation of street canyons into woonerfs (Figure 2). In seven years (since 2014), eighteen such solutions have been implemented in Lodz, and three more are planned (2021). The main goal of this project is to introduce real traffic calming in the urban area, as well as to develop friendly public spaces for residents. An important factor supporting the introduction of woonerfs is the increase in area occupied by greenery, which contributes to the improvement in microclimate and comfort of space users. The adopted local spatial development plans assume an increase in the number of greeneries in the woonerfs, i.e., development of at least 15% of street section as an area with a significantly increased share of greenery [28,29]. Furthermore, there is a trend of tree planting in specific distances. The aforementioned actions of the city authorities are in line with the strategy of sustainable development of Lodz.
In order to assess the impact of planning solutions, including the addition of assumed high greenery in the historical core by the City Planning Department, simulation studies of local microclimate and thermal comfort were carried out. The research comprised the structure of a typical street canyon (east–west and north–south orientations). Simulations were carried out for the warmest day of the multi-year period (29 July 2013). The ENVI-met application, which is widely used for research in the field of urban climatology, was used as a tool. It should be noted that the tool is considered efficient when performing studies for highly urbanized areas [30,31,32]. In addition, the authors’ studies confirm that there is a possibility to use the application in climate studies of urban areas [33,34,35].

2. Numerical Simulations

The ENVI-met (Computational Fluid Dynamics software, developed by the team of the professor M. Bruse at the University of Mainz, Mainz, Germany), which is applied worldwide in urban climatology, was incorporated to construct the prototype of the typical canyon in the historical core of Lodz. The microclimatic conditions were assessed on the basis of the simulation process. The following considerations were taken into account (1) the three-dimensional structure of the typical canyon (including the physical properties of materials) and (2) the meteorological parameters for the warmest day of the multi-year period. Then, the high-greenery scenarios were considered.

2.1. Modeling of Typical Canyon Structure

According to Liu et al. [36], the research should take into account the specification of urban layout. In order to determine the prototype of a typical street canyon, analyses of the parameters of the most urbanized part of the city, the Metropolitan Area, were carried out. The study covered 13,315 building structures, as well as 10,050 registered plots. In order to assess the typicality of street canyons, information from the spatial database of the Municipal Survey Centre was used, such as the number of overground storeys, dimensions of buildings, length and width of registered plots, and width of communication routes.
The prototype consisted of 7 front buildings (27 m long × 11 m wide × 14 m high) and 14 side outbuildings (10 m long × 8 m wide × 14 m high). The surfaces present in the street canyon were determined based on the in-depth analyses conducted for the Metropolitan Area. Impervious material (street—asphalt, pedestrian routes—concrete) was used as the urban floor of street canyon.
Next, based on descriptive information obtained from the archival databases (so-called ‘record cards’) of the Conservator of Monuments, the materials of buildings were identified. The horizontal/vertical projections of the buildings enabled the determination of the thickness of partitions and the types of building materials used (walls: brick + plaster, roof: roofing felt). It is worth mentioning that physical parameters for each of materials were determined, such as thickness, absorption, transmission, reflection, emissivity, specific heat, thermal conductivity, and density (Table 1). The described approach led to a more nuanced reality representation.
Finally, a model of a typical street canyon structure was created. The parameters were 189 × 58 × 30 cells with a resolution of 1 m × 1 m × 1 m. Two model versions were considered, i.e., with east–west and north–south orientations (modification of model rotation).

2.2. Simulations of Meteorological Parameters

Information from the Institute of Meteorology and Water Management in Warsaw was used to determine meteorological conditions in the city. Data analysis was carried out for the period of 2004–2015. Based on the results obtained, it was determined that the warmest day of the multi-year was 29 July 2013. The prevailing microclimatic conditions were used as input data for the simulation process (Figure 3).
Hourly values of radiation, temperature, air humidity, as well as average value of air flow velocity were used. The value of the last parameter, wind, was obtained from the suburban meteorological station. Therefore, it was necessary to convert the parameter value for the downtown zone. This was possible by applying a modified version of logarithmic formula [37] and the relation proposed by Simiu [38]. The method was described in [35].
The output data, which are the values of meteorological parameters obtained during the simulation process, were generated for two characteristic points within each canyon. Information was taken at points located in the middle of canyons, at a distance of 3.5 m from the building facades, at a height of 1.5 m (pedestrian movement level in public spaces) (Figure 4). The choice was dictated by limiting the boundary effects on microclimatic conditions in the canyons. In this way it was possible (1) to show the influence of canyon building structure on meteorological parameters, (2) passive technologies on microclimate, and (3) human thermal comfort.

2.3. Passive Scenarios for Microclimatic Improvement

The analysis covered the typical street canyon in the Metropolitan Area of Lodz. Two characteristic layouts were considered, i.e., with east–west and north–south orientations. At first, simulations of microclimatic conditions were conducted for the base structure (Base Case scenario description is presented in Section 2.1). Then, the effects of selected green technologies on microclimate were evaluated (T, T2, T3).

Tree Cases (T, T2, and T3)

According to the urban development plans for the city, the planted trees have to be deciduous species, with maximum height of 7 m. The implementation of Nature-Based strategies, which is in progress in the historical core, is to plant trees in equal distances. Taking into account this fact, three high greenery scenarios were created (Figure 5). The Tree Case (T) including eight trees. They were placed symmetrically on both sides of the road, i.e., four on the north and four on the south side. The spacing between them was 42 m. The area occupied by the green solution was 6% of the canyon area. Scenario T2 involved adding 8 trees. They were located at distances of 27 m. The last considered strategy was based on the provisions of local development plans for the Metropolitan Area. For solution T3, the decision was made to intensify the greening. The number of trees introduced was 28, which represented 19% of the public space area.
The location of trees was chosen for their feasible introduction in street canyons. The greenery was introduced in such a way as to provide entry/exit from the property. Ensuring proper communication is extremely important within a compact downtown area. In addition, they were planted at a distance of 3.5 m from the building facades to ensure the possibility of pedestrian movement in the public space.

3. Results

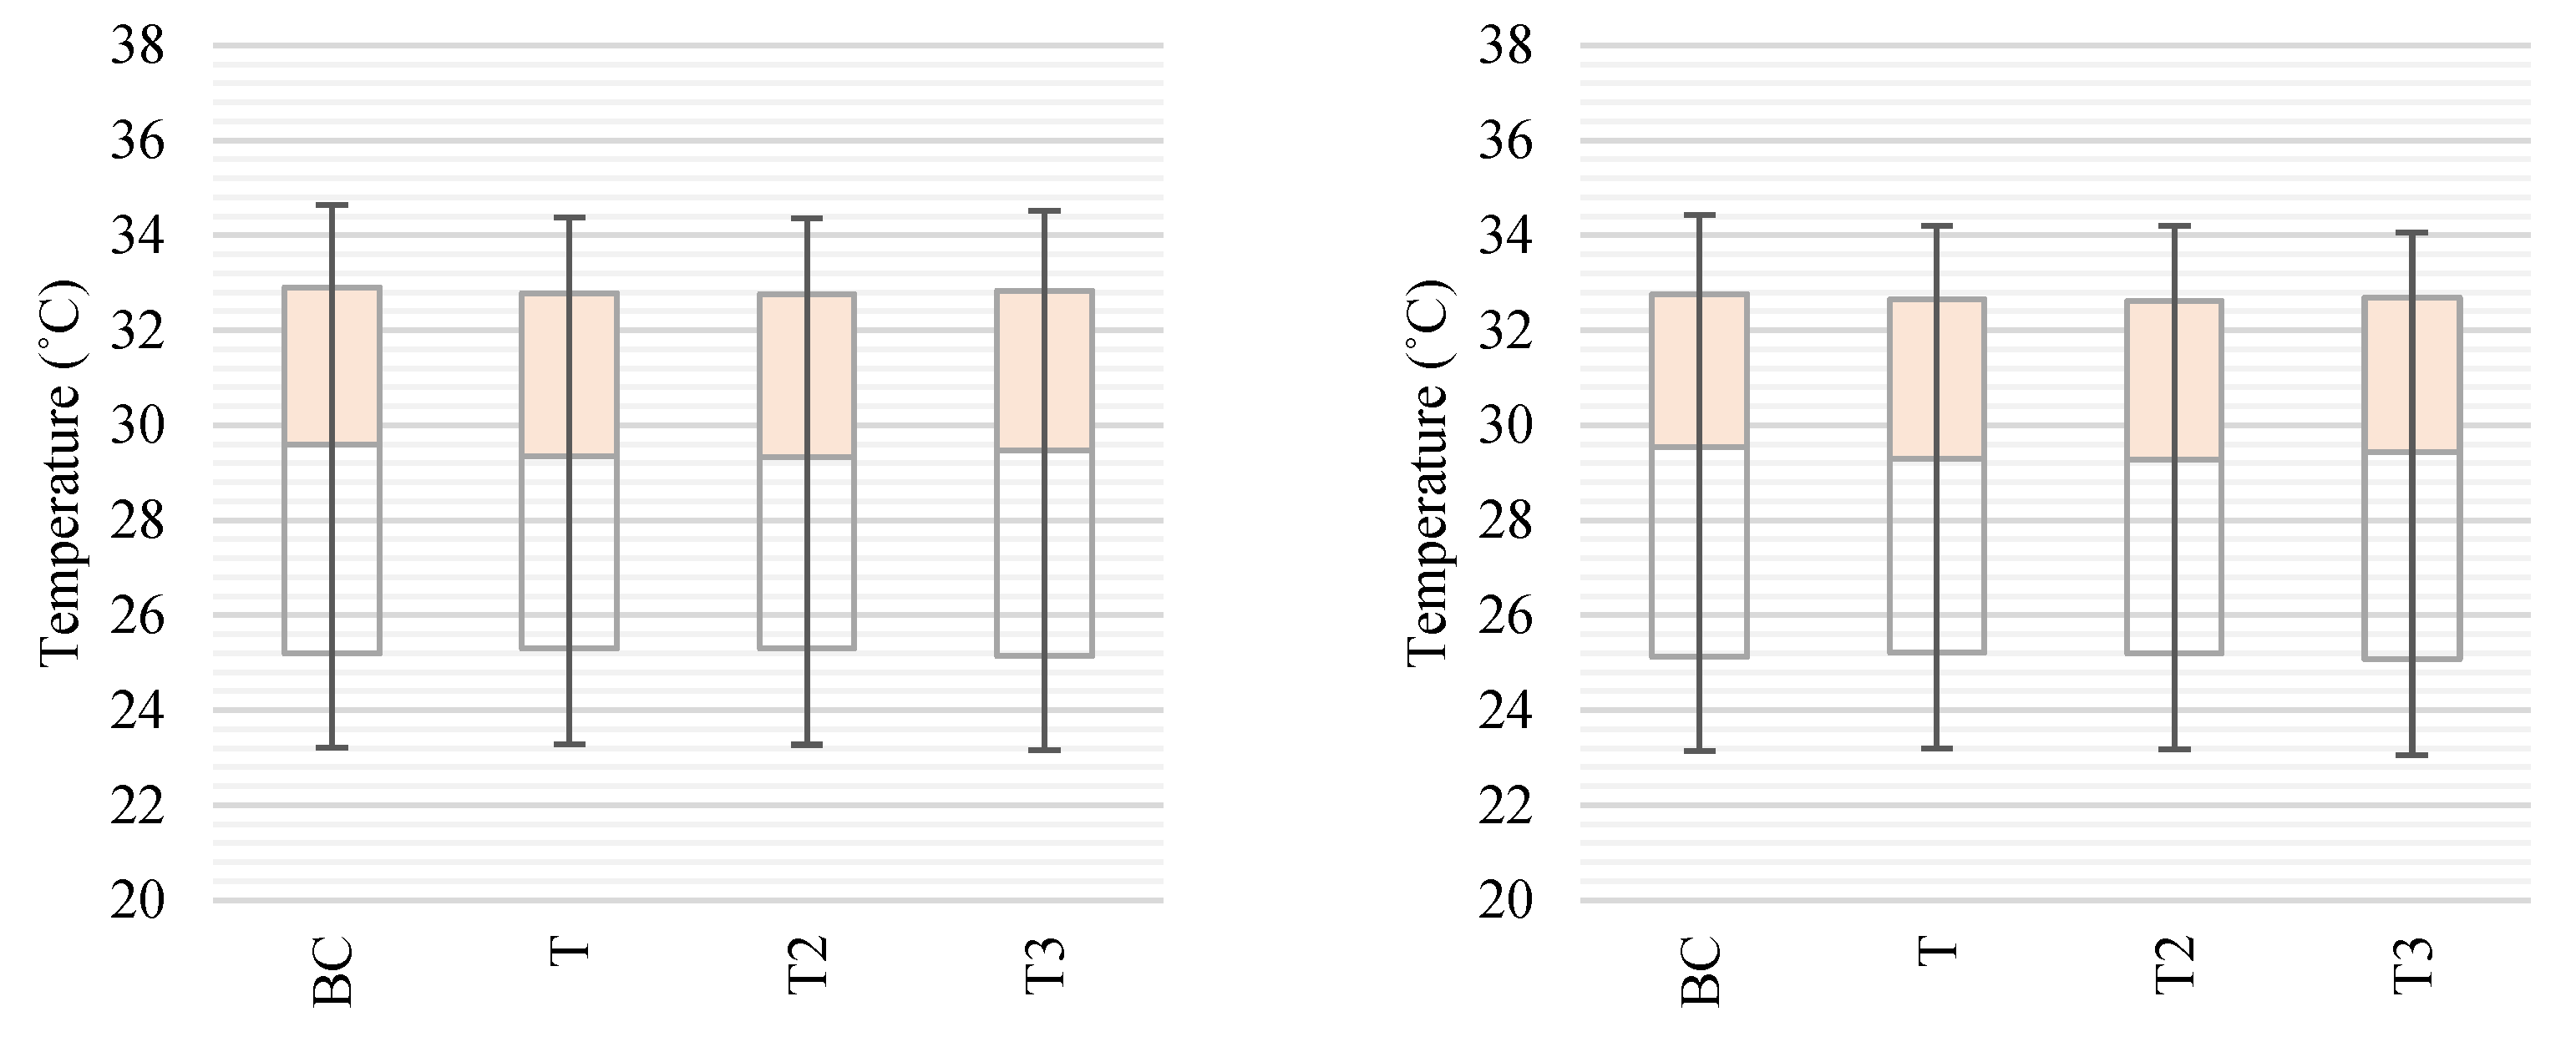
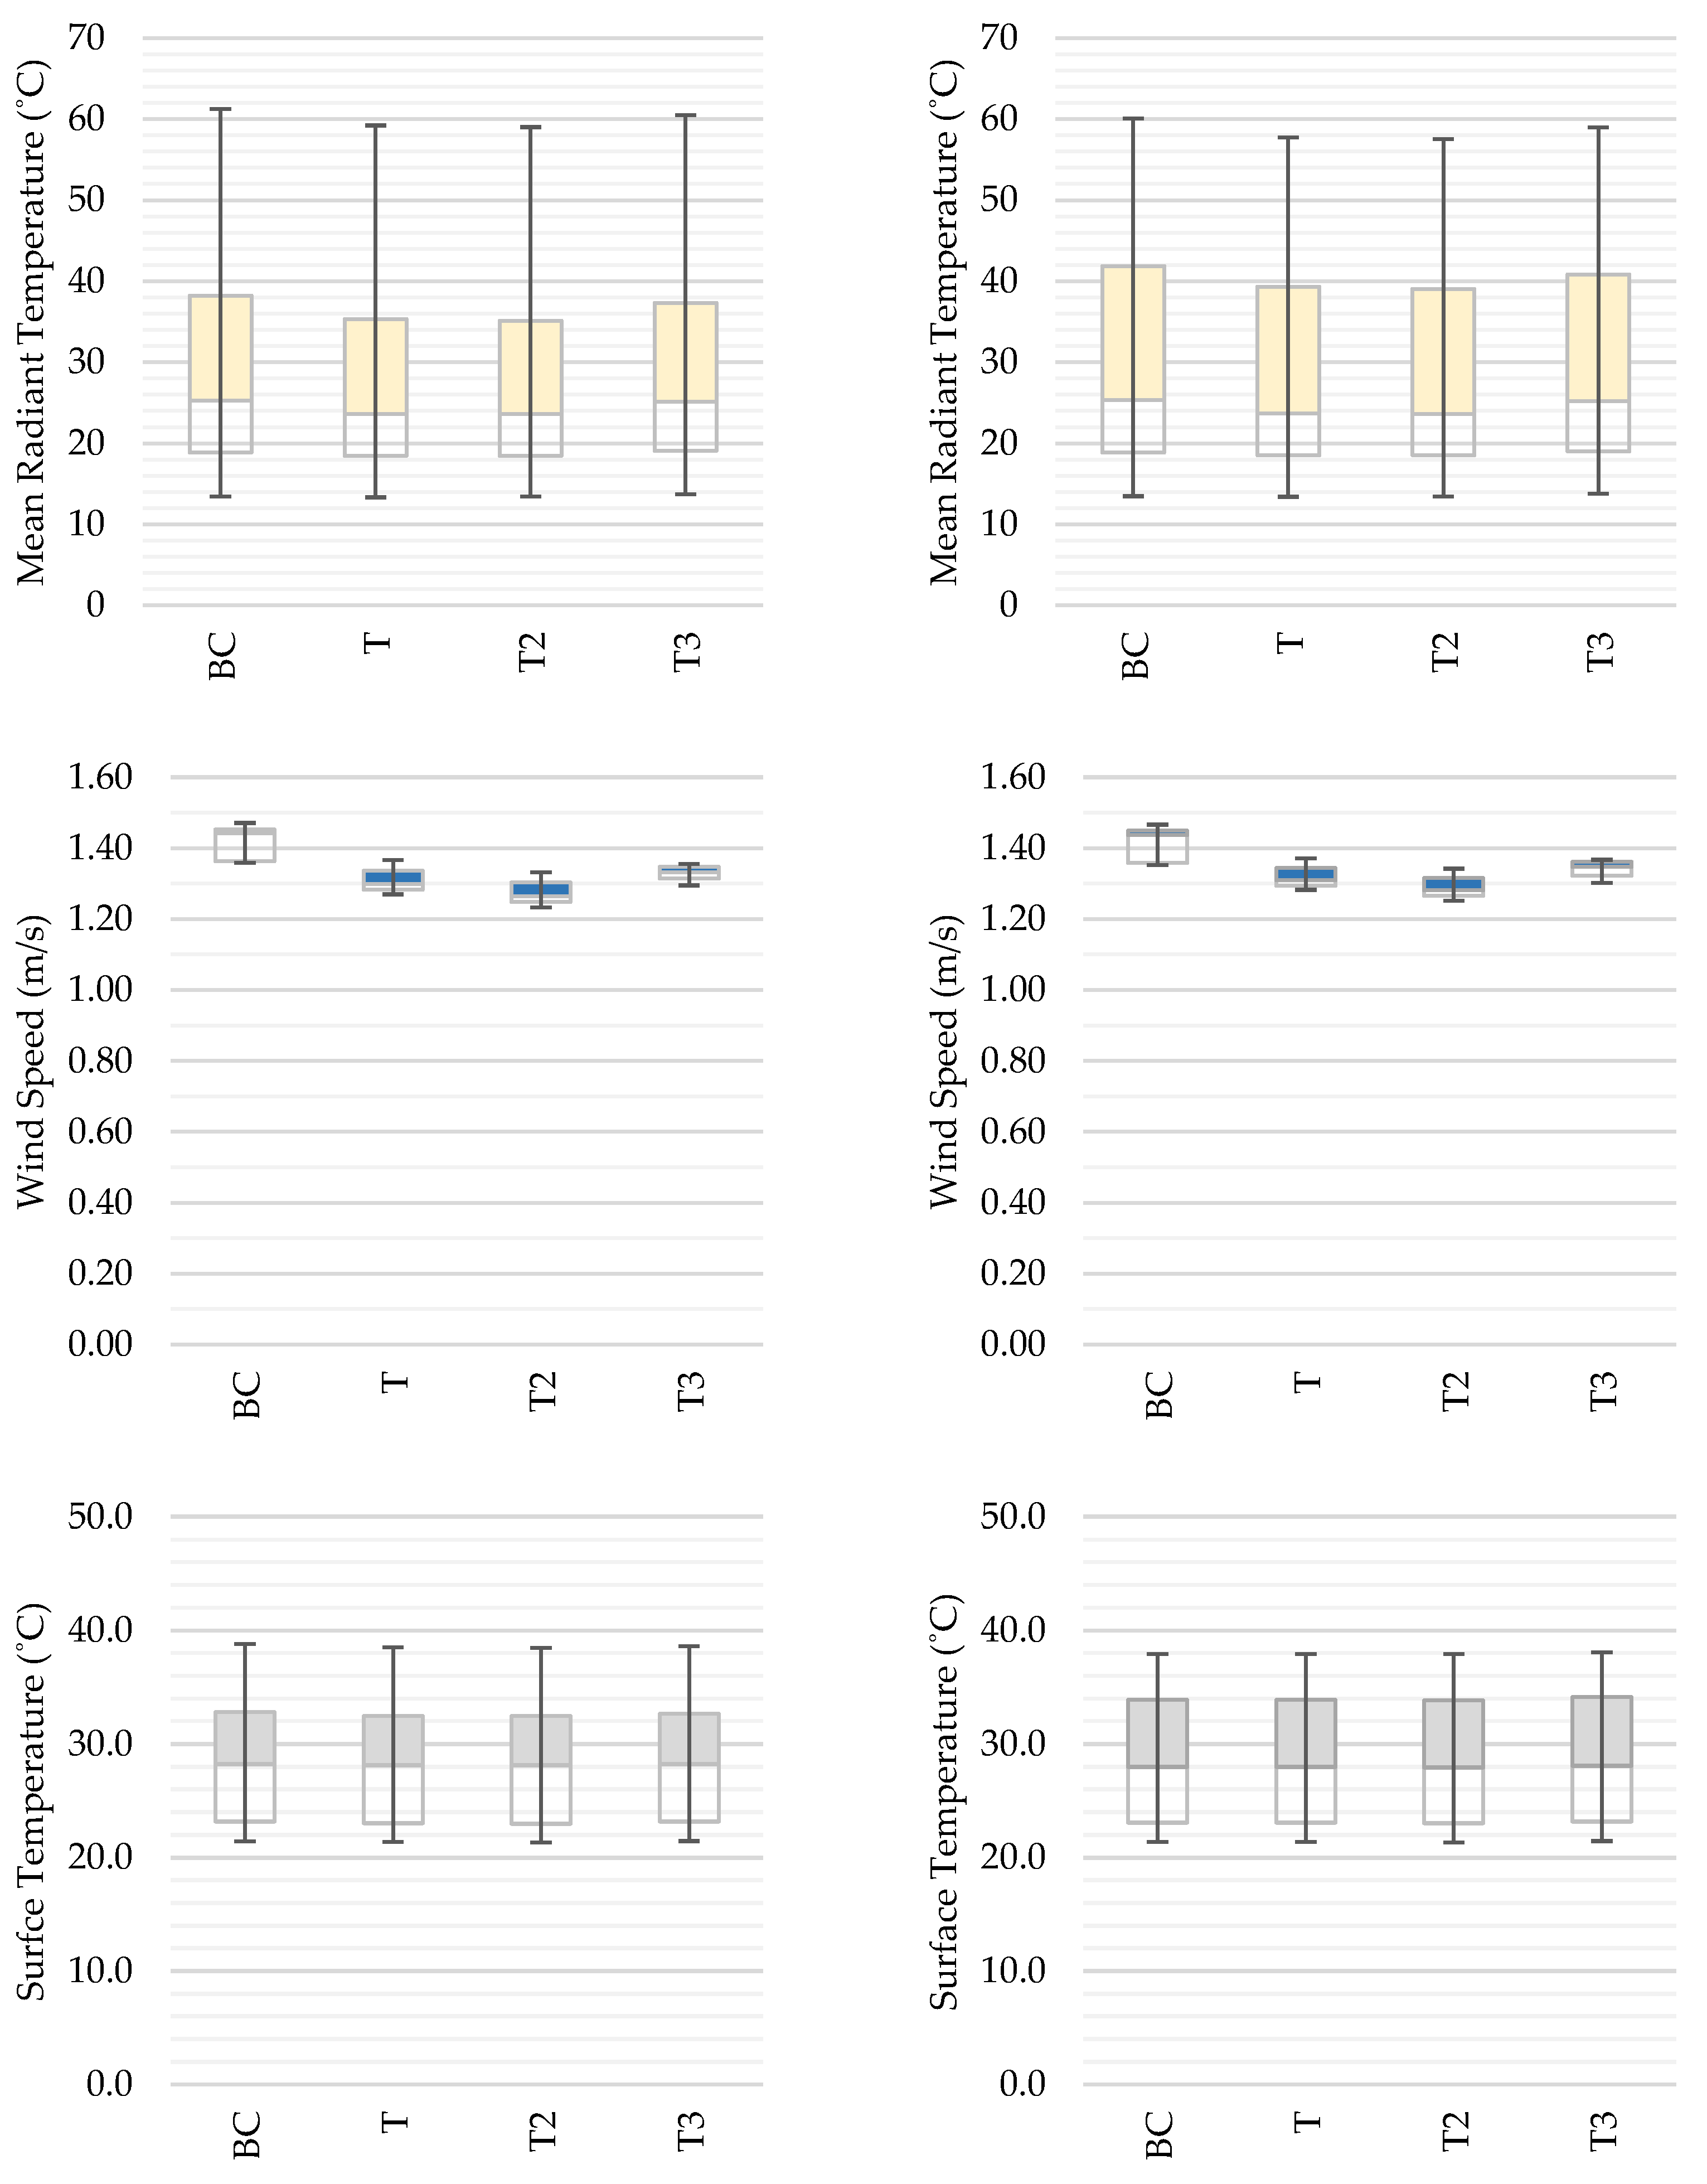
3.1. Microclimatic Characteristic

The study was conducted for two characteristic canyon orientations. In order to show the diversity of microclimatic conditions, characteristic measurement spots were selected. In the first case—the canyon with an east–west orientation, the information was obtained from the E-WN (at the northern facade) and E-WS (at the southern facade) measurement points. For the canyon with the north–south orientation, the reading points selected were N-SE (at the east facade) and N-SW (at the west facade). They were located in the pedestrian movement zone of public space (at 1.5 m height) (Figure 4). The comparison was carried out for the thermal (air temperature, mean radiant temperature and surface temperature) and aerodynamic conditions (wind flow).
  • Base Case (BC) Scenario
The analyses showed that the microclimatic conditions varied according to the urban structure (Figure 6). Air temperature ranged from 23.21 to 34.64 °C (E-WN), from 23.14 to 34.43 °C (E-WS) in the canyon with an east–west orientation. It was evident that lower parameter values per day were recorded at the south facade (E-WS). The buildings effectively reduced solar radiation, which resulted in more favorable conditions during the period of prevailing high temperatures in the city.
In the second case—the canyon with a north–south orientation, the parameter values oscillating within 22.20–35.48 °C (N-SE), 22.19–35.39 °C (N-SW) were observed. Based on the obtained output data, it can be concluded that the maximum recorded air temperatures were higher than in the canyon with an east–west orientation. The difference was 0.84 °C. This was mainly caused by the insolation of canyons.
The obtained outcomes demonstrated that the canyon geometry had the impact on thermal conditions. Direct solar radiation reached the ground surface at the north facade in the canyon with an east–west orientation for a maximum of 1 h. The area at the south facade was completely shaded throughout the day. The area of the canyon with north–south orientation was subject to uniform insolation for 3 h in a day.
The amount of insolation resulted in the poorest environment nearby the north façade. The highest mean radiant temperature (MRT = 36.25 °C) and the surface temperature (ST = 30.40 °C) were observed. The most favorable conditions appeared at the south façade (MRT = 30.27 °C, ST = 25.70 °C).
It is worth mentioning that the north–south airflow was assumed in the model. Therefore, it had little influence on the formation of parameters in the canyon with east–west orientation. On the other hand, in the second case, it influenced the reduction in air temperature. Otherwise, even higher parameter values would have been recorded in the canyon with the north–south orientation.
  • Influence of Trees
According to literature findings, greenery may constitute an element of adaptation strategies for historical urban areas [39]. In this case, authors assumed the equal-interval arrangement, which is widely implemented in the city of Lodz. The results obtained allowed the conclusion that even the most unfavorable conditions might be improved by adjusted nature-based strategies. The effect of passive solutions at selected measurement points is shown in Figure 7 and Figure 8.
In the present case—shallow canyon—vegetation contributed to a slight decrease in thermal parameters in the canyon area with an east–west orientation (Table 2). The highest values were observed at 16:00, while the lowest values were observed at 4:00. The addition of 10% greenery resulted in maximum reduction of 0.28 °C (E-WN, T2); 0.25 °C (E-WS, T2).
Furthermore, a lower value of MRT was observed. It was highly connected with street geometry, as well as the additional natural elements. They limited the intensity of the solar radiation. As a result, the average surface temperature was observed. The reported wind speed was imperceptible. The geometry blocked the air flow in the east–west oriented canyon.
In the second case, the north–south orientation, the thermal conditions were more favorable. The highest air temperature was observed at 13:00, while the lowest temperature was observed at 3:00. It turned out that a scenario worth considering is the introduction of greenery at the level of 10%. The greatest reduction was 0.23 °C (N-SE, T2); 0.21 °C (N-SW, T2).
The greenery implementation had a substantial impact on the MRT. The radiation was reduced. Not without significance were the aerodynamic conditions. The air masses’ movement was slightly blocked by the natural obstacles. Nevertheless, more comfortable conditions were reported.
  • Temperature Change in Relation to Height
The effects of implemented solutions were felt throughout the height of canyon (Figure 9). The most beneficial scenario (T2) was connected with average daily temperature change of 0.24 °C (E-WN); 0.21 °C (E-WS) in the canyon with east–west orientation. The maximum impact of implemented solutions was observable at 1.5 m (E-WN = 0.28 °C; E-WS = 0.25 °C). The analyses showed that the alleviating effect of greenery was evident from the ground level to the roof layer (up to 14 m height). Above the roof, the vegetation effect on thermal conditions was significantly reduced.
In the canyon with north–south orientation, the temperature reduction averaged 0.17 °C (T2) in the N-SE; 0.17 °C (T2) in the N-SW. The maximum decrease in parameter oscillated within the limits 0.27 °C (N-SE, T2); 0.26 °C (N-SW, T2). Noticeable changes were felt up to 6.5 m height (tree level).
As can be seen, the use of passive technologies slightly affected the microclimate of canyons during the period of high temperatures in the city. The effects associated with the introduction of tall greenery were noticeable up to the roof layer level (14 m) in the canyon with an east–west orientation. On the other hand, in the canyon with north–south orientation, the parameter variation (temperature dependence on the number of vegetation) was observable up to the level of canopy presence (7 m).

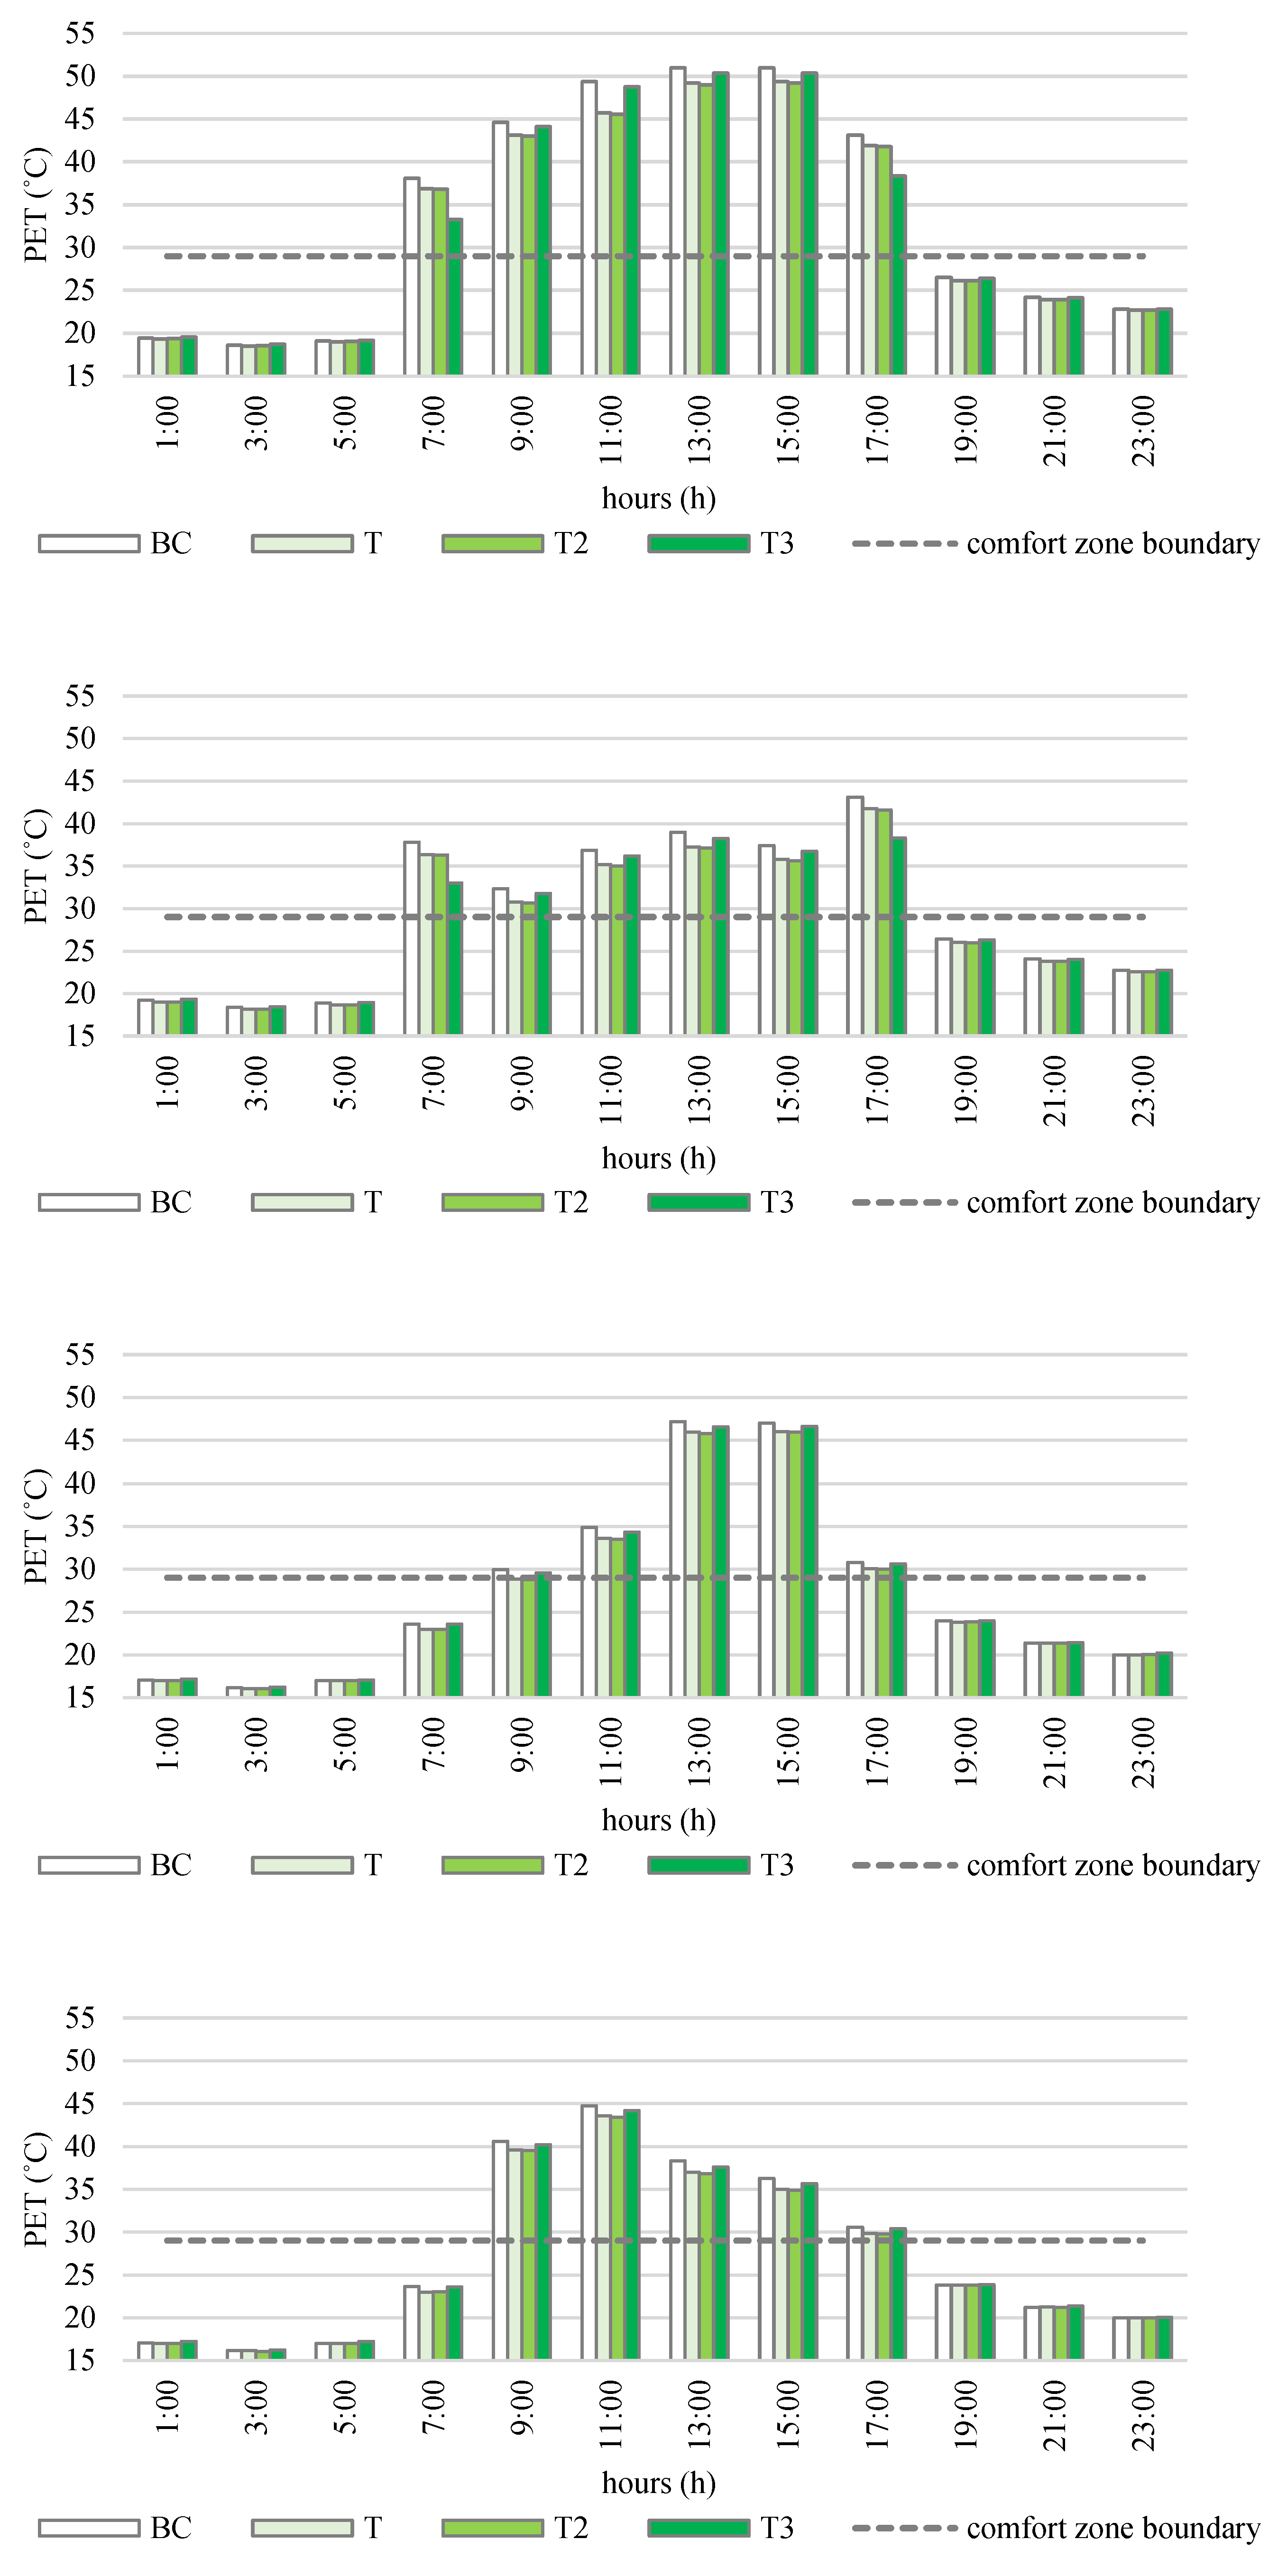
3.2. Outdoor Thermal Comfort

Human thermal sensations were estimated using the PET index (Table 3). The study was conducted for a 35-year-old person, with a height of 1.75 m, weight of 75 kg, who moves with a speed of 1.21 m/s in public space. The thermal insulating capacity of the clothing was considered for the summer period, i.e., 0.50 clo. Results of the effect of passive solutions on human thermal comfort at a height of 1.5 m are presented in Figure 10.
The research outcomes confirmed that the most beneficial scenario was connected with the addition of 10% green coverage. The PET was lowered from 18.58–51.40 °C (BC) to 18.53–49.60 °C (T2) at the point located at the north facade (E-WN) in the canyon area with east–west orientation. Conditions described as ‘comfortable,’ the range of PET index from 13 to 29 °C, occurred between 23:00 and 6:00. The most unfavorable conditions referred to as ‘extreme heat stress,’ index value above 41 °C, were recorded between 9:00 and 17:00.
At the south side of canyon (E-WS), the reduction was from 18.38–49.20 °C (BC) to 18.18–45.67 °C (T2). Conditions considered ‘comfortable’ prevailed between 1:00–5:00 and 18:00–23:00. ‘Extreme heat stress’ was observed between 16:00–17:00.
The passive solutions introduced helped to alleviate the thermal discomfort experienced by humans in the outdoor environment. The 24-h average PET reduction was 1.17 °C (T), 1.26 °C (T2), 1.00 °C (T3) at the north façade (E-WN); 1.04 °C (T), 1.10 °C (T2), 0.88 °C (T3) at the south façade (E-WS). The T2 scenario associated with 10% greenery in the street canyon area proved to be the most favorable solution.
In the canyon area with a north–south orientation, PET alleviation was from 16.20–47.60 °C (BC) to 16.06–46.40 °C (T2) at the east facade (N-SE). ‘Comfortable’ conditions were observed from 1:00 to 8:00 and 18:00 to 23:00. The highest thermal stress was observed from 12 noon. to 15:00, i.e., above 41 °C. Analyses showed that thermal conditions were significantly poorer at the west facade (N-SW). The PET was lowered from 16.20–46.80 °C (BC) to 16.04–45.40 °C (T2). In this case, the conditions described as ‘warm’ and ‘extreme heat stress’ prevailed from 9:00 to 15:00. The 24-h average index values were higher than with the east facade.
The passive green technologies introduced enabled PET to be reduced by an average of 0.55 °C (T), 0.57 °C (T2), 0.12 °C (T3) at the east facade (N-SE); 0.56 °C (T), 0.59 °C (T2), 0.15 °C (T3) at the west facade (N-SW). Again, the T2 scenario (10% green space in the canyon area) was found to be the most favorable.
The conducted research allowed the conclusion that the geometry had a significant influence on the thermal conditions. The dynamic of changes were connected to the radiation level (modified by the buildings). The statement resulted from the fact that PET was calculated on the basis on the presented Equation (1) [40].
T m r t = [ 1 σ B ( E t ( z ) + α k ε p ( D t ( z ) + I t ( z ) ) ) ] 0.25
Direct irradiance I t ( z ) , diffused and diffusely reflected solar radiation D t ( z ) , and total long-wave fluxes E t ( z ) were considered. The last one was treated as the emission from the sky, the ground, and surrounding artificial partitions of objects. There was the assumption that long-wave radiation originated from the upper hemisphere (50%) and the ground (50%).
The artificial obstacles reduced insolation. As a result, lower PET, especially in the east–west canyon (value differentiation between the north–south façade; Figure 10), were reported. Plantings led to the PET variation. A 10% greenery coverage was considered as the most beneficial scenario in the typical canyon. On the one hand, a shadowed area during the day was provided. On the other hand, it did not impair the aerodynamic conditions.

4. Discussion

The impact of local microclimatic phenomena is most noticeable within the Urban Canopy Layer (UCL—approximately from the ground to the rooftops of buildings). Its intensity results from the land development, i.e., varied geometry of buildings, types of pavement used, material solutions, and the occurrence of greenery. These factors determine the rapidity of changes occurring in space. They affect the basic meteorological parameters, such as solar radiation, humidity, air flow, and evapotranspiration. Thus, they determine the comfort of humans residing in the outdoor environment [41,42].
According to Muhaisen [43], thermal performance is dependent on the geometry of the urban layout. This relationship was confirmed by [41,44,45]. They showed that the height/width ratio caused a strong modification of solar access. The higher the building structure, the more significant reduction in thermal discomfort. Moreover, they proved that using the building structure as a shading element contributed to a distinct cooling effect in the summer period. This fact was confirmed in this study. Height to width ratio (H/W = 0.9) contributed to beneficial thermal conditions, especially in the canyon with an east–west orientation. The building structure led to the reduction in the air temperature, the mean radiant temperature, and the limitation of heating the horizontal surfaces (concrete pavements, asphalt roads).
In the light of an implementation of nature-based strategies in historical centers, it is strongly advisable to consider a high greenery influence on microclimatic conditions. Many scientists emphasize the fact of the positive influence of passive scenarios on meteorological parameters. The scale of impact depends on the amount of introduced greenery [18,23,46,47,48], the spatial arrangement of trees [49,50,51], and the species of introduced greenery [22,52]. Wu and Chen [50] conducted a study in Beijing, China. They showed that a 10% increase in green coverage ratio contributes to a 0.22 °C decrease in air temperature at the pedestrian movement level. According to Ng et al. [46], 33% green coverage can result in a temperature drop of up to 1 °C (Hong Kong, China). However, a vegetated fraction of 20% to 30% in urban areas has been considered optimal. Higher amounts of introduced greenery may be difficult for practical reasons [23]. In this study, 10% green cover was considered the most effective solution. The maximum reduction in air temperature was 0.80 °C (17:00) in the canyon with east–west orientation, 0.49 °C (10:00) in the canyon with north–south orientation. The scenarios involving the introduction of more greenery proved to be less effective, i.e., air temperature was not significantly reduced.
Vegetation is considered a fundamental element of urban land use. According to Takacs et al. [22], it has a high regulatory potential. This is connected with the fact that the evapotranspiration process takes place in the outdoor environment. It includes transpiration, which is being done by the leaves’ stomata. Moreover, it takes into account evaporation (water is released from the plant surface to the atmosphere) [53]. As the effect, the ambient temperature is modified. This means that it has the ability to optimize environmental parameters and thus alleviate the thermal stress experienced by humans. The study conducted by the authors showed that thermal discomfort can be alleviated by using passive technologies in the area of street canyons. The PET reduction was a maximum of 10.80 °C (14:00) in the canyon area with an east–west orientation; 6.66 °C (14:00) in the canyon area with a north–south orientation. The strategy associated with implementing a 10% green coverage ratio was considered the most effective solution.

5. Conclusions

Increasingly dense urban centers are exposed to progressive changes in climatic conditions. On the one hand, they are the result of global climate change and, on the other, anthropogenic impacts. The unfavorable phenomena observed in cities include an increase in average air temperature, the occurrence of the urban heat island phenomena, or the weakening of air flow. All these elements have a very significant impact on the quality of life and health of residents. Therefore, it is of particular importance to implement adaptation strategies to influence climate change in cities. In the case of inner-city districts, the situation becomes more complex due to the historical character of buildings, which are under conservation protection. In such cases, one of the adaptation strategies can be a passive green solution in the form of tree rows. An example can be the revitalization of the historical center of Lodz, where the street canyons are being transformed into traffic-calmed zones with a large share of greenery (woonerf).
This study attempted to assess the effectiveness of passive solutions in relation to street canyons in the historical part of Lodz. Three variants of greenery distribution differing in the area occupied by trees in relation to the area of the canyon were analyzed. The study was carried out for the warmest day of the year (mean daily air temperature—28.84 °C). It should be emphasized that similar microclimatic conditions (values between 25–30 °C) were observed for 7.52% of the time over the multi-year period. The most beneficial effect was observed when greenery constituted 10% of the canyon area. The temperature was reduced by a maximum of 0.8 °C in the canyon with east–west orientation; 0.49 °C in the canyon with north– south orientation. Increasing the green area did not reduce the temperature further. The proposed planting scenario (T3) by the City Planning Department turned out to be less effective. This outcome of the research might become an incentive to reformulate the provisions of local spatial development plans.
In the case of Lodz city center, the proportion of street canyons influenced the microclimatic parameters. The structure of buildings contributed to reducing the amount of solar radiation reaching the ground surface as well as the facades. Unfortunately, the absorbed radiation (direct, diffuse) by artificial surfaces (with low albedo) contributed to an increase in air temperature at night. The analyses conducted showed that there was an observable negative effect of tree canopy on canyon thermals. This was due to impaired airflow, especially in the canyon with east–west orientation. Heat exchange occurring along the urban structure–vegetation pathway must also be taken into account. The natural components provided an additional barrier to the heat exchange process during the night time.
The effect of greenery on human thermal comfort was also analyzed. The reduction in the PET index was a maximum of 10.8 °C in the canyon with east–west orientation and 6.66 °C in the canyon with north–south orientation (10% canyon green cover). Despite the reduction in index values, the transition from conditions termed ‘extreme heat stress’ to ‘warm’ conditions could not be achieved between 9:00 and 15:00.
The results showed that the use of greenery in the form of tree rows resulted in a slight reduction in the canyon thermal and aerodynamic conditions. However, the introduction of other adaptive solutions related to the modification of building geometry would be difficult in practice. This is due to legal considerations, i.e., conservation protection of buildings. In this case other advantages of greenery should be taken into account, i.e., aesthetic considerations or positive influence on human psyche. Moreover, vegetation contributes to reducing the spread of pollution in cities.
Further research should be focused on determining the impact of vegetation on micro-climate during typical meteorological conditions in the city. It would be necessary to analyze the actual thermal sensations of space users (e.g., surveys combined with measurements of microclimatic parameters in the field). This would allow defining the thermal comfort ranges for cities located in the temperate climate zone.

Author Contributions

Conceptualization, A.D.B. and K.K.; methodology, A.D.B. and K.K.; software, A.D.B. and K.K.; validation, A.D.B. and K.K.; formal analysis, A.D.B. and K.K.; investigation, A.D.B. and K.K.; resources, A.D.B. and K.K.; data curation, A.D.B. and K.K.; writing—original draft preparation, A.D.B. and K.K.; writing—review and editing, A.D.B. and K.K.; visualization, A.D.B. and K.K.; supervision, A.D.B. and K.K.; project administration, A.D.B. and K.K.; funding acquisition, A.D.B. and K.K. All authors have read and agreed to the published version of the manuscript.

Funding

This research received no external funding.

Acknowledgments

The authors wish to acknowledge three anonymous reviewers whose comments/suggestions helped to improve and clarify this manuscript. This work has been supported by the Institute of Environmental Engineering and Building Installations, Lodz University of Technology.

Conflicts of Interest

The authors declare no conflict of interest.

References

  1. Goggins, W.B.; Chan, E.Y.Y.; Ng, E.; Ren, C.; Chen, L. Effect Modification of the Association between Short-term Meteorological Factors and Mortality by Urban Heat Islands in Hong Kong. PLoS ONE 2012, 7, e38551. [Google Scholar] [CrossRef] [Green Version]
  2. Kovats, S.; Hajat, S. Heat stress and public health: A critical review. Annu. Rev. Public Health 2008, 29, 41–55. [Google Scholar] [CrossRef]
  3. Arsenović, D.; Savić, S.; Lužanin, Z.; Radić, I.; Milošević, D.; Arsić, M. Heat-related mortality as an indicator of population vulnerability in a mid-sized Central European city (Novi Sad, Serbia, summer 2015). Geogr. Pannonica 2019, 23, 204–215. [Google Scholar] [CrossRef] [Green Version]
  4. He, B.J.; Wang, J.; Liu, H.; Ulpiani, G. Localized synergies between heat waves and urban heat islands: Implications on human thermal comfort and urban heat management. Environ. Res. 2021, 193, 110584. [Google Scholar] [CrossRef]
  5. Kotharkar, R.; Ramesh, A.; Bagade, A. Urban Heat Island studies in South Asia: A critical review. Urban Clim. 2018, 24, 1011–1026. [Google Scholar] [CrossRef]
  6. Geletič, J.; Lehnert, M.; Jurek, M. Spatiotemporal variability of air temperature during a heat wave in real and modified landcover conditions: Prague and Brno (Czech Republic). Urban Clim. 2020, 31, 100588. [Google Scholar] [CrossRef]
  7. Martilli, A.; Krayenhoff, E.S.; Nazarian, N. Is the Urban Heat Island intensity relevant for heat mitigation studies? Urban Clim. 2020, 31, 100541. [Google Scholar] [CrossRef]
  8. Veena, K.; Parammasivam, K.M.; Venkatesh, T.N. Urban Heat Island studies: Current status in India and a comparison with the International studies. J. Earth Syst. Sci. 2020, 129, 1–15. [Google Scholar] [CrossRef]
  9. Klemm, W.; Altinisik, L.; Peretti, G.; Bruse, M. Integration of Microclimate-Responsive Design in the Planning of Urban Out-door Spaces—A Case Study in Athens, Greece. In Proceedings of the 3 International Conference on Countermeasures to Urban Heat Island, Venice, Italy, 13–15 October 2014. [Google Scholar]
  10. Koletsis, I. Testing and validation of ENVI-met simulation based on in-situ micrometeorological measurements: The case of Syntagma Square, Athens, Greece. In Proceedings of the 16th International Conference on Environmental Science and Technology, Rhodes, Greece, 4–7 September 2019. [Google Scholar]
  11. Klemm, W.; Heusinkveld, B.G.; Lenzholzer, S.; van Hove, B. Street greenery and its physical and psychological impact on thermal comfort. Landsc. Urban Plan. 2015, 138, 87–98. [Google Scholar] [CrossRef]
  12. Klemm, W.; Van Hove, B.; Lenzholzer, S.; Kramer, H. Towards guidelines for designing parks of the future. Urban For. Urban Green. 2017, 21, 134–145. [Google Scholar] [CrossRef]
  13. Jacobs, C.; Klok, L.; Bruse, M.; Cortesão, J.; Lenzholzer, S.; Kluck, J. Are urban water bodies really cooling? Urban Clim. 2020, 32, 100607. [Google Scholar] [CrossRef]
  14. Jutta, H.; Tudiwer, D.; Korjenic, A.; Bretschneider, B. Greening Aspang—Measurement evaluation for a holistic view of mi-croclimatic interactions in a street affected by urban heat island (UHI). Bauphysik 2018, 40, 105–119. [Google Scholar]
  15. Tudiwer, D.; Höckner, V.; Korjenic, A. Greening Aspang—Hygrothermal building simulation for analysis and evaluation of various scenarios related to indoor climate. Bauphysik 2018, 40, 120–130. [Google Scholar] [CrossRef]
  16. Wang, Y.; Bakker, F.; De Groot, R.; Wortche, H.; Leemans, R. Effects of urban trees on local outdoor microclimate: Synthesiz-ing field measurements by numerical modelling. Urban Ecosyst. 2015, 18, 1305–1331. [Google Scholar] [CrossRef] [Green Version]
  17. Fahmy, M.; Ibrahim, Y.; Hanafi, E.; Barakat, M. Would LEED-UHI greenery and high albedo strategies mitigate climate change at neighborhood scale in Cairo, Egypt? Build. Simul. 2018, 11, 1273–1288. [Google Scholar] [CrossRef]
  18. Rui, L.; Buccolieri, R.; Gao, Z.; Gatto, E.; Ding, W. Study of the effect of green quantity and structure on thermal comfort and air quality in an urban-like residential district by ENVI-met modelling. Build. Simul. 2019, 12, 183–194. [Google Scholar] [CrossRef]
  19. Tamminga, K.; Cortesão, J.; Bakx, M. Convivial Greenstreets: A Concept for Climate-Responsive Urban Design. Sustainability 2020, 12, 3790. [Google Scholar] [CrossRef]
  20. Hamada, S.; Ohta, T. Seasonal variations in the cooling effect of urban green areas on surrounding urban areas. Urban For. Urban Green. 2010, 9, 15–24. [Google Scholar] [CrossRef]
  21. Middel, A.; Chhetri, N.; Quay, R. Urban forestry and cool roofs: Assessment of heat mitigation strategies in Phoenix residen-tial neighborhoods. Urban For. Urban Green. 2015, 14, 178–186. [Google Scholar] [CrossRef]
  22. Takács, Á.; Kiss, M.; Hof, A.; Tanács, A.; Gulyás, A.; Kántor, N. Microclimate modification by urban shade trees—An integrated approach to aid ecosystem service based decision-making. Procedia Environ. Sci. 2016, 32, 97–109. [Google Scholar] [CrossRef] [Green Version]
  23. Ouyang, W.; Morakinyo, T.E.; Ren, C.; Ng, E. The cooling efficiency of variable greenery coverage ratios in different urban densities: A study in a subtropical climate. Build. Environ. 2020, 174, 106772. [Google Scholar] [CrossRef]
  24. Honold, J.; Lakes, T.; Beyer, R.; Van der Meer, E. Restoration in urban spaces nature views from home, greenways, and public parks. Environ. Behav. 2016, 48, 796–825. [Google Scholar] [CrossRef]
  25. Maas, J.; Verheij, R.; De Vries, S.; Spreeuwenberg, P.; Schellevis, F.G.; Groenewegen, P. Morbidity is related to a green living environment. J. Epidemiol. Community Health 2009, 63, 967–973. [Google Scholar] [CrossRef] [Green Version]
  26. Kłysik, K.; Fortuniak, K. Temporal and spatial characteristics of the urban heat island of Lodz, Poland. Atmos. Environ. 1999, 33, 3885–3895. [Google Scholar] [CrossRef]
  27. Resolution No. XXXIV/1122/20 of the City Council in Lodz of 24 December 2020 amending the Resolution on the Adoption of the Municipal Revitalization Programme for the City of Lodz. Available online: rewitalizacja.uml.lodz.pl/rewitalizacja/co-to-jest-rewitalizacja/gminny-program-rewitalizacji-miasta-lodzi/ (accessed on 15 April 2021).
  28. Resolution No. VI/212/19 of the City Council of Lodz of 6 March 2019 on Adopting a Local Spatial Development Plan for a Part of the City of Lodz located in the Area of Tadeusz Kościuszki Avenue and the Following Streets: Andrzej Struga, Stefan Żeromski, Maria Skłodowska-Curie, Łąkowa, Generała Lucjana Żeligowskiego and 6 Sierpnia (the Plan no. 116). Available online: mpu.lodz.pl/opracowania/plany-miejscowe/ (accessed on 15 April 2021).
  29. Resolution No. VI/211/19 of the City Council of Lodz of 6 March 2019 on the Adoption of a Local Spatial Development Plan for Part of the City of Lodz Located in the Area of Tadeusz Kościuszki Avenue and the Following Streets: 6 Sierpnia, Generała Lucjana Żeligowskiego, św. Jerzego, Cmentarna, Legionów, Zachodnia and Wólczańska (the Plan no. 118). Available online: mpu.lodz.pl/opracowania/plany-miejscowe/ (accessed on 15 April 2021).
  30. Ali-Toudert, F.; Mayer, H. Numerical study on the effects of aspect ratio and orientation of an urban street canyon on outdoor thermal comfort in hot and dry climate. Build Environ. 2006, 41, 94–108. [Google Scholar] [CrossRef]
  31. Emmanuel, R.; Rosenlund, H.; Johansson, E. Urban shading-a design option for the tropics? A study in Colombo, Sri Lanka. Int. J. Clim. 2007, 27, 1995–2004. [Google Scholar] [CrossRef] [Green Version]
  32. Chatzidimitriou, A.; Yannas, S. Street canyon design and improvement potential for urban open spaces; the influence of canyon aspect ratio and orientation on microclimate and outdoor comfort. Sustain. Cities Soc. 2017, 33, 85–101. [Google Scholar] [CrossRef]
  33. Bochenek, A.; Klemm, K. Ocena możliwości zastosowania danych pogodowych w symulacjach parametrów meteorologicznych [eng. Evaluation of the possibility of using weather data in simulations of meteorological parameters]. FBwTiP 2018, X, 13–24. [Google Scholar]
  34. Bochenek, A.; Klemm, K. Evaluation of Microclimatic Conditions and Thermal Comfort of the City’s Public Space. Example of the Old Marketplace in Lodz (Poland). In Proceedings of the PLEA Conference, Hong Kong, China, 10–12 December 2018. [Google Scholar]
  35. Bochenek, A.; Klemm, K. The Impact of Passive Green Technologies on the Microclimate of Historic Urban Structures: The Case Study of Lodz. Atmosphere 2020, 11, 974. [Google Scholar] [CrossRef]
  36. Liu, Z.; Cheng, W.; Jim, C.Y.; Morakinyo, T.E.; Shi, Y.; Ng, E. Heat mitigation benefits of urban green and blue infrastructures: A systematic review of modeling techniques, validation and scenario simulation in ENVI-met V4. Build Environ. 2021, 200, 107939. [Google Scholar] [CrossRef]
  37. Żurański, J.A. Wpływ Warunków Klimatycznych i Terenowych na Obciążenie Wiatrem Konstrukcji Budowlanych (eng. Influence of Cli-Matic and Terrain Conditions on Wind Load of Building Structures); Prace Naukowe Instytutu Techniki Budowlanej: Warsaw, Poland, 2005. [Google Scholar]
  38. Simiu, E. Equivalent statistic wind load for tall building design. In Proceedings of the 4-th International Conference on Wind Effects on Buildings and Structures, London, UK, 8–12 September 1975. [Google Scholar]
  39. Ouyang, W.; Morakinyo, T.E.; Ng, E. The Cooling Efficiency of Urban Greenery Coverage in a High-density City. IOP Conf. Series Earth Environ. Sci. 2019, 329, 012043. [Google Scholar] [CrossRef]
  40. Bruse, M. The Influences of Local Environmental Design on Microclimate. Ph.D. Thesis, University of Bochu, Bochum, Germany, 1999. [Google Scholar]
  41. Martinelli, L.; Matzarakis, A. Influence of height/width proportions on the thermal comfort of courtyard typology for Italian climate zones. Sustain. Cities Soc. 2017, 29, 97–106. [Google Scholar] [CrossRef]
  42. Zielonko-Jung, K. Kształtowanie przestrzenne architektury ekologicznej w strukturze miasta (eng. The Shaping of Ecological Architecture in Urban Structure), 1st ed.; Oficyna Wydawnicza Politechniki Warszawskiej: Warsaw, Poland, 2013. [Google Scholar]
  43. Muhaisen, A.S. Shading simulation of the courtyard form in different climatic regions. Build. Environ. 2006, 41, 1731–1741. [Google Scholar] [CrossRef]
  44. Rodríguez-Algeciras, J.; Tablada, A.; Chaos-Years, M.; De la Paz, G. Influence of aspect ratio and orientation on large court-yard thermal conditions in the historical centre of Camaguey-Cuba. Renew. Energy 2018, 125, 840–856. [Google Scholar] [CrossRef]
  45. Deng, J.-Y.; Wong, N.H. Impact of urban canyon geometries on outdoor thermal comfort in central business districts. Sustain. Cities Soc. 2020, 53, 101966. [Google Scholar] [CrossRef]
  46. Ng, E.; Chen, L.; Wang, Y.; Yuan, C. A study on the cooling effects of greening in a high-density city: An experience from Hong Kong. Build. Environ. 2012, 47, 256–271. [Google Scholar] [CrossRef]
  47. Srivanit, T.; Hokao, K. Evaluating the cooling effects of greening for improving the outdoor thermal environment at institu-tional campus in the summer. Build Environ. 2013, 66, 158–172. [Google Scholar] [CrossRef]
  48. Teshnehdel, S.; Akbari, H.; Di Giuseppe, E.; Brown, R.D. Effect of tree cover and tree species on microclimate and pedestrian comfort in a residential district in Iran. Build. Environ. 2020, 178, 106899. [Google Scholar] [CrossRef]
  49. Tsoka, S.; Leduc, T.; Rodler, A. Assessing the effects of urban trees on building cooling energy needs: The role of foliage den-sity and planting pattern. Sustain. Cities Soc. 2021, 65, 102633. [Google Scholar] [CrossRef]
  50. Wu, Z.; Chen, L. Optimizing the spatial arrangement of trees in residential neighbourhoods for better cooling effects: Inte-grating modelling with in-situ measurements. Landsc. Urban Plan 2017, 167, 463–472. [Google Scholar] [CrossRef]
  51. Lee, H.; Mayer, H. Solar elevation impact on the heat stress mitigation of pedestrians on tree-lined sidewalks of E-W street canyons—Analysis under Central European heat wave conditions. Urban For. Urban Green. 2021, 58, 126905. [Google Scholar] [CrossRef]
  52. Karimi Afshar, N.; Karimian, Z.; Doostan, R.; Habibi Nokhandan, M. Influence of planting designs on winter thermal comfort in an urban park. J. Environ. Eng. Landsc. Manag. 2018, 26, 232–240. [Google Scholar] [CrossRef]
  53. Bowler, D.E.; Buyung-Ali, L.; Knight, T.M.; Pullin, A. Urban greening to cool towns and cities: A systematic review of the empirical evidence. Landsc. Urban Plan. 2010, 97, 147–155. [Google Scholar] [CrossRef]
Figure 1. The street orientation in the historical core of Lodz.
Atmosphere 12 00751 g001
Figure 2. Woonerfs in the historical core of Lodz.
Atmosphere 12 00751 g002
Figure 3. Microclimatic parameters of the warmest day of the multi-year.
Atmosphere 12 00751 g003
Figure 4. Location of measurement points in canyon areas (left—canyon with an east–west orientation; right—canyon with a north–south orientation).
Atmosphere 12 00751 g004
Figure 5. High-greenery scenarios.
Atmosphere 12 00751 g005
Figure 6. Thermal and aerodynamic conditions in the typical canyons in Lodz (Base Case).
Atmosphere 12 00751 g006aAtmosphere 12 00751 g006b
Figure 7. Effect of high greenery on microclimatic parameters within the canyon (the left column—E-WN; the right column—E-WS in the canyon with an east–west orientation; at 1.5 m height).
Atmosphere 12 00751 g007aAtmosphere 12 00751 g007b
Figure 8. Effect of high greenery on air temperature within the canyon (the left column—N-SE, the right column—N-SW in the canyon with a north–south orientation; at 1.5 m height).
Atmosphere 12 00751 g008aAtmosphere 12 00751 g008b
Figure 9. Air temperature change with height (upper left—E-WN, upper right—E-WS, bottom left—N-SE, bottom right—N-SW).
Atmosphere 12 00751 g009
Figure 10. Effect of high greenery on thermal comfort within the canyon (first—readings taken at the north facade (E-WN), second—at the south façade (E-WS) in the canyon with an east–west orientation; third—readings taken at the east facade (N-SE), forth—at the west façade (N-SW) in the canyon with a north–south orientation; at 1.5 m height).
Atmosphere 12 00751 g010
Table 1. Parameters of street canyon prototype.
Atmosphere 12 00751 i001
Model size:189 × 58 × 30
Grid resolution:1 m × 1 m × 1 m
Frontal buildings:27 × 11 m
Side outbuildings:8 × 10 m
Aspect ratio:0.90
SVF:0.80
Material parametersExternal part of the wall
- plaster -
Internal part of the wall
- brick -
- roofing felt -
Thickness0.20 m0.64 m0.01 m
Absorption50%60%94%
Transmission0%0%0%
Reflection50%40%6%
Emissivity90%90%90%
Specific heat850 J/kg·K650 J/kg·K1460 J/kg·K
Thermal conductivity0.60 W/m·K0.44 W/m·K0.18 W/m·K
Density1500 kg/m31500 kg/m31000 kg/m3
Table 2. Microclimate parameters in the measurement points (the average value).
ScenarioE-WNE-WSN-SEN-SW
Air temperature (°C)
BC29.1529.0628.7428.78
T29.0228.9428.6028.65
T229.0128.9228.5628.60
T329.0628.9828.6428.69
Mean Radiant Temperature (°C)
BC36.2430.2730.3730.44
T35.1128.9829.1529.22
T235.0528.8929.1029.15
T334.8729.0130.1430.16
Surface Temperature (°C)
BC30.4025.6928.6628.70
T29.9825.5728.4428.48
T229.8825.4528.3928.44
T329.9125.2528.5828.62
Wind flow (m/s)
BC0.130.161.421.41
T0.160.221.301.31
T20.160.221.271.28
T30.140.171.331.34
Table 3. PET index scale.
PET °CThermal PerceptionGrade of Physiological Stress
4 °Cvery coldextreme cold stress
8 °Ccoldstrong cold stress
13 °Ccoolmoderate cold stress
18 °Cslightly coolslight cold stress
23 °Ccomfortableno thermal stress
29 °Cslightly warmslight heat stress
35 °Cwarmmoderate heat stress
41 °Chotstrong heat stress
Publisher’s Note: MDPI stays neutral with regard to jurisdictional claims in published maps and institutional affiliations.

