Article

Comparative Numerical Study of PM2.5 in Exit-and-Entrance Areas Associated with Transboundary Transport over China, Japan, and Korea

1
Department of Atmospheric Sciences, Pusan National University, Busan 46241, Korea
2
Institute of Atmospheric Environment, Chinese Research Academy of Environmental Sciences (CRAES), Beijing 100012, China
3
Meteorological Research Institute (MRI), Japan Meteorological Agency (JMA), Tsukuba 305-0052, Japan
4
Climate & Air Quality Research Department, National Institute of Environmental Research (NIER), Incheon 404170, Korea
5
Ulsan National Institute of Science and Technology, School of Urban and Environmental Engineering, Ulsan 44919, Korea
6
Asia Center for Air Pollution Research (ACAP), Niigata 950-2144, Japan
7
Department of Civil and Environmental Engineering, Konkuk University, Seoul 05029, Korea
8
Department of Applied Chemistry and Life Science, Toyohashi University of Technology, Toyohashi 441-8580, Japan
9
Emission Inventory Management Team, National Air Emission Inventory and Research Center, Osong 28166, Korea
10
Institute of Environmental Studies, Pusan National University, Busan 46241, Korea
*
Authors to whom correspondence should be addressed.
Atmosphere 2021, 12(4), 469; https://doi.org/10.3390/atmos12040469
Submission received: 7 March 2021 / Revised: 29 March 2021 / Accepted: 2 April 2021 / Published: 8 April 2021
(This article belongs to the Special Issue Aerosol Pollution in Asia)

Abstract

:
We report the results of year-long PM2.5 (particulate matter less than 2.5 µm in diameter) simulations over Northeast Asia for the base year of 2013 under the framework of the Long-range Transboundary Air Pollutants in Northeast Asia (LTP) project. LTP is a tripartite project launched by China, Japan, and Korea for cooperative monitoring and modeling of the long-range transport (LRT) of air pollutants. In the modeling aspect in the LTP project, each country’s modeling group employs its own original air quality model and options. The three regional air quality models employed by the modeling groups are WRF-CAMx, NHM-RAQM2, and WRF-CMAQ. PM2.5 concentrations were simulated in remote exit-and-entrance areas associated with the LRT process over China, Japan, and Korea. The results showed apparent bias that remains unexplored due to a series of uncertainties from emission estimates and inherent model limitations. The simulated PM10 levels at seven remote exit-and-entrance sites were underestimated with the normalized mean bias of 0.4 ± 0.2. Among the four chemical components of PM2.5 (SO42−, NO3, organic carbon (OC), and elemental carbon (EC)), the largest inter-model variability was in OC, with the second largest discrepancy in NO3. Our simulation results also indicated that under considerable SO42− levels, favorable environments for ammonium nitrate formation were found in exit-and-entrance areas between China and Korea, and gas-aerosol partitioning for semi-volatile species of ammonium nitrate could be fully achieved prior to arrival at the entrance areas. Other chemical characteristics, including NO3/SO42− and OC/EC ratios, are discussed to diagnose the LRT characteristics of PM2.5 in exit-and-entrance areas associated with transboundary transport over China, Japan, and Korea.

1. Introduction

PM2.5 (ultrafine particulate matter (PM) with a diameter of less than 2.5 μm) has adverse effects on both climate radiative forcing and the human body, leading to numerous respiratory diseases. The International Research Agency on Cancer, a specialized institution of the World Health Organization, designates PM2.5 as a carcinogen of the highest level. In addition, PM2.5 is closely associated with long-range transport (LRT) processes [1,2] and is therefore of long-term international concern. Over Northeast Asia, PM2.5 pollution is an issue of the highest priority, as local emissions can markedly affect the environments of downwind areas through LRT in combination with complex transport, transformation, deposition, and removal processes. Although many site-specific studies of PM and its gas-phase precursors are underway [3,4,5], model-based analysis of the most efficient emission mitigation methodology for PM2.5 and its applicability in light of the LRT process is still lacking.
PM2.5 formation processes, especially secondary formation, during LRT are highly complicated. Gaseous precursors such as SO2, NO2, and volatile organic compounds (VOCs) may be converted through photo-oxidation during LRT, and in turn, semi-volatile condensable vapors can be formed via the secondary aerosol formation process during (as well as before or after) the LRT process [6,7]. Such secondary aerosol formation can occur in two manners: homogeneous and heterogeneous formation. Homogeneous and heterogeneous reactions occur via many pathways, depending on how the materials comprising PM2.5 were generated and the extent to which the precursors were exposed to NH3 in the environment. Over Northeast Asia, although PM2.5 over major metropolitan areas has been frequently studied, remote and near-border areas (referred to as “exit-and-entrance” areas in this study) over Northeast Asia are lacking in data, as the monitoring of both inflow and outflow areas requires international cooperation.
To establish international cooperation and clarify the source–receptor relationships (SRRs) among nations, combined research groups are organized and activated through research programs. One example of such a program is “Long-range Transboundary Air Pollutants in Northeast Asia (LTP),” which was established by the governments of three countries: China, Japan, and Korea. LTP was launched in 1995 and collaborative research has been performed by the three countries for monitoring and modeling transboundary air pollutants over Northeast Asia, focusing specifically on exit-and-entrance areas [8,9,10,11]. In this collaborative project, modeling and monitoring studies have been conducted to support long-term SRR calculation.
In the recent LTP framework, model intercomparison studies on the simulation of PM2.5 concentrations have a standard base year of 2013, the starting year of Chinese 5-year massive emission reduction implementation over the major cities, and the diagnosis of PM2.5 over remote areas is provided, focusing on exit-and-entrance areas associated with LRT processes out of, into, and among the three countries. In the LTP modeling framework, three modeling groups from China, Japan, and Korea each use their own conventional air quality models with the appropriate options (e.g., physical and chemical treatments, initial and boundary conditions, parameterization processes, and other transport and removal processes). At an annual meeting, inter-model variabilities including those related to emission inventories, meteorological and chemical fields, removal processes, and PM conversion rates were addressed.
In this paper, we present the outputs of modeling intercomparison results produced by researchers of the LTP modeling project. An overview of the major findings obtained through modeling and a comparison among the three models for the base year of 2013 is presented. The emphasis is on monitoring of remote exit-and-entrance areas through which transboundary air pollutants pass over China, Japan, and Korea. We also explored PM2.5 composition through simulated gas-to-aerosol partitioning of inorganic NO3, NO3/SO42+, and organic carbon to elemental carbon (OC/EC) ratios in exit-and-entrance areas during LRT. We expect that our results for the base year of 2013 serve as a useful reference for interpreting PM2.5 base levels prior to the implementation of Chinese emission mitigation strategies, because in 2013, the Chinese government began to implement the first 5-year Clean Air Action Plan [12] for mitigating PM pollution.

2. Models and Monitoring Sites

2.1. Modeling Framework of the LTP Project

The shared domain of the three models used here covers 20–50° N and 100–150° E, including the entirety of Korea and Japan, most of China, and parts of Mongolia, Russia, and some Southeast Asian countries (Figure 1) . The three air quality models are all three-dimensional Eulerian models that include transport, chemistry, and removal modules, as well as individual three-dimensional meteorological numerical models. The meteorological fields are provided in an individual manner with their own meteorological drivers. As the members of the LTP project agreed to accept the original models without specifying any options, such as resolution or physical and chemical parameters, individual modeling groups do not necessarily use the same model parameters or input data. Anthropogenic emissions are recommended as the unified input data; however, lax specifications regarding emission inventories were agreed upon to accommodate various contributors to this project.
The three models used in LTP are the Weather Research and Forecasting (WRF)- Comprehensive Air Quality Model with Extensions (CAMx) , Non-Hydrostatic Model (NHM)-Regional Air Quality Model2 (RAQM2), and WRF-Community Multiscale Air Quality Modeling System (CMAQ) (hereafter referred to as WRF-CAMx, NHM-RAQM2, and WRF-CMAQ, respectively), employed by China, Japan, and Korea, respectively. Each modeling system is abbreviated in the form of “A-B”, with the meteorological model (A) and chemical transport model (B), combined with a hyphen (-), for convenience in the present study. The meteorological and chemical models, WRF, CAMx, NHM, RAQM2, and CMAQ, have all been used across numerous research communities [13,14,15,16,17,18,19,20]. The individual models employed zero initial conditions and default profiles of boundary conditions. Detailed information on each of these three models is provided in Table 1.

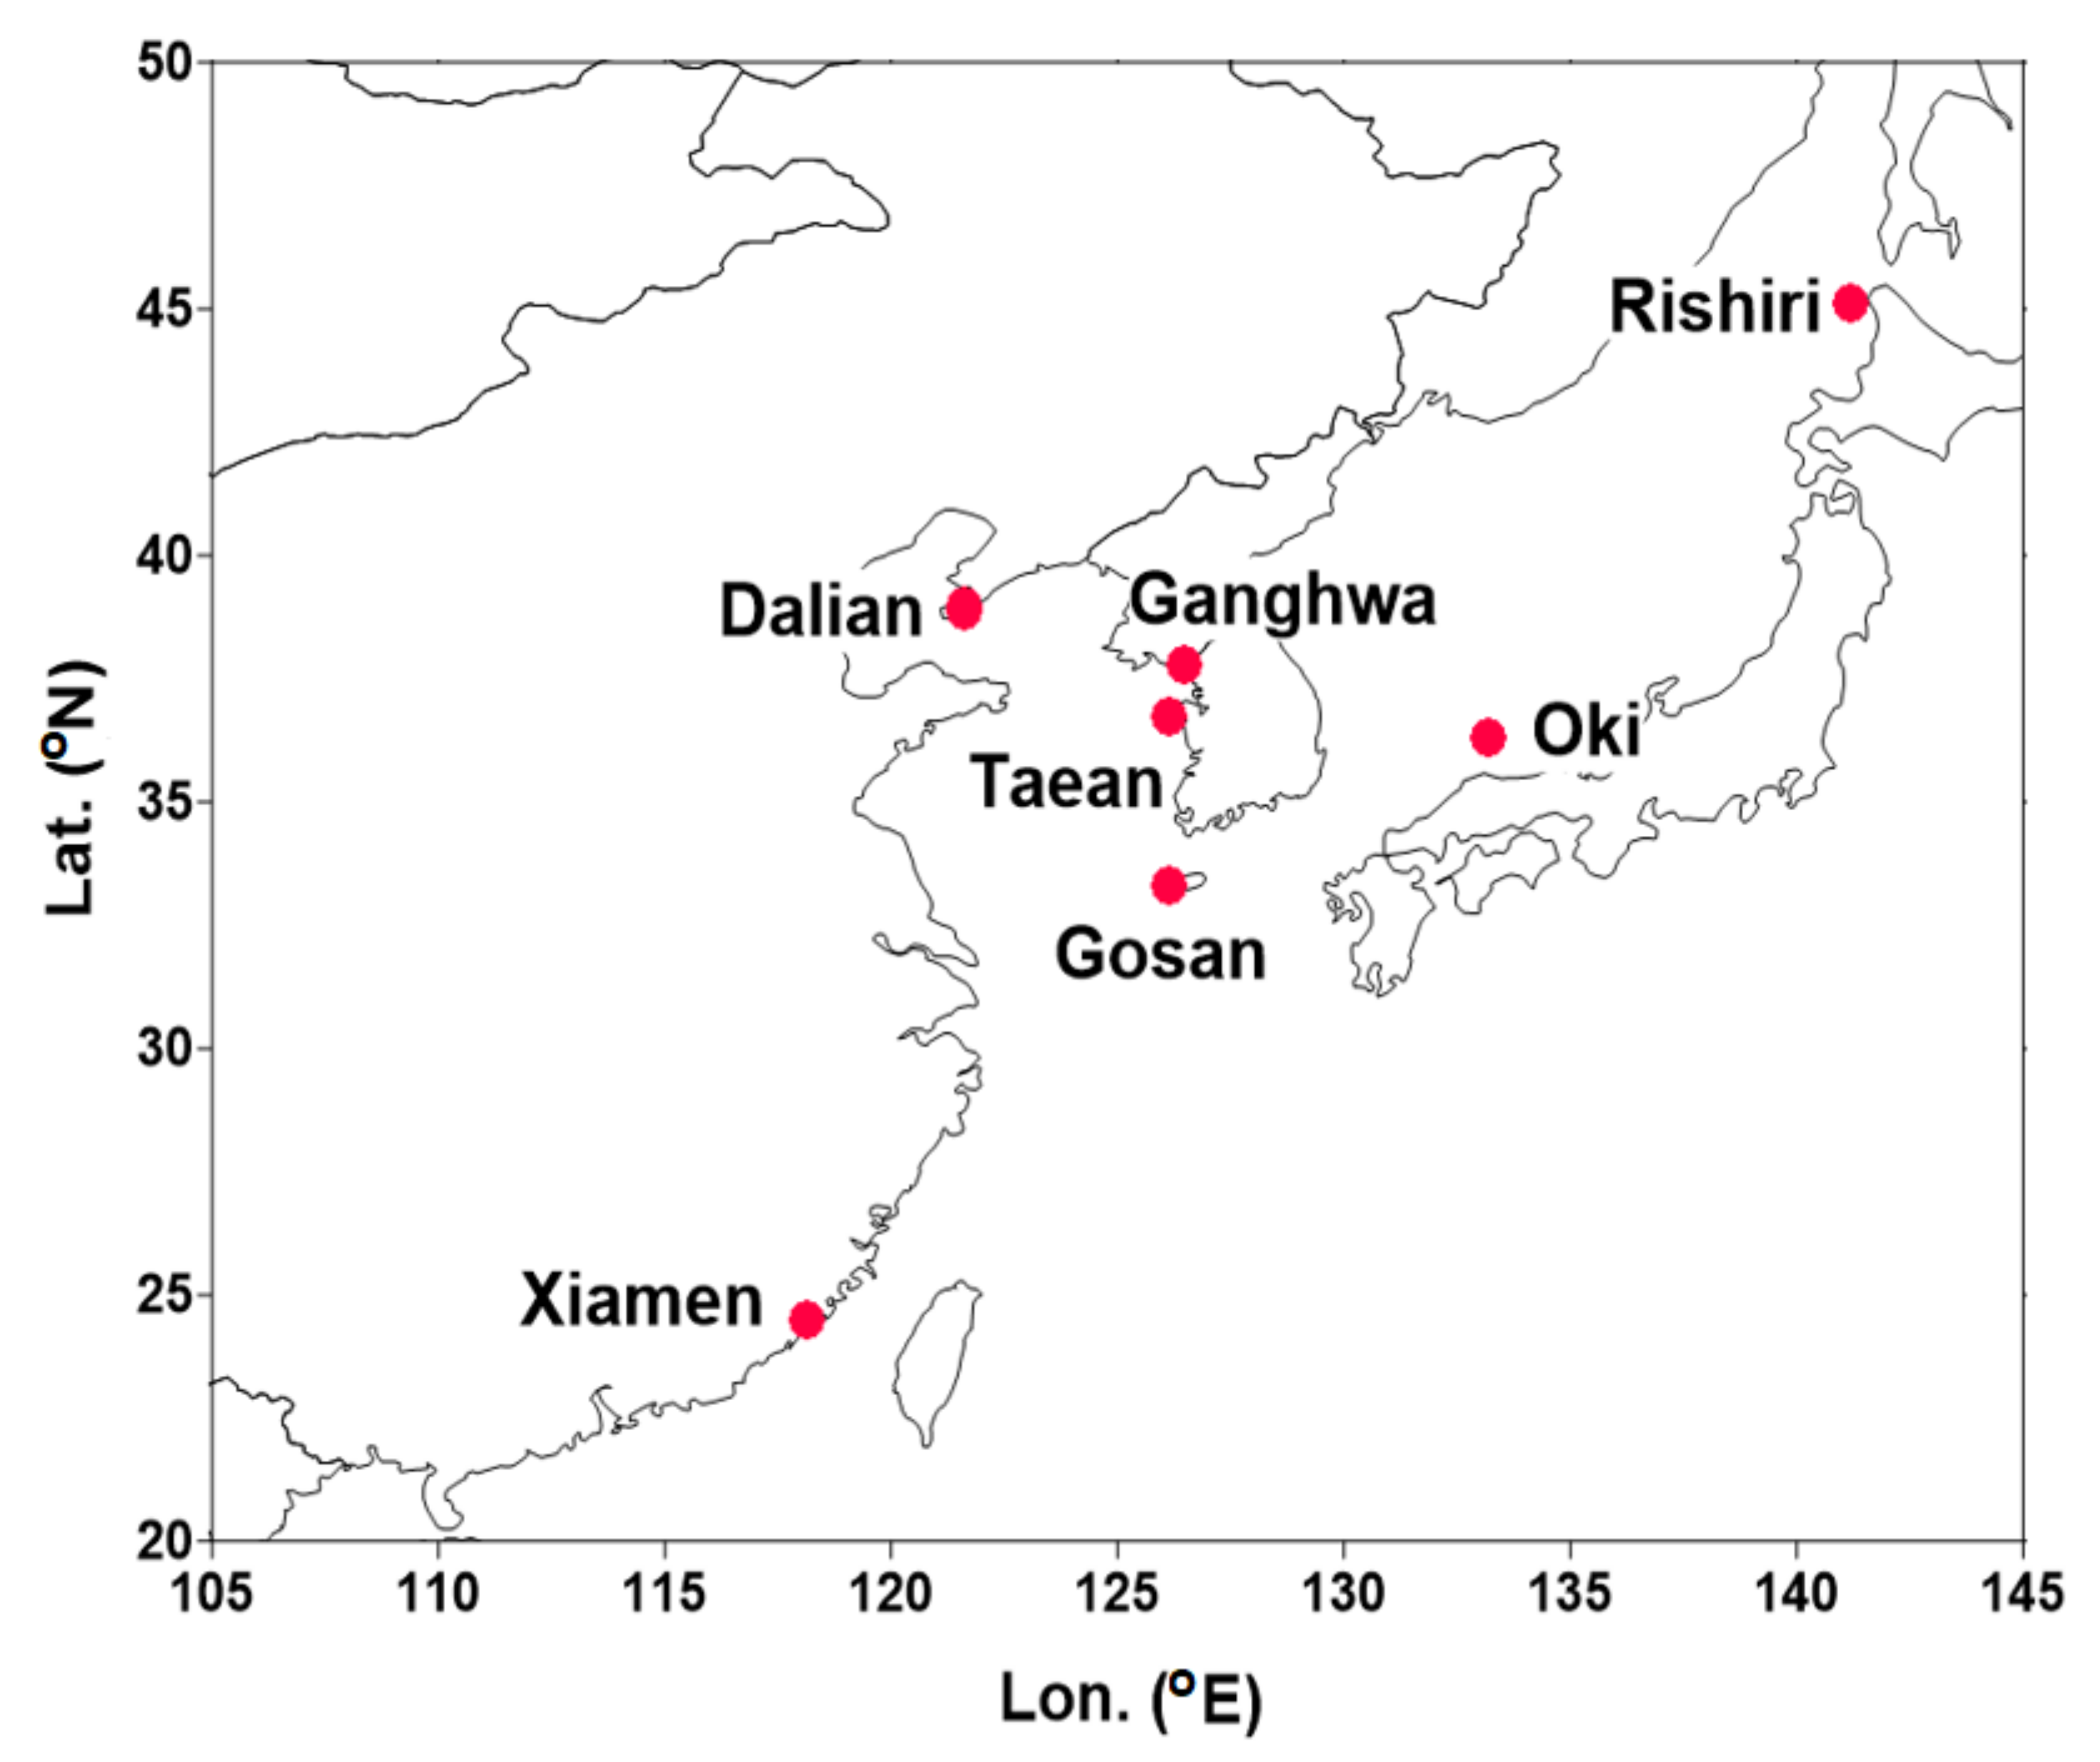
2.2. Observation Sites in the Exit-and-Entrance Areas

In-situ surface measurements were collected at seven exit-and-entrance sites: Fujiazhuan in Dalian (China), Xiamen (China), Ganghwa, Taean, and Gosan (Korea), and Oki and Rishiri (Japan). These sites are located in remote areas in near-border areas of China, Japan, and Korea, and have been recognized as exit-and-entrance sites to monitor both inflow and outflow of air pollutants over Northeast Asia. The locations and characteristics of these seven sites are illustrated in Figure 1 and listed in Supplementary Table S1. It should also be noted that these seven sites are recognized as monitoring sites over exit or entrance areas decided by three governments in the LTP framework, which are associated with transboundary transport over three countries: China, Japan, and Korea. Therefore, measurements from sites other than these seven sites are beyond the content of the current study.

2.3. Emission Data Used

The anthropogenic emission inventory employed by NHM-RAQM2 and WRF-CMAQ is the Comprehensive Regional Emissions for Atmospheric Transport Experiments (CREATE), which was developed by the National Institute of Environmental Research and Kunkuk University of Korea in 2013. The CREATE data for the base year of 2013 (CREATE-2013) are based on GAINS/BlueSky emissions model. The 0.5-degree gridded monthly global emissions data of GAINS-Asia were mosaicked for 2013 using the CAPSS (Clean Air Policy Support System) emission inventory and generated hourly emissions with a horizontal resolution of 36 km over the entire LTP domain (Figure 1). The anthropogenic emissions dataset CREATE was used in the 2015 Megacity Air Pollution Studies—Seoul Project [7,21], and the Korea and USA Air Quality Campaign Project, launched in 2016. It contains data on anthropogenic NOx, SO2, NH3, non-methane VOC (NMVOC), black carbon (BC), and primary organic aerosol (POA) emissions. The detailed CREATE-2013 emission strengths for SO2, NOx, VOCs, NH3, and primary PM2.5 for China, Japan, and Korea are listed separately in Supplementary Table S2, and the gridded emission spatial distributions (ton/year/grid) of CREATE-2013 are shown in Supplementary Figure S1.
WRF-CAMx employs a Chinese emissions inventory originally inferred from the Multi-resolution Emission Inventory (MEIC) for China and the Regional Emission Inventory in Asia (REAS ver. 2) [22] for areas outside of China. Biogenic emissions are considered in WRF-CAMx and NHM-RAQM2, which are generated by MEGAN2. In addition, NHM-RAQM2 employs both volcanic emissions over Japan and the Global Fire Emissions Database (GFED3) [23] for open biomass burning emissions of NOx, SO2, NMVOCs, BC, and POA.

3. Results

3.1. Meteorological Fields and SO2 and NOx Gas Species

The spatial distributions of the monthly mean temperature and wind fields simulated by the three models for representative months of four seasons—i.e., January, April, July, and October—are shown in Supplementary Figures S2 and S3, respectively. Monthly mean temperatures exhibited a similar distribution in all models, with strong shared variations. The wind fields also exhibited close resemblance in all three models, showing that northwest air currents prevailed over northeast China, Korea, and Japan in spring (April) and winter (January), whereas southerlies prevailed over southern China, Korea, and Japan in summer (July) due to the East Asia summer monsoon over the Pacific Ocean, and the pattern in autumn (October) was similar to that in the winter, but with much lower wind speeds.
Notably, all three models used in this study overestimated the surface wind speed relative to surface observations in Seoul by factors of 1.5–2.2 (Supplementary Figure S4), whereas non-surface (i.e., 850 haPa) wind speed exhibited fairly good agreement (data not shown). This pattern is frequently observed in major cities in Northeast Asia, indicating that overprediction of near-ground-level wind speed is one of the important factors affecting PM2.5 prediction performance over Northeast Asia. Other meteorological variables, such as relative humidity and pressure, were well-aligned with observation data at measurement sites including Beijing, Tianjin, and Hubei. Some models slightly underestimated relative humidity, and all three models’ pressure simulations provided small overestimates in those three cities relative to actual observations. However, overall, the simulated meteorological fields were credible, with no significant biases and low root mean square errors.
The distributions of gaseous SO2 and NO2 are shown in Supplementary Figures S5 and S6 respectively, for the representative months of January, April, July, and October. The spatial distributions of gaseous SO2 were almost identical to those of SO2 emissions, as illustrated in Supplementary Figure S1. All models indicated the same general pattern of gaseous SO2: higher in winter and lower in summer (Supplementary Figure S5), mainly due to the emission characteristics, as discussed in the previous studies [9,10]. Relatively, WRF-CAMx predicted lower levels of SO2 than the others in January, particularly in Beijing and surrounding urban areas (Supplementary Figure S5). High SO2 concentrations also occurred in three areas of Mainland China (i.e., northern China)—namely, the Shangxi, Shangdong, and Beijing-Tianjin metropolitan areas and their surrounding provinces, which all correspond to high-SO2 emission areas. In China, the center of high SO2 concentrations appeared to be in northeast China, namely the Chongqing area, the Yangzi River Delta, and Hubei Province, with levels reaching above 50 ppb. In Korea, Pusan had the highest SO2 concentration, at approximately 15 ppb, and most areas of Japan had significantly lower SO2 concentrations. WRF-CAMx simulated lower peaks than the other two models by less than 10 ppb, especially in and around large emission sources (Supplementary Figure S1). The general trends show similar statistical results to previous LTP studies for the base year of 2002 [9,10].
The NO2 distributions, shown in Supplementary Figure S6, also indicate distribution patterns similar to emission patterns (Supplementary Figure S1). In Korea and Japan, the highest NO2 concentrations were at the same levels as those in Mainland China. However, inter-model variability for NO2 was higher than that for SO2. NHM-RAQM2 predicted lower monthly mean SO2 and NO2 values and greater conversion from the gas to aerosol phase for both species. The three models all predicted elevated NO2 concentrations in Chongqing, the Northeast China Plain, Seoul in Korea, and Osaka in Japan, which all approached ~30 ppb. The spatial distributions of NO2 over Mainland China resembled those of SO2, and regions of high NO2 concentrations occurred at locations near those of SO2 in Mainland China. However, some differences were found relative to SO2 in Korea and Japan. For example, higher NO2 concentrations were simulated in the metropolitan areas of Seoul and Pusan, Korea, and in Tokyo, Japan, in 2013 due to reduced coal consumption, in contrast to China (Supplementary Figures S5 and S6).

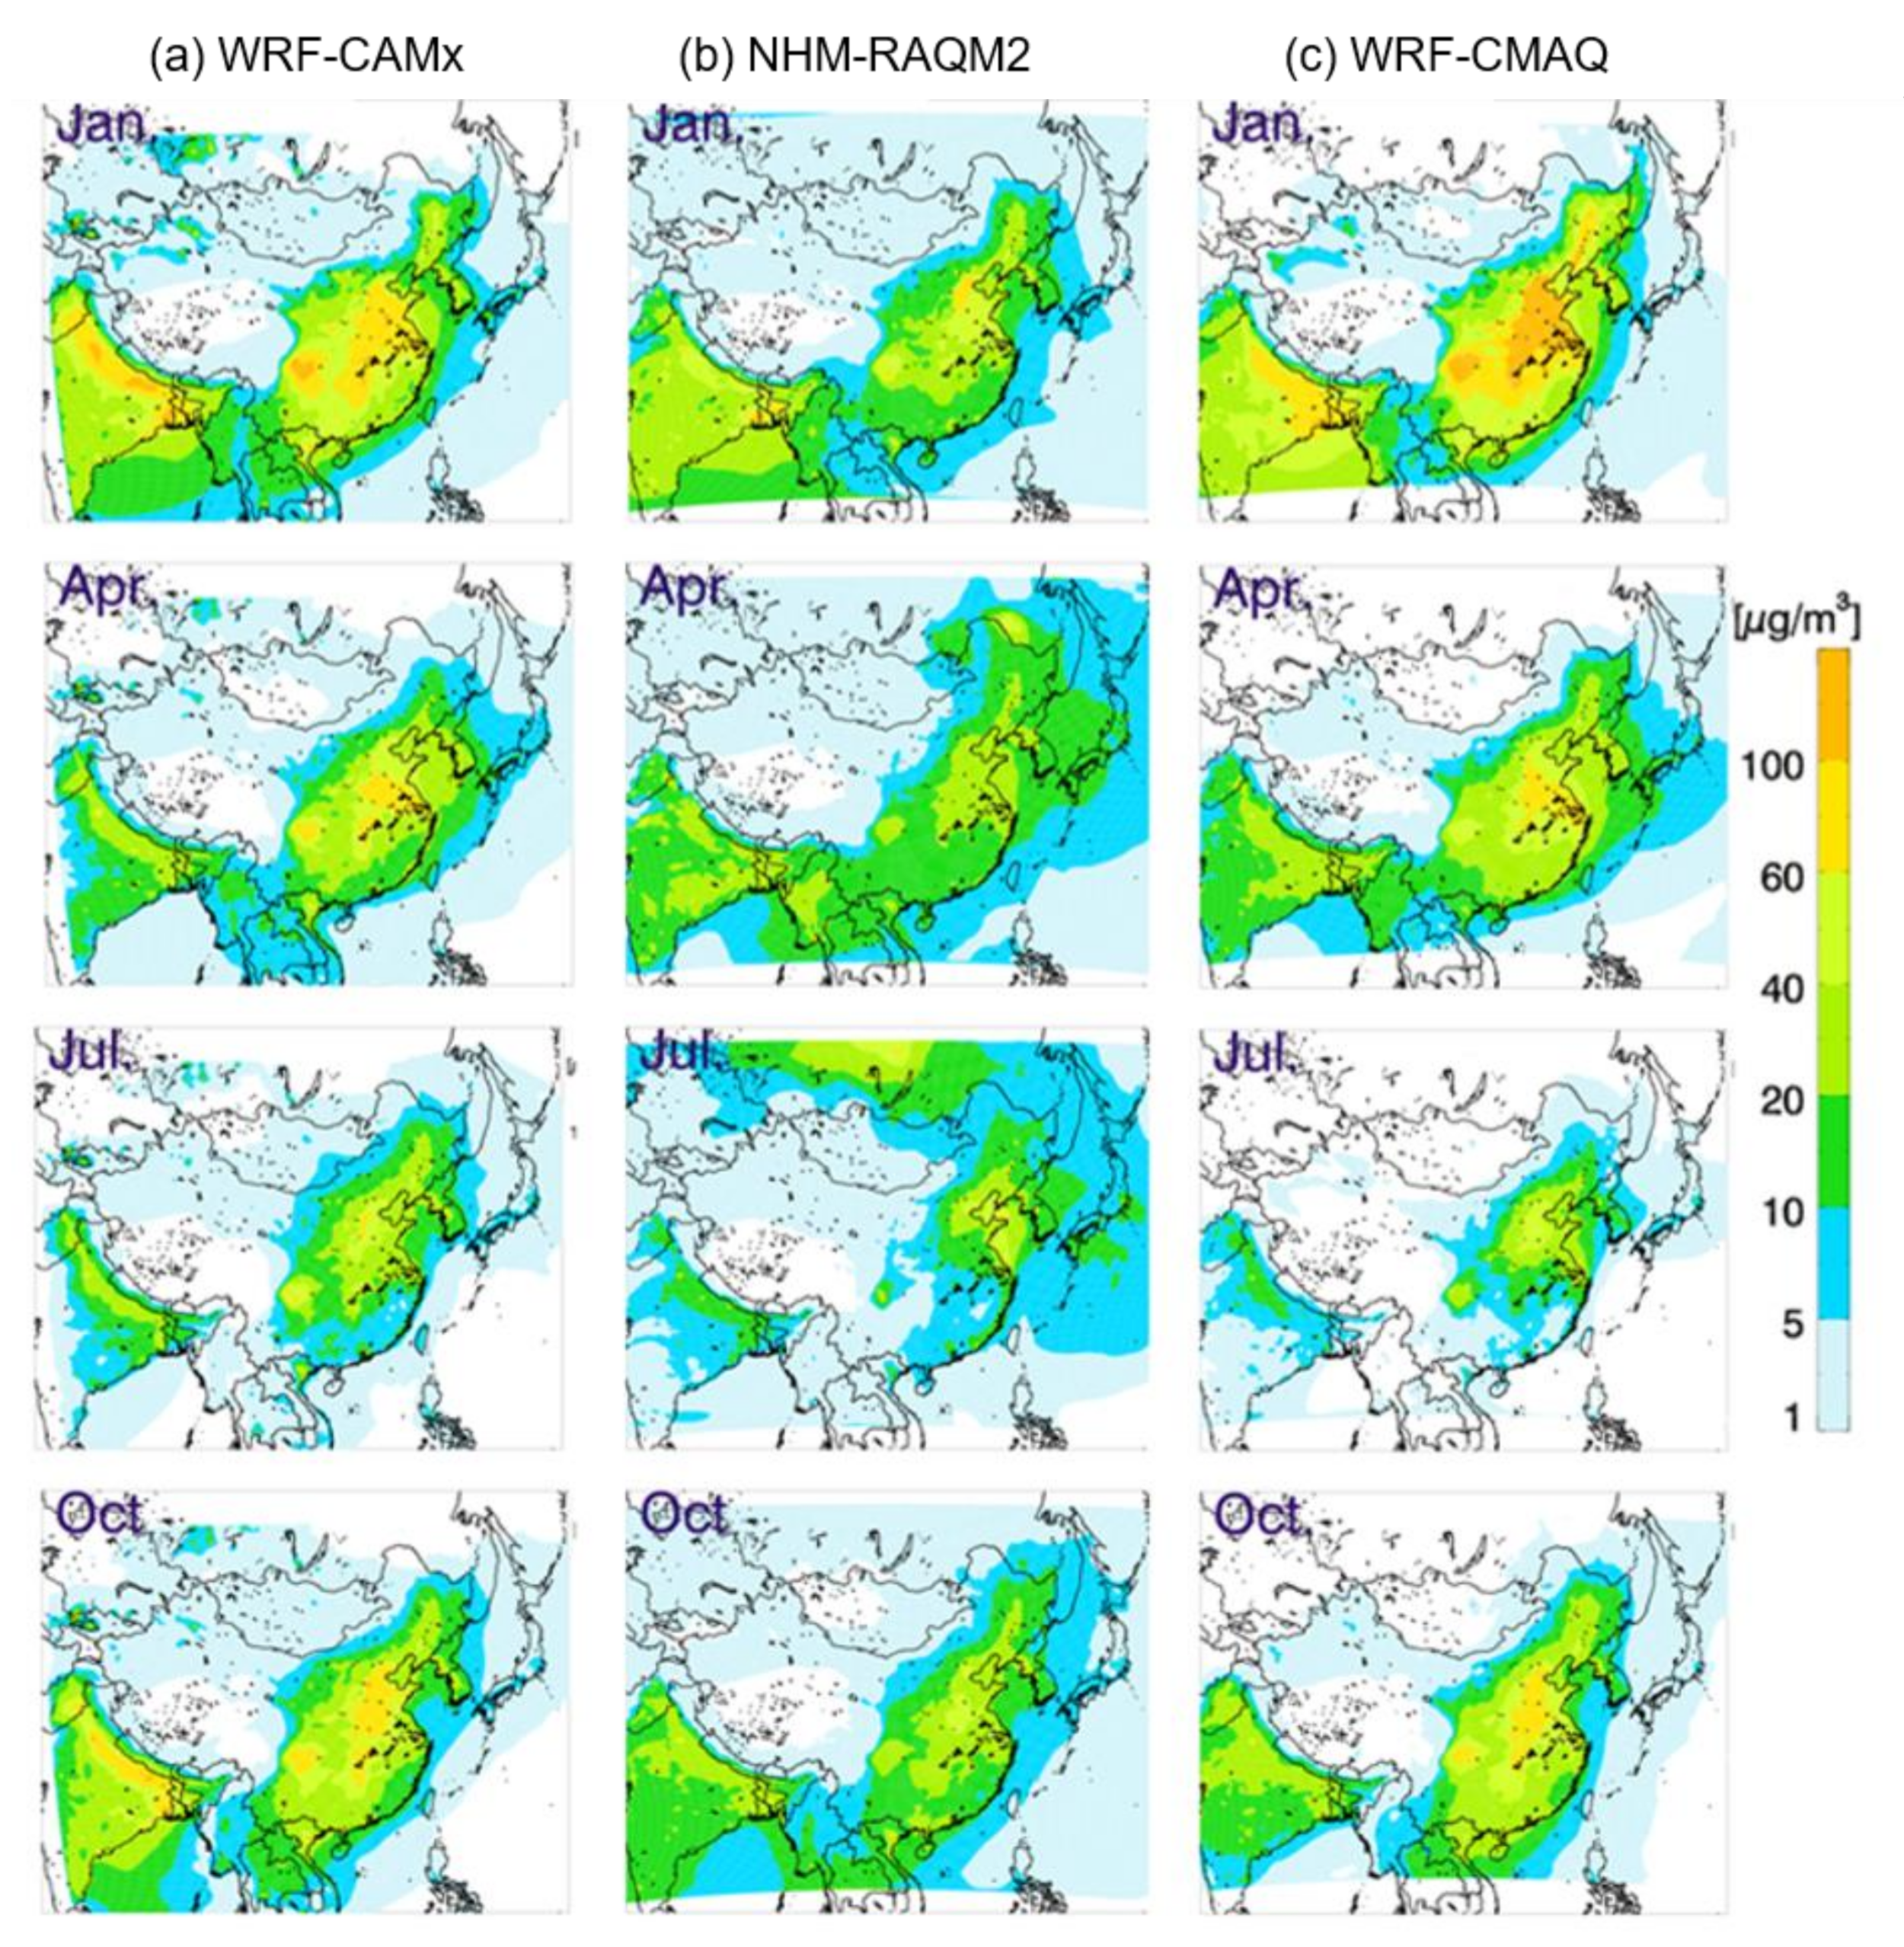
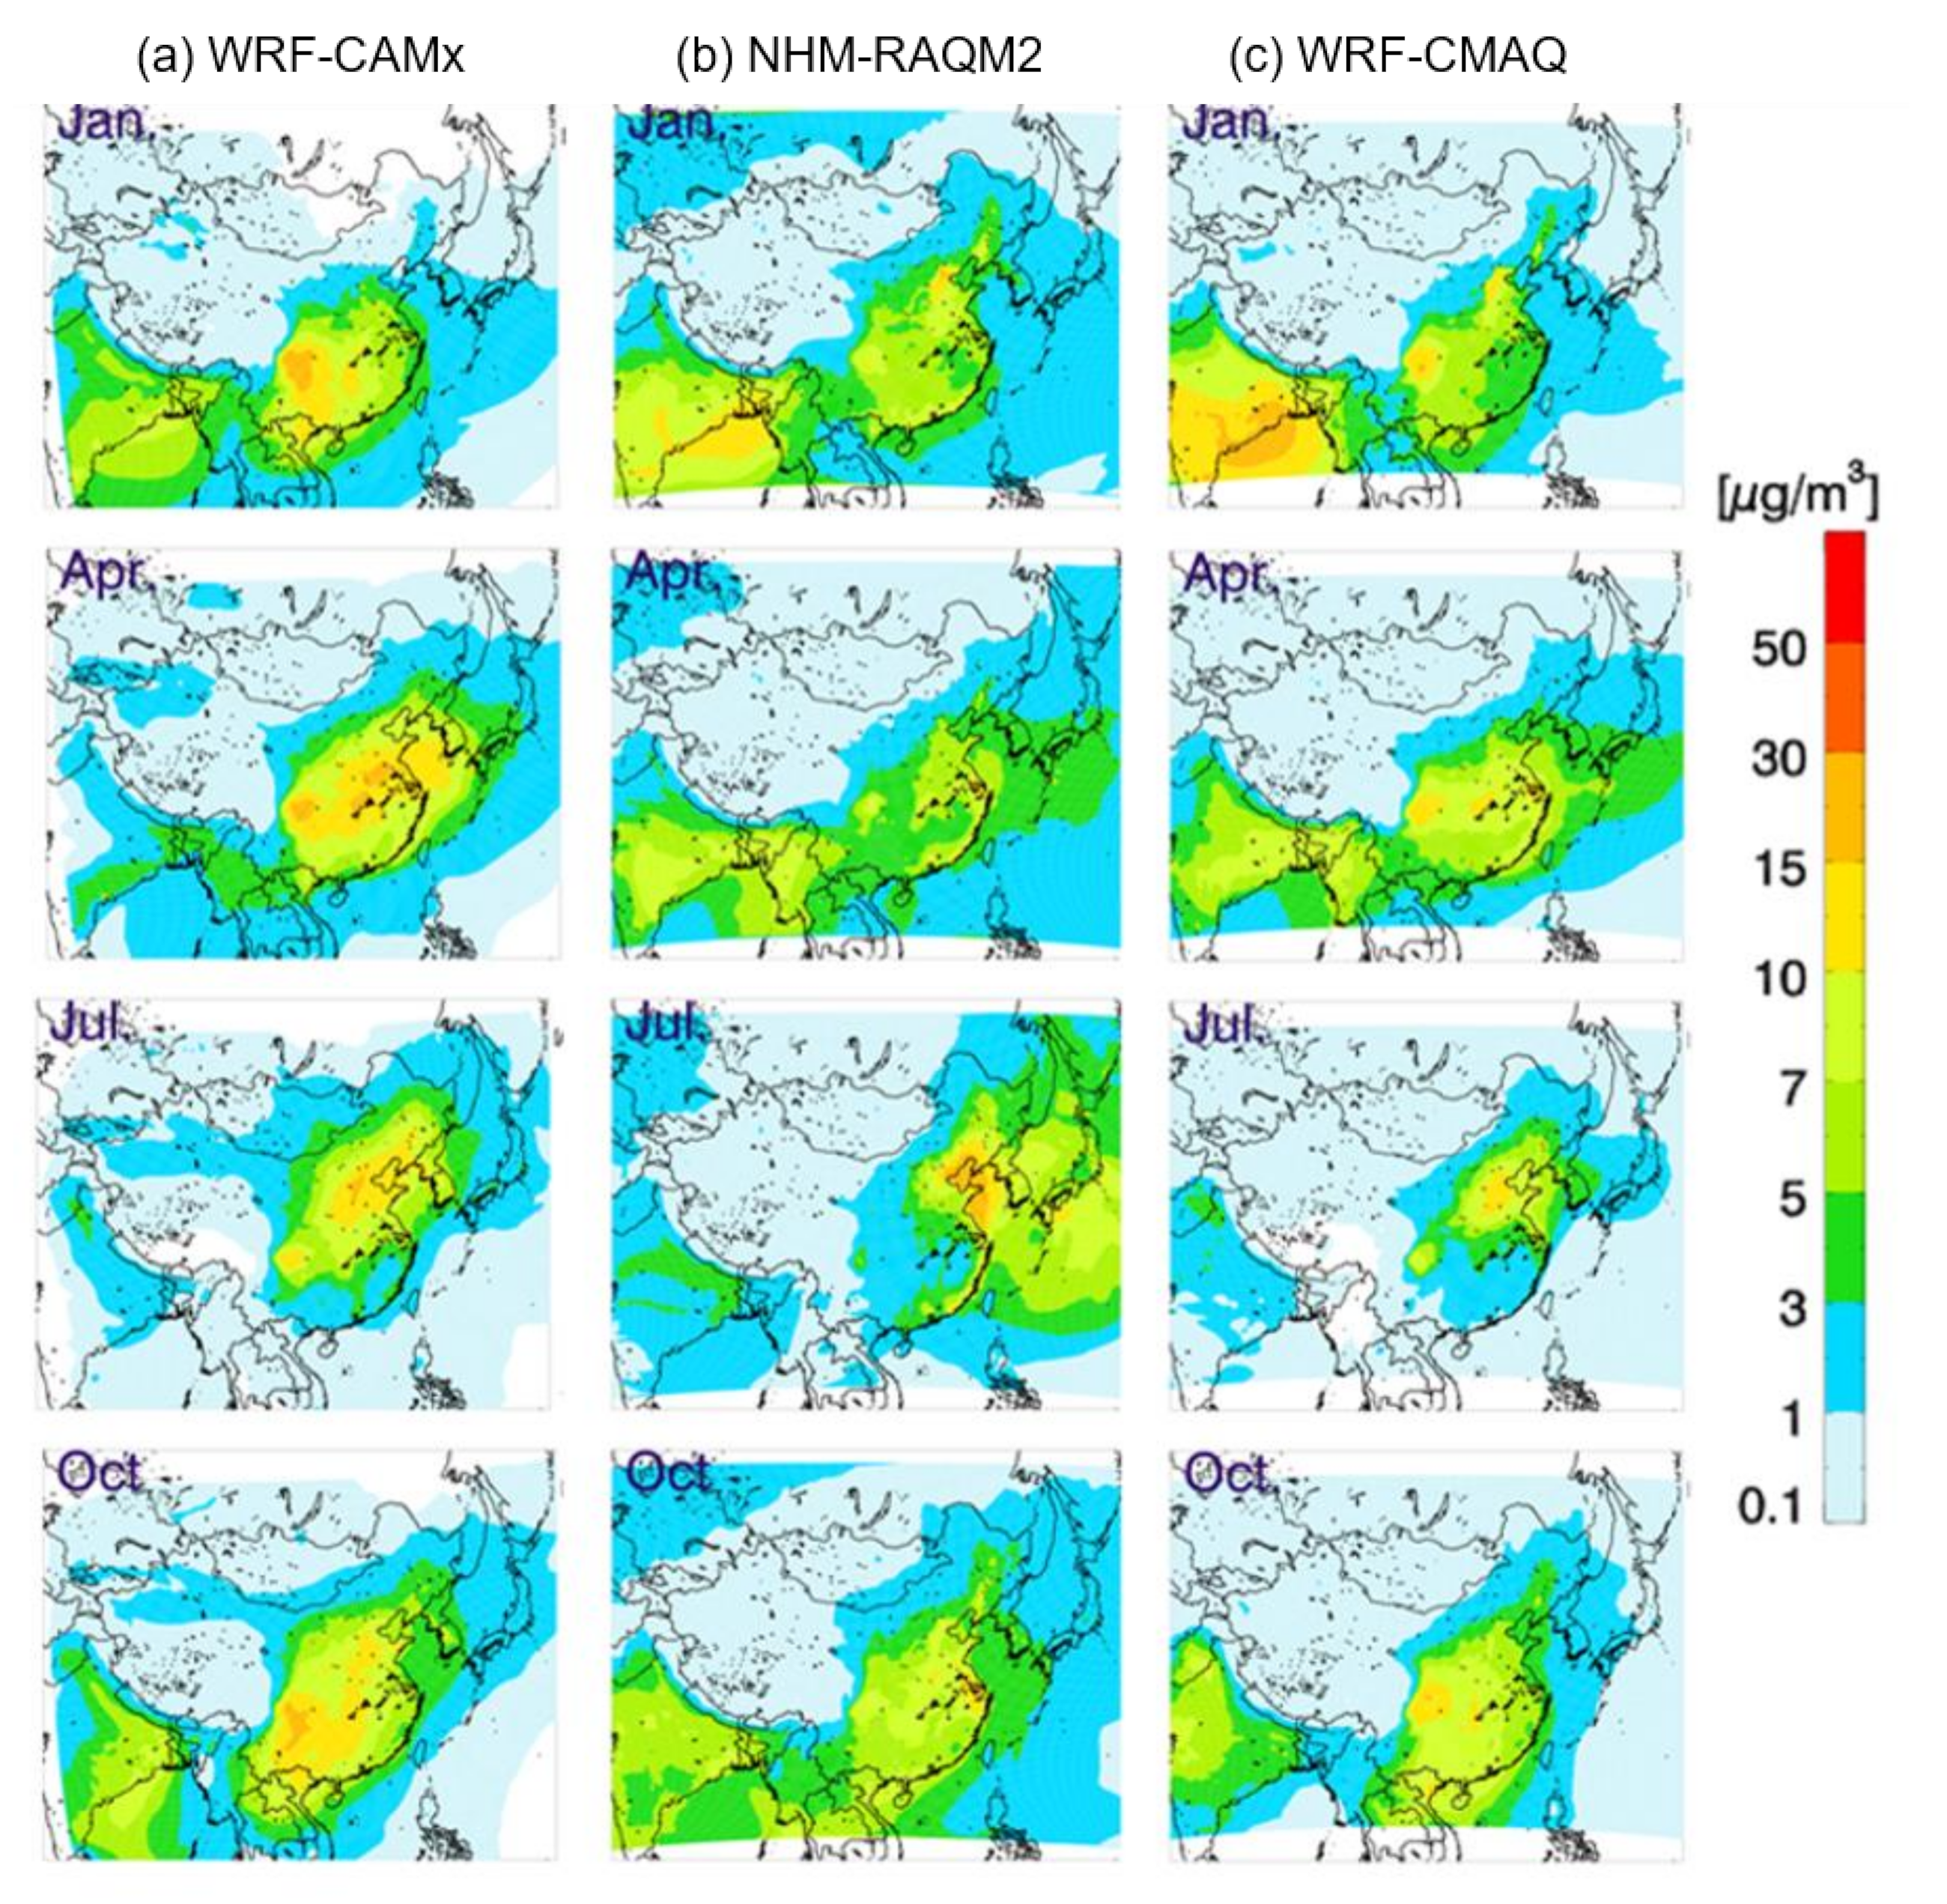
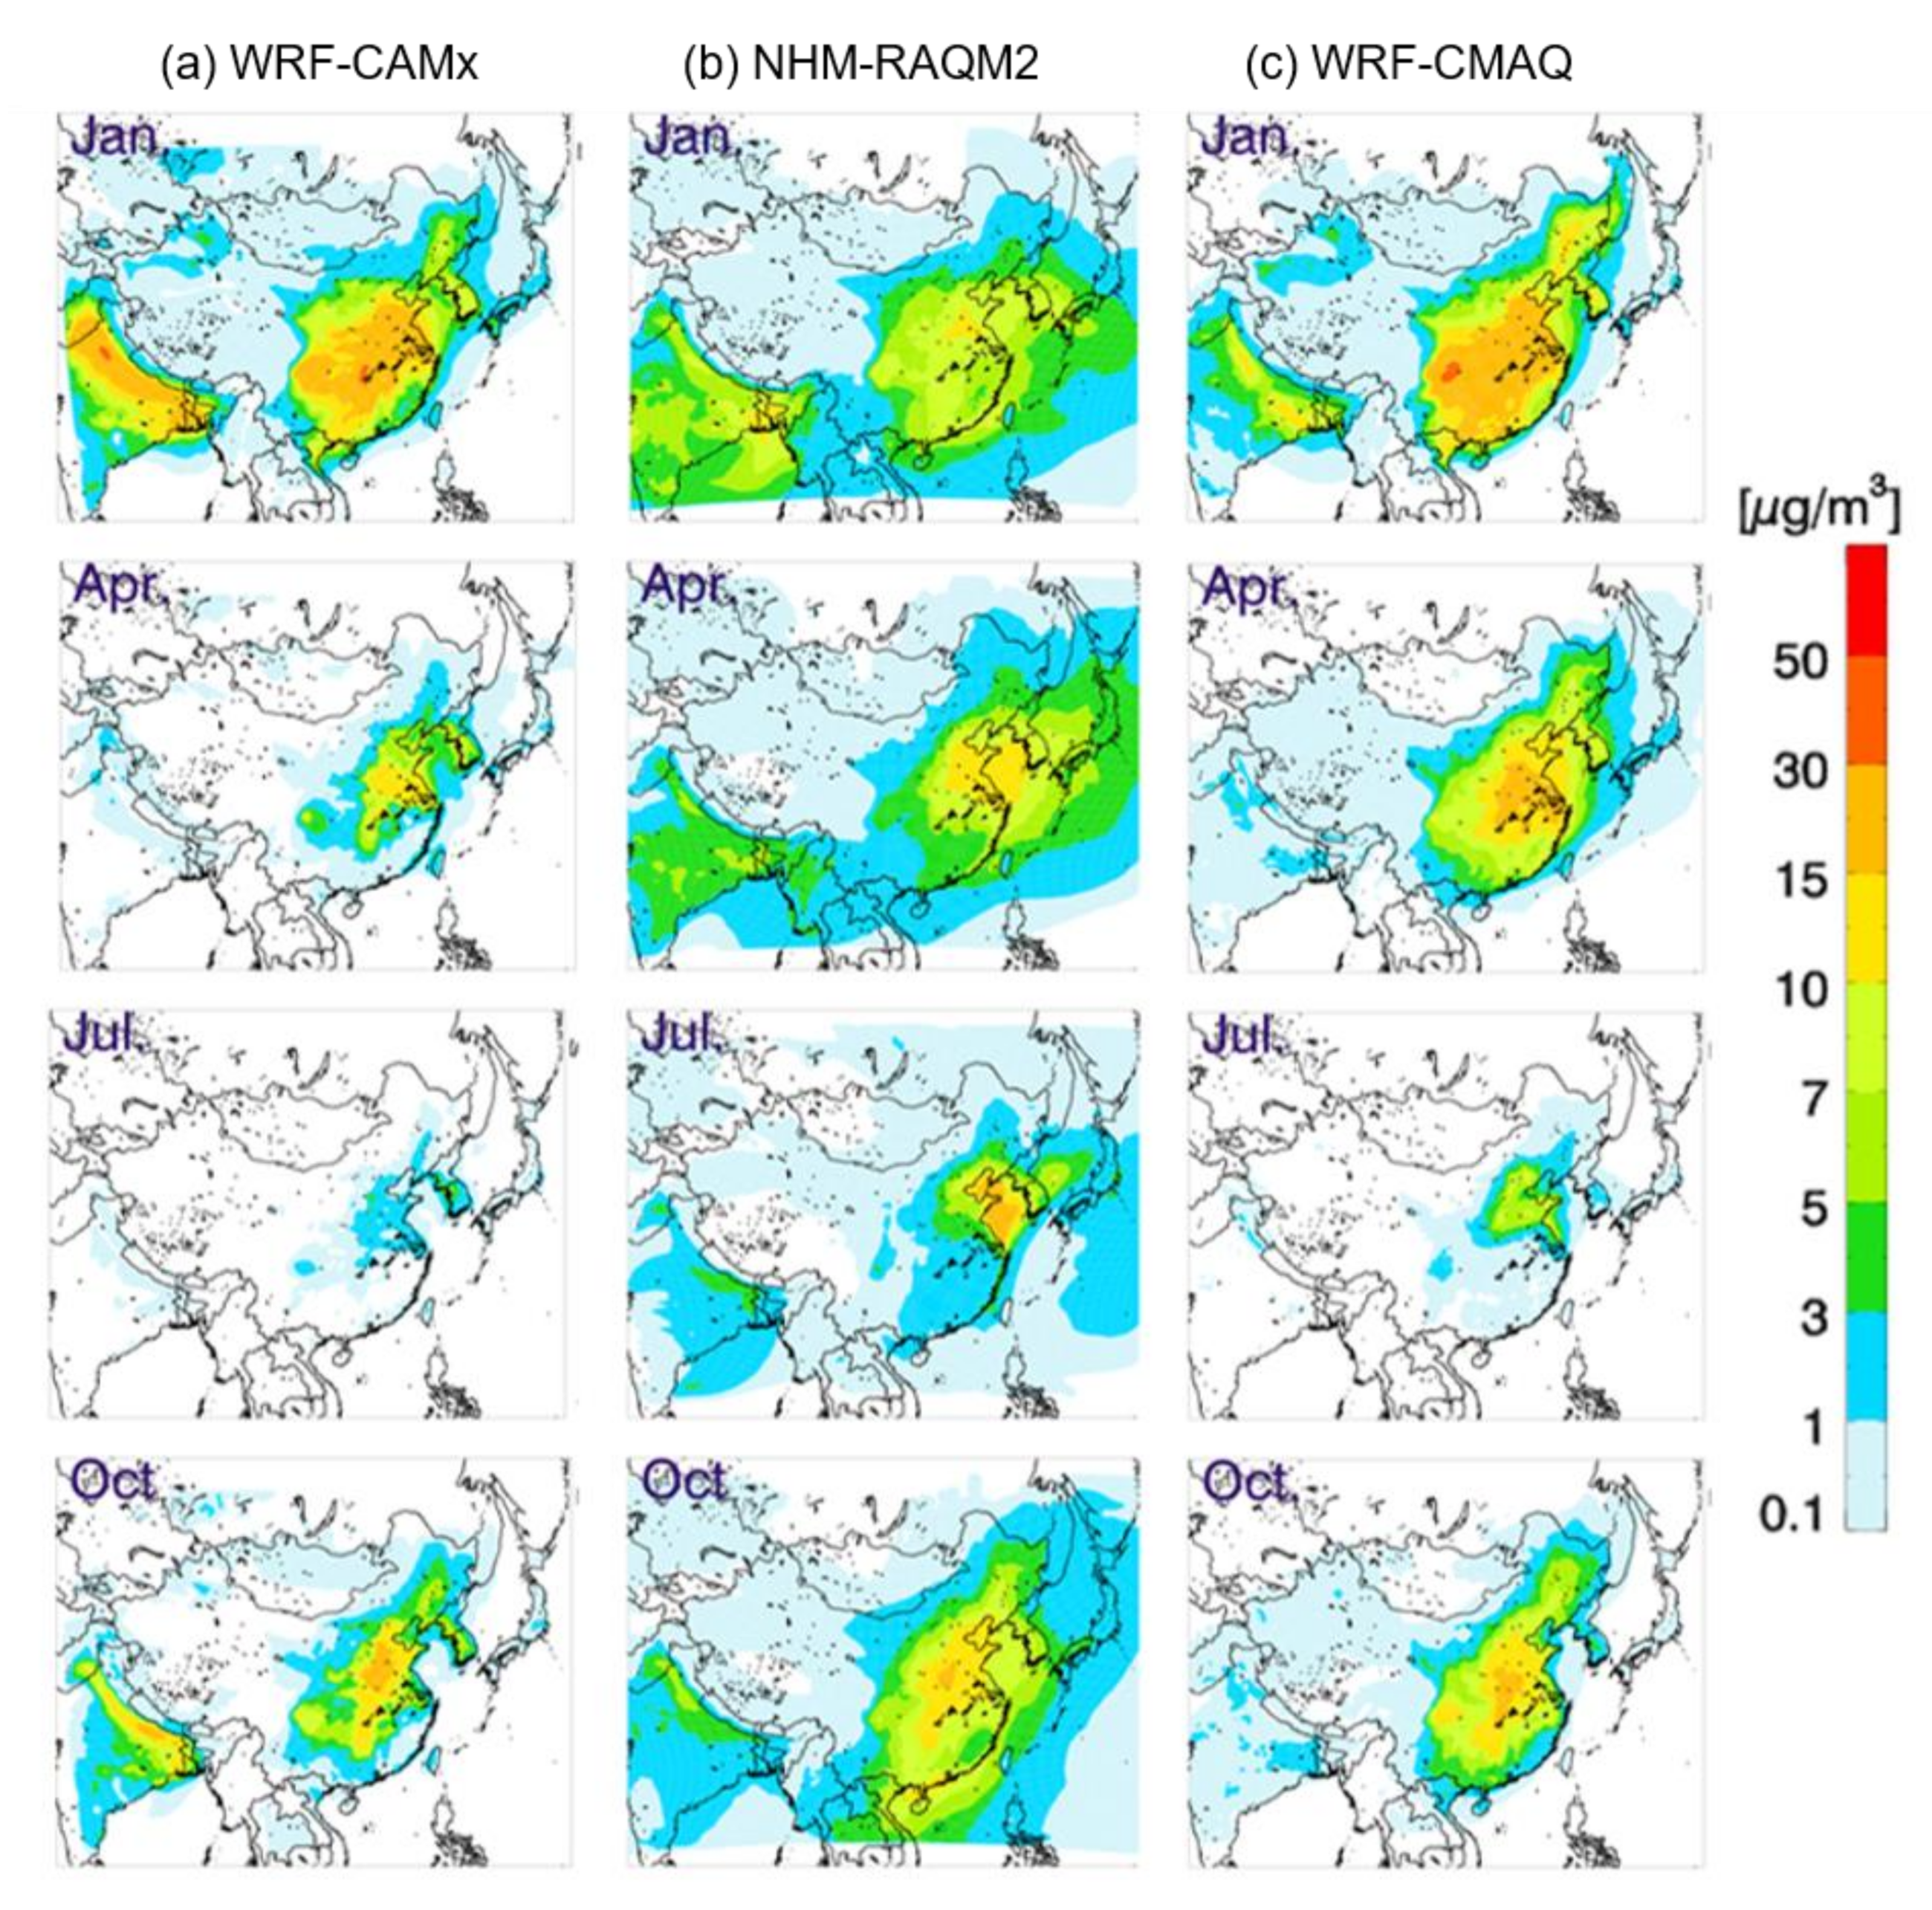
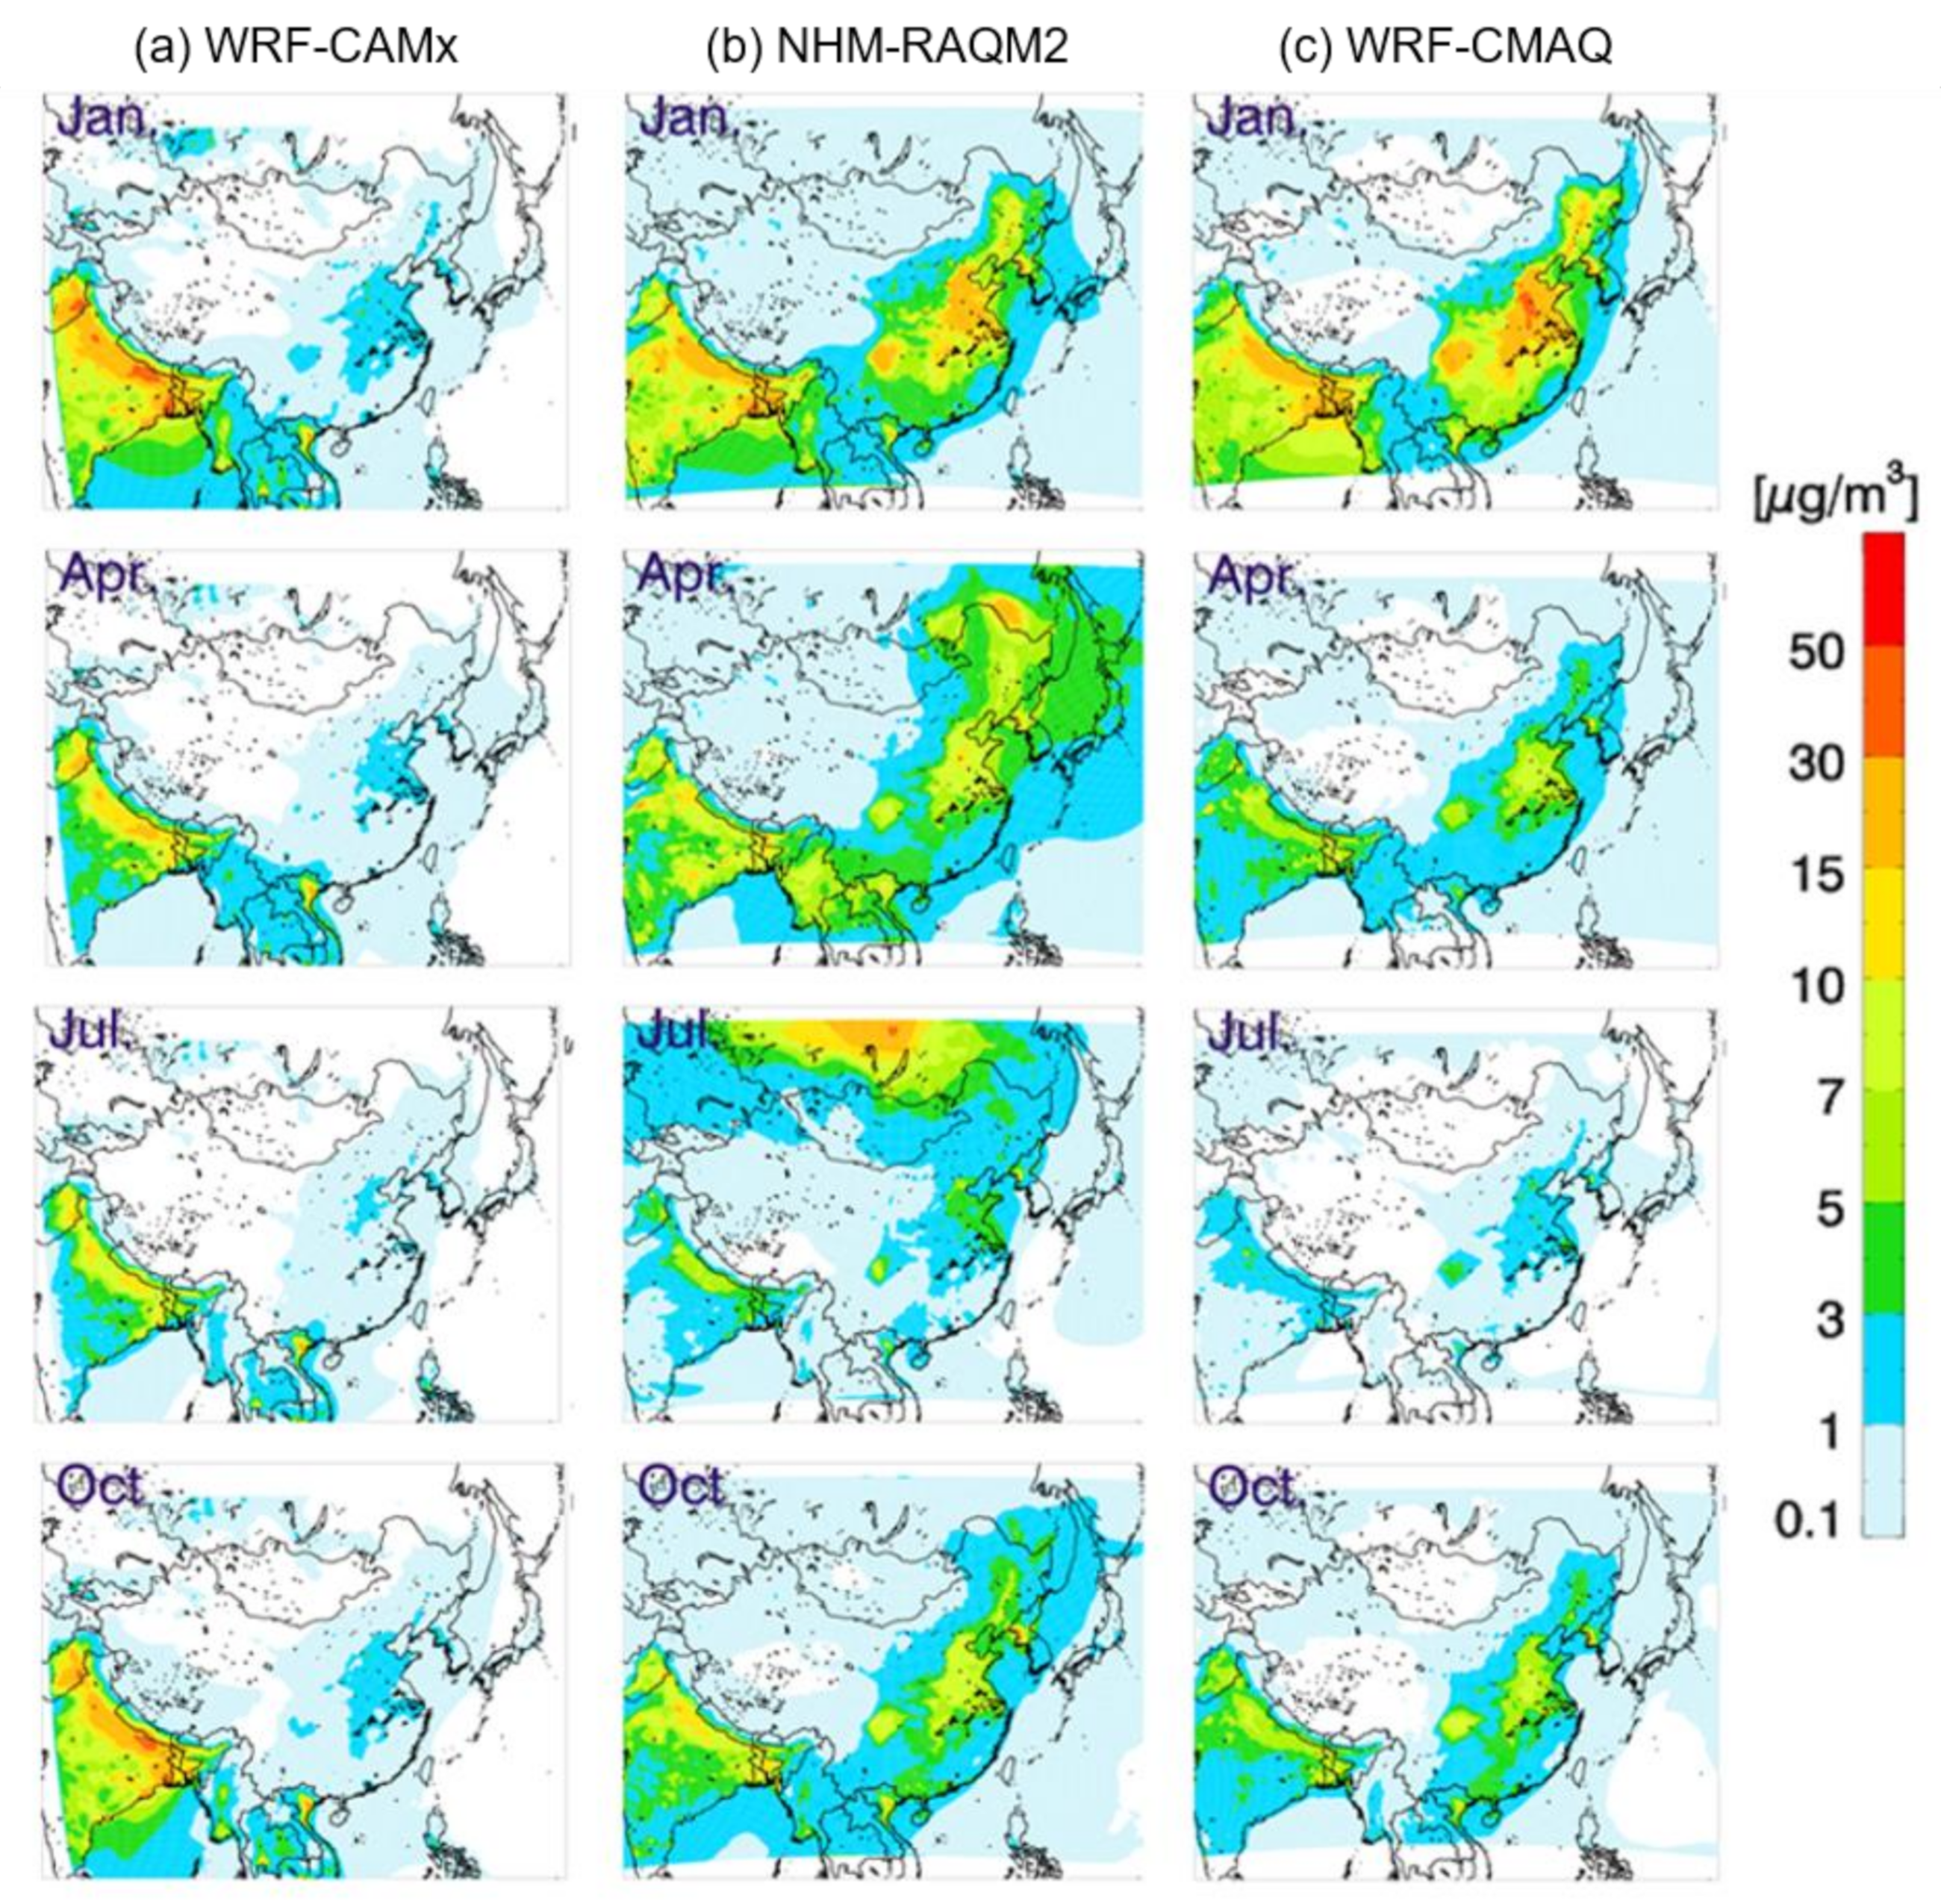
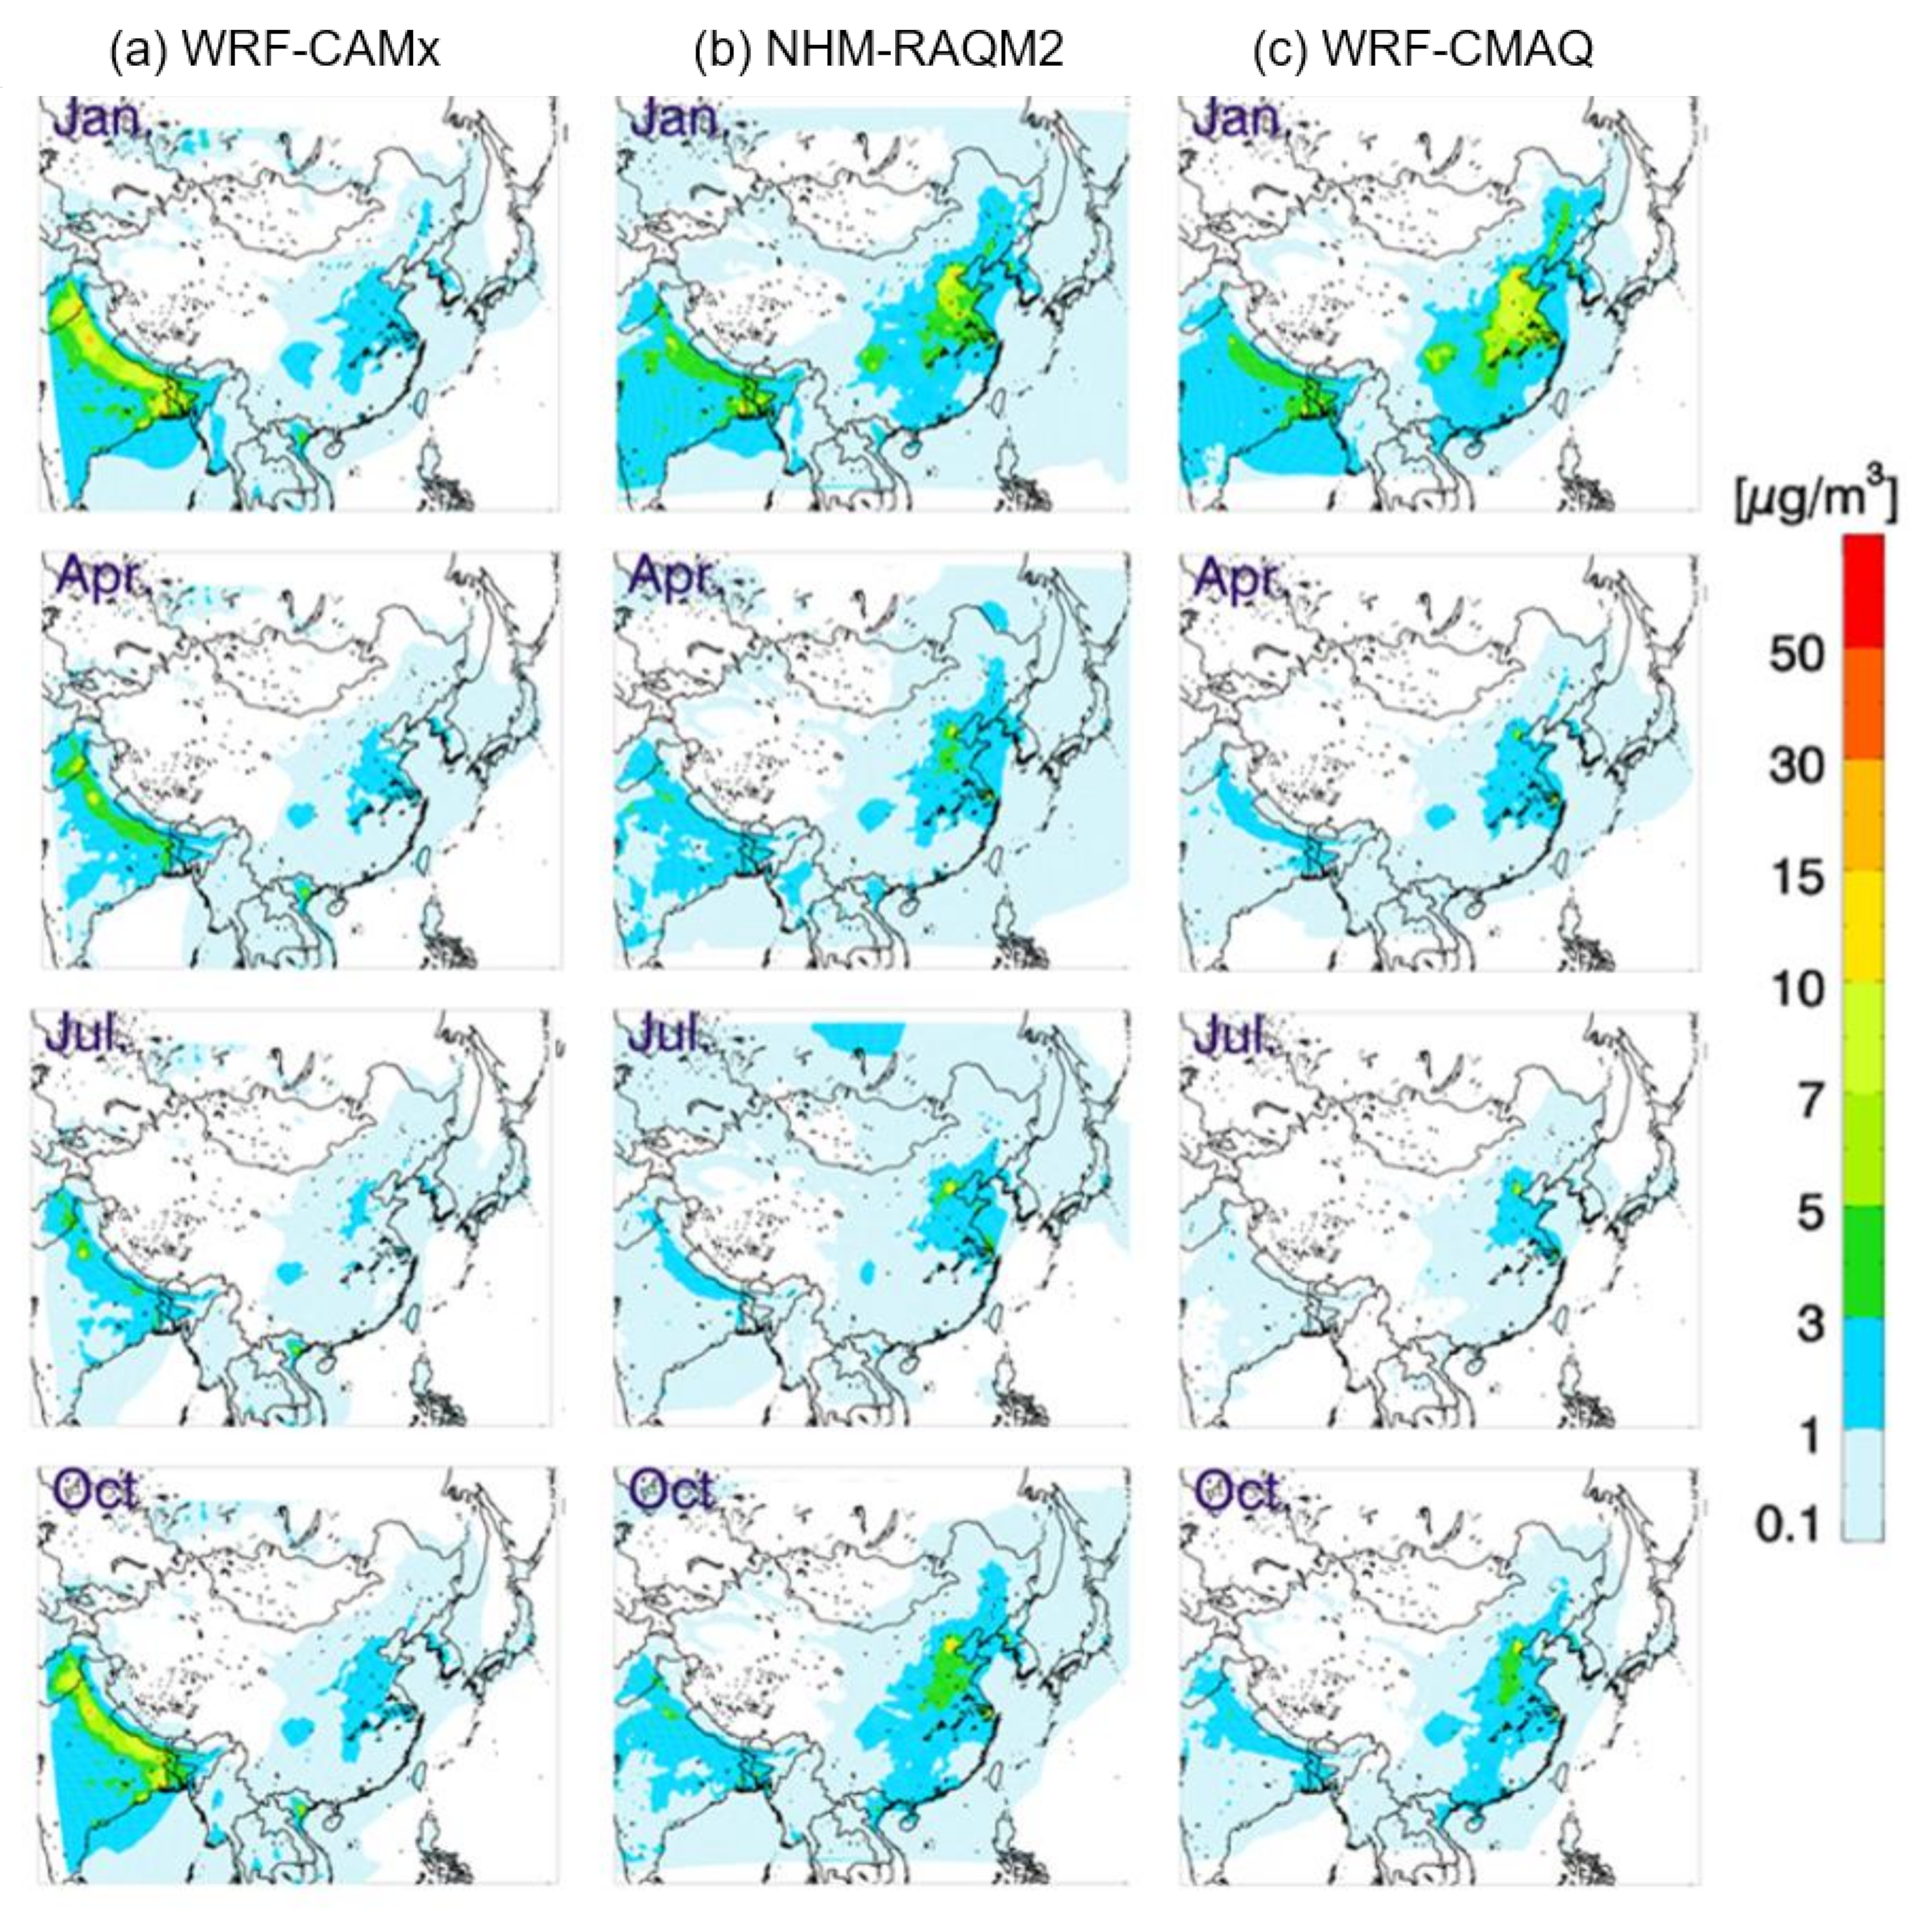
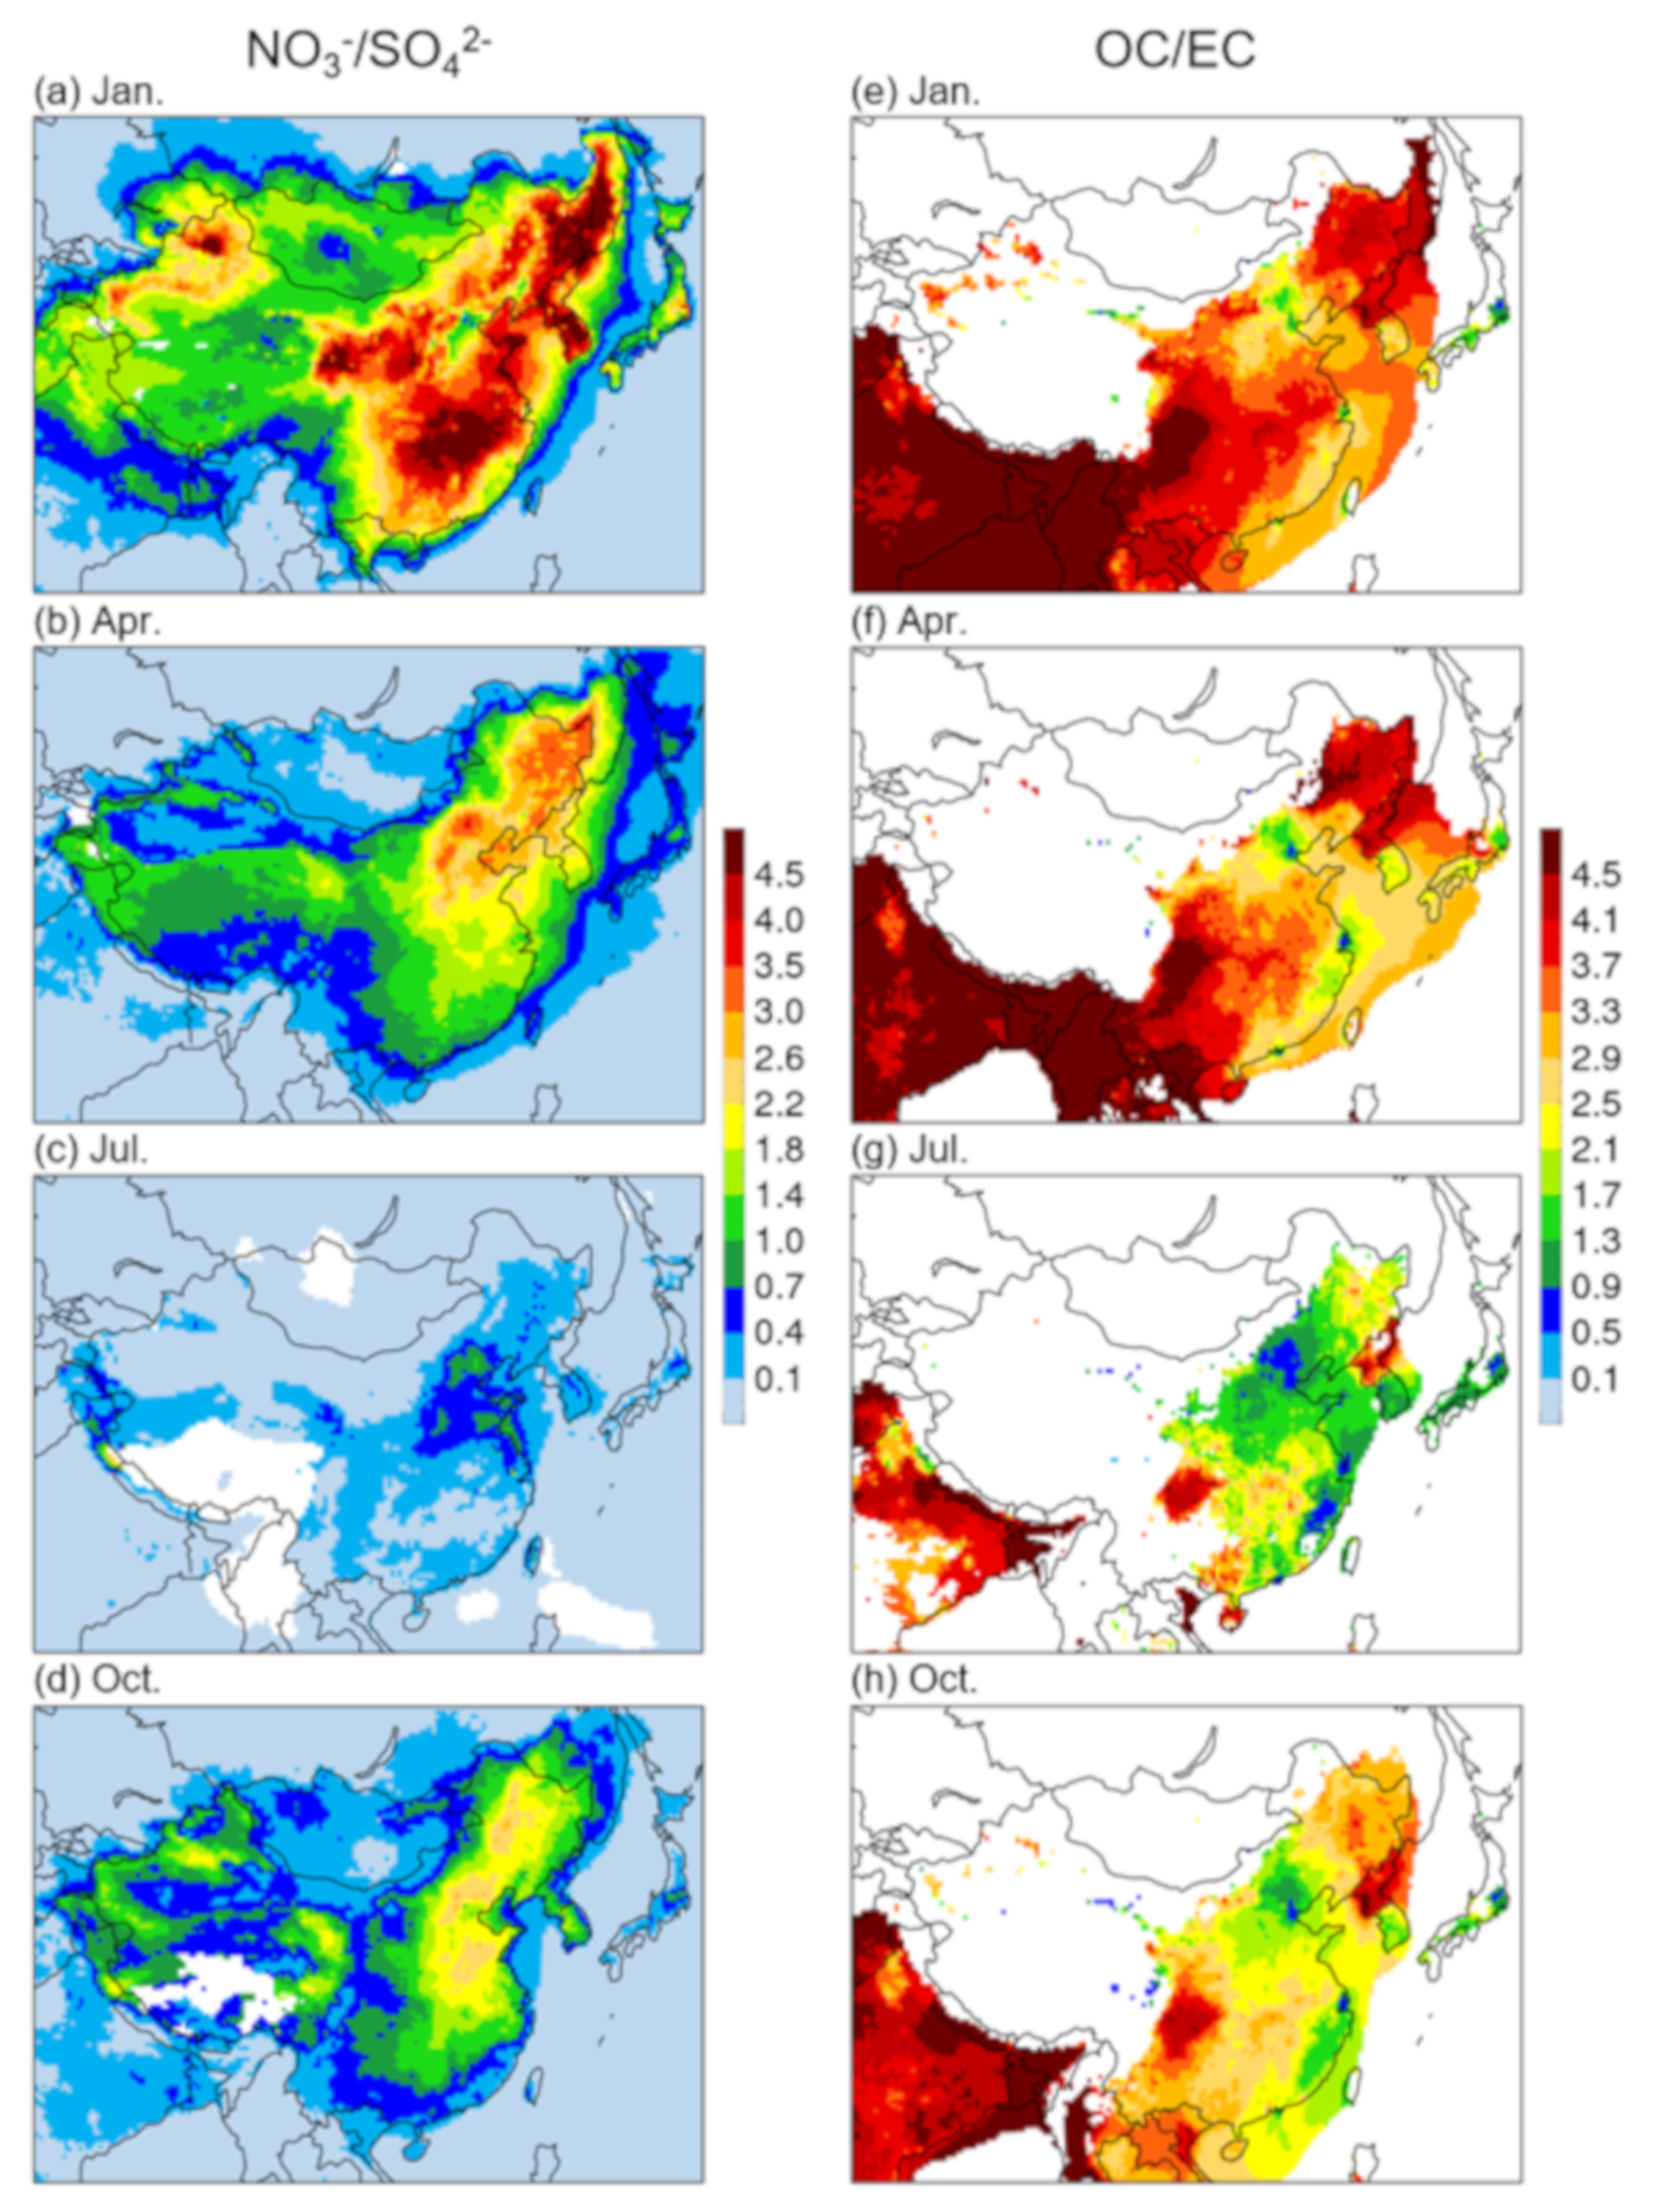
3.2. Concentrations of PM2.5 and Its Chemical Components

As various chemical species of PM2.5 were included in each of the three models, we defined PM2.5 as comprising the following species:
[PM2.5] = [Primary PM2.5] + [SO42−] + [NO3] + [NH4+] + [EC] + [OC]
However, NHM-RAQM2 employed a different definition of PM2.5, namely the summation of submicron-size anthropogenic aerosols (SO42−, NH4+, NO3, and Cl) in the Aitken mode category, unidentified components (UID), organic aerosols (OAs), SO42−, NH4+, NO3, and Cl in the accumulation mode category, UID, BC, OA, SO42−, NH4+, NO3, and Cl in the soot aggregate category, and BC, OA, SO42−, and NH4+ in the coarse mode category. PM10 in NHM-RAQM2 includes PM2.5, UID, mineral dust (DU), sea salt (SS), and Cl in the coarse mode category. UID in the coarse mode is defined as primary PM10 emission and DU, with SS and Cl assumed to have originated from sea-salt particles. These natural components of larger sizes (relative to PM2.5) were also considered.
PM2.5 mass concentrations: Figure 2 shows the spatial distributions of monthly average PM2.5 mass concentrations for each of four representative months: January, April, July, and October. The three models simulated peak PM2.5 concentrations over northeast, southwest, and central China that reached approximately ~100 μg/m3, with the highest peaks in January. Lower peaks were simulated at approximately 30 μg/m3 in Korea, and at approximately 15 μg/m3 in Japan. Over Northeast Asia, two relatively higher areas were observed—a larger area covering eastern China from Beijing to Shanghai, and a smaller area comprising Chongqing and its surroundings in southwestern China, and these areas tended to have the highest SO2 and NOx concentrations in Mainland China (Supplementary Figures S5 and S6). The spatial distribution patterns in July (Figure 2) appear to reflect two complicated factors: lower emissions and scavenging effects [9,10], which outweigh the effects of secondary photochemical PM generation during summer. For these reasons, the distributions of PM10 also exhibited the same seasonality as those for SO2 and NOx, with high values in winter and low values in summer. One important difference among the three models was found over southern Russia, where PM2.5 with broad features and extremely high levels are simulated by NHM-RAQM2. As only NHM-RAQM2 considered emissions from biomass burning, biomass usage causes distinctive PM2.5 variations among models in 2013, driven by primary OC emission due to biomass burning over southern Russia.
SO42− inorganic component: The spatial distributions of SO42− concentrations are shown in the four representative months. High SO42− levels were simulated in northern China, with maximum of 42.6 μg/m3 (by WRF-CAMx), 48.1 μg/m3 (by NHM-RAQM2), and 38.3 μg/m3 (by WRF-CMAQ) in July. Compared with the strong seasonality exhibited by gaseous SO2 concentrations (Supplementary Figure S5), those of SO42− exhibited no particular seasonal pattern. This lower variation was ascribed to the offset between two factors in summer—scavenging effects and secondary inorganic aerosol (SIA) formation through the conversion of SO2 to SO42− due to strong photochemical reactions.
Our calculations indicated that the simulated conversion ratio of sulfur (FS = [SO42−]/([SO2] + [SO42−])) ranged from 0.37~0.39 at seven exit-and-entrance sites, well compared with 0.3 to 0.5 calculated for the year 2002 [10] over the entire LTP domain. Among the three models tested here, NHM-RAQM2 simulated relatively high FS values (0.39 ± 0.24) compared with those from WRF-CAMx (0.37 ± 0.24) and WRF-CMAQ (0.37 ± 0.26), yielding relatively high SO42− levels in July (Figure 3).
NO3 inorganic component: Figure 4 shows the spatial distributions of NO3 concentrations. The results for NO3 indicated higher inter-model biases than SO42−, the causes of which were less clear than those of the SO42− component, but these were likely due to uncertainties in either emission estimates or inherent SIA module limitations. Among the three models, WRF-CAMx produced the most severe underestimation, except during winter. NHM-RAQM2 simulated small seasonal variations, with consistent peaks in some areas and nearly uniform maximum NO3 levels greater than 20 μg/m3 in all seasons.
In the present study, the fractional contributions of NO3 to PM2.5 mass concentration were approximately 30%. This fraction is comparable to that of SO42− but much greater than those of OC and EC. We did not investigate total reactive nitrogen (NOy), that is defined as the sum of NOx and its oxidized products (HNO3 + NO3, peroxyacyl nitrate, and others), but here, we conventionally calculated FN (= [NO3]/([NO2] + NO3])) in the same manner as for FS. The results showed that the FN range calculated at seven exit-and-entrance sites was 0.27 ± 0.21. However, larger inter-model variability was found at seven sites. Simulated Fn by NHM-RAQM2 (0.46 ± 0.22) was higher than those shown by either WRF-CAMx (Fn = 0.12 ± 0.08) or WRF-CAMAQ (Fn = 0.22 ± 0.16) by a factor of more than 2. This implies that higher transboundary NO3 concentrations than those by WRF-CAMx and WRF-CMAQ was predicted due to the most extensive oxidization from NO2 to NO3 by NHM-RAQM2 (Figure 4 and Supplementary Figure S5) especially in April and July, at atmospheric levels of NH4+ (Supplementary Figure S7). This finding also indicates that inherent potential model uncertainties in secondary ammonium nitrate formation remain limited and unexplored, resulting in the high inter-model variability and, as a result, affecting prediction performance in the NO2 to NO3 conversion process over Northeast Asia.
Uncertainty in simulating the gas-to-aerosol conversion process is related to the thermodynamic equilibrium module and inorganic aerosol formation mechanisms involving interactions between SO42−, NO3, and NH4+ species. In the present study, SIA (SO42−–NO3–NH4+) is the main contributor to PM2.5 mass concentrations; therefore, potential uncertainty caused by employing different SIA formation modules (ISOROPIA, MADMS, and AERO5, as indicated in Table 1) cannot be excluded.
Organic Carbon (OC) component: Figure 5 shows the spatial distributions of OC simulated by the three models. Secondary organic aerosol (SOA) formation occurs actively in summer, when environmental conditions are favorable, namely high temperature and radiation [24,25]. Our simulations revealed unexpected seasonal variations with the opposite pattern—lower in summer and higher in winter [26,27]. This pattern is driven by both meteorological factors and higher emissions of primary organic aerosols in winter. Our simulations generally predicted levels below 10 μg/m3, but discrepancies among the three models were large.
The greatest difference occurs over southern Russia in July in the NHM-RAQM2 model, as indicated in Figure 5. As described above, this discrepancy is due to biomass burning emissions, which are considered only in NHM-RAQM2, leading to the most striking difference among the three models. Among the three models, WRF-CAMx predicted considerably lower OC concentrations with no particular monthly variation. Under the big seasonality, the highest concentration of OC simulated in winter over both central and northern China in this study is of interest, as OC levels in some areas exceeded 40 μg/m3. WRF-CMAQ simulated a maximum concentration of 43.2 μg/m3 in January over an area near northern Shanghai in China; meanwhile, the maxima predicted with NHM-RAQM2 and WRF-CAMx were 31.3 and 20.9 μg/m3, respectively (Figure 5).
Generally, SOA model predictions have been underestimates in numerous previous studies [28,29,30,31,32]. This underestimation occurs due to uncertainty in estimating VOC volatility, which is related to the complex SOA generation mechanisms used for SOA simulation. Hence, the results of secondary OC formation simulations differ greatly according to the treatment of VOC volatility [31,33]. The underlying drivers of inter-model biases thus originate from the complexity of the SOA formation process, and the use of three different SOA formation modules in our study, as indicated in Table 1, might have directly caused the inter-model variability in OC distribution simulations (Figure 5).
Elemental Carbon (EC) component: The simulated EC distribution patterns (Figure 6) appear similar to those of OC, except that monthly average levels were generally lower than 7 μg/m3 over the entire Northeast Asia domain. EC originates mainly from incomplete combustion in Asia [34], including combustion of both fossil fuels and biofuels. Our simulations of EC concentrations were higher (but less than 1) in winter (0.83 (± 0.67)~3.33 (± 2.28 μg/m3), respectively) and much lower in summer (0.34 (± 0.18)~2.30 (± 1.15) μg/m3, respectively), as illustrated in Figure 6. Inter-model bias remains apparent, related to complicated uncertainties; nevertheless, we believe that our EC results are worthwhile as a reference for estimating the monthly mean levels and spatial patterns over Northeast Asia, as no observational EC distributions are available that cover this domain at the regional or sub-regional scale.

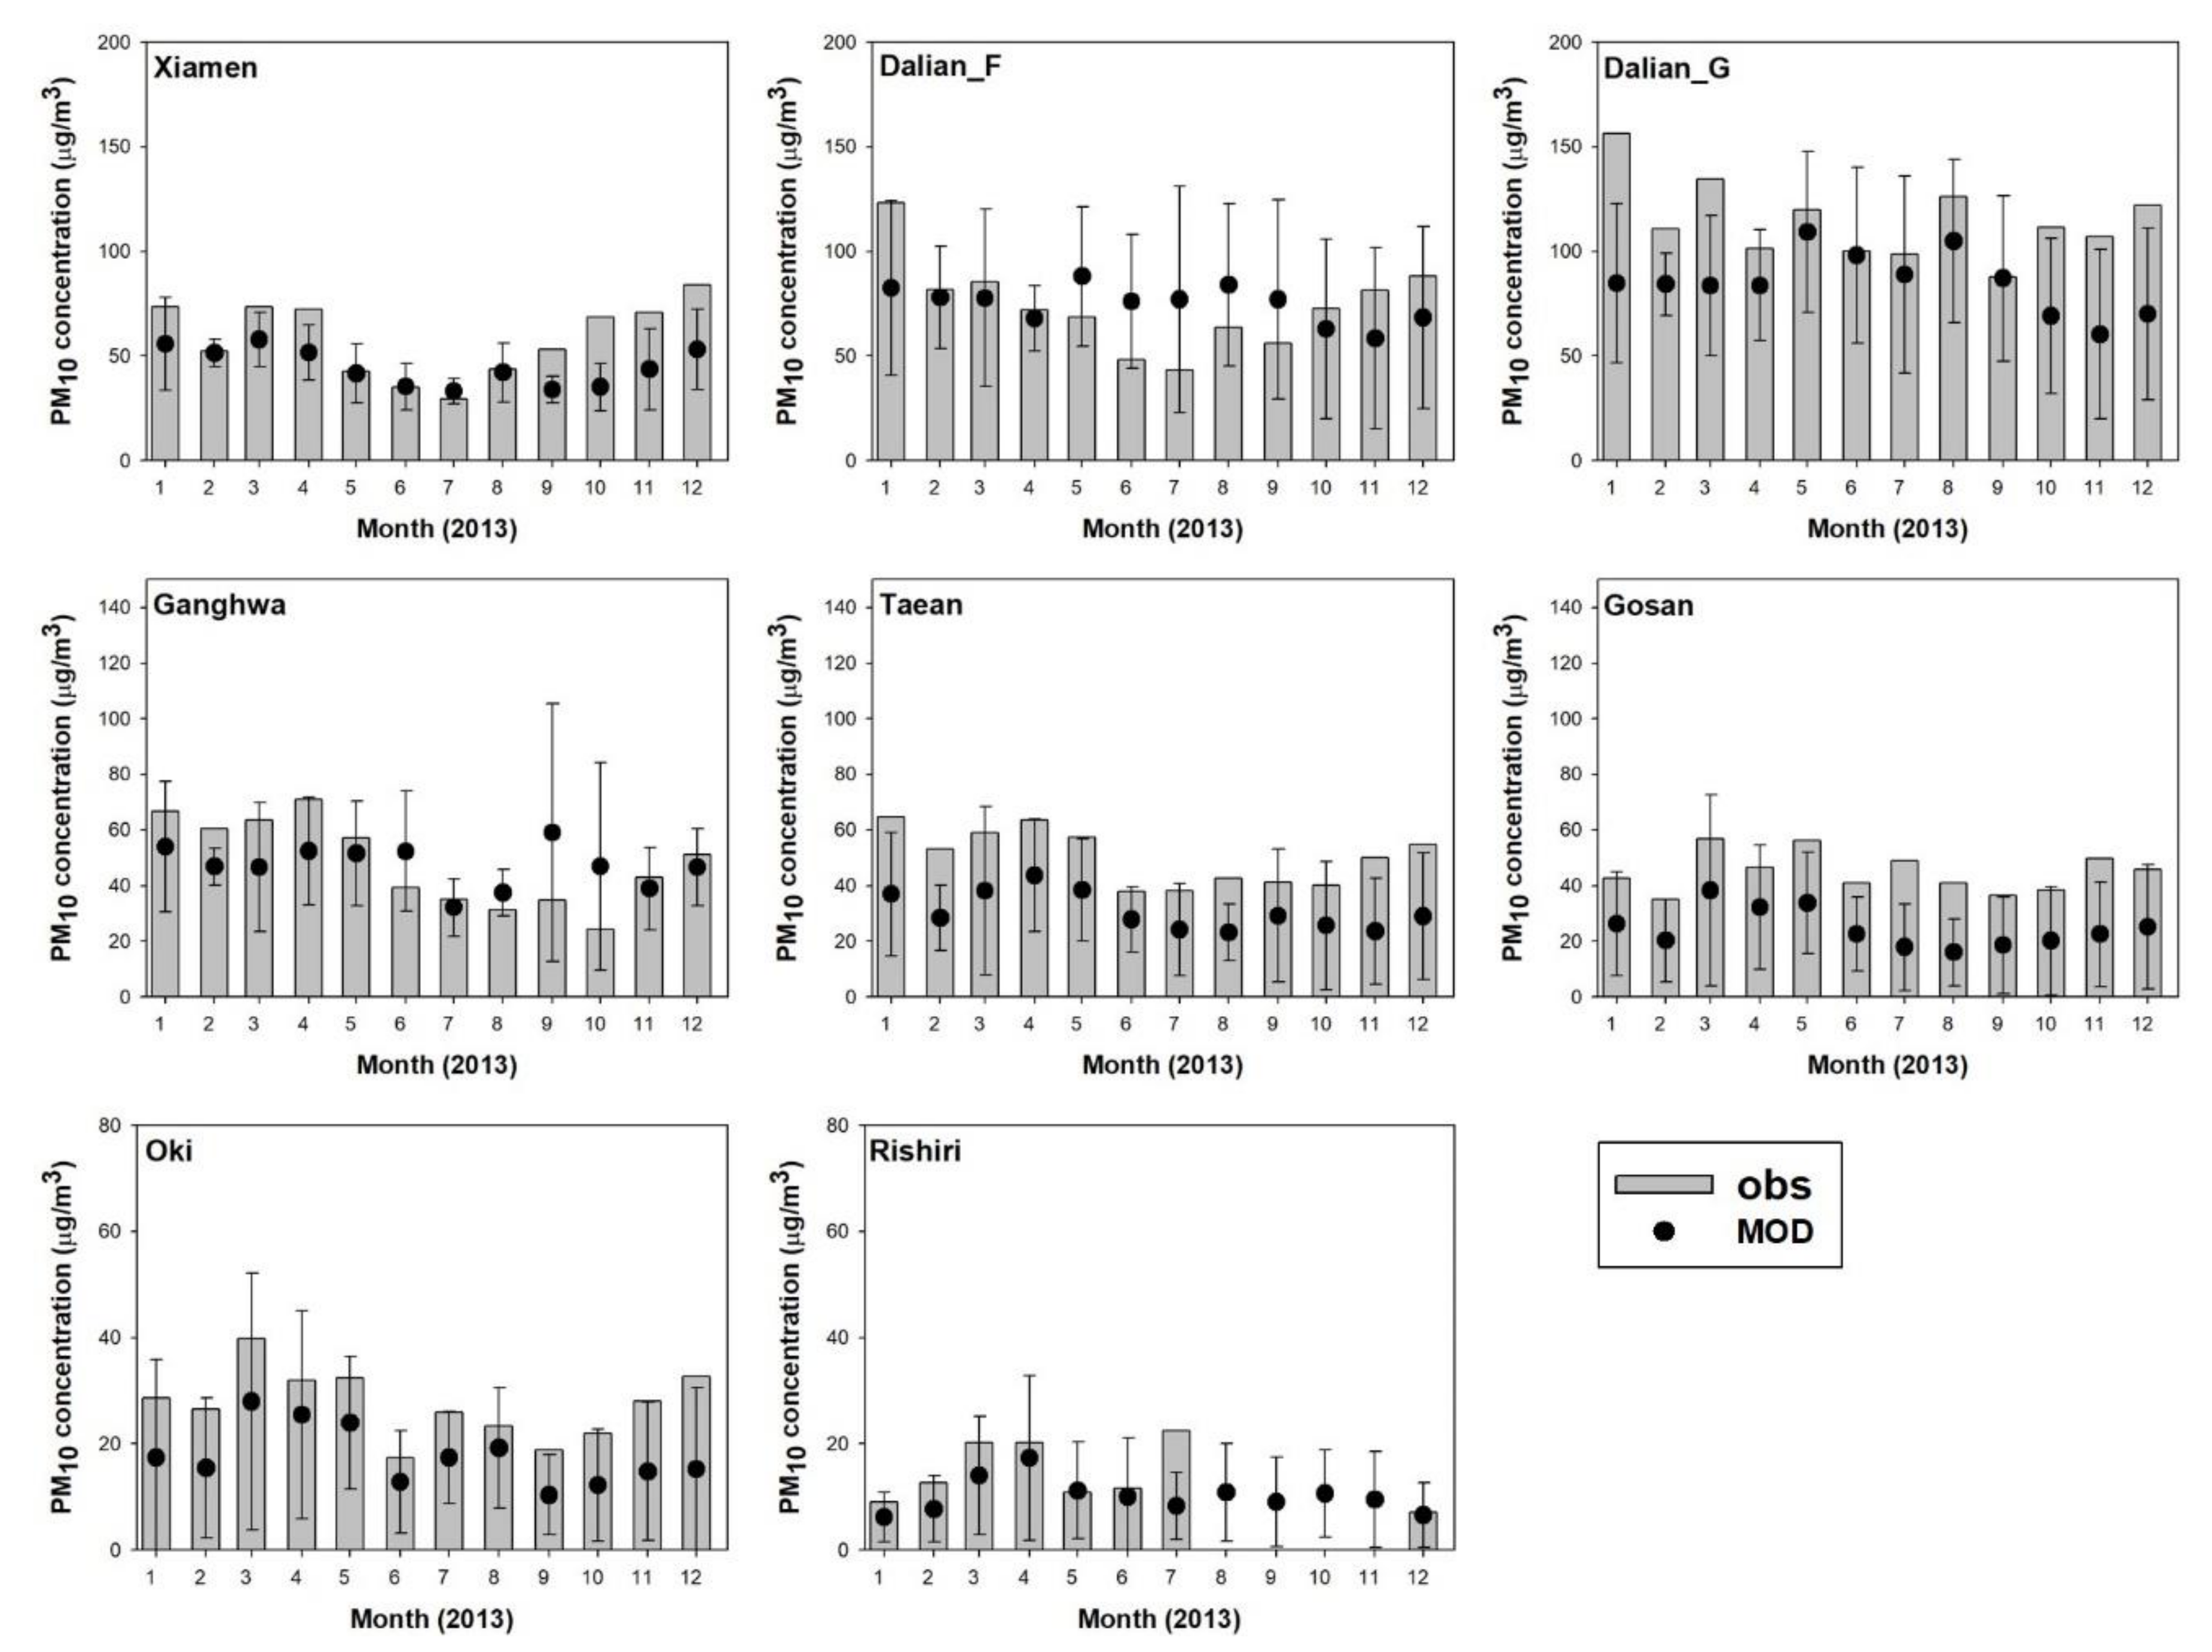
3.3. Model Validation against Observations over Exit-and-Entrance Areas

Supplementary Tables S3 and S4 summarize the statistical accuracy scores of simulated SO2 and NO2 concentrations relative to measurements taken at seven remote exit-and-entrance sites (Figure 1). The statistical parameters employed here are root mean square error (RMSE), normalized mean bias (NMB), normalized mean error (NME), fractional bias (FB), and fractional error (FE). In Supplementary Tables S3 and S4, similar NMB in both SO2 and NO2 were found at seven sites with the SO2 NMB of 0.9 ± 0.6 and NO2 NMB of 0.7 ± 0.4. This finding indicates that potential uncertainties in secondary ammonium sulfate and nitrate formation both remain unexplored, affecting predictions of the inorganic aerosol conversion process over Northeast Asia.
Table 2 summarizes the statistical accuracy scores of simulated PM10 concentrations over the exit-and-entrance sites. Note that, due to the lack of site-specific PM2.5 observations for 2013 in the current study, PM10 observations were used instead. At all sites, the three simulations produced differing ranges with a variety of similarities and differences. The statistical parameters of the simulated PM10 levels were NME of 0.44 ± 0.20, RMSE of 21.5 ± 12.7 ug/m3, and FE of 0.02 ± 0.01 respectively, at seven remote exit-and-entrance sites. However, with few exceptions of NHM-RAQM2, the simulations exhibited consistent tendencies toward underestimation at all exit-and-entrance sites with the negative NMB and FB values, demonstrating that simulation accuracy could be improved. In Japan, both FB and FE estimates indicated higher levels of error than in the other two countries, and both modeled and observed values were extremely low.
Figure 7 shows simulated and observed monthly variations in PM10 concentrations at the seven exit-and-entrance sites. All three models underestimated PM10 at most of the seven sites. The largest discrepancies were found in May–September at Dalian, where the model grid was located close to a large urban area. Ganghwa in September–October was associated with the second largest discrepancy in this study (Figure 7). The overall discrepancies between the simulations and measurements were estimated as being approximately 2.5 or less.
The time series of the simulated and observed PM10 at the seven sites are shown in Supplementary Figure S8. The time series from the three models exhibited strong seasonal variations, and were reasonably comparable with observations at Dalian, Xiamen, and Ganghwa; however, at most sites, the modeled values were considerably lower than the observed values. Supplementary Figure S9 shows scatter plot comparisons with measurements from all three models. The results indicate a linear relationship with slope of 0.3–1.0 and R2 of 0.26–0.50, and simulations for each of the seven sites tended to be underestimates relative to observations, possibly due to missing source errors associated with natural sources. During the LTP meeting, it was noted that the largest missing source was expected to be soil dust, which was not considered in the current LTP study.

4. Discussion on PM2.5 Characteristics over Exit-and-Entrance Areas

Figure 8 shows the NO3/SO42− and OC/EC ratios for the four months over the model domain. In Figure 8a–d, significantly strong monthly variations in NO3/SO42− ratios of up to ~4.5 were simulated over most areas of Northeast Asia, including northern and southern China, and Seoul in Korea, but not Japan. The NO3/SO42− ratios are expected to have increased in China since 2013 due to significant SO2 emission reduction strategies implemented in China starting in 2013 [35]; therefore, knowledge of recent changes in Chinese primary emissions is a prerequisite to further assessing possible air pollution control strategies in the region.
The spatial distributions of the OC/EC ratios are shown in Figure 8e–h. Generally, OC and EC exhibit large and unique spatial and temporal variations (e.g., Figure 5 and Figure 6). By contrast, consistent patterns in the OC/EC ratio are more easily found, partly because the ratio of these two chemicals tends to be less sensitive to atmospheric processes than their individual levels [36,37]. OC/EC ratios are generally lower in winter and higher in spring and summer. Monitoring studies have shown that the highest summer peak of ~10 occurs over the Northern Plains of China [38,39], relative to the mid- and north-eastern regions of China, whereas the lowest seasonal variation in the OC/EC ratio is found in the mid-western region.
Our simulations of OC/EC revealed opposite seasonal variations, with high values in winter and low in summer, due to the OC simulations shown in Figure 5. Domain-averaged OC/EC ratios over China–Korea–Japan were higher in winter (4.34 ± 0.12) and much lower in summer (0.74 ± 0.18), with a maximum of 4.6 in January (Figure 8e). In addition, a strong correlation between OC and O3 has been reported [40] and the temperature and solar radiation during summer are expected to increase SOA fractions to at least 59% ± 11% of total carbon aerosols in some places [41]. However, our study showed that there was a weak correlation between EC and OC in summer over the three countries in the LTP domain (R2 = 0.31, averaged from the three models in the current study), suggesting additional sources in our model domain combined with transport during other seasons. This weak association is also linked to uncertainties in organic simulations, including both primary and secondary aerosol formation processes. Nevertheless, over the entire year-long period, distinctively higher OC/EC ratios were found over northern provinces characterized by agriculture, as well as the entire North Korean territory.
In early 2013, emission mitigation actions were implemented by the Chinese government to fight air pollution over the major cities of China. In the following years, China achieved dramatic improvements in air quality, especially over high-emission areas [42,43,44,45,46]. Accordingly, numerous air quality monitoring reports have been released in the following years. Satellite observations, such as Ozone Monitoring Instrument NO2 and SO2 values, revealed marked decreases in signals, especially over the Central and East China regions, and AERONET aerosol optical depth (AOD) data revealed a trend of decreasing particulate air pollutant levels over Beijing [47,48]. Emission estimation studies have approximated the SO2 and NOx emission decreases to be 10–14% per year in China, and a clear decrease in AOD can be observed over downwind regions.
Based on recent in-situ PM2.5 measurements, a notable pattern of decreasing SO42− and increasing NO3 is present in China, especially during severe haze episodes [49,50,51,52], whereas extremely high NO3 contributions have been frequently observed in source regions and downwind areas [49,53,54]. We aimed to explore the characteristics of PM2.5 over exit-and-entrance areas. As no compound-specific observations were available for PM2.5 in 2013, we only employed WRF-CMAQ simulations.
Figure 9a shows the simulated NO3 and SO42− levels and their ratios over the seven remote sites. Dalian, an exit area in northern China, exhibited higher values (e.g., SO42− = 7.8 μg/m3 in January), with a NO3/SO42− ratio of 1.8, indicating that NO3 was higher than SO42− in 2013. However, over the Korean entrance sites (e.g., Ganghwa and Taean), tendencies of increasing NO3 and decreasing SO42− were observed with relatively high NO3/SO42− ratios of 5.5–6.0 in January. This pattern of higher NO3 over entrance areas indicates that air pollutants from the exit area in northern China are affected by atmospheric NH3 during or after the LRT process, and that the re-establishment of gas-aerosol partitioning with semi-volatile species of ammonium nitrate can occur prior to the arrival of particulate ammonium nitrate over Korean entrance areas. On the other hand, Xiamen, an exit area in southern China, had approximately two-fold higher levels of SO42− than for NO3 (e.g., in April) (Figure 9a). Over Japan, on the other hand, NO3 and SO42− concentrations were extremely low, with values of less than 1 μg/m3.
OC and EC generally exhibited a consistent pattern, with OC/EC ratios of approximately 3:1 at most remote sites (Figure 9b). This OC/EC ratio, with a mean slope of more than 3, was higher than those reported in previous studies (e.g., OC/EC = 4–5 in Reference [39]), due to the fact that the underestimation of OC was less pronounced than that of EC.
We also attempted to interpret the combined effect of the percentages of SO42− and NO3 associated with SIA formation over exit-and-entrance areas. Figure 9c shows the neutralization parameter, fN (= [NH4+]/(2[SO42−] + [NO3])), employed here for convenience [32,35,55]. Here, fN = 1 indicates an (NH4)2SO4 sulfate aerosol (solid or aqueous), whereas fN = 0.5 indicates a bulk NH4HSO4 sulfate aerosol [32,55]. Observations with fN > 0.9 indicate that SO42− was neutralized, whereas values of fN > 1 (excess aerosol NH4+) cannot be reconciled based on SO42−–NO3–NH4+ aerosol thermodynamics, except for the neutralization of organic acids with NH3 [56,57]. Our results showed that, whereas lower slopes of fN were simulated over Rishiri and Oki, the slopes of fN over the Chinese and Korean exit-and-entrance areas were generally ≥1. This result indicates that the environment is favorable for SIA formation under NH3-sufficient conditions. This finding is also apparent in Figure 9d, where the ratios of ([NO3]/[SO42−])/([NH4+]/[SO42−]) over most exit-and-entrance sites are >10, indicating an “NH3-rich” regime, as described by Pathak et al. [58]. This finding suggests that over remote areas, especially between China and Korea, the chemical conditions are favorable for SIA formation throughout Northeast Asia, with the exclusions of Rishiri and Oki in some months.
Finally, Figure 9e shows the relationship ([NH3] + [NO3]) vs. ([HNO3] + [NO3]), which indicates the “adjusted” gas ratio (AGR) of free NH3 to total NO3 [54]. This measure is another indicator of the sensitivity of the NO3 aerosol to changes in three types of emissions: NH3, SO2, and NOx [59,60,61]. Here, AGR < 1 indicates an “NH3-poor” regime, in which NO3 can be increased by replacing the decreased SO42−, and AGR > 1 (“NH3-rich” regime) indicates that NO3 is sensitive to changes in total NO3 (= [HNO3] + [NO3]). In our study, as shown in Figure 9e, the exit areas of eastern China, such as Xiamen and Dalian, had high AGR values of 1 or more (especially in April), confirming the “NH3-rich” condition of these areas. However, over the entrance area in Japan, the AGR indicates NH4+-poor conditions that make it impossible to establish a SIA-formation environment. This result suggests that gas-aerosol partitioning is likely to be established over Chinese exit areas affected by the observed levels of atmospheric NH3. According to the results at the entrance area, the re-establishment of gas-aerosol partitioning is also likely to occur during the LRT process in the marine atmosphere between the exit and entrance areas. This partitioning can occur because the geographical locations of the Korean entrance areas are more than 500 km away from the Chinese exit areas, providing plentiful transit time to support the re-establishment of gas-aerosol partitioning.
Our findings in this study were inferred solely from modeling studies. Thus, our interpretation was affected by considerable uncertainties. In addition, further modeling sensitivity studies (with constraints on the thermodynamic modeling of aerosol composition) on the extent to which secondary aerosol formation is sensitive to NH3 and HNO3 levels are needed to help establish PM2.5 reduction strategies for the inflow and outflow regions of LRT pathways over China, Japan, and Korea.

5. Summary and Conclusions

The transboundary transport of PM in Northeast Asia has become a serious concern in recent years. Air pollutants emitted from upstream source areas can travel long distances to downstream regions, and therefore, the monitoring and characterization of such transboundary transport in exit-and-entrance areas over China, Japan, and Korea are of great importance. For this purpose, a cooperative project, namely the LTP project, has been conducted over a long time period by the governments of China, Korea, and Japan.
In this paper, we reported the results of long-term PM2.5 simulations covering an entire year, 2013, as agreed upon for the LTP project. Modeling groups from China, Japan, and Korea each employed their own modeling systems with conventional modeling options for the simulation of PM2.5 and associated species over the exit-and-entrance areas for LRT in Northeast Asia. The models employed by three countries are WRF-CAMx (by China), NHM-RAQM2 (by Japan), and WRF-CMAQ (by Korea), and their uncertainties in PM2.5 characterization were explored through comparison with surface measurements taken in 2013.
The results showed that some biases remain unexplored with the NME of 0.44 ± 0.20 due to potential uncertainties in anthropogenic emission strengths and inherent model limitations. The general trends relative to observations over remote exit-and-entrance areas were the underestimation of PM10 monthly levels by a factor of 1.5–2.1. Among all tested models, PM2.5 concentrations exhibited similar seasonality, and the main difference was found in OC component among four chemical components of PM2.5, especially in winter, and the second biggest discrepancy was in NO3 component for all of the three models.
Our analysis of several characteristics suggested a favorable environment for secondary inorganic NO3 formation over exit-and-entrance areas between China and Korea, with high NH3 gas concentrations. For the Japanese entrance areas, we were unable to fully explore the SIA characteristics due to the significantly low simulation values.
The characteristics of PM2.5 in 2013 analyzed in the current study are also expected to be important reference PM2.5 concentrations for further determining the impacts of Chinese emission mitigation policies on the improvement of air quality throughout Northeast Asia. The continuation of measurements of PM2.5 to quantitatively identify the influences of changes in emissions is expected, and the present study may provide foundational information on the characteristics of long-term PM2.5 modeling over Northeast Asia and the variability among model results.
In a future study, we plan to conduct further sensitivity analysis of NH3 or HNO3 reductions (achieved through NOx control) to provide direction for efficient emission reduction strategies in Northeast Asia. The improvement of models for the robust estimation of SRRs will continue in the LTP modeling and monitoring research groups.

Supplementary Materials

The following are available online at https://www.mdpi.com/article/10.3390/atmos12040469/s1, Table S1: Characteristics of seven monitoring sites located in China, Japan, and Korea, Table S2: Total anthropogenic emissions (Tg/yr) from CREATE-2013 for China, Japan, and Korea over the model domain, Table S3: Statistical summary for SO2 at seven monitoring sites in three countries, Table S4: Statistical summary for NO2 at seven monitoring sites in three countries, Figure S1: Spatial distributions of CREATE-2013 emissions of selected species in the base year of 2013 (ton/yr/grid), Figure S2: Spatial distributions of monthly average temperature (°C) for January, April, July, and October 2013. The three air quality models are WRF-CAMx, NHM-RAQM2, and WRF-CMAQ, employed by China, Japan, and Korea, respectively, Figure S3: As in Figure S2, but for wind field (m/s), Figure S4: Scatter diagrams of modeled and observed temperatures at 2 m and wind speed at 10 m for the base year of 2013, Figure S5: Spatial distributions of monthly average SO2 concentration (ppb) in January, April, July, and October 2013. Three air quality models?WRF-CAMx, NHM-RAQM2, and WRF-CMAQ, were employed by China, Japan, and Korea, respectively, Figure S6: As in Figure S5, but for NO2 concentration (ppb), Figure S7: As in Figure S5, but for NH4+ concentration (µg/m3), Figure S8: Time series of simulated (red lines) and observed (black dots) daily mean PM10 concentrations at seven monitoring sites. Three air quality models?WRF-CAMx, NHM-RAQM2, and WRF-CMAQ, were employed by China, Japan, and Korea, respectively, Figure S9: Scatter plots of daily mean modeled versus observed PM10 in exit-and-entrance areas associated with transboundary transport over China, Japan, and Korea.

Author Contributions

Conceptualization, C.-H.K., F.M., and J.L.; Methodology, M.K., W.T., J.-J.L., and Y.K.; Data curation, J.-H.W., K.S., T.K., and H.M.; Formal analysis, J.K., K.-B.L., S.R., H.-Y.J., and Y.-J.J.; Investigation, C.-H.K., and J.L.; Visualization, J.-J.L., H.-Y.J., and Y.-J.J.; Writing—Original draft, C.-H.K.; Writing—Review and editing, F.M., and J.L. All authors have read and agreed to the published version of the manuscript.

Funding

This work was supported by a grant from the National Institute of Environment Research (NIER), funded by the Ministry of Environment (MOE) of the Republic of Korea (Grant No. NIER-2018-01-02-037), and also by the Research Foundation of Korea (NRF) of the Ministry of Education of the Republic of Korea (Grant No. 2020R1A6A1A03044834).

Institutional Review Board Statement

Not applicable.

Informed Consent Statement

Not applicable.

Data Availability Statement

Data are available upon request.

Acknowledgments

The authors acknowledge all of modeling sub-working group members not listed as co-authors in this paper but who participated in the 21st LTP expert meeting in 2018 organized by Korea, China, and Japan for LTP discussions. Also, the authors thank the researchers from NIER (National Institute of Environmental Research, South Korea), CRAES (Chinese Research Academy of Environmental Sciences, China), and ACAP (Asia Center for Air Pollution Research, Japan) for both carrying out the models and providing the measurement for model verification. Special thanks are given to anonymous reviewers for their helpful comments.

Conflicts of Interest

The authors declare no conflict of interest.

References

  1. Chiashi, A.; Lee, S.; Pollitt, H.; Chewpreecha, U.; Vercoulen, P.; He, Y.; Xu, B. Transboundary PM Air Pollution and Its Impact on Health in East Asia. In Energy, Environmental and Economic Sustainability in East Asia: Policies and Institutional Reforms; Lee, S., Pollitt, H., Fujikawa, K., Eds.; Routledge: London, UK, 2019. [Google Scholar]
  2. Kim, C.-H.; Park, S.-Y.; Kim, Y.-J.; Chang, L.-S.; Song, S.-K.; Moon, Y.-S.; Song, C.-K. A Numerical Study on Indicators of Long-range Transport Potential for Anthropogenic Particle Matter over Northeast Asia. Atmos. Environ. 2012, 58, 35–44. [Google Scholar] [CrossRef]
  3. Latza, U.; Gerdes, S.; Baur, X. Effects of Nitrogen Dioxide on Human Health: Systematic Review of Experimental and Epidemiological Studies Conducted between 2002 and 2006. Int. J. Hyg Environ. Health 2009, 212, 271–287. [Google Scholar] [CrossRef] [PubMed]
  4. Sunyer, J.; Basagana, X.; Belmonte, J.; Anto, J.M. Effect of Nitrogen Dioxide and Ozone on the Risk of Dying in Patients with Severe Asthma. Thorax Int. J. Respir. Med. 2002, 57, 687–693. [Google Scholar] [CrossRef] [PubMed] [Green Version]
  5. Vedal, S.; Brauer, M.; White, R.; Petkau, J. Air Pollution and Daily Mortality in a City with Low Levels of Pollution. Environ. Health Perspect. 2003, 111, 45–52. [Google Scholar] [CrossRef] [Green Version]
  6. Li, Z.; Chen, H.; Cribb, M.; Dickerson, R.; Holben, B.; Li, C.; Lu, D.; Luo, Y.; Maring, H.; Shi, G.; et al. Preface to Special Section on East Asian Studies of Tropospheric Aerosols: An International Regional Experiment (EASTAIRE). J. Geophys. Res. Atmos. 2007, 112, D22S00. [Google Scholar] [CrossRef] [Green Version]
  7. Lee, H.-J.; Jo, H.-Y.; Park, S.-Y.; Jo, Y.-J.; Jeon, W.; Ahn, J.-Y.; Kim, C.-H. A Case Study of the Transport/Transformation of Air Pollutants over the Yellow Sea during the MAPS 2015 Campaign. J. Geophys. Res. Atmos. 2019, 124, 6532–6553. [Google Scholar] [CrossRef]
  8. Choi, K.-C.; Lee, J.-J.; Bae, C.-H.; Kim, C.-H.; Chang, L.-S.; Ban, S.-J.; Lee, S.-J.; Kim, J.; Woo, J.-H. Assessment of Transboundary Ozone Contribution toward South Korea Using Multiple Source-receptor Modeling Technique. Atmos. Environ. 2014, 92, 118–129. [Google Scholar] [CrossRef]
  9. Kim, C.-H.; Chang, L.-S.; Kim, J.-S.; Meng, F.; Kajino, M.; Ueda, H.; Zhang, Y.; Son, H.-Y.; He, Y.; Xu, J.; et al. Long-term Simulations of the Sulfur Concentrations over the China, Japan and Korea: A Model Comparison Study. Asia Pac. J. Atmos. Sci. 2011, 47, 399–411. [Google Scholar] [CrossRef]
  10. Kim, C.-H.; Chang, L.-S.; Meng, F.; Kajino, M.; Ueda, H.; Zhang, Y.; Son, H.-Y.; Lee, J.-J.; He, Y.; Xu, J.; et al. Sulfur Deposition Simulations over China, Japan and Korea: A Model Intercomparison Study for Abating Sulfur Emission. Environ. Sci. Pollut. Res. 2012, 19, 4073–4089. [Google Scholar] [CrossRef]
  11. Park, I.-S.; Choi, W.-J.; Lee, T.-Y.; Lee, S.-J.; Han, J.-S.; Kim, C.-H. Simulation of long-range transport of air pollutants over Northeast Asia using a comprehensive acid deposition model. Atmos. Environ. 2005, 39, 4075–4085. [Google Scholar] [CrossRef]
  12. Jin, Y.; Andersson, H.; Zhang, S. Air Pollution Control Policies in China: A Retrospective and Prospects. Int. J. Environ. Res. Public Health 2016, 13, 1219. [Google Scholar] [CrossRef] [Green Version]
  13. Zhang, L.; Brook, J.R.; Vet, R. A revised parameterization for gaseous dry deposition in air-quality models. Atmos. Chem. Phys. 2003, 3, 2067–2082. [Google Scholar] [CrossRef] [Green Version]
  14. An, J.; Ueda, H.; Wang, Z.; Matsuda, K.; Kajino, M.; Cheng, X. Simulations of Monthly Mean Nitrate Concentrations in Precipitation over East Asia. Atmos. Environ. 2002, 36, 4159–4171. [Google Scholar] [CrossRef]
  15. Byun, D.W.; Ching, J.K.S. Science Algorithms of the EPA Models-3 Community Multiscale Air Quality (CMAQ) Modeling System; EPA Report; EPA/600/R-99/030; EPA: Washington, DC, USA, 1999. [Google Scholar]
  16. ENVIRON. CAMx User’s Guide Version 6.2; Environ International Corporation: Novato, CA, USA, 2015. [Google Scholar]
  17. Han, Z.; Ueda, H.; Sakurai, T. Model Study on Acidifying Wet Deposition in East Asia during Wintertime. Atmos. Environ. 2006, 40, 2360–2373. [Google Scholar] [CrossRef]
  18. Kajino, M.; Inomata, Y.; Sato, K.; Ueda, H.; Han, Z.; An, J.; Katata, G.; Deushi, M.; Maki, T.; Oshima, N.; et al. Development of the RAQM2 Aerosol Chemical Transport Model and Predictions of the Northeast Asian Aerosol Mass, Size, Chemistry, and Mixing Type. Atmos. Chem. Phys. 2012, 12, 11833–11856. [Google Scholar] [CrossRef] [Green Version]
  19. Wei Wang, C.B.; Duda, M.; Dudhia, J.; Gill, D.; Kavulich, M.; Keene, K.; Chen, M.; Lin, H.; Michalakes, J.; Rizvi, S.; et al. ARW Version 3 Modeling System User’s Guide; NCAR: Boulder, CO, USA, 2016. [Google Scholar]
  20. Saito, K.; Ishida, J.; Aranami, K.; Hara, T.; Segawa, T.; Narita, M.; Honda, Y. Nonhydrostatic Atmospheric Models and Operational Development at JMA. J. Meteorol. Soc. Jpn. 2007, 85B, 271–304. [Google Scholar] [CrossRef] [Green Version]
  21. Kim, C.-H.; Lee, H.-J.; Kang, J.-E.; Jo, H.-Y.; Park, S.-Y.; Jo, Y.-J.; Lee, J.-J.; Yang, G.-H.; Park, T.; Lee, T. Meteorological Overview and Signatures of Long-range Transport Processes during the MAPS-Seoul 2015 Campaign. Aerosol Air Qual. Res. 2018, 18, 2173–2184. [Google Scholar] [CrossRef] [Green Version]
  22. Kurokawa, J.; Ohara, T.; Morikawa, T.; Hanayama, S.; Janssens Maenhout, G.; Fukui, T.; Kawashima, K.; Akimoto, H. Emissions of Air Pollutants and Greenhouse Gases over Asian Regions during 2000–2008: Regional Emission Inventory in Asia (REAS) Version 2. Atmos. Chem. Phys. 2013, 13, 11019–11058. [Google Scholar] [CrossRef] [Green Version]
  23. Giglio, L.; Randerson, J.T.; van der Werf, G.R.; Kasibhatla, P.S.; Collatz, G.J.; Morton, D.C.; DeFries, R.S. Assessing Variability and Long-term Trends in Burned Area by Merging Multiple Satellite Fire Products. Biogeosciences 2010, 7, 1171–1186. [Google Scholar] [CrossRef] [Green Version]
  24. Volkamer, R.; Jimenez, J.L.; Martini, F.S.; Dzepina, K.; Zhang, Q.; Salcedo, D.; Molina, L.T.; Worsnop, D.R.; Molina, M.J. Secondary Organic Aerosol Formation from Anthropogenic Air Pollution: Rapid and Higher Than Expected. Geophys. Res. Lett. 2006, 33, L17811. [Google Scholar] [CrossRef] [Green Version]
  25. Yang, G.-H.; Jo, Y.-J.; Lee, H.-J.; Song, C.-K.; Kim, C.-H. Numerical Sensitivity Tests of Volatile Organic Compounds Emission to PM2.5 Formation during Heat Wave Period in 2018 in Two Southeast Korean Cities. Atmosphere 2020, 11, 331. [Google Scholar] [CrossRef] [Green Version]
  26. Li, B.; Zhang, J.; Zhao, Y.; Yuan, S.; Zhao, Q.; Shen, G.; Wu, H. Seasonal Variation of Urban Carbonaceous Aerosols in a Typical City Nanjing in Yangtze River Delta, China. Atmos. Environ. 2015, 106, 223–231. [Google Scholar] [CrossRef]
  27. Zhou, J.; Xiong, Y.; Xing, Z.; Deng, J.; Du, K. Characterizing and Sourcing Ambient PM2.5 over Key Emission Regions in China II: Organic Molecular Markers and CMB Modeling. Atmos. Environ. 2017, 163, 57–64. [Google Scholar] [CrossRef]
  28. Bhave, P.V.; Pouliot, G.A.; Zheng, M. Diagnostic Model Evaluation for Carbonaceous PM2.5 Using Organic Markers Measured in the Southeastern U.S. Environ. Sci. Technol. 2007, 41, 1577–1583. [Google Scholar] [CrossRef]
  29. Carlton, A.G.; Bhave, P.V.; Napelenok, S.L.; Edney, E.O.; Sarwar, G.; Pinder, R.W.; Houyoux, M. Model Representation of Secondary Organic Aerosol in CMAQv4.7. Environ. Sci. Technol. 2010, 44, 8553–8560. [Google Scholar] [CrossRef]
  30. Henze, D.K.; Seinfeld, J.H. Global Secondary Organic Aerosol from Isoprene Oxidation. Geophys. Res. Lett. 2006, 33, L09812. [Google Scholar] [CrossRef] [Green Version]
  31. Yu, S.; Bhave, P.V.; Dennis, R.L.; Mathur, R. Seasonal and Regional Variations of Primary and Secondary Organic Aerosols over the Continental United States: Semi-empirical Estimates and Model Evaluation. Environ. Sci. Technol. 2007, 41, 4690–4697. [Google Scholar] [CrossRef]
  32. Zhang, Q.; Jimenez, J.L.; Worsnop, D.R.; Canagaratna, M. A Case Study of Urban Particle Acidity and Its Influence on Secondary Organic Aerosol. Environ. Sci. Technol. 2007, 41, 3213–3219. [Google Scholar] [CrossRef]
  33. Lee, H.-J.; Jo, H.-Y.; Song, C.-H.; Jo, Y.-J.; Park, S.-Y.; Kim, C.-H. Sensitivity of Simulated PM2.5 Concentrations over Northeast Asia to Different Secondary Organic Aerosol Modules during the KORUS-AQ Campaign. Atmosphere 2020, 11, 1004. [Google Scholar] [CrossRef]
  34. Bond, T.C.; Doherty, S.J.; Fahey, D.W.; Forster, P.M.; Berntsen, T.; DeAngelo, B.J.; Flanner, M.G.; Ghan, S.; Karcher, B.; Koch, D.; et al. Bounding the Role of Black Carbon in the Climate System: A Scientific Assessment. J. Geophys. Res. 2013, 118, 5380–5552. [Google Scholar] [CrossRef]
  35. Jo, Y.-J.; Lee, H.-J.; Jo, H.-Y.; Woo, J.-H.; Kim, Y.; Lee, T.; Heo, G.; Park, S.-M.; Jung, D.; Park, J.; et al. Changes in Inorganic Aerosol Compositions over the Yellow Sea Area from Impact of Chinese Emissions Mitigation. Atmos. Res. 2020, 240, 104948. [Google Scholar] [CrossRef]
  36. McKeen, S.A.; Liu, S.C. Hydrocarbon Ratios and Photochemical History of Air Masses. Geophys. Res. Lett. 1993, 20, 2363–2366. [Google Scholar] [CrossRef]
  37. Wang, Y.; Zeng, T. On Tracer Correlations in the Troposphere: The Case of Ethane and Propane. J. Geophys. Res. 2004, 109, D24306. [Google Scholar] [CrossRef]
  38. Liu, Z.R.; Gao, W.K.; Yu, Y.C.; Hu, B.; Xin, J.Y.; Sun, Y.; Wang, L.L.; Wang, G.H.; Bi, X.H.; Zhang, G.H.; et al. Characteristics of PM2.5 Mass Concentrations and Chemical Species in Urban and Background Areas of China: Emerging Results from the CARE-China Network. Atmos. Chem. Phys. 2018, 18, 8849–8871. [Google Scholar] [CrossRef] [Green Version]
  39. Ji, D.; Gao, M.; Maenhaut, W.; He, J.; Wu, C.; Cheng, L.; Gao, W.; Sun, Y.; Sun, J.; Xin, J.; et al. The Carbonaceous Aerosol Levels Still Remain a Challenge in the Beijing-Tianjin-Hebei Region of China: Insights from Continuous High Temporal Resolution Measurements in Multiple Cities. Environ. Int. 2019, 126, 171–183. [Google Scholar] [CrossRef] [PubMed]
  40. Ye, Z.; Li, Q.; Ma, S.; Zhou, Q.; Gu, Y.; Su, Y.; Chen, Y.; Chen, H.; Wang, J.; Ge, X. Summertime Day-night Differences of PM2.5 Components (Inorganic Ions, OC, EC, WSOC, WSON, HULIS, and PAHs) in Changzhou, China. Atmosphere 2017, 8, 189. [Google Scholar] [CrossRef] [Green Version]
  41. Zhao, B.; Wang, S.; Donahue, N.M.; Jathar, S.H.; Huang, X.; Wu, W.; Hao, J.; Robinson, A.L. Quantifying the Effect of Organic Aerosol Aging and Intermediate-volatility Emissions on Regional-scale Aerosol Pollution in China. Sci. Rep. 2016, 6, 28815. [Google Scholar] [CrossRef] [PubMed] [Green Version]
  42. Krotkov, N.A.; McLinden, C.A.; Li, C.; Lamsal, L.N.; Celarier, E.A.; Marchenko, S.V.; Swartz, W.H.; Bucsela, E.J.; Joiner, J.; Duncan, B.N.; et al. Aura OMI Observations of Regional SO2 and NO2 Pollution Changes from 2005 to 2015. Atmos. Chem. Phys. 2016, 16, 4605–4629. [Google Scholar] [CrossRef] [Green Version]
  43. Liu, F.; Zhang, Q.; van der Ronald, J.; Zheng, B.; Tong, D.; Yan, L.; Zheng, Y.; He, K. Recent Reduction in NOx Emissions over China: Synthesis of Satellite Observations and Emission Inventories. Environ. Res. Lett. 2016, 11, 114002. [Google Scholar] [CrossRef] [Green Version]
  44. Zhang, J.; Reid, J.S.; Alfaro-Contreras, R.; Xian, P. Has China Been Exporting Less Particulate Air Pollution over the Past Decade? Geophys. Res. Lett. 2017, 44, 2941–2948. [Google Scholar] [CrossRef]
  45. Zhao, B.; Jiang, J.H.; Gu, Y.; Diner, D.; Worden, J.; Liou, K.N.; Su, H.; Xing, J.; Garay, M.; Huang, L. Decadal-scale Trends in Regional Aerosol Particle Properties and Their Linkage to Emission Changes. Environ. Res. Lett. 2017, 12, 054021. [Google Scholar] [CrossRef]
  46. Zheng, B.; Tong, D.; Li, M.; Liu, F.; Hong, C.; Geng, G.; Li, H.; Li, X.; Peng, L.; Qi, J.; et al. Trends in China’s Anthropogenic Emissions since 2010 as the Consequence of Clean Air Actions. Atmos. Chem. Phys. 2018, 18, 14095–14111. [Google Scholar] [CrossRef] [Green Version]
  47. Gu, X.; Bao, F.; Cheng, T.; Chen, H.; Wang, Y.; Guo, H. The Impacts of Regional Transport and Meteorological Factors on Aerosol Optical Depth over Beijing, 1980–2014. Sci. Rep. 2018, 8, 5113. [Google Scholar] [CrossRef] [Green Version]
  48. Li, J. Pollution Trends in China from 2000 to 2017: A Multi-sensor View from Space. Remote Sens. 2020, 12, 208. [Google Scholar] [CrossRef] [Green Version]
  49. Tian, M.; Wang, H.B.; Chen, Y.; Zhang, L.M.; Shi, G.M.; Liu, Y.; Yu, J.Y.; Zhai, C.Z.; Wang, J.; Yang, F.M. Highly Time-resolved Characterization of Water-soluble Inorganic Ions in PM2.5 in a Humid and Acidic Mega City in Sichuan Basin, China. Sci. Total Environ. 2017, 580, 224–234. [Google Scholar] [CrossRef]
  50. Tian, M.; Liu, Y.; Yang, F.; Zhang, L.; Peng, C.; Chen, Y.; Shi, G.; Wang, H.; Luo, B.; Jiang, C.; et al. Increasing Importance of Nitrate Formation for Heavy Aerosol Pollution in Two Megacities in Sichuan Basin, Southwest China. Environ. Pollut. 2019, 250, 898–905. [Google Scholar] [CrossRef]
  51. Wang, J.; Zhao, B.; Wang, S.; Yang, F.; Xing, J.; Morawska, L.; Ding, A.; Kulmala, M.; Kerminen, V.-M.; Kujansuu, J.; et al. Particulate Matter Pollution over China and the Effects of Control Policies. Sci. Total Environ. 2017, 584, 426–447. [Google Scholar] [CrossRef]
  52. Yang, F.; Tan, J.; Zhao, Q.; Du, Z.; He, K.; Ma, Y.; Duan, F.; Chen, G.; Zhao, Q. Characteristics of PM2.5 Speciation in Representative Megacities and Across China. Atmos. Chem. Phys. 2011, 11, 5207–5219. [Google Scholar] [CrossRef] [Green Version]
  53. Li, H.; Zhang, Q.; Zheng, B.; Chen, C.; Wu, N.; Guo, H.; Zhang, Y.; Zheng, Y.; Li, X.; He, K. Nitrate-driven Urban Haze Pollution during Summertime over the North China Plain. Atmos. Chem. Phys. 2018, 18, 5293–5306. [Google Scholar] [CrossRef] [Green Version]
  54. Yang, T.; Sun, Y.; Zhang, W.; Wang, Z.; Liu, X.; Fu, P.; Wang, X. Evolutionary Processes and Sources of High-nitrate Haze Episodes over Beijing, Spring. J. Environ. Sci. 2017, 54, 142–151. [Google Scholar] [CrossRef]
  55. Fisher, J.A.; Jacob, D.J.; Wang, Q.; Bahreini, R.; Carouge, C.C.; Cubison, M.J.; Dibb, J.E.; Diehl, T.; Jimenez, J.L.; Leibensperger, E.M.; et al. Sources, Distribution, and Acidity of Sulfate-ammonium Aerosol in the Arctic in Winter-spring. Atmos. Environ. 2011, 45, 7301–7318. [Google Scholar] [CrossRef] [Green Version]
  56. Dinar, E.; Anttila, T.; Rudich, Y. CCN Activity and Hygroscopic Growth of Organic Aerosols Following Reactive Uptake of Ammonia. Environ. Sci. Technol. 2008, 42, 793–799. [Google Scholar] [CrossRef] [PubMed]
  57. Mensah, A.A.; Buchholz, A.; Mentel, T.F.; Tillmann, R.; Kiendler-Scharr, A. Aerosol Mass Spectrometric Measurements of Stable Crystal Hydrates of Oxalates and Inferred Relative Ionization Efficiency of Water. J. Aerosol Sci. 2011, 42, 11–19. [Google Scholar] [CrossRef]
  58. Pathak, R.K.; Wu, W.S.; Wang, T. Summertime PM2.5 Ionic Species in Four Major Cities of China: Nitrate Formation in an Ammonia-deficient Atmosphere. Atmos. Chem. Phys. 2009, 9, 1711–1722. [Google Scholar] [CrossRef] [Green Version]
  59. Pinder, R.W.; Dennis, R.L.; Bhave, P.V. Observable Indicators of the Sensitivity of PM2.5 Nitrate to Emission Reductions-part I: Derivation of the Adjusted Gas Ratio and Applicability at Regulatory-relevant Time Scales. Atmos. Environ. 2008, 42, 1275–1286. [Google Scholar] [CrossRef]
  60. Dennis, R.L.; Bhave, P.V.; Pinder, R.W. Observable Indicators of the Sensitivity of PM2.5 Nitrate to Emission Reductions—Part II: Sensitivity to Errors in Total Ammonia and Total Nitrate of the CMAQ-predicted Non-linear Effect of SO2 Emission Reductions. Atmos. Environ. 2008, 42, 1287–1300. [Google Scholar] [CrossRef]
  61. Wang, J.; Xu, J.; He, Y.; Chen, Y.; Meng, F. Long Range Transport of Nitrate in the Low Atmosphere over Northeast Asia. Atmos. Environ. 2016, 144, 315–324. [Google Scholar] [CrossRef]
Figure 1. Locations of seven monitoring sites representing exit-and-entrance areas of transboundary transport over China, Japan, and Korea. The longitudes and latitudes of the seven sites are presented in Supplementary Table S1.
Atmosphere 12 00469 g001
Figure 2. Spatial distributions of monthly average PM2.5 concentrations (µg/m3) for January, April, July, and October 2013. The three air quality models are (a) WRF-CAMx, (b) NHM-RAQM2, and (c) WRF-CMAQ, employed by China, Japan, and Korea, respectively.
Atmosphere 12 00469 g002
Figure 3. As in Figure 2, but for SO42 concentrations (µg/m3).
Atmosphere 12 00469 g003
Figure 4. As in Figure 2, but for NO3 concentrations (µg/m3).
Atmosphere 12 00469 g004
Figure 5. As in Figure 2, but for organic carbon (OC) concentrations (µg/m3).
Atmosphere 12 00469 g005
Figure 6. As in Figure 2, but for elemental carbon (EC) concentrations (µg/m3).
Atmosphere 12 00469 g006
Figure 7. Observed and simulated monthly average PM10 concentrations at exit-and-entrance sites in China, Japan, and Korea. The site locations and characteristics are indicated in Figure 1 and Supplementary Table S1.
Atmosphere 12 00469 g007
Figure 8. Spatial distributions of simulated monthly mean NO3/SO42− and OC/EC ratios for January (a,e), April (b,f), July (c,g), and October (d,h) in 2013.
Atmosphere 12 00469 g008
Figure 9. Simulated monthly mean (a) NO3/SO42− ratios, (b) OC/EC ratios, (c) [NH4+]/(2[SO42−] + [NO3]), (d) NO3-to-SO42− molar ratios vs. NH4+-to-SO42− molar ratios, (e) adjusted gas ratios defined as ([NH4+] + [NO3])/([HNO3] + [NO3]) at seven remote sites in China, Japan, and Korea.
Atmosphere 12 00469 g009
Table 1. Descriptions of the physical and chemical parameters of three models: WRF-CMAx (Weather Research and Forecasting-Comprehensive Air Quality Model with Extensions), NHM-RAQM2 (Non-Hydrostatic Model-Regional Air Quality Model2), and WRF-CMAQ (Weather Research and Forecasting-Community Multi-scale Air Quality Modeling System), employed by the Chinese, Japanese, and Korean modeling research groups, respectively.
ChinaJapanKorea
Air quality modelCAMxRAQM2CMAQ
 Model domain20–50° N, 100–150° E
 Map projectionLambert conformal projection
 Model runOff-line run
 Vertical coordinateσ coordinateTerrain followingTerrain following
 Horizontal resolution36 km (220 × 140 grids)
 Vertical layers142023
 Gas phase chemistrySAPRC 99 mechanism (common to three models)
 Chemical species93 reactions, 36 species with 11 photochemistry
 Aqueous chemistryRADM Chemistry
 Dry depositionWesely’s methodModified by Zhang et al. (2003) [13] RADM module
 Wet depositionRADM moduleKajino et al.(2012) [18] RADM module
 Aerosol thermodynamicsISORROPIAISORROPIA2AERO5
 EmissionREAS + MEICCREATE-2013CREATE-2013
 Vertical DiffusivityBrost’s method1.5 order TKEACM2
Meteorological ModelWRFNHMWRF
 Basic equationCompressible/non-hydrostatic equation
 Horizontal resolution36 km (220 × 140 grids)
 Horizontal gridArakawa-BArakawa-CArakawa-C
 Domain structureNon-nested grid structure for all three models
 Vertical coordinateTerrain following pressureTerrain following heightTerrain following height
 Vertical layers345043
 Data assimilationFDDAJCDASFDDA
 Cumulus
 parameterization
Kain-Fritsch schemeArakawa-Shubert schemeKain-Fritsch scheme
 TKE closure1.5-order TKEMYNN21.5-order TKE
 PBL schemeYSU PBL schemeMYNN2YSU PBL scheme
 MicrophysicsWSM3Mixed-phase
2-moment
WSM3
 RadiationRRTM Longwave radiation scheme (common to three models)
 Soil layer5-layer soil model5-layer soil modelMulti-layer soil model
 Land use typeUSGS
EROS (13 categories)
EROS
(12 categories)
USGS
EROS (13 categories)
Table 2. Statistical summary of simulated and observed PM10 levels over six exit-and-entrance sites related to transboundary transport over China, Japan, and Korea. Here, RMSE, NMB, NME, FB, and FE denote root mean square error, normalized mean bias, normalized mean error, fractional bias, and fractional error, respectively.
SitesModelRMSENMBNMEFBFE
Dalian
(Fujiazhuang)
CAMx41.43−0.350.42−0.020.03
RAQM250.780.670.690.010.02
CMAQ16.17−0.130.16−0.010.01
Xiamen
(Hongwen)
CAMx27.39−0.240.42−0.010.02
RAQM29.39−0.020.16−0.000.01
CMAQ24.07−0.320.33−0.010.01
OkiCAMx21.57−0.650.66−0.040.04
RAQM27.540.200.220.010.01
CMAQ20.34−0.710.72−0.030.03
RishiriCAMx10.67−0.590.64−0.060.07
RAQM29.050.580.580.020.02
CMAQ4.71−0.310.32−0.010.02
GanghwaCAMx19.82−0.250.31−0.010.02
RAQM232.730.640.680.010.02
CMAQ14.22−0.180.26−0.070.01
GosanCAMx36.05−0.690.69−0.040.04
RAQM28.050.050.190.000.01
CMAQ26.79−0.560.57−0.020.02
TaeanCAMx33.98−0.540.55−0.030.03
RAQM27.920.110.220.000.01
CMAQ28.16−0.530.53−0.020.03
Publisher’s Note: MDPI stays neutral with regard to jurisdictional claims in published maps and institutional affiliations.

