Article

Ventilation of a Mid-Size City under Stable Boundary Layer Conditions: A Simulation Using the LES Model PALM

Climatology Research Group, University of Münster, 48149 Münster, Germany
*
Author to whom correspondence should be addressed.
Atmosphere 2021, 12(3), 401; https://doi.org/10.3390/atmos12030401
Submission received: 22 January 2021 / Revised: 14 March 2021 / Accepted: 18 March 2021 / Published: 20 March 2021
(This article belongs to the Special Issue The Stable Boundary Layer: Observations and Modeling)

Abstract

:
City centers have to cope with an increasing amount of air pollution. The supply of fresh air is crucial yet difficult to ensure, especially under stable conditions of the atmospheric boundary layer. This case study used the PArallelized Large eddy simulation (LES) Model PALM to investigate the wind field over an urban lake that had once been built as a designated fresh air corridor for the city center of Münster, northwest, Germany. The model initialization was performed using the main wind direction and stable boundary layer conditions as input. The initial wind and temperature profiles included a weak nocturnal low-level jet. By emitting a passive scalar at one point on top of a bridge, the dispersion of fresh air could be traced over the lake’s surface, within street canyons leading to the city center and within the urban boundary layer above. The concept of city ventilation was confirmed in principle, but the air took a direct route from the shore of the lake to the city center above a former river bed and its adjoining streets rather than through the street canyons. According to the dispersion of the passive scalar, half of the city center was supplied with fresh air originating from the lake. PALM proved to be a useful tool to study fresh air corridors under stable boundary layer conditions.

1. Introduction

Urbanization is an ongoing process in Germany [1]. Cities are expanding outward, buildings are getting taller, street canyons deeper and the density of urban development is increasing [2]. Indeed, urban densification is considered an appropriate tool to increase energy efficiency and, thus, to combat climate change [3]. During the past 30 years, greenhouse gas emissions declined by 31.4% in Germany [4], but urban air pollution increases with a rising number of inhabitants and growths in the manufacturing sector [5] and the construction industry [6]. Thus, supplying urban areas with sufficiently fresh air is becoming increasingly important. As such, city development plans include open areas to foster the formation of fresh air corridors, thereby supporting the ventilation of the city center. Yet, a frequently asked question regarding this approach is whether the fresh air really reaches the city center. To guarantee a supply of fresh air, such corridors need to be kept free from obstacles such as tree rows or buildings orthogonal to the wind direction [7].
Note that we consider all air approaching and entering the city as fresh air. This is a reasonable assumption as the regional periphery has much less industry and traffic emissions than the urban area. The transport of such fresh air into the city is considered as city ventilation. Again, from an urban planning perspective, it is important to design corridors that can supply fresh air into city centers [8], especially via the main wind direction.
In this context, the focus of our study was on a designated fresh air corridor in the city of Münster (Northwest, Germany). When originally constructed, the urban lake “Aasee” was thought to channel air flow into the city due to its southwestern alignment, thereby offering a supply of fresh air to the city [9] via the street canyon “Aegidiistrasse”, which reaches into the city center. Hence, our focus was on the lake itself, the adjacent street canyon and the cathedral square, which marks the city center (Figure 1).
To better understand the respective flow dynamics in the street canyon Aegidiistrasse under stable boundary layer conditions, we applied a large eddy simulation (LES) model. LES allows one to calculate turbulent flows with reduced computational expenses due to its separation between calculating large-scale and subgrid-scale (SGS) eddies [10]. Even so, the calculations had to be done on a high-performance computer. For the LES, we chose to use the PALM model [11] because it is a proven tool for calculating turbulent flows in complex environments [12,13,14,15] and can parallelize the code structure. Furthermore PALM’s integrated pressure solver and its allowances for external forcing and parametrization of topography [11,16] make it a valuable tool for representing the intended flow conditions. To our knowledge, this is the first application of PALM to study the ventilation of an urban environment under stable boundary layer conditions.

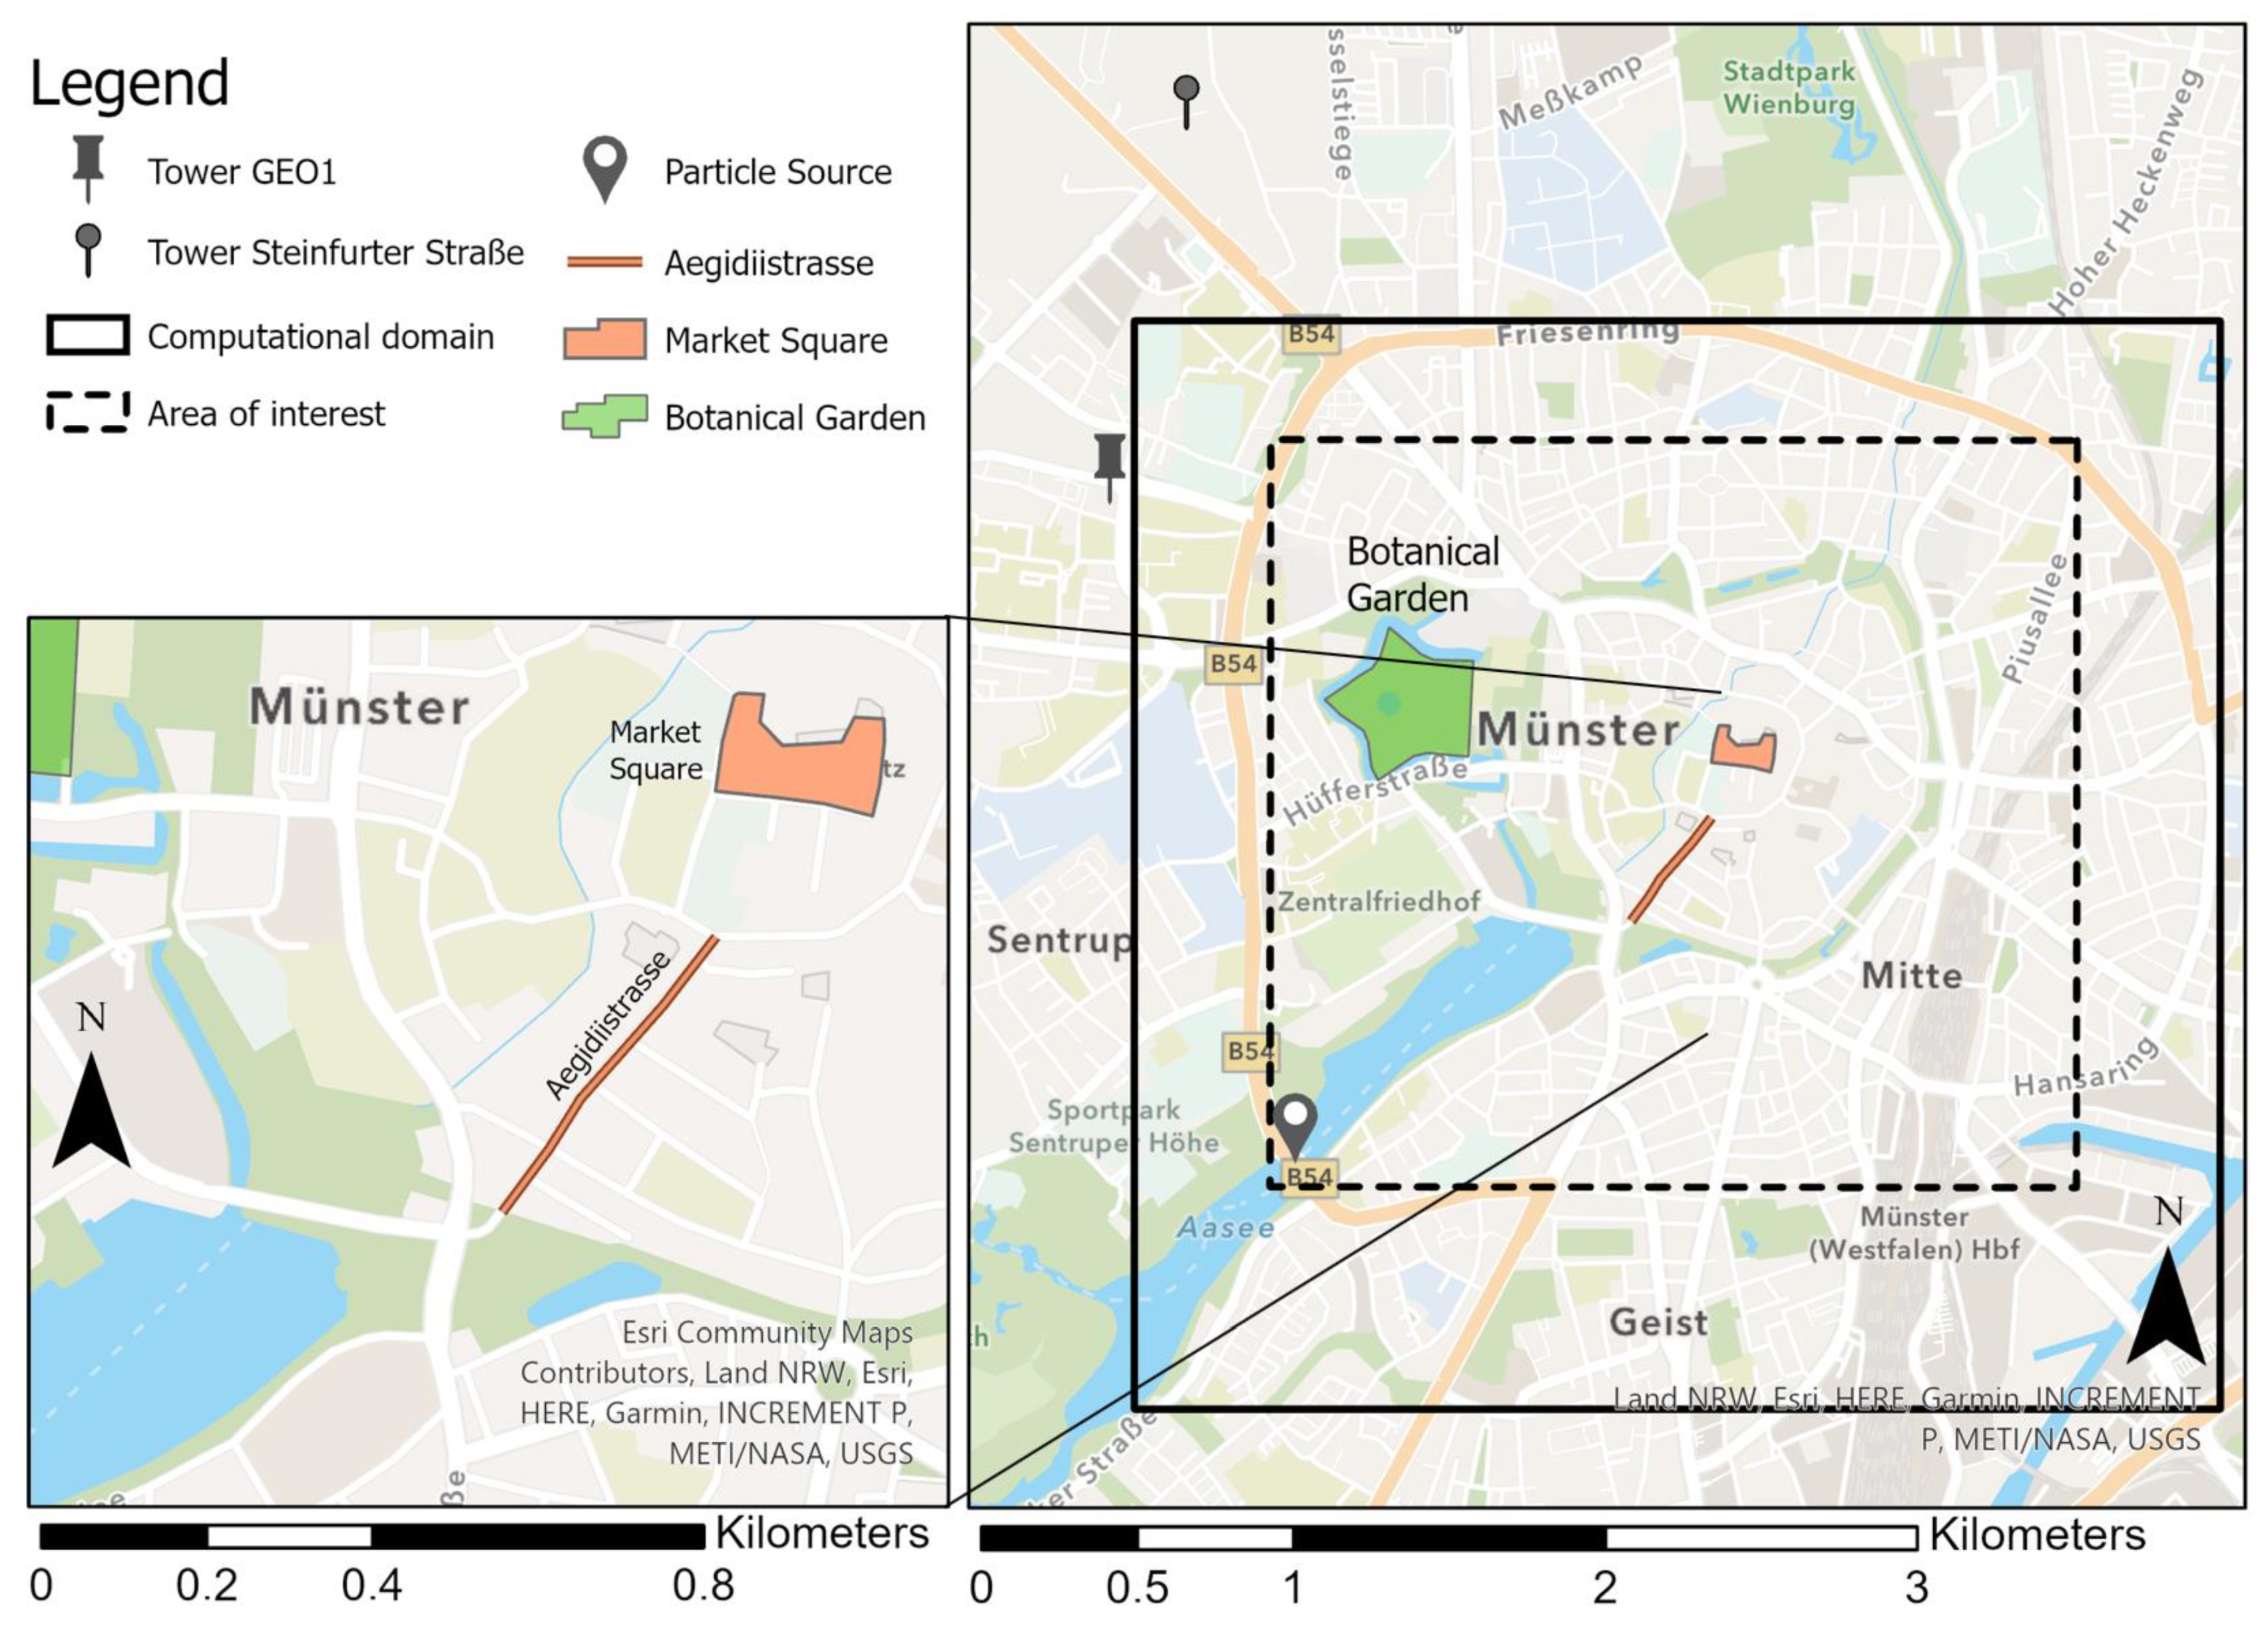
2. Research Site Description

This study focused on lake Aasee and the surrounding area, which is located in Münster, Germany (51.96° N, 7.63° E). Münster itself extends over about 300 km2 [17] with a population of about 300,000 inhabitants. The area of interest (Figure 1) covers a section of about 2600 m × 2400 m. The city center is located in the northeastern part of the area of interest and includes buildings of different heights, ring roads and arterial roads, as well as street canyons of varying widths. The lake is located in the southwest quarter of the area of interest. It is surrounded by vegetation and sports fields to the north and west and by residential areas to the south. It borders the city center at its northeastern corner. The lake has a length of about 2 km and an average width of about 170 m. The longitudinal axis of the lake is oriented approximately parallel to the main local wind direction, southwest, determined by the German Meteorological Service [18].

3. Materials and Methods

3.1. Simulation Software PALM

The PArallel LES Model (PALM) is an open-source software that resolves turbulent flow patterns inside the oceanic and atmospheric boundary layer. Developed at the Leibnitz Universität Hannover, PALM gained importance within the past 20 years due to its recent inclusion in a holistic urban microclimate model and its use by various external institutions [19].
The PALM is based on solving filtered, non-hydrostatic, incompressible Navier-Stokes equations using the Boussinesq approximation [20]. These equations are applied to each of the Cartesian grid points into which the computational domain (Section 3.2) is equidistantly divided. Advection terms are used in the prognostic equations and are realized by an upwind-biased 5th-order differencing scheme [21] with a 3rd-order Runge-Kutta time-stepping scheme [22]. In order to parameterize eddies that are smaller than the grid spacing, PALM uses a subgrid-scale (SGS) model, which uses a 1.5th-order closure following Deardorff [23], modified by Moeng and Wyngaard [24] and Saiki et al. [25]. This approach assumes that the energy transport by SGS eddies is proportional to local gradients of mean quantities [26].
The three-dimensional computational domain consists of three types of grid cells: solid, fluid and near-surface cells. Solid grid cells are used for topography, buildings, vegetation and large water bodies. Hence, trees are represented as solid objects without any porosity and the surface of lake Aasee is solid and plane. Fluid grid cells are used for flow simulation. Near-surface cells are located close to solid grid cells. Additional PALM-code is applied on these grid cells, in order to consider occurring friction effects. The Navier-Stokes equations are solved for every grid cell. The equations for solid objects are multiplied by zero [27]. The degree to which obstacles, such as buildings, are present is approximated through the geometries of a certain number of solid grid cells. Moving objects are not implemented.

3.2. Computational Domain

A domain with a base area of 3600 m × 3600 m and a horizontal grid spacing of 4 m was chosen. The domain’s height was 1200 m with a vertical grid spacing of 4 m. Figure 1 shows that the computational domain included the entire city center, the southwestern part of Münster’s suburban districts, and most of lake Aasee. Topography data input was based on laser scanning data acquired via remote sensing with a spatial resolution of 1 m2 (DSM1). It includes the ground surface with all its obstacles, such as buildings, vegetation, vehicles and bridges. Raw laser scanning data were downloaded from the website for geodata infrastructure of the government of North-Rhine Westphalia [28]. This data was converted into raster format with pixel sizes of 4 m × 4 m. Height values for each pixel were acquired, taking the mean height of all laser scanning points covered by the pixel; this led to a variation in building and topography heights. In the model, tall buildings appeared to be shorter than they were in reality. Hence, hereafter topography heights are distinguished between values above real ground level (AGL) and values above domain minimum (ADM) within the simulation. Note, the domain minimum is the lowest point within the topography model. Missing pixel values, either missing during data acquisition, such as for areas with water bodies and objects with strong backscatter, or missing due to the conversion routine, were corrected manually. Topography data were edited with ESRI ArcGIS Pro 2.4.2.
The highest buildings inside the domain were the St. Lamberti church (90.5 m AGL), the office towers of LVM insurances (70 m AGL) and a power-plant chimney at the inland harbor (118 m AGL). In order to guarantee realistic flow conditions, the domain height needed to be at least six times the maximum building height [29] of 118 m AGL or 99 m ADM. This request was fulfilled with a given domain height of 1200 m, such that the model setup had a minimal influence on the flow close to the surface. To maintain the flow conditions the topographic surface and the top boundary were both impassable for fluids, whereas the side boundaries were passable.
For the southwesterly inflow, a distance of 88 m existed between the first obstacle and the inlet of the domain. At the northeasterly outflow, a distance of 28 m from the last obstacle was kept clear to prevent outflow from re-entering the domain. For a detailed analysis of results, we did not consider the entire computational domain but instead chose a smaller area of interest (see Section 2 and Figure 1) to further ensure that boundary effects did not affect the numerical results. According to the best practice guidelines by Franke et al. [29], our area of interest was likely not influenced by boundary effects. Further, turbulence power spectra analysis confirmed that the size of the domain was large enough to include even the largest energetic turbulence elements. Note that this study was not intended to be a model developing study. The simulation was set up according to the documentary of the model developers.
Calculations were performed on the high-performance computer PALMA II, which is administrated by the IT service of the University of Münster.

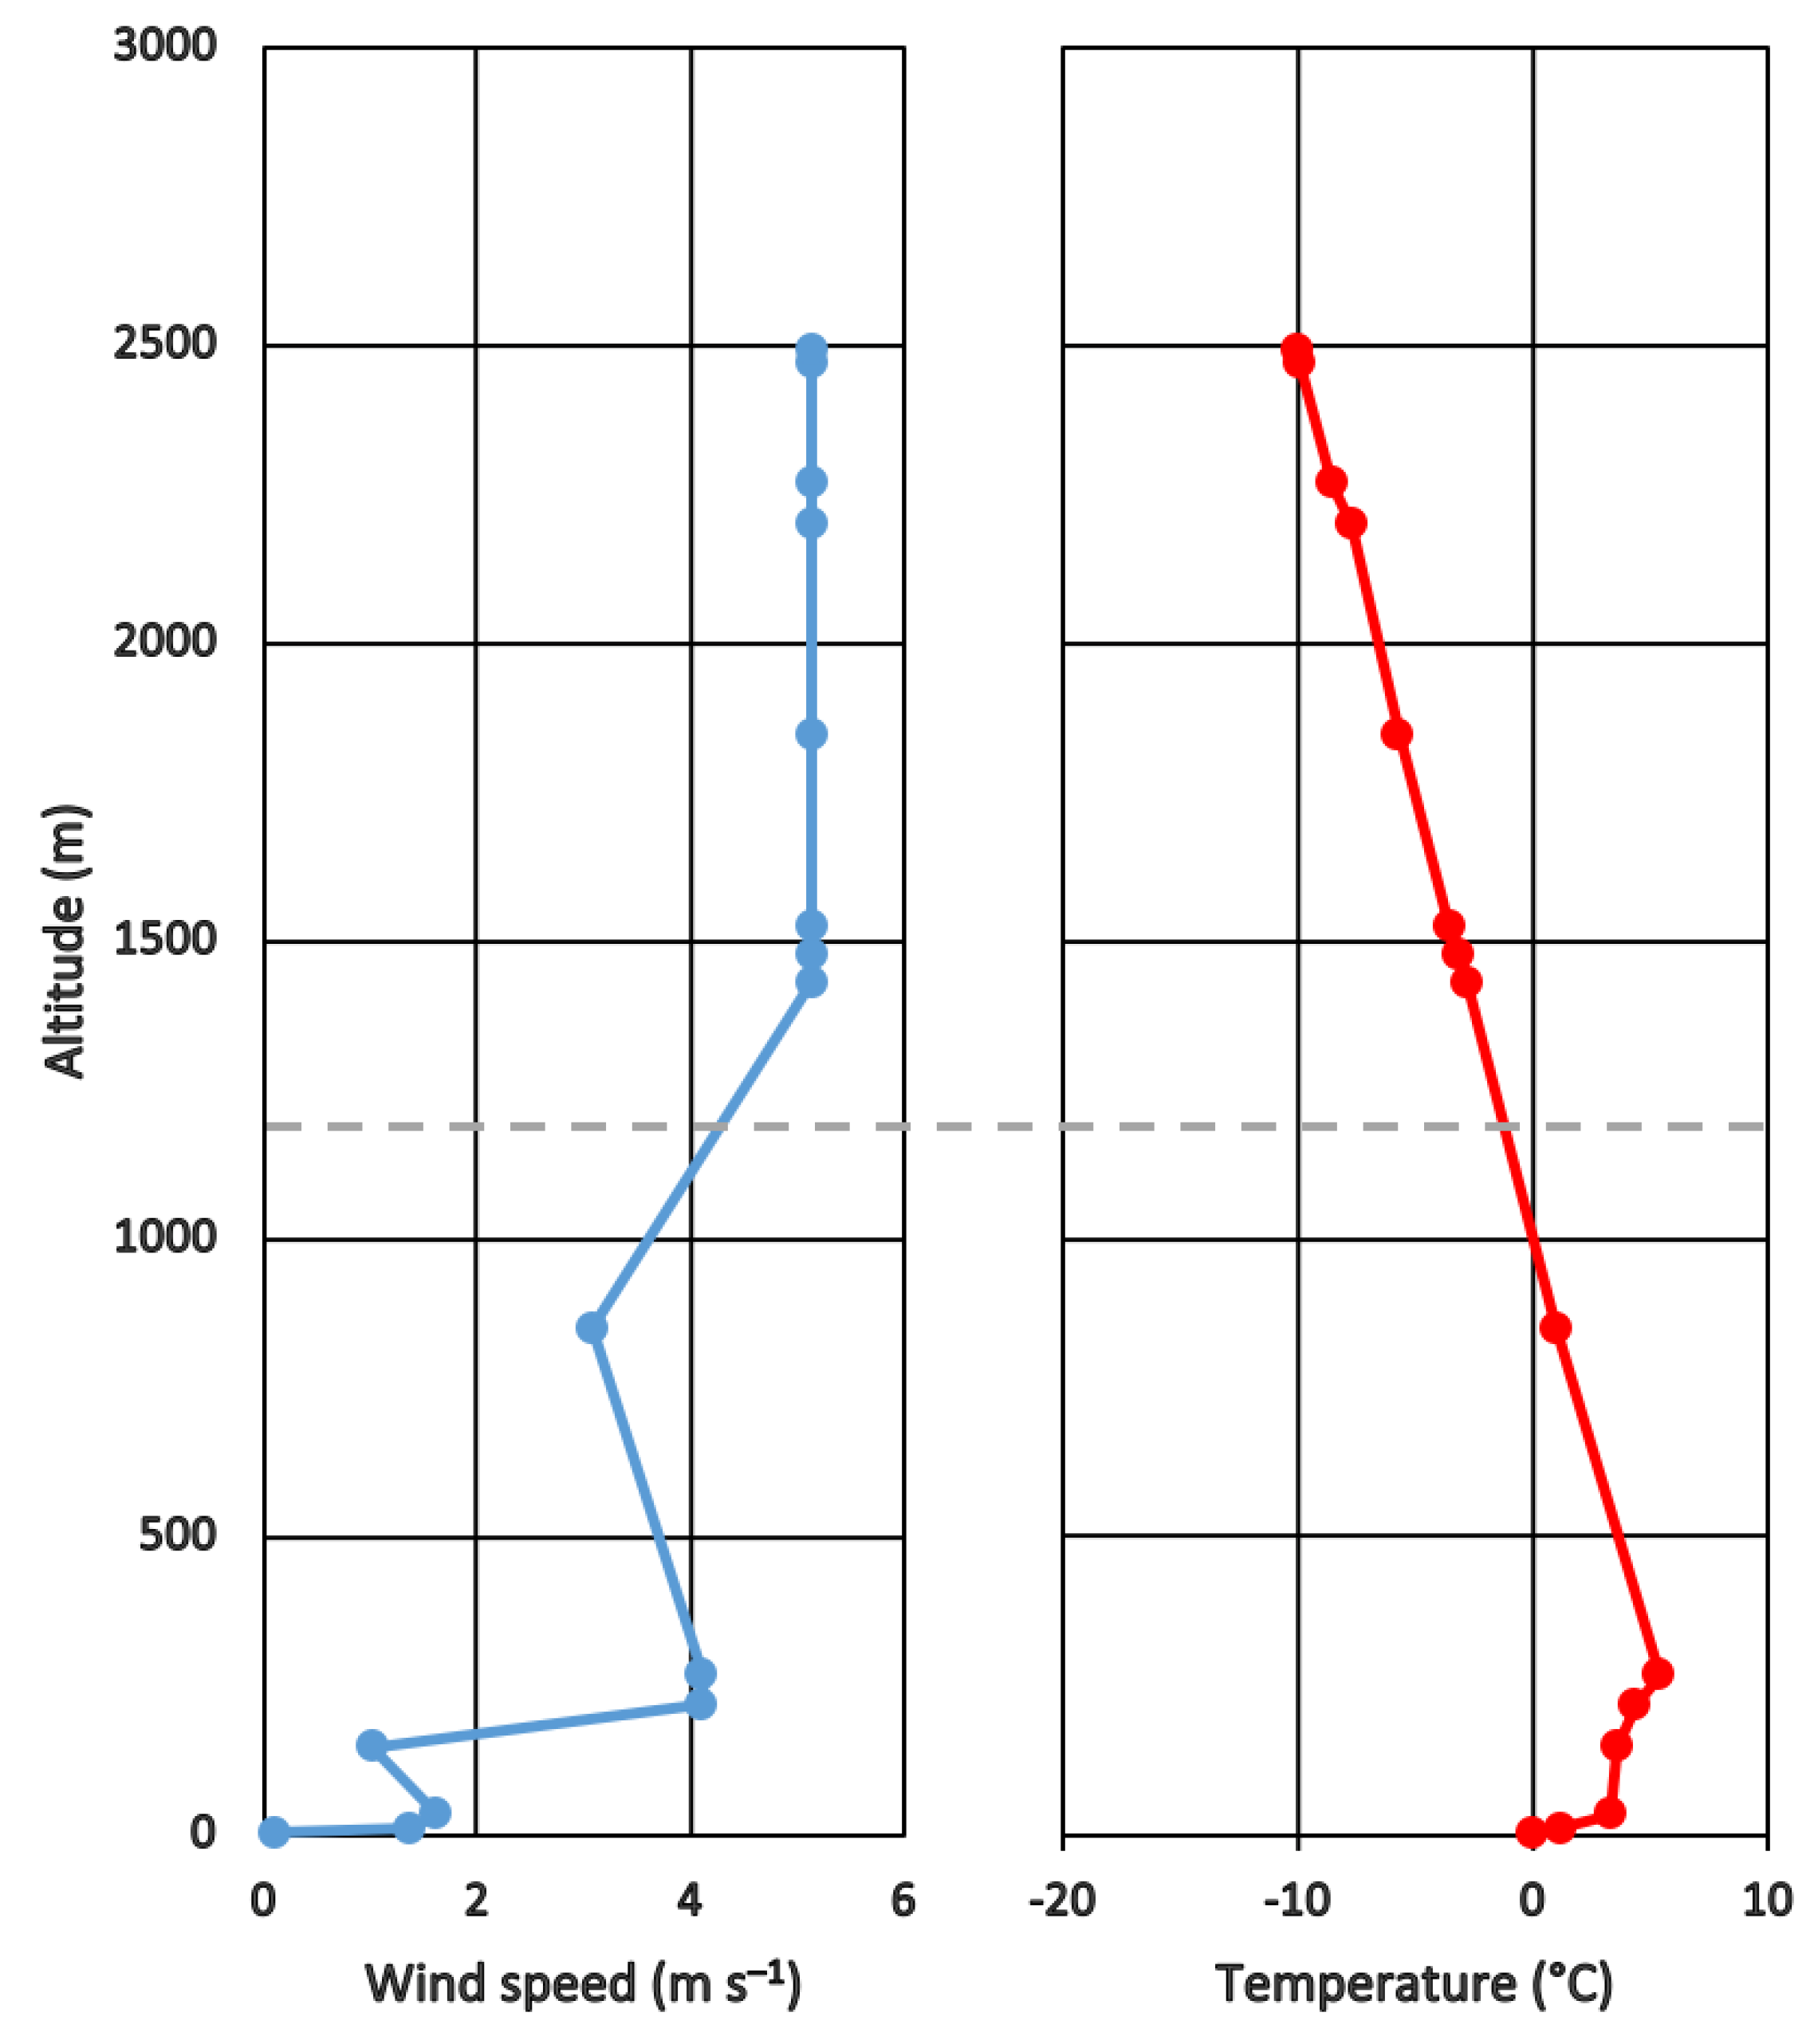
3.3. Simulation Parameters

The simulation was performed using PALM version 6.0 revision 4534. Simulation results were processed and visualized with ESRI ArcGIS Pro 2.4.2 and R version 3.6.2 [30] and using the packages fields [31], ggplot2 [32], ncdf4 [33], raster [34] and reshape [35]. While the total simulation time was set to 10 h, steady-state conditions of the turbulence was reached after 7 h of simulation. The model was initialized with real-world conditions, namely prevailing wind and temperature data from 5 December 2018 at 00:00 UTC. The data were derived from various meteorological stations (Table 1). Station 1 was located in the northwest, outside of the computational domain (Figure 1), measuring air temperatures at 2 m and 10 m AGL and wind speed and wind direction at 4 m and 10 m AGL, respectively. Station 2 was located on the rooftop of the GEO1 building (Figure 1), collecting data at 34 m AGL. Radiosonde data from the German Meteorological Service in Essen (77 km from Münster) were used to vertically extend the temperature and wind profile (Table 1). Figure 2 shows the vertical profile of wind speed and air temperature. The wind speed increased from 0.12 m s−1 at an altitude of 4 m AGL over 1.38 m s−1 at 10 m AGL to 1.63 m s−1 at 34 m AGL. At an altitude of 147 m AGL, the radiosonde measured a wind speed of 1.03 m s−1. The wind speed increased to 4.11 m s−1 at 268 m AGL, decreased to 3.08 m s−1 at 849 m AGL, and increased to 5.14 m s−1 as the radiosonde reached 1431 m AGL. Above that altitude, the wind speed stayed constant until 2492 m AGL. This maximum wind speed at altitudes 147 m and 268 m AGL appears to stem from a weak low-level jet stream.
The temperature profile in Figure 2 shows a near-ground temperature inversion and, thus, a very stable boundary layer up to an altitude of 268 m above ground. At higher altitudes, the stratification of the atmosphere is still stable, with increasing potential temperature with height almost throughout the entire profile shown in Figure 2 (except around 2200 m). We set the simulation ground values (0 m AGL) for wind speed and temperature to 0 m s−1 and 0 °C, respectively. Overall, the atmospheric boundary layer was stably stratified throughout the depth of the modeling domain (1200 m). The temperature and wind profile were only applied during the initialization of the simulation.
The simulation was performed using cyclic boundary conditions in west–east (x) and south–north (y) orientation. The forcing of the simulation took place with an external pressure gradient of −0.0003 Pa m−1 in x- and y-directions, respectively, so that a southwesterly flow was maintained throughout the simulation. The roughness length was set to 0.1 m.
To trace the air flow through the domain, a virtual tracer was simulated. Therefore, a passive scalar was released in the middle of the “Torminbrücke” (51.95034° N, 7.60522° E); a bridge connecting the northwestern and southeastern parts of the lake (see Figure 1). Every second, 50 particles were released. Note that these “particles” are computational tracers for air originating from the lake’s center and, thus, represent fresh air rather than certain gas particles such as SF6 simulated above Oklahoma City by Halvorson et al. [37] during the Joint Urban 2003 Field Experiment.

4. Results and Discussion

The simulation output was studied with respect to the horizontal wind field and the particle dispersion over the city center. Data were analyzed in this section after a simulation time of eight hours, as a stationary state of turbulence had been established by then. Half-hourly averages were analyzed.

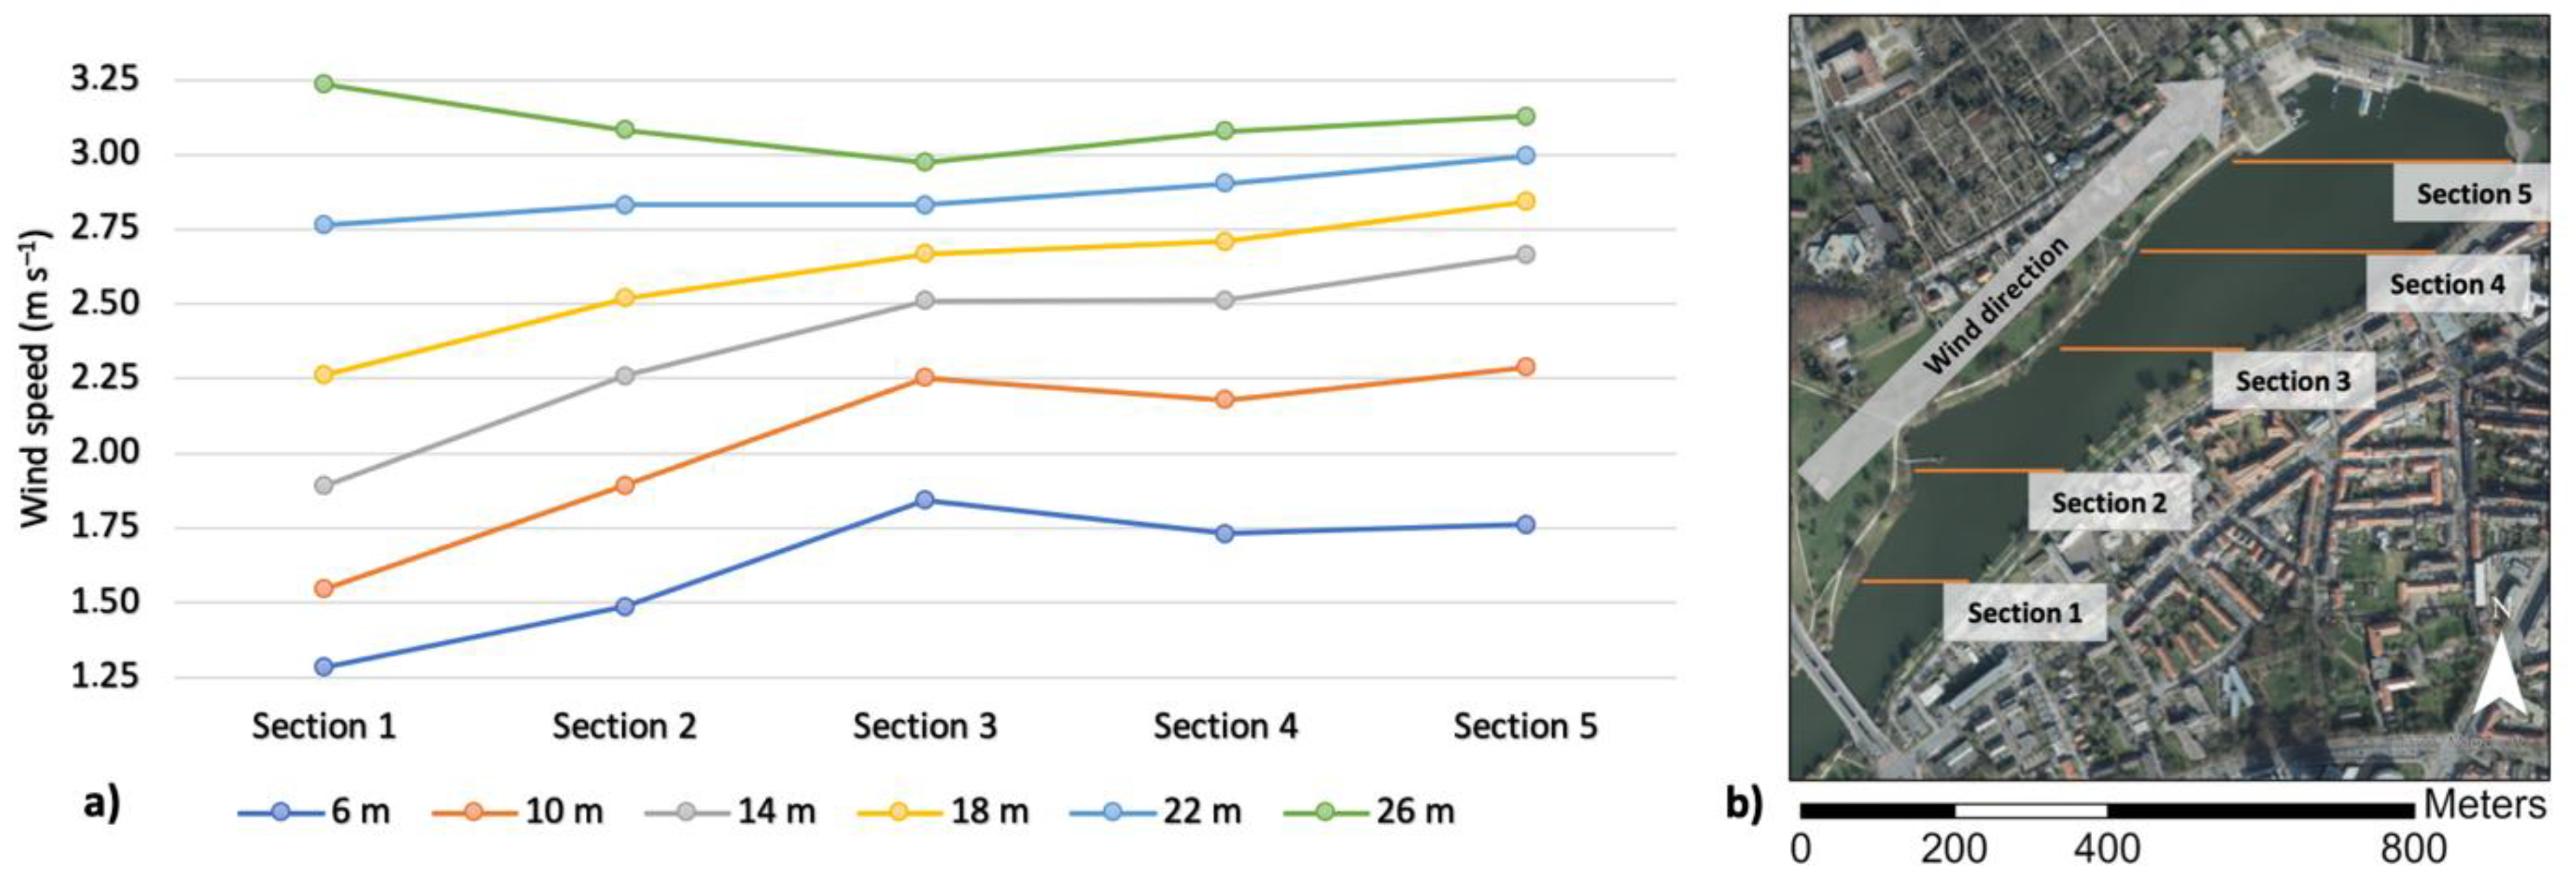
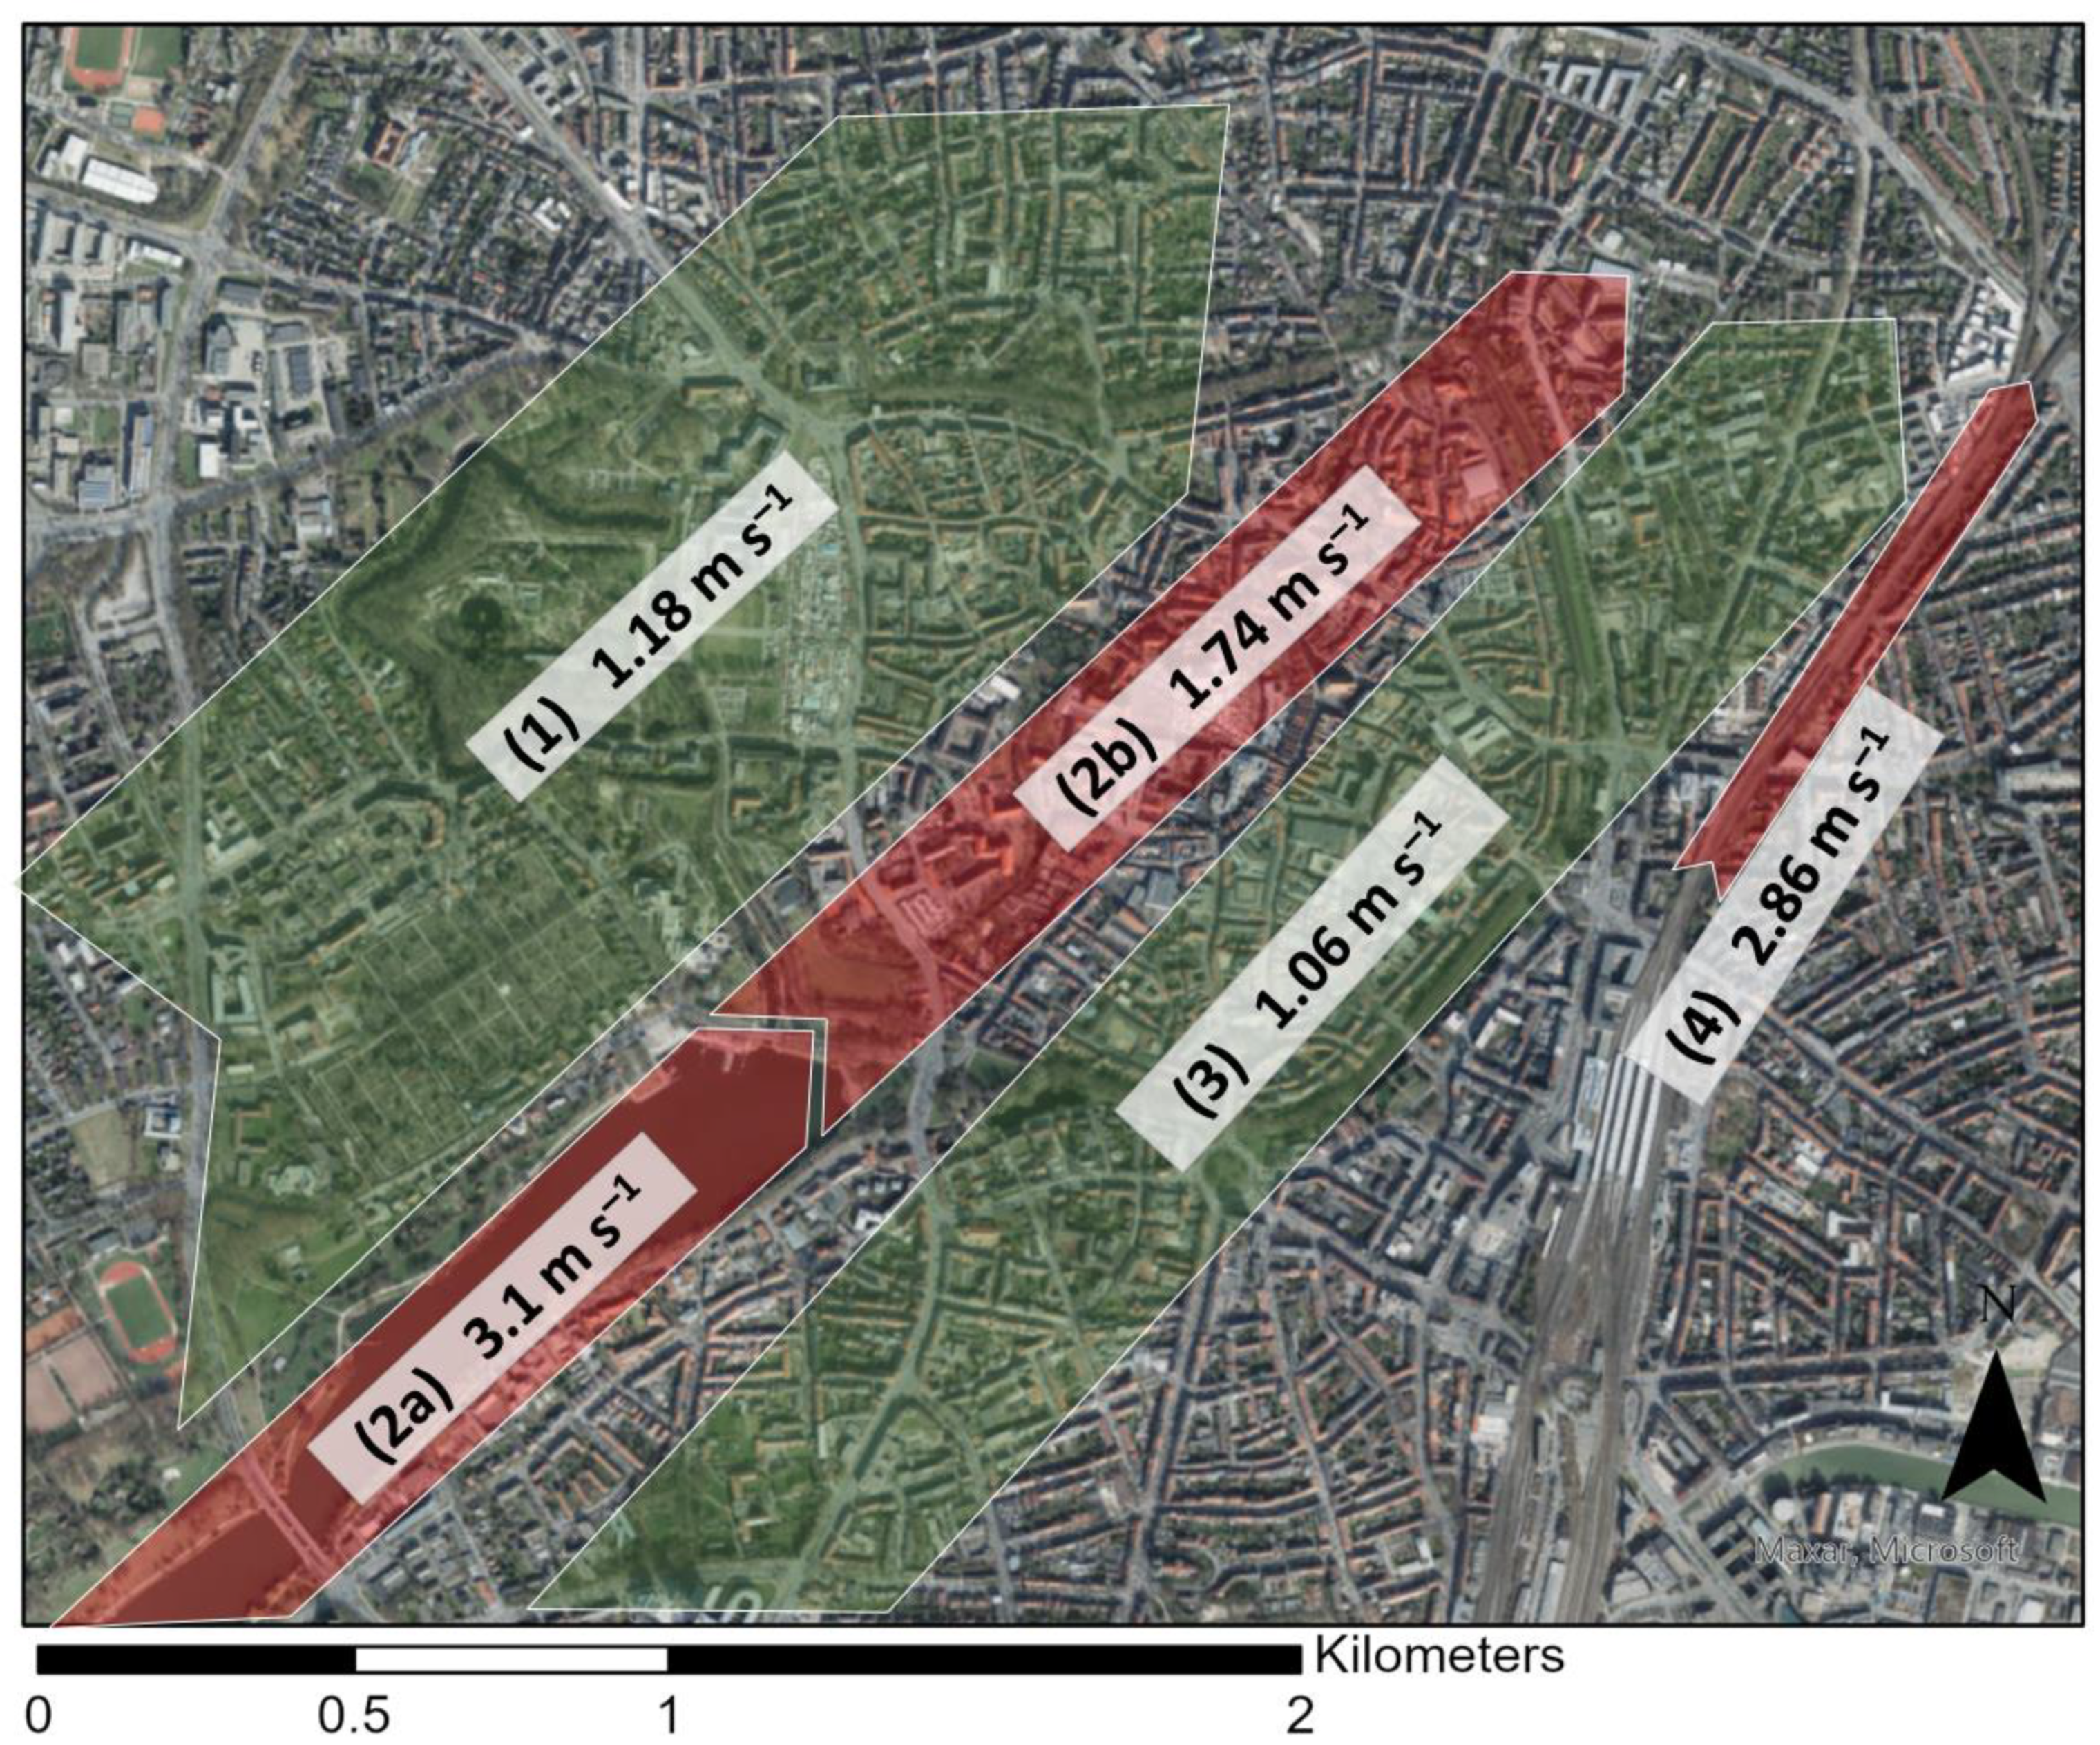
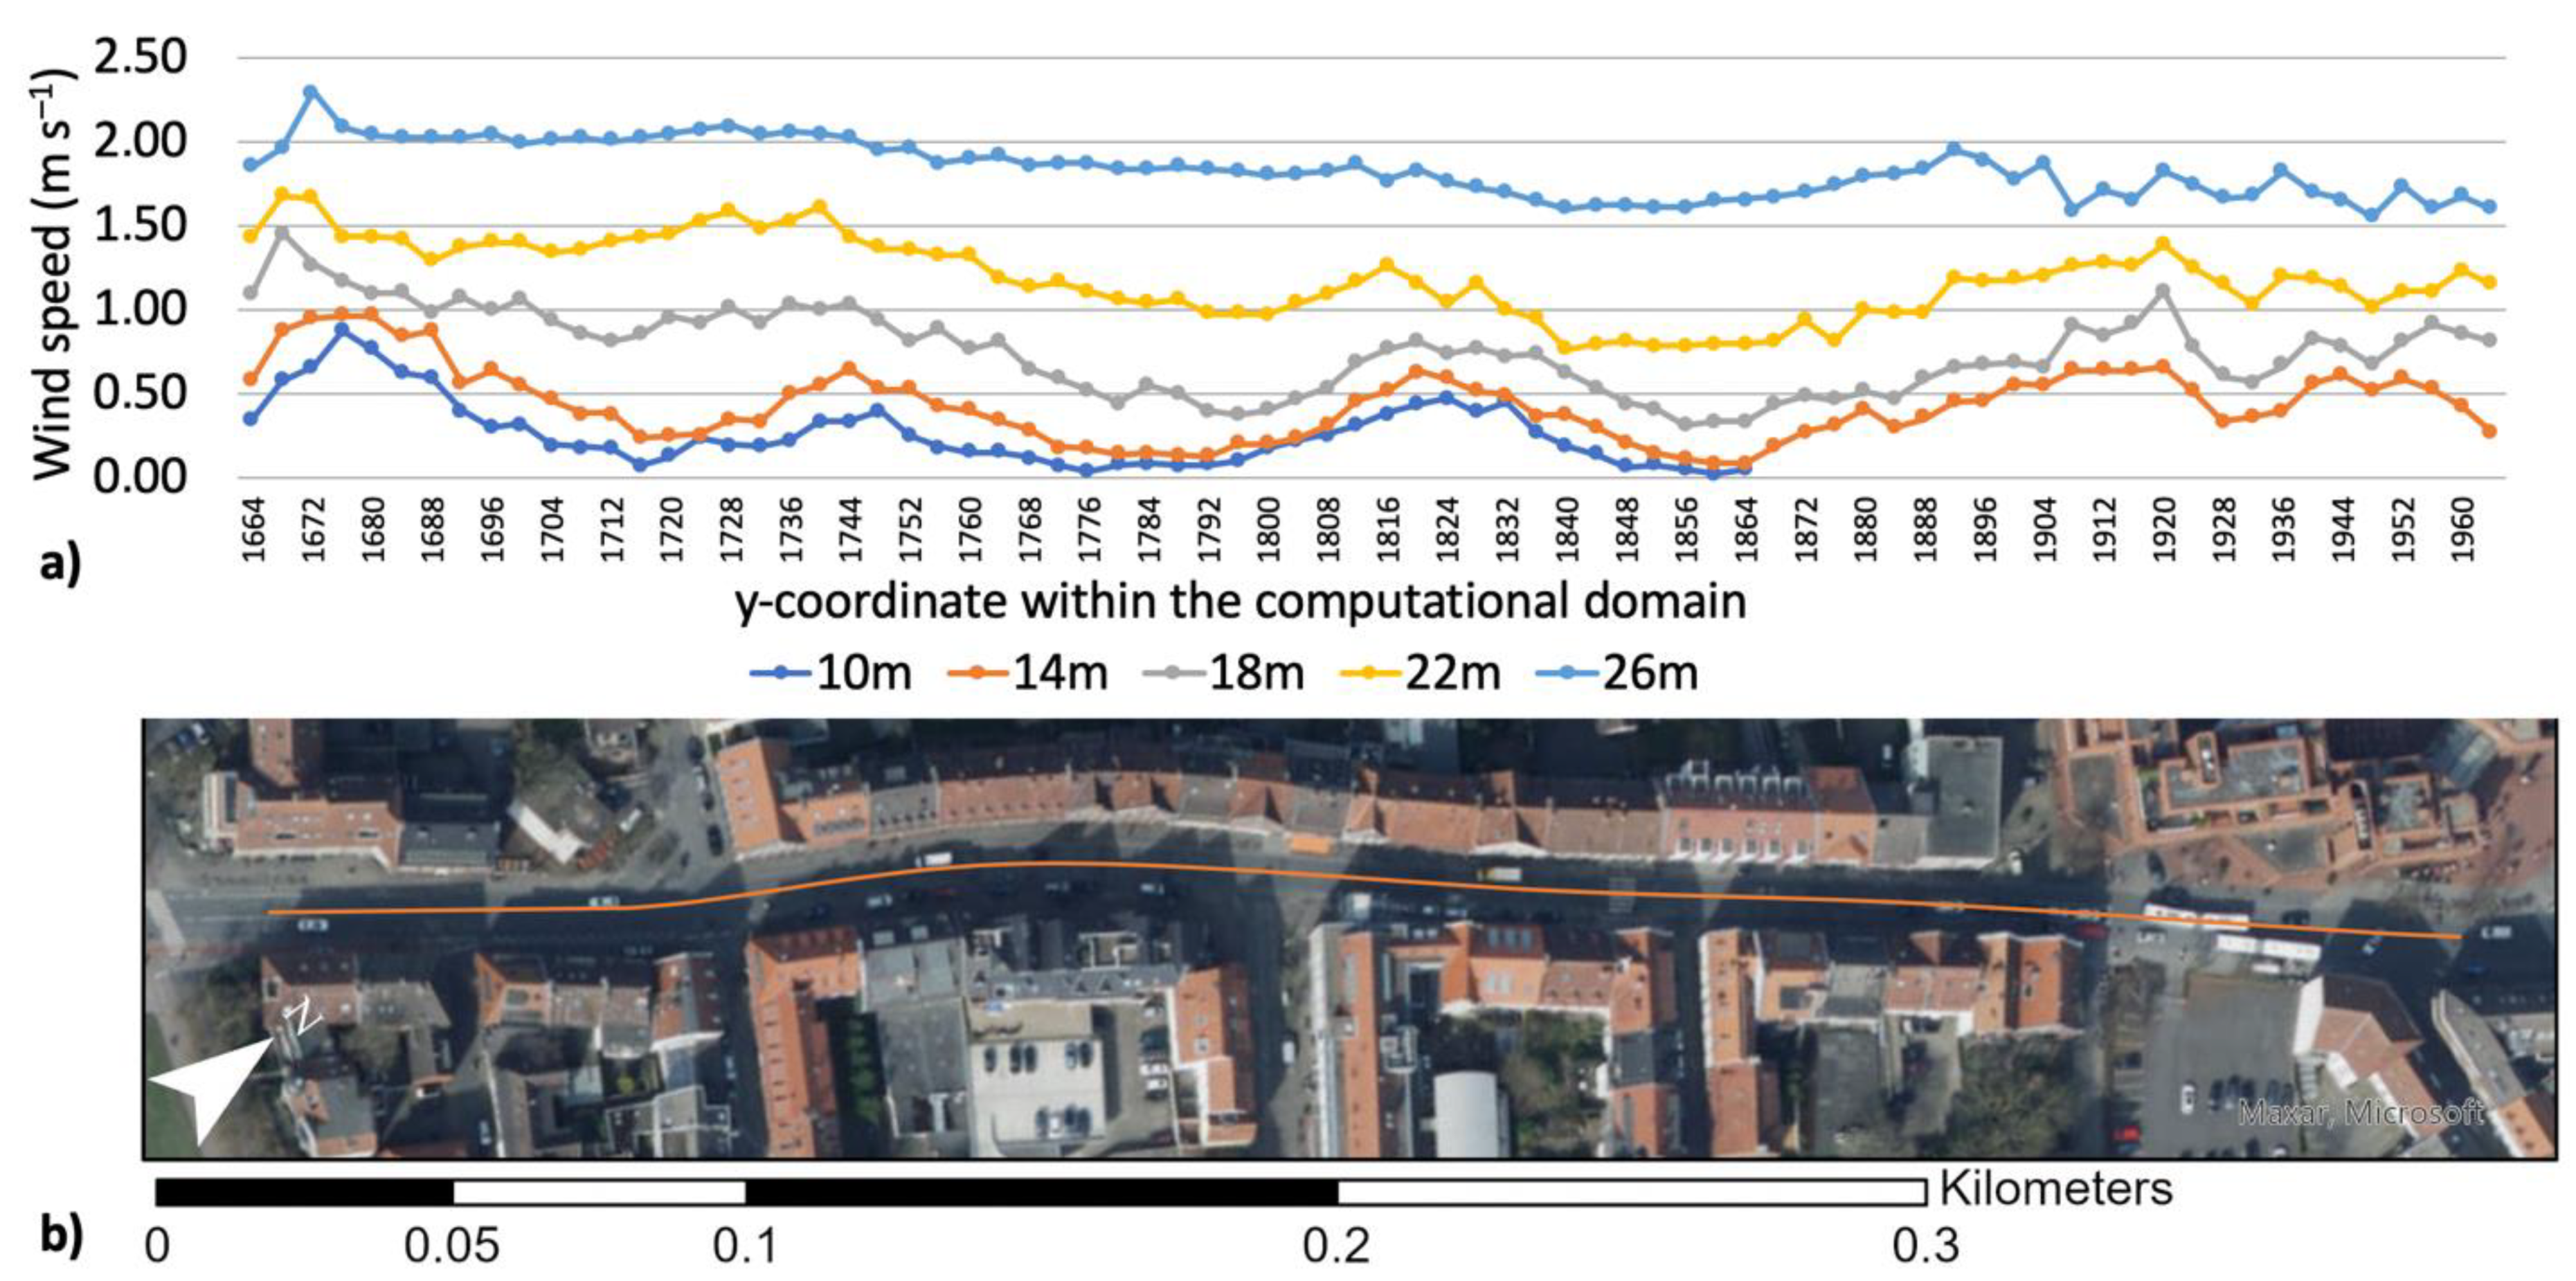
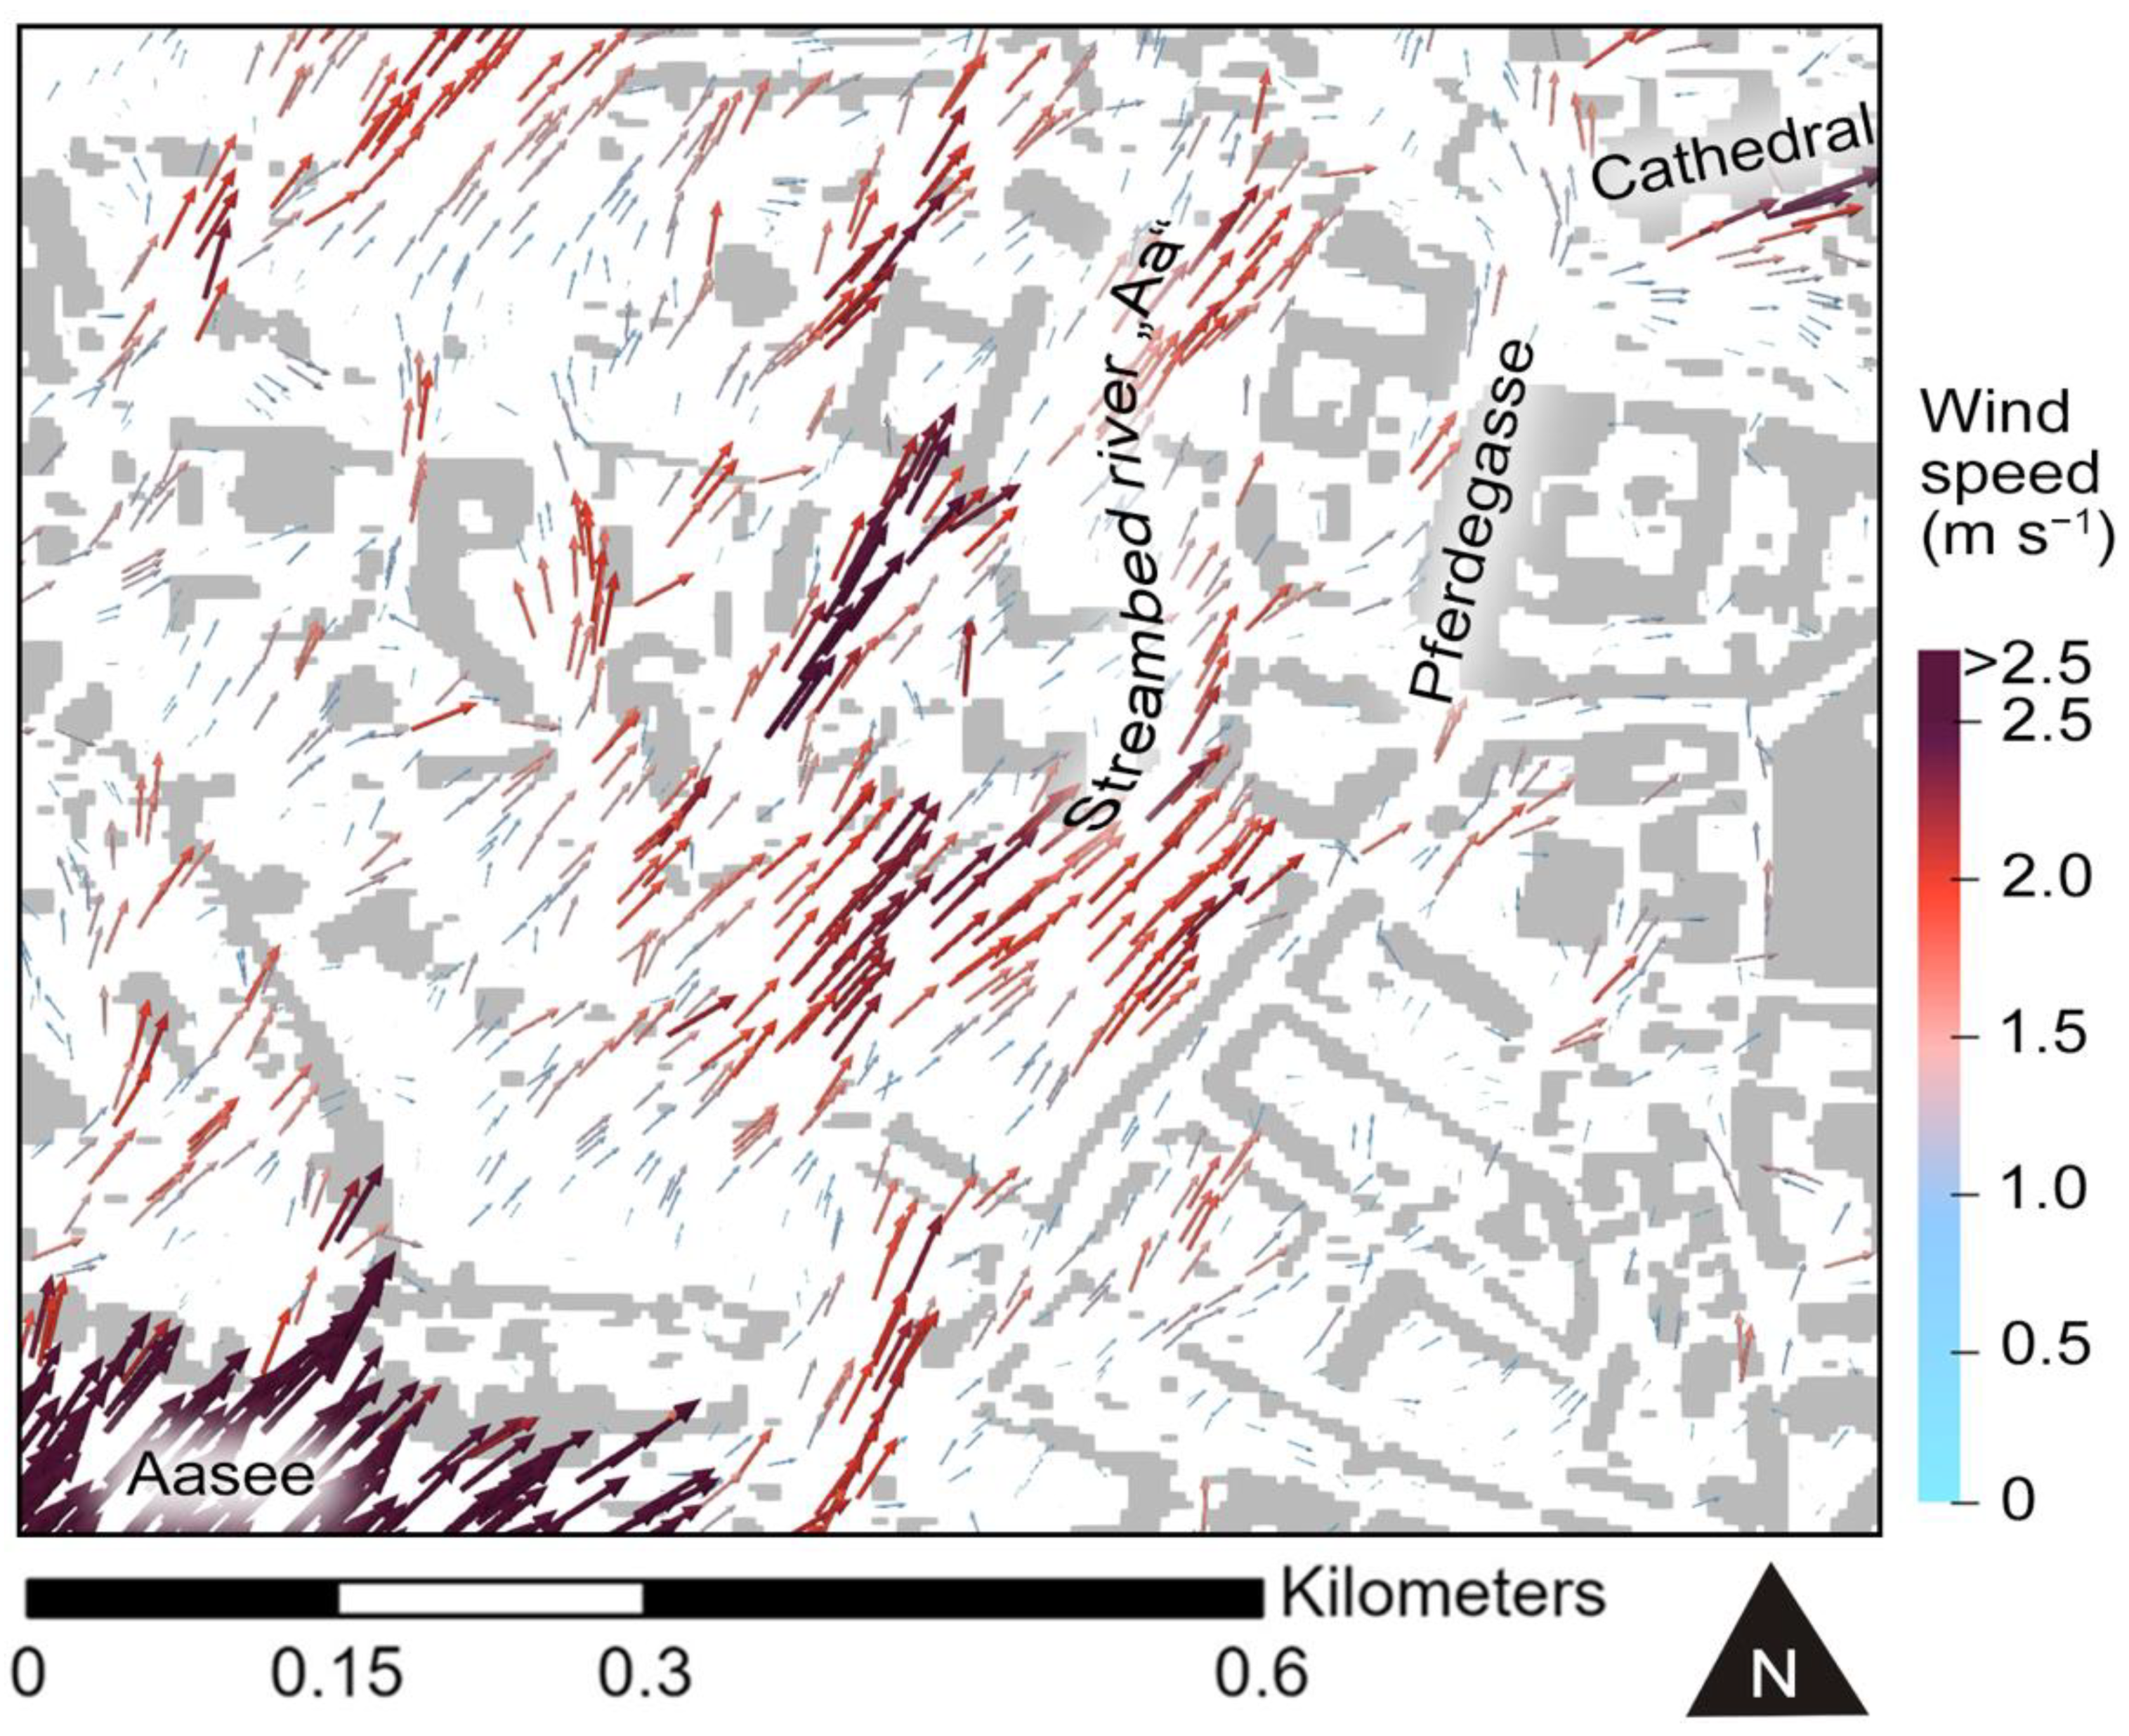
4.1. Horizontal Wind Field

The horizontal wind field was analyzed for the complete area of interest. Special focus was set on the northern part of the lake, the street canyon of Aegidiistrasse, and the cathedral square. Figure 3 shows the wind speed profiles (a) over five cross sections (b) of the northern lake. The wind speed increased with increasing altitude. In cross Section 1, this increase was the steepest and was most likely caused by the bridge itself, which was represented as a solid object in the topography model. No air could pass underneath. Hence, the air needed to converge when passing the solid bridge and to diverge after it. After the passage of the bridge (cross Section 1), the lower altitudes were influenced by cavity effects, likely even recirculation flows on the downwind side of the solid obstacle [38]. The mean wind speeds above the water surface at 6 m and at 10 m ADM increased from cross Section 1 to cross Section 3 due to the diffusor effect and remained almost stable on their way to cross Section 5. The tubular shape of the lake in combination with a hard edge at its northwestern shore, as caused by large trees represented as solid objects (see Section 3.1), supported the channeling of the air flow over the lake itself.
Figure 4 sketches the wind field of the domain at an altitude of 26 m ADM. Four main wind aisles could be defined. The mean wind speeds shown for each aisle were calculated based on cross sections within the respective area. The highest wind speed of 3.1 m s−1 was in aisle 2a over the lake (Figure 4). In aisle 2b, which is an extension of aisle 2a towards the NE, i.e., into the city center, the wind speed decreased by nearly 45% to 1.74 m s−1. However, that wind speed was still about 35% higher compared to the adjacent wind aisles 1 and 3. The northwestern aisle (1) covered the districts from “Sentruper Höhe” to “Uppenberg” with a mean wind speed of 1.18 m s−1, whereas the southeastern aisle (3) covered the “Südviertel” up to “Rumphorst” with a mean wind velocity of 1.06 m s−1. The wide train tracks in the east enabled another wind aisle (4) with an increased wind speed of 2.86 m s−1. According to Lee [39], the roughness of urban topography reduces the wind speed by about 20 to 30%. The change of surface roughness between the water surface of lake Aasee and the urban topography was probably more pronounced than the change between rural and urban topography within the study of Lee [39]. Hence, the reduction of wind speed between the lake surface and urban topography determined in this study, is significantly higher.
As mentioned earlier, the horizontal wind speed was reduced abruptly when reaching the northeastern lakefront. Most of the air was deflected upward with a vertical wind velocity of up to 2.7 m s−1 (data not shown in detail) to pass the dense tree rows with a height of about 30 m AGL. Thus, the wind field above the lake at an altitude of 18 m ADM seemed to be shifted by five grid layers, i.e., by about 16 to 20 m in the z-direction, considering a vertical spatial resolution of 4 m per grid layer. A vertical acceleration of the air masses apparently did not occur due to the stable layering of the boundary layer. Given that Foken [40] specified the displacement height to be about 2/3 of a forest or another vegetated area, the displacement height in our case should be 20 m, which agrees well with the observed vertical shift of the wind field of 16 to 20 m in the simulation output. On the other hand, the tree rows near the lake are not a closed forest stand as implied by Foken [40], so that the term “displacement height” is not directly applicable in this context. Yet the wind field was shifted vertically along the passage of the tree row. Further downwind, buildings and high vegetation towards the city center kept the horizontal wind field confined but was shifted up. Overall, the tree rows near the lake had a very significant influence on the horizontal wind field.
As mentioned in the introduction, it was previously hypothesized that the street canyon of Aegidiistrasse supports the transport of fresh air from the lake to the city center because it virtually extends the geographic orientation of the lake into the city center. The canyon’s roadsides are densely developed with rather homogenous building heights of at least three floors. The average width of the street canyon is 14 m. Figure 5 shows wind speed profiles (Figure 5a) over each y-cross section inside the street canyon (Figure 5b). The wind speed varied less with increasing altitude. At the lowest altitude above the ground (10 m ADM), we observed variations of up to 0.8 m s−1 within a distance of only 40 m. The lowest wind speeds of 0.03 to 0.07 m s−1 occurred at intersections. Between the intersections, buildings were situated on both roadsides, and the wind speeds increased to up to 1.4 m s−1 (22 m ADM). In areas where the building heights became inhomogeneous and the architecture was more complex (e.g., “Aegidiimarkt”), the wind speed varied by ±0.35 m s−1.
In contrast to the original hypothesis that the air flowing through Aegidiistrasse should continue up north to the cathedral square, most of the air could be traced along the street “Rothenburg” in the eastern direction (data not shown in detail). The wind tended to take a different flow path to reach cathedral square (Figure 6). At a height of 22 m ADM after leaving the lake and passing the trees at the northeastern lakeside, the air followed the former streambed of the river “Aa” and continued over the streets “Bispinghof”, “Johannisstrasse” and “Pferdegasse”.
Though Münster is considered to have a flat terrain, the elevation within the urbanized part of the city varies by about 18 m. The lowest elevations include the surface of lake Aasee and the ancient streambed of the river Aa, which divides the city diagonally from the southwest to the northeast, i.e., along the main wind aisle (2b in Figure 4). In that area, the urban development has a lower density than in the southeastern part of the city center. The northwestern part of the city offers free spaces in front of the castle. However, close to that location, the wind field was vertically shifted by densely planted trees with a height of about 30 m AGL; these trees surround the botanical garden behind the castle (data not shown in detail, see Section 4.1, Figure 1). Approaching the northeastern shore of the lake, the air took a direct path toward the cathedral square, avoiding significant changes in topographic elevation and major influences from urban roughness. At cathedral square, the air mass split up at the southwestern corner of the cathedral (Figure 6). One part passed the cathedral to its west, while the other part crossed cathedral square. In cathedral square itself, the highest wind speeds of 3 m s−1 were mainly found close to the eastern nave of the cathedral. As the air flow impacted the wall in an angle of 30°, it was deflected by its 30 m high vertical edge. Behind the corner of the nave, the air started recirculating due to the lower surface pressure [38], fostering an increase of wind speed to a value of up to 3.2 m s−1 at an altitude of 26 m ADM. Some of the air crossing cathedral square was diverted into southwestern direction with wind speeds below 1 m s−1. Due to wind approaching cathedral square from the street “Michaelisplatz”, the wind speed dropped to 0.03 m s−1 at the intersection with the street “Domplatz”. Air flows approaching the cathedral over the roofs of four-story buildings situated to the south of cathedral square only caused a slight downdraft of up to 0.26 m s−1 over the cathedral square.

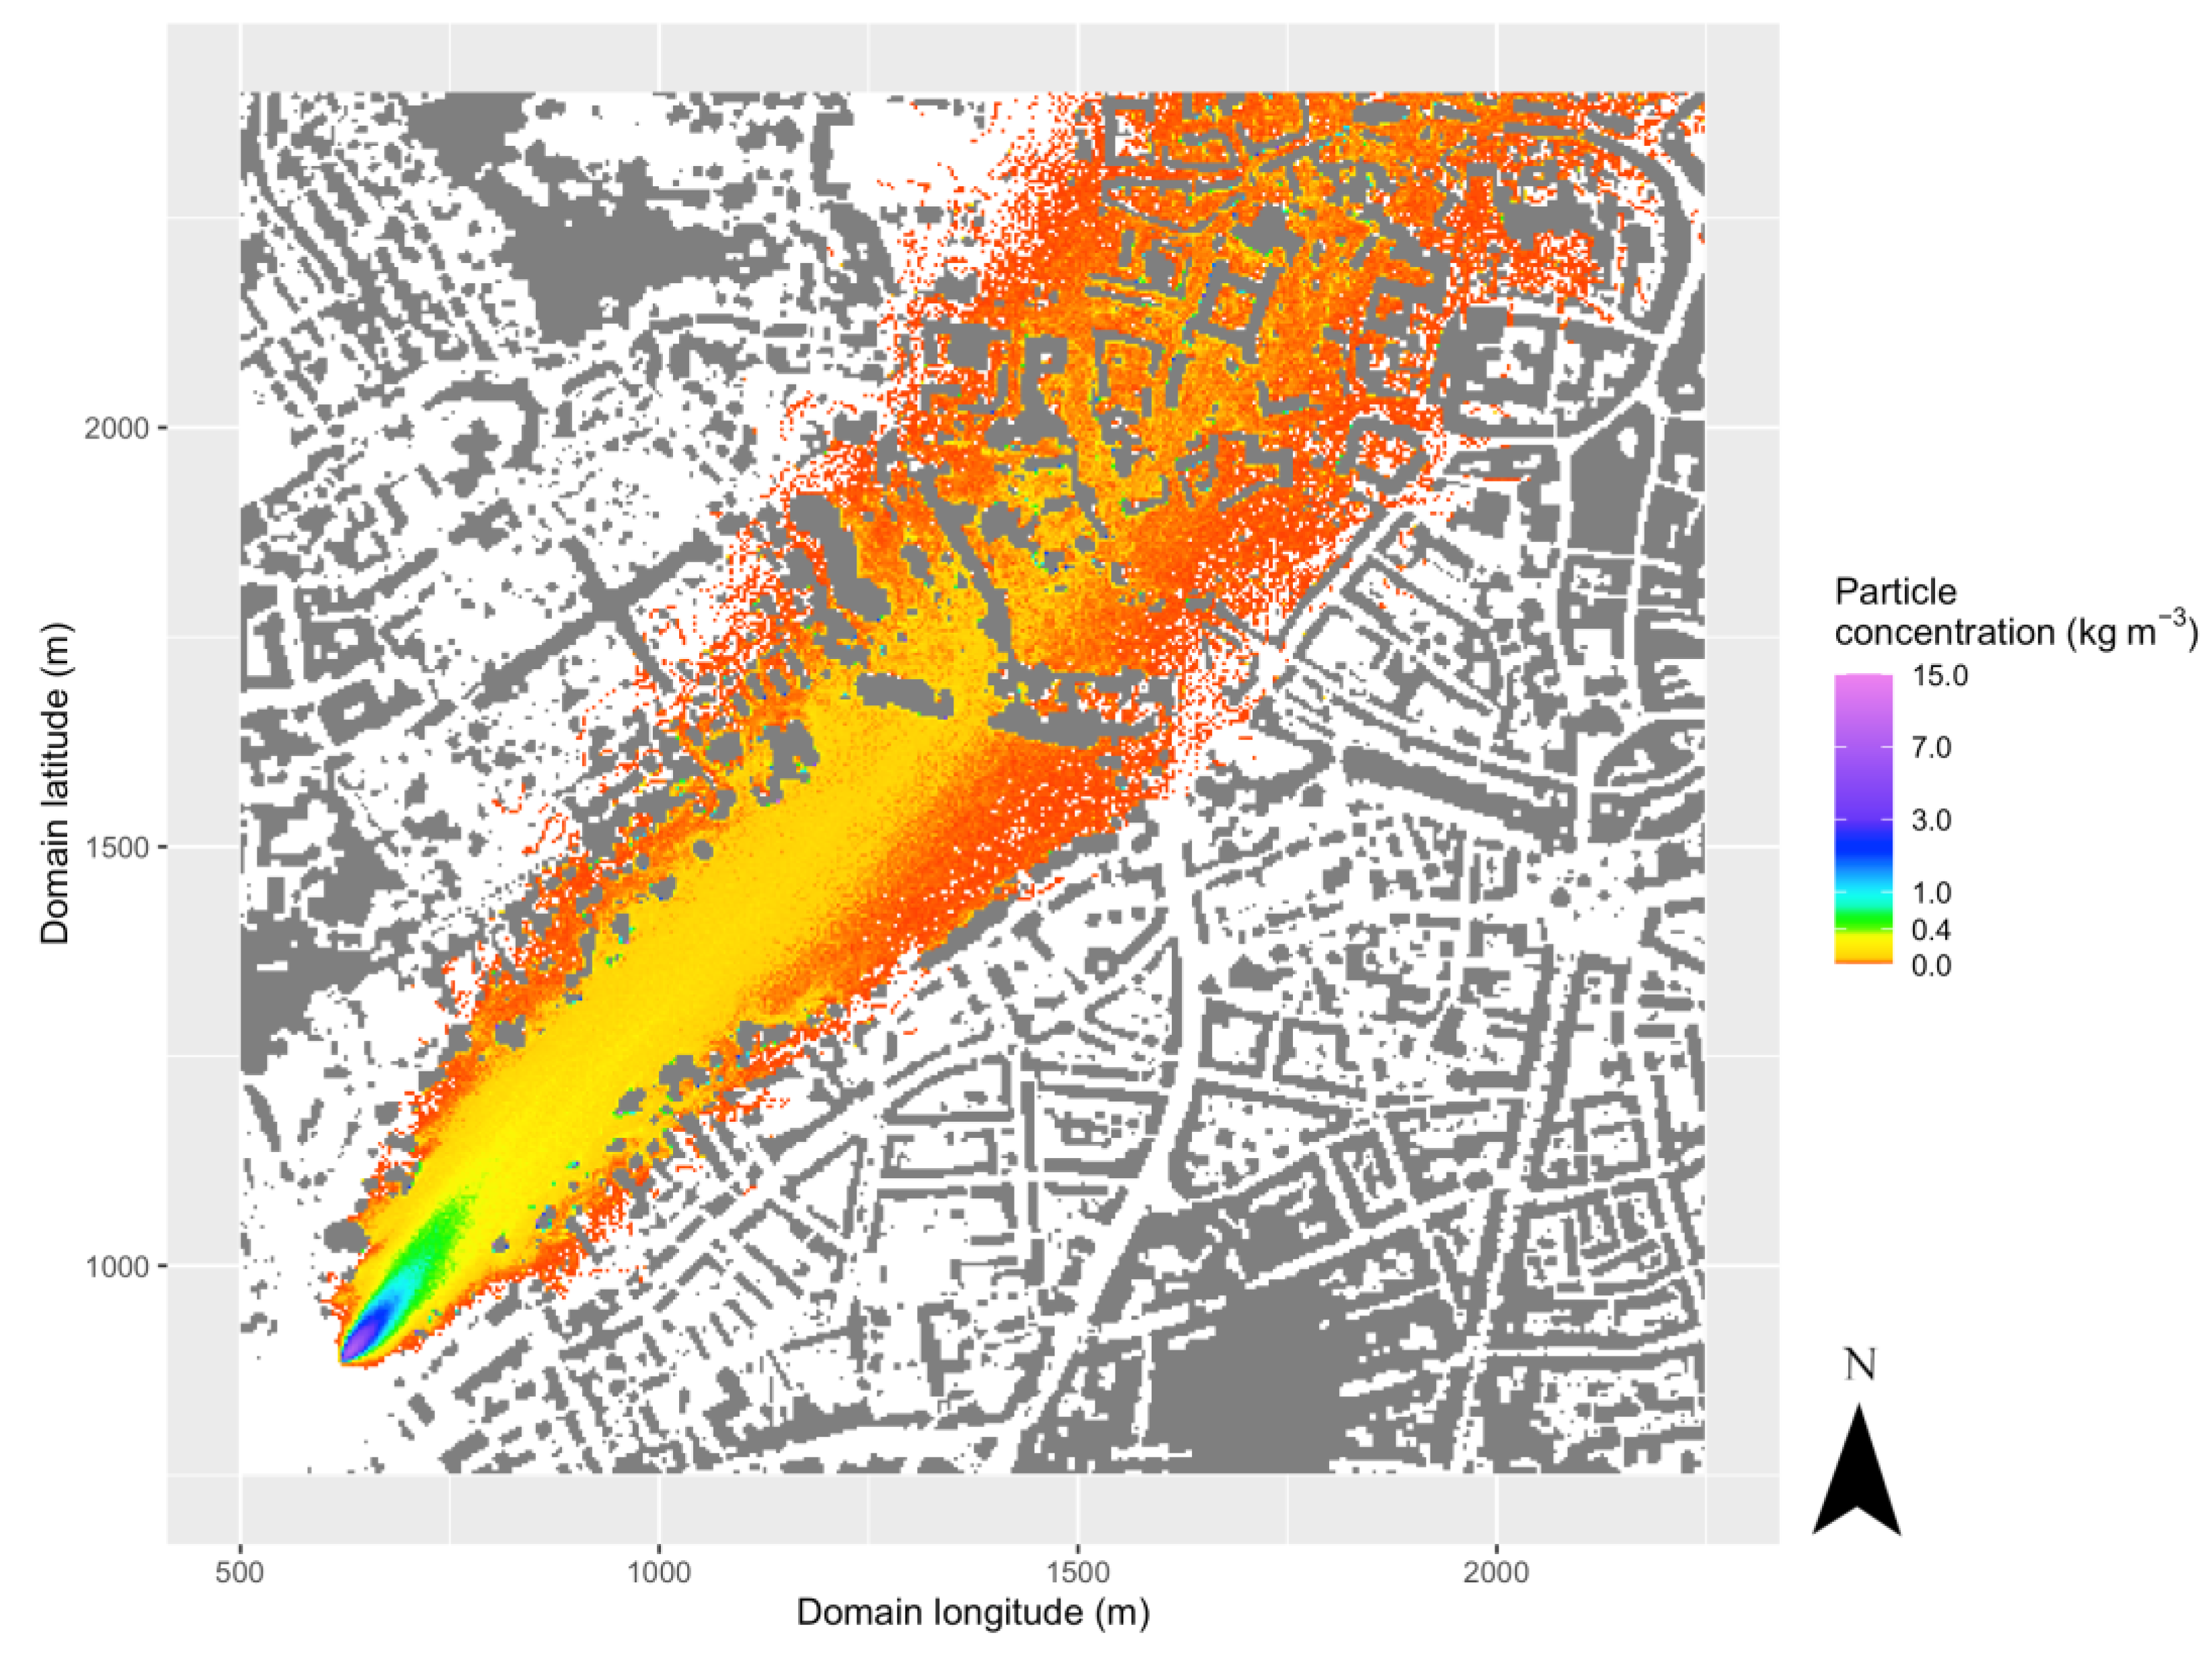
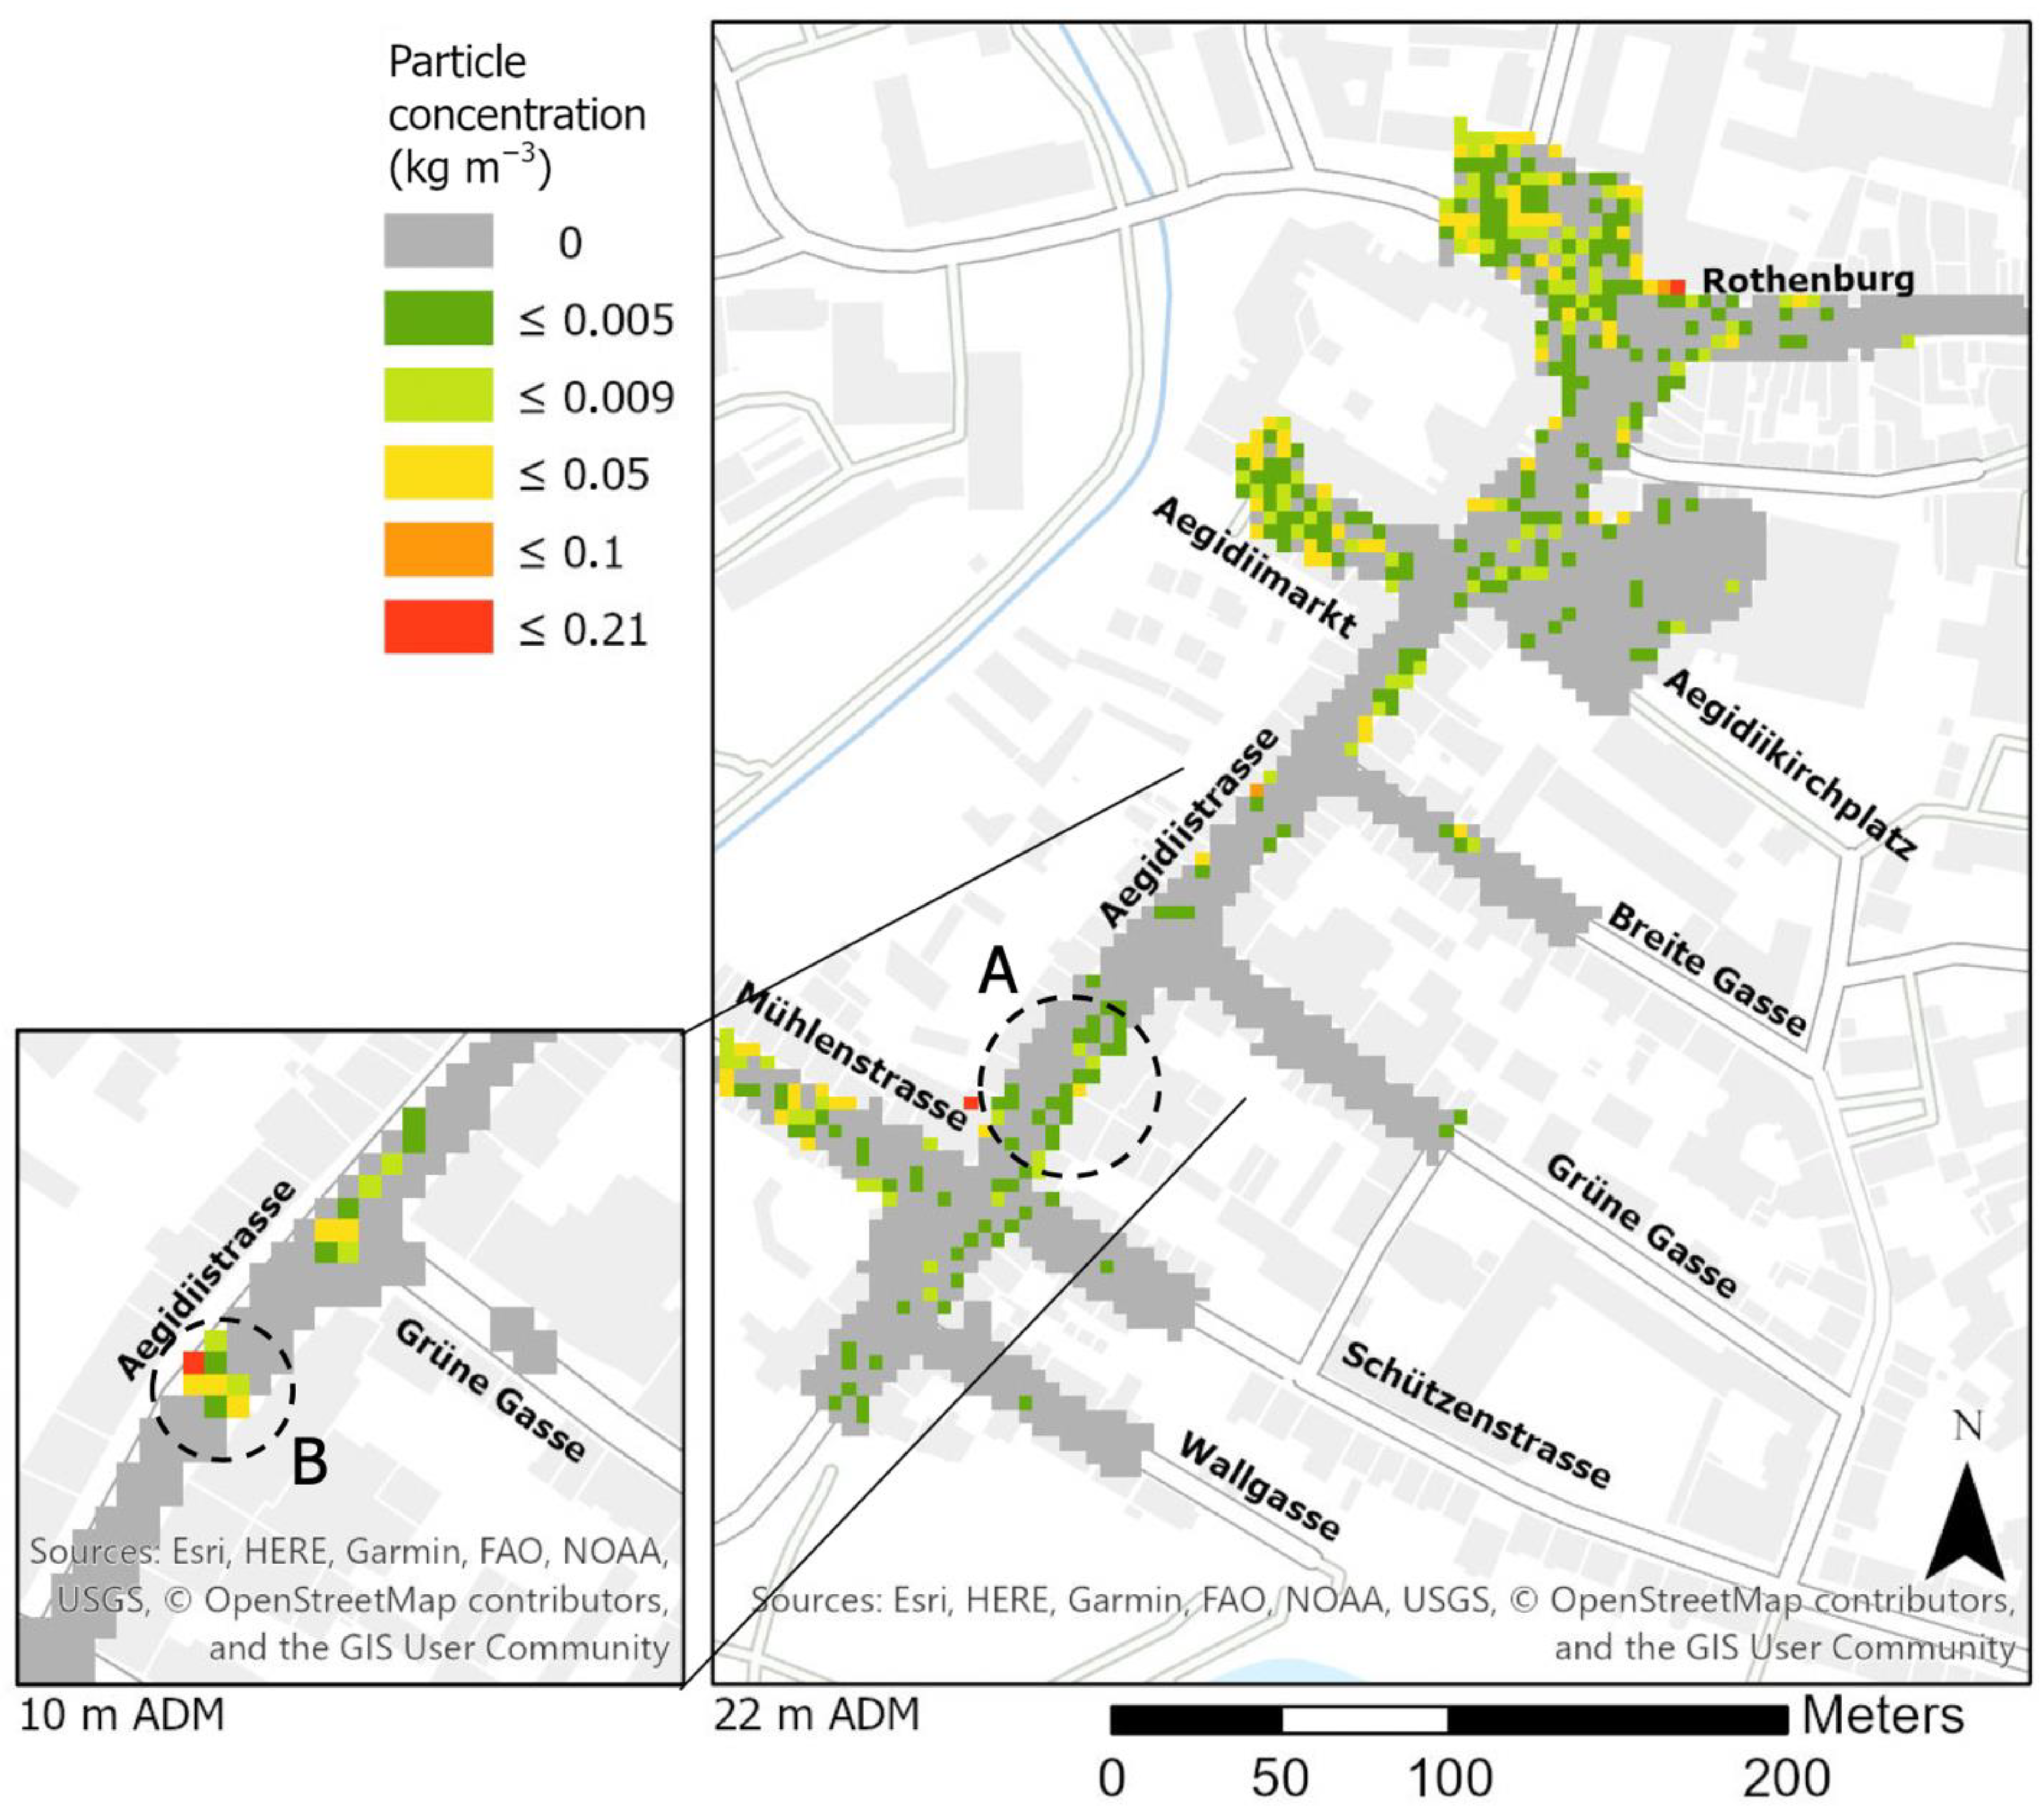
4.2. Particle Dispersion

After a simulation time of eight hours, particles followed the wind direction from their release point over the lake and dispersed over the northwestern part of the city center (Figure 7). Due to cyclic boundary conditions to generate mechanical turbulence within the model simulation (see Section 3.3), particles left the domain at the northern boundary and reentered it at the opposite boundary in the south. The reentered particles are not relevant for further analysis and will therefore be neglected. The main reason for the release of a passive scalar within the domain was that it functioned as a tracer for fresh air. It aimed to provide information on the air flow and on whether or to what extent the city center’s boundary layer was supplied with fresh air.
After leaving the source, the particles soon dispersed over the entire width of the lake. As they approached the northeastern shore after a travel distance of 1 km, the width of the particle plume was about 500 m covering 98% of the grid boxes with a particle concentration above zero. After another km of travel distance, the plume width had grown to only 640 m and included 99% of the particle grid boxes. Apparently, the lateral growth rate of the plume was smaller in the stable boundary layer air over the city. In the vertical direction, the particle plume grew steadily by only about 200 m per km horizontal travel distance.
Following the particle plume with wind direction at an altitude of 14 m ADM, the particle concentration soon decreased from a maximum of 80 kg m−3 at a distance of about 5 m from the source to 3.3 kg m−3 at a distance of 63 m from the source. At a distance above 150 m from the source, the concentration was below 1 kg m−3. According to the simulated stratification (see Section 3.3), only few particles passed Aegidiistrasse to reach cathedral square. Therefore, the focus of our further analysis was on whether any particles were detected near the ground within the city center, and, if yes, at which near-ground locations they were detectable.
High particle concentrations (>0.29 kg m−3) mainly occurred close to surfaces such as streets and building facades. Note that the accumulation of particles at surfaces can also be influenced by numerical effects of the LES model [41]. The physical interpretation of such results should therefore be treated with caution. On the other hand, particle wall accumulation calculated with LES tends to be underestimated overall compared to reference methods such as direct numerical simulations [42]. Figure 8 shows the particle concentration in the street canyon and intersecting side streets at an altitude of 22 m ADM. The high particle concentrations in the western side streets were caused by the main part of the particle plume located in the west. The canyon itself was only minorly in contact with particles; particle concentrations inside the street canyon increased with altitude. In the southern part of the street, high particle concentrations occurred at the eastern side of the street canyon. Before the particles entered the street canyon, they were transported by westerly wind (250°). Aegidiistrasse itself has an orientation of 217°; hence, higher particle concentrations occurred at the eastern side of the street, and the particle concentration was especially high after the intersection with “Mühlenstrasse” (area A in Figure 8). An exact trajectory of the particle-rich air could not be determined. The lack of particles at the intersection with Grüne Gasse could be associated with the described wind field in Section 4.1. The air flowing from Grüne Gasse into Aegidiistrasse, with a southeastern wind direction, had reduced wind speed in the street canyon, probably caused by a vortex behind the southern corner of the intersection (data not shown in detail). Downdrafts of up to 0.08 m s−1 occurred between area B in Figure 8 and the intersection of Aegidiistrasse and Grüne Gasse (process not shown in detail). The particle-rich air coming from the southwest was thus drafted down to the surface of the street at 10 m ADM (area B in Figure 8). Between the intersections with “Breite Gasse” and Aegidiimarkt, medium particle concentrations occurred close to the facades on the eastern side of the street. In the northern part of Aegidiistrasse, the particle concentration generally increased, as it was under stronger influence of the particle plume. Here, particles entered Aegidiistrasse from the street canyon of Aegidiimarkt.
In cathedral square, the amount of grid boxes containing particle concentrations was about 30% higher compared to Aegidiistrasse. At the western part of cathedral square, particle concentrations were higher, especially close to the ground. At higher altitudes, the concentrations at the center of cathedral square were also higher. Considering the particle plume passing the city center in the west, cathedral square was only minorly influenced by particles; this also coincides with increased particle concentrations in the western part of cathedral square. Close to the walls of the cathedral, only two grid cells showed an increased particle concentration of 0.1 kg m−3 and 0.12 kg m−3, respectively (22 m ADM). The concentrations in the surrounding grid cells were at least 12 times lower.

5. Conclusions

This study investigated the wind conditions within the city center of Münster, conjecturing the function of lake Aasee as a designated fresh air corridor under conditions of southwestern wind directions. In particular, we studied the wind conditions inside the street canyon of Aegidiistrasse concerning its contribution to the fresh air supply. A parallel LES using the model PALM was initialized with a measured wind and temperature profile. The simulation output revealed wind speeds over the lake that were three times higher than in the surrounding residential areas. Hence, a channeling effect could be determined. During the transition from the lake to the city center, the wind speed decreased by nearly 45%, and the wind field was displaced 16 to 20 m in the vertical direction.
Our results refute the initial hypothesis that air originating from the lake follows the street canyon in order to reach cathedral square: Under the condition of a southwestern wind direction and a stable boundary layer, the air took a direct path to the city center following the streambed of the river Aa and the streets Bispinghof, Johannisstrasse and Pferdegasse. Simulation results showed that air inside Aegidiistrasse did not reach cathedral square under southwestern wind conditions, which confirms previous studies. At the end of the street canyon, the air followed the street Rothenburg in the eastern direction. Considering the passive scalar as a valid tracer for fresh air, only half of the city center was supplied by fresh air coming from the lake under the given wind conditions and a stable boundary layer. Aegidiistrasse itself was only minorly influenced by fresh air particles. Comparing Aegidiistrasse and cathedral square, the particle contribution at cathedral square had roughly 30% more fresh air particles than Aegidiistrasse.
To better evaluate and validate the simulation results, additional case studies with altered simulation parameters are needed. The functionality of the fresh air corridor over the lake should be investigated under different meteorological conditions such as varying wind direction, wind speed, and boundary layer stratification in combination with an adapted horizontal pressure gradient. A special focus on Aegidiistrasse under the influence of different wind directions might show that air inside the street canyon indeed reaches cathedral square under certain conditions. Combined with a higher spatial resolution of the model, even more complex flow structures could have been resolved on a local scale. For example, the PALM module “grid nesting” is capable of increasing the number of grid boxes in a squared subsection of the domain. However, by increasing the number of grid boxes for a more detailed analysis, the required computational capacity and calculation time will increase as well. This is often likely associated with complications in the parallelization process on the respective high-performance computer.
Our findings show that under conditions of southwestern wind directions and a stable boundary layer, lake Aasee is a fresh air corridor. The approaching air reaches the city center on a direct path without detouring through the street canyon; instead, it travels above the rooftop level. This work further proved that the simulation model PALM fulfils the necessary requirements for qualitative research on potential fresh air corridors.

Author Contributions

Conceptualization, J.L.B., B.P. and O.K.; data curation, J.L.B. and B.P.; formal analysis, J.L.B.; investigation, J.L.B.; methodology, J.L.B. and B.P.; project administration, J.L.B., B.P. and O.K.; resources, B.P. and O.K.; software, J.L.B.; supervision, B.P.; validation, J.L.B., B.P. and O.K.; visualization, J.L.B.; writing—original draft, J.L.B.; writing—review and editing, J.L.B., B.P. and O.K. All authors have read and agreed to the published version of the manuscript.

Funding

This research received no external funding.

Data Availability Statement

Publicly available datasets were analyzed in this study. This data can be found here: https://www.geoportal.nrw/ (accessed on 20 March 2021).

Acknowledgments

Special appreciation goes to the IT service of the University of Münster for the opportunity to perform model calculations on the high-performance computer PALMA II. We thank Celeste Brennecka for language editing of the manuscript. Maps throughout this research article were created using ArcGIS® software by Esri. ArcGIS® and ArcMap™ are the intellectual property of Esri and are used herein under license. Copyright © Esri. All rights reserved. For more information about Esri® software, please visit www.esri.com (accessed on 20 March 2021). We thank two anonymous reviewers who helped to improve the manuscript.

Conflicts of Interest

The authors declare no conflict of interest.

References

  1. Rudnicka, J. Grad Der Urbanisierung in Deutschland. Available online: https://de.statista.com/statistik/daten/studie/662560/umfrage/urbanisierung-in-deutschland/ (accessed on 19 March 2021).
  2. Aktuelle Trends der Wohnungsbautätigkeit in Deutschland—Wer Baut Wo Welche Wohnungen? Bundesinstitut für Bau-, Stadt- und Raumforschung (BBSR) im Bundesamt für Bauwesen und Raumordnung (BBR): Bonn, Germany, 2016; ISBN 978-3-87994-189-6.
  3. Lineback, N. Geography in the News: The Growth of Megacities. Available online: https://blog.nationalgeographic.org/2014/02/17/geography-in-the-news-the-growth-of-megacities/ (accessed on 11 November 2020).
  4. Wilke, S. Treibhausgas-Emissionen in Deutschland. Available online: https://www.umweltbundesamt.de/daten/klima/treibhausgas-emissionen-in-deutschland (accessed on 17 November 2020).
  5. Destatis, Statistisches Bundesamt Manufacturing in November 2020: Unfilled Orders +0.8% on the Previous Month. Available online: https://www.destatis.de/EN/Press/2021/01/PE21_026_421.html (accessed on 13 February 2021).
  6. Destatis, Statistisches Bundesamt German Economy Grew 0.6% in 2019. Available online: https://www.destatis.de/EN/Press/2020/01/PE20_018_811.html (accessed on 13 February 2021).
  7. Frischluftzufuhr. Städtebauliche Klimafibel; Ministerium für Verkehr und Infrastruktur: Baden-Württemberg, Stuttgart, 2015. [Google Scholar]
  8. Bavarian State Office for Environmental Protection. Klima und Immissionsschutz im Landschaftsplan 2004. Available online: https://www.lfu.bayern.de/umweltkommunal/doc/lfu_37.pdf (accessed on 19 March 2021).
  9. Stadt Münster “Münster Am See”: Leitbild Und Nutzungskonzept Für Den Aasee. Available online: http://www.presse-service.de/data.aspx/static/754851.html (accessed on 19 March 2021).
  10. Sullivan, P.P.; McWilliams, J.C.; Moeng, C.-H. A Subgrid-Scale Model for Large-Eddy Simulation of Planetary Boundary-Layer Flows. Bound. Layer Meteorol. 1994, 71, 247–276. [Google Scholar] [CrossRef] [Green Version]
  11. Maronga, B.; Gryschka, M.; Heinze, R.; Hoffmann, F.; Kanani-Sühring, F.; Keck, M.; Ketelsen, K.; Letzel, M.O.; Sühring, M.; Raasch, S. The Parallelized Large-Eddy Simulation Model (PALM) Version 4.0 for Atmospheric and Oceanic Flows: Model Formulation, Recent Developments, and Future Perspectives. Geosci. Model Dev. 2015, 8, 2515–2551. [Google Scholar] [CrossRef] [Green Version]
  12. Gronemeier, T.; Surm, K.; Harms, F.; Leitl, B.; Maronga, B.; Raasch, S. Validation of the Dynamic Core of the PALM Model System 6.0 InUrban Environments: LES AndWind-Tunnel Experiments. Available online: https://gmd.copernicus.org/preprints/gmd-2020-172/ (accessed on 19 March 2021).
  13. Kurppa, M.; Hellsten, A.; Auvinen, M.; Raasch, S.; Vesala, T.; Järvi, L. Ventilation and Air Quality in City Blocks Using Large-Eddy Simulation—Urban Planning Perspective. Atmosphere 2018, 9, 65. [Google Scholar] [CrossRef] [Green Version]
  14. Paas, B.; Zimmermann, T.; Klemm, O. Analysis of a Turbulent Wind Field in a Street Canyon: Good Agreement between LES Model Results and Data from a Mobile Platform. Meteorol. Z. 2020. [Google Scholar] [CrossRef]
  15. Wang, W.; Xu, Y.; Ng, E.; Raasch, S. Evaluation of Satellite-Derived Building Height Extraction by CFD Simulations: A Case Study of Neighborhood-Scale Ventilation in Hong Kong. Landsc. Urban Plan. 2018, 170, 90–102. [Google Scholar] [CrossRef]
  16. Raasch, S.; Schröter, M. PALM—A Large-Eddy Simulation Model Performing on Massively Parallel Computers. Meteorol. Z. 2001, 363–372. [Google Scholar] [CrossRef]
  17. Stadtplanungsamt Münster Allgemeines Über Münster. Available online: https://www.stadt-muenster.de/fileadmin//user_upload/stadt-muenster/61_stadtentwicklung/pdf/jahr/Jahres-Statistik_2019_Allgemeines_ueber_Muenster.pdf (accessed on 19 March 2021).
  18. DWD Klimadaten Deutschland—Monats- Und Tageswerte (Archiv). Available online: https://opendata.dwd.de/climate_environment/CDC/observations_germany/climate/monthly/kl/historical/monatswerte_KL_01766_19891001_20191231_hist.zip (accessed on 22 August 2020).
  19. Leibnitz Universität Hannover Large-Eddy Simulation: PALM Work Group & Junior Research Group. Available online: https://www.muk.uni-hannover.de/243.html?&L=1 (accessed on 19 March 2021).
  20. Maronga, B. PALM. Available online: https://palm.muk.uni-hannover.de/trac/wiki/palm (accessed on 19 March 2021).
  21. Wicker, L.J.; Skamarock, W.C. Time-Splitting Methods for Elastic Models Using Forward Time Schemes. Mon. Wea. Rev. 2002, 130, 2088–2097. [Google Scholar] [CrossRef]
  22. Williamson, J.H. Low-Storage Runge-Kutta Schemes. J. Comput. Phys. 1980, 35, 48–56. [Google Scholar] [CrossRef]
  23. Deardorff, J.W. Cloud Top Entrainment Instability. J. Atmos. Sci. 1980, 37, 131–147. [Google Scholar] [CrossRef] [Green Version]
  24. Moeng, C.-H.; Wyngaard, J.C. Spectral Analysis of Large-Eddy Simulations of the Convective Boundary Layer. J. Atmos. Sci. 1988, 45, 3573–3587. [Google Scholar] [CrossRef] [Green Version]
  25. Saiki, E.M.; Moeng, C.-H.; Sullivan, P.P. Large-Eddy Simulation Of The Stably Stratified Planetary Boundary Layer. Bound. Layer Meteorol. 2000, 95, 1–30. [Google Scholar] [CrossRef] [Green Version]
  26. Maronga, B. Subgrid-Scale Model—PALM. Available online: https://palm.muk.uni-hannover.de/trac/wiki/doc/tec/sgs#deardorff-sgs (accessed on 22 July 2020).
  27. PALM group—Leibnitz Universität Hannover Boundary Conditions—Topography Implementation within the PALM Model. Available online: https://palm.muk.uni-hannover.de/trac/wiki/doc/tec/bc#Topography (accessed on 18 February 2021).
  28. Bundesamt für Kartographie und Geodäsie GEOportal.NRW. Available online: https://www.geoportal.nrw/ (accessed on 1 January 2019).
  29. Franke, J.; Hellsten, A.; Schlünzen, H.; Carissimo, B. The COST 732 Best Practice Guideline for CFD Simulation of Flows in the Urban Environment: A Summary. Int. J. Environ. Pollut. 2011, 44, 419–427. [Google Scholar] [CrossRef]
  30. RStudio Team. RStudio: Integrated Development for R; RStudio, Inc.: Boston, MA, USA, 2019. [Google Scholar]
  31. Nychka, D.; Furrer, R.; Paige, J.; Sain, S. Fields: Tools for Spatial Data. Available online: https://cran.r-project.org/web/packages/fields/index.html (accessed on 19 March 2021).
  32. Wickham, H. Ggplot2: Elegant Graphics for Data Analysis; Springer: New York, NY, USA, 2016; ISBN 978-3-319-24277-4. [Google Scholar]
  33. Pierce, D. Ncdf4: Interface to Unidata NetCDF (Version 4 or Earlier) Format Data Files. Available online: https://cran.r-project.org/web/packages/ncdf4/index.html (accessed on 19 March 2021).
  34. Hijmans, R.J. Raster: Geographic Data Analysis and Modeling. Available online: https://cran.r-project.org/web/packages/raster/index.html (accessed on 19 March 2021).
  35. Wickham, H. Reshaping Data with the Reshape Package. J. Stat. Softw. 2007, 21, 1–20. [Google Scholar] [CrossRef]
  36. Google LLC. Google Maps. Available online: https://www.google.com/maps/@51.9603566,7.6260652,14.5z (accessed on 18 June 2020).
  37. Halvorson, S.; Liu, Y.; Sheu, R.; Basara, J.; Bowers, J.; Warner, T.; Swerdlin, S. Mesoscale and Urban-Scale Modeling Support for the Oklahoma City Joint-Urban 2003 Field Program. Available online: https://ams.confex.com/ams/84Annual/techprogram/paper_72555.htm (accessed on 19 March 2021).
  38. Oke, T.R.; Mills, G.; Christen, A.; Voogt, J.A. Urban Climates; Cambridge University Press: Cambridge, UK, 2017; ISBN 978-0-521-84950-0. [Google Scholar]
  39. Lee, D.O. The Influence of Atmospheric Stability and the Urban Heat Island on Urban-Rural Wind Speed Differences. Atmos. Environ. (1967) 1979, 13, 1175–1180. [Google Scholar] [CrossRef]
  40. Foken, T. Angewandte Meteorologie: Mikrometeorologische Methoden, 2nd ed.; Springer: Berlin, Heidelberg, 2006; ISBN 978-3-540-38202-7. [Google Scholar]
  41. Marchioli, C. Large-Eddy Simulation of Turbulent Dispersed Flows: A Review of Modelling Approaches. Acta Mech. 2017, 228, 741–771. [Google Scholar] [CrossRef] [Green Version]
  42. Marchioli, C.; Salvetti, M.V.; Soldati, A. Some Issues Concerning Large-Eddy Simulation of Inertial Particle Dispersion in Turbulent Bounded Flows. Phys. Fluids 2008, 20, 040603. [Google Scholar] [CrossRef] [Green Version]
Figure 1. Map of Münster with meteorological measurement towers next to “Steinfurter Strasse” and on the rooftop of GEO1. Topography data for the computational domain area were used as input for the simulation software PALM. Simulation results for the area of interest were analyzed.
Atmosphere 12 00401 g001
Figure 2. Composed wind speed and temperature profile for Münster, 5 December 2018, 00:00 UTC; dashed line: maximum height of the model domain (1200 m).
Atmosphere 12 00401 g002
Figure 3. Mean wind speed above the water surface of the lake for (b) five different cross sections and at (a) six altitudes ADM (given altitudes represent the height of the midpoints for the first six grid box layers above the water surface).
Atmosphere 12 00401 g003
Figure 4. Wind aisles and their mean wind speed at an altitude of 26 m above domain minimum (ADM).
Atmosphere 12 00401 g004
Figure 5. Mean wind speed at five different altitudes (a) within the street canyon of Aegidiistrasse (b).
Atmosphere 12 00401 g005
Figure 6. Wind flow path from lake “Aasee” to cathedral square at an altitude of 22 m ADM.
Atmosphere 12 00401 g006
Figure 7. Particle dispersion in the area of interest above the city center at an altitude of 18 m (grey: topography; white: street canyons and open spaces without particles).
Atmosphere 12 00401 g007
Figure 8. Particle concentration in the street canyon of Aegidiistrasse and intersecting side streets.
Atmosphere 12 00401 g008
Table 1. Origin of measured data used for composing the wind and temperature profiles; T: temperature only, W: wind only (source of coordinates: Google Maps [36]), also see Figure 1.
Station No.LocationCoordinatesTypeMeasurement Altitude (m) AGL
Station 1Steinfurter Strasse, Münster51.98009° N, 7.59962° ETower2 (T), 4 (W), 10
Station 2GEO1, Münster51.96930° N, 7.59588° ETower34
Station 3DWD, Essen51.40418° N, 6.96815° ERadiosonde147, 219, 268, 849, 1431, 1478, 1524, 1846, 2198, 2268, 2471, 2492
Publisher’s Note: MDPI stays neutral with regard to jurisdictional claims in published maps and institutional affiliations.

