Article

Refined Characteristics of Moisture Cycling over the Inland River Basin Using the WRF Model and the Finer Box Model: A Case Study of the Heihe River Basin

1
Key Laboratory of Tibetan Environmental Changes and Land Surface Processes, National Tibetan Plateau Data Center, Institute of Tibetan Plateau Research, Chinese Academy of Sciences, No. 16 Lincui Road, Chaoyang District, Beijing 100101, China
2
Key Laboratory of Remote Sensing of Gansu Province, Northwest Institute of Eco-Environment and Resources, Chinese Academy of Sciences, Lanzhou 730000, China
3
The Graduate School (Beijing) of Science and Technology, University of the Chinese Academy of Sciences, Beijing 100049, China
*
Authors to whom correspondence should be addressed.
Atmosphere 2021, 12(3), 399; https://doi.org/10.3390/atmos12030399
Submission received: 3 February 2021 / Revised: 15 March 2021 / Accepted: 16 March 2021 / Published: 20 March 2021

Abstract

:
The Heihe River Basin (HRB), located on the northeastern edge of the Tibetan Plateau, is the second-largest inland river basin in China, with an area of 140,000 km2. The HRB is a coupling area of the westerlies, the Qinghai–Tibet Plateau monsoon and the Southeast monsoon circulation system, and is a relatively independent land-surface water-circulating system. The refined characteristics of moisture recycling over the HRB was described by using the Weather Research and Forecasting (WRF) model for a long-term simulation, and the “finer box model” for calculating the net water-vapor flux. The following conclusions were drawn from the results of this study: (1) The water vapor of the HRB was dominantly transported by the wind from the west and from the north, and the west one was much larger than the north one. The net vapor transported by the west wind was positive, and by the north wind was negative. (2) The precipitation over the HRB was triggered mainly by the vapor from the west, which arose from the lower vertical layer to higher one during transporting from west to east. The vapor from the north sank from a higher layer to a lower one, and crossed the south edge of the HRB. (3) The moisture-recycling ratio of evapotranspiration to precipitation over the HRB was much higher than the other regions, which may be due to the strong land–atmosphere interaction in the arid inland river basin.

1. Introduction

Moisture recycling is the contribution of regional moisture to precipitation in a region [1,2,3,4]. It has the ability to inhibit extreme precipitation-induced hydrological events [5,6], and reflects the memory of soil moisture and the continuous abnormality of dry and wet conditions [7]. A comprehensive understanding of the regional moisture-recycling process not only is the key to understanding the regional water cycle and surface land–atmosphere interaction [8,9], but also plays the main role in improving future climate-change projections.
Generally, the rate of moisture recycling depends heavily on the spatial scale of the study area and its regional atmospheric circulation. The smaller the spatial scale is, the lower the moisture-recycling rate [1]. The moisture-recycling rate is nearly 1 at the global scale, approximately 40% at the continent scale, and generally less than 20% at a scale of 1000 km2 [10,11,12]. However, the contribution of regional evaporation to precipitation is high [13], and far greater than 20% in the inland river basin, which is at the regional scale of 106 km2, due to the strong land–atmosphere interaction. Zhao et al. [14] reported that the contributions of recycled moisture to precipitation in the upper, middle, and lower reaches of the Heihe River Basin (HRB) are approximately 52.4%, 56.5%, and 21.4%, respectively, and that recycled moisture (especially transpiration) plays an important role in regional precipitation redistribution. The inland river basin is located in the hinterland of the continent and far away from the ocean. No sufficient source of water vapor exists, and the runoff generated by rainfall or alpine snow melting in the inland mountainous area cannot flow into the sea, and finally is infiltrated in the local basin. The inland river basin is an ideal hydrometeorological research region that exchanges water and energy with the external world within a clear boundary [15].
However, compared to the relatively simple process of marine inner water cycling, the moisture recycling of the inland river basin is much more complicated because of the spatial heterogeneity and diversity of its complex underlying surface. Generally, the inland river basin originates from a mountainous area and extends to a desert [16]. In the high mountainous upper reaches of the inland river basin, diverse underlying surfaces of glaciers, snow, frozen soil, and alpine forest meadow can be found, and a mountainous “water tower” can be observed overhead, a result of water vapor being intercepted from the outside. In the middle reaches, the Gobi Desert, an oasis, a unique artificial water channel, and farmland can be seen on the surface, with runoff flowing through formed by precipitation from upstream. In the downstream of the inland river basin, the river is injected into the terminal lake or is infiltrated in the desert. These complex underlying surfaces make it difficult to describe the process of precipitation and evapotranspiration in the inland river basin; therefore, the moisture recycling of the basin is much more complex.
Meanwhile, with global climate change, the uncertainty of moisture recycling in the inland river basin has increased. The fifth assessment report of the Intergovernmental Panel on Climate Change (IPCC) noted the lack of doubt regarding the warming of the climate system. Since 1850, the global average temperature increases by 0.85 degrees from 1880 to 2012 [17]. According to the National Oceanic and Atmospheric Administration, the increase in temperatures over the first 15-year period of the 21st century were almost equal to the increases that occurred over the entire last half of the 20th century [18]. The increase in temperature means that increasingly more precipitation reaching the ground will evaporate into the atmosphere. Due to the insufficient precipitation and the fragile ecological environment, the arid inland river basin is vulnerable to global climate change; therefore, moisture recycling and changes mechanism in the arid inland river basin must be carried out to against the background of climate change and to propose regional vulnerability response methods.
Long-term, high-resolution, atmospheric numerical simulation helps to precisely refine the characterization of the moisture-recycling process in the inland river basin. Long-term data help to reduce the bias and to reveal the trend of moisture recycling. Higher resolution improves not only the land-surface representation, but also the ability of regional climate models to simulate important small-scale precipitation processes [19], such as convective phenomena that are generally considered to be sufficiently resolved at a less than approximately 5 km spatial resolution [20].
Generally, the box model is widely used to calculate the regional water and energy mass balance as the mass difference between the input and the output in a certain region at a specific time [21,22,23,24]. However, most researchers take the entire research region as a box, which obliterates the jagged complex edge of the natural topography.
In this paper, moisture recycling over the inland Heihe River Basin is calculated based on the Weather Research and Forecasting (WRF) model at a 5 km spatial resolution and an hourly temporal resolution from 2000 to 2015 using the finer box model. This study aims to describe the specific characteristics of water-vapor transport over the inland river basin and calculate the contribution of local evapotranspiration to precipitation over the HRB with a relatively independent land-surface water-circulation system. The WRF model is proved to be credible over the inland river basin [25,26]. The HRB, located on the northeastern edge of the Tibetan Plateau, is the second-largest inland river basin in China, with an area of 140,000 km2, and is an area coupling the Tibetan Plateau, Mongolia Plateau, and Loess Plateau. This region is mainly dominated by westerly winds, though polar north winds also function as a relatively independent land water-circulating system; hence, it as an ideal research region for examining the atmosphere, hydrology, ecology, and multispheres.
The next section introduces the research region, WRF model configuration, moisture-recycling method, and finer box model. The results are shown in Section 3 and discussed in Section 4, and conclusions are drawn in Section 5.

2. Research Region, WRF Model Configuration, and Methods

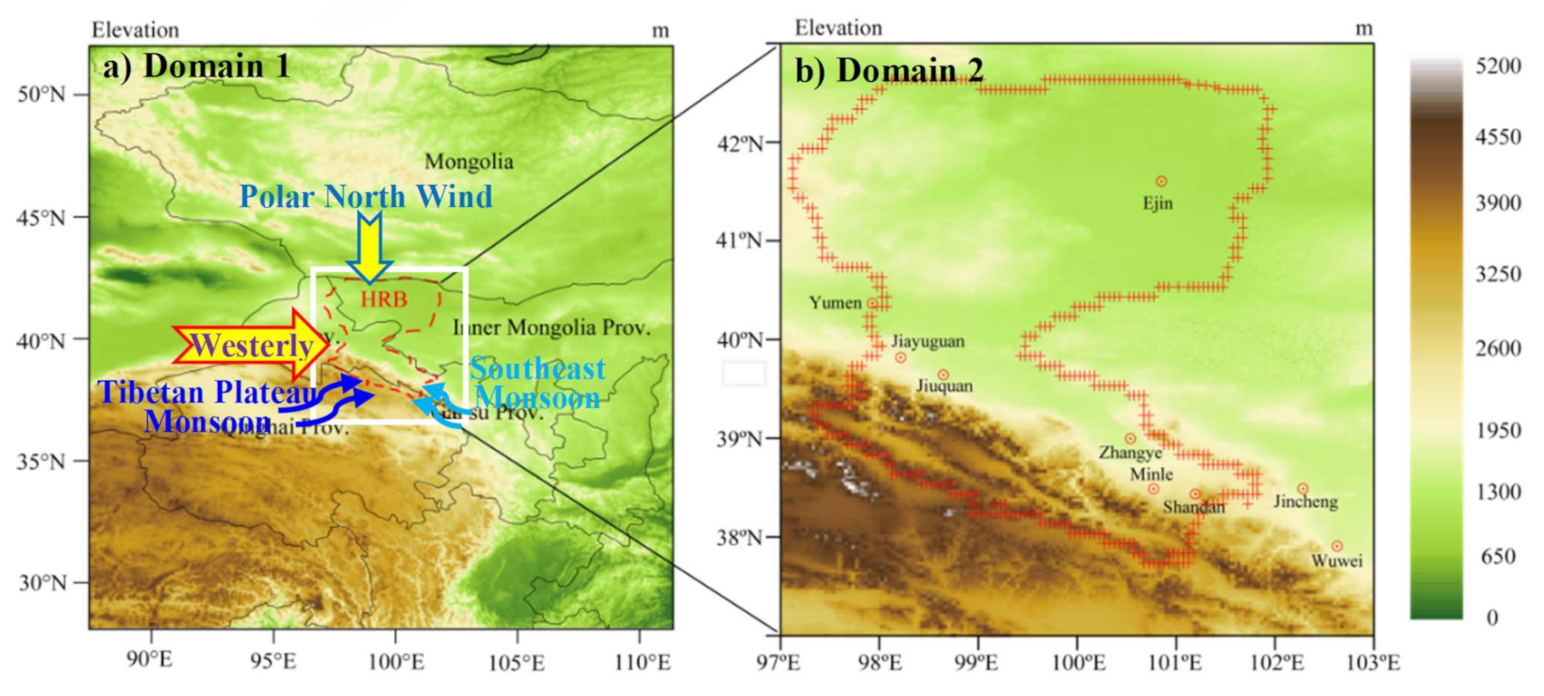
2.1. Research Region

The HRB is regarded as an ideal test bed and field laboratory for land-surface or hydrological experiments [27,28], located at the junction of the Qinghai Tibet Plateau, Loess Plateau, and Mongolia Plateau (Figure 1). The HRB originates from glacial meltwater and precipitation in the Qilian Mountains and flows through the provinces of Qinghai, Gansu, and Inner Mongolia. It can be divided into three parts: the upper reaches, with elevations ranging from 2000–5500 m and precipitation ranging from 250~500 mm; the middle reaches, being defined as the reach between Yingluo Gorge and Zhengyi Gorge, with elevations ranging from 1000–2000 m and precipitation ranging from 100~250 mm; and the lower reaches, with elevations of less than 1000 m and precipitation of less than 100 mm. The basin climate is mainly controlled by the westerlies throughout the year [29,30]. From the upper reaches to the lower reaches, glacier, permafrost, oasis, bare, and Gobi Desert areas are distributed. The diverse landscape makes the HRB an ideal watershed for scientific research. Comprehensive experiments, including the Heihe Basin Field Experiment [31], Watershed Allied Telemetry Experimental Research [32], and Heihe Watershed Allied Telemetry Experimental Research [28], have been conducted in the HRB.
As shown in Figure 1, the water-vapor transport in the HRB can be controlled by westerly wind, polar north wind, the Tibetan Plateau monsoon and the Southeast monsoon. However, water-vapor transport by the Tibetan Plateau and Southeast monsoons is obstructed by the Qilian Mountains because of their high elevation, so part of it is converted into precipitation in the region south of the HRB, and another part turns eastward [33,34,35]. Therefore, the water-vapor transport by the Tibetan Plateau and Southeast monsoons is negligible in the HRB.

2.2. WRF Model Configuration

The Advanced Research WRF [36] version 3.5 modeling system was used in this study. The model includes Arakawa C-grid staggering for a horizontal grid, a fully compressible system of equations, terrain-following hydrostatic pressure with vertical grid stretching, and a third-order Runge–Kutta scheme for time-split integration. The WRF physical configuration (Table 1) used in this study consisted of the WRF single-moment 5-class scheme [37] as the microphysics option, the Kain–Fritsch scheme [38] as the cumulus convection parameterization option, the Yonsei University scheme [39] as the planetary boundary layer (PBL) option, a 5-layer thermal diffusion scheme as the land-surface model option, and the Dudhia scheme [40] and the rapid radiative transfer model scheme [41] as the shortwave and longwave radiation options, respectively.
This study used two-way nested computational domains with 60 × 60 × 40 and 130 × 130 × 40 grid points and horizontal resolutions of 25 km and 5 km, respectively. Two-way nesting was used to perform the model simulations (Figure 1) in a scheme in which domains at different grid resolutions were run simultaneously and communicated with each other. The coarser domain was forced with the reanalysis data sets of the Final Analysis (FNL) from the National Center for Environmental Prediction (NCEP), and provided initial and boundary conditions for the finer nested domain, which feeds its calculations back to the coarser domain.

2.3. Moisture Recycling Estimation Method

As described in Global Energy and Water Cycle Experiment (GEWEX) [42], the following components of the water cycle exist for a river basin: (1) net inflow of water vapor through the lateral atmospheric boundaries of the basin; (2) net transfer of water from the atmosphere to the surface by excess precipitation over evapotranspiration; and (3) river discharge from the basin to the ocean. Because the HRB is an inland river basin, the water cycle includes only (1) and (2). The water-balance equations for the atmosphere and land are shown as below:
d q a + q l / d t = C q N l N q
  d q a / d t = C q P E = 1 g 0 p s q d p
d q l / d t = P E N l
C q = 1 g 0 p s · W q d p N q
N q =   β q a
γ = P C q N q P
where q a and q l are the total atmospheric and land water masses per unit horizontal area; C q is the net inflow of atmospheric water to the basin; N l is the net land runoff, which is the outflow from the area of interest; N q is the net change in condensed water in the air; P and E are the precipitation and evapotranspiration fluxes at the ground level, respectively; q is the specific humidity; p is the pressure; and p s is the pressure at the top of the atmosphere. Because the inland river basin is a relatively independent water-circulating system, here, N l is equal to 0. Generally, N q is assumed to be negligible; however, warmer temperatures increase the rate of evaporation of water into the atmosphere, in effect increasing the atmosphere’s capacity to hold water. With global warming, the water-holding capability improves, which means that the atmospheric water storage increases, and its change N q cannot be ignored. W = u , v , w is the wind component at x, y, z directions; g is the gravitational constant; β is the rate of annual change in the total atmospheric water mass; and γ is the regional moisture-recycling ratio.

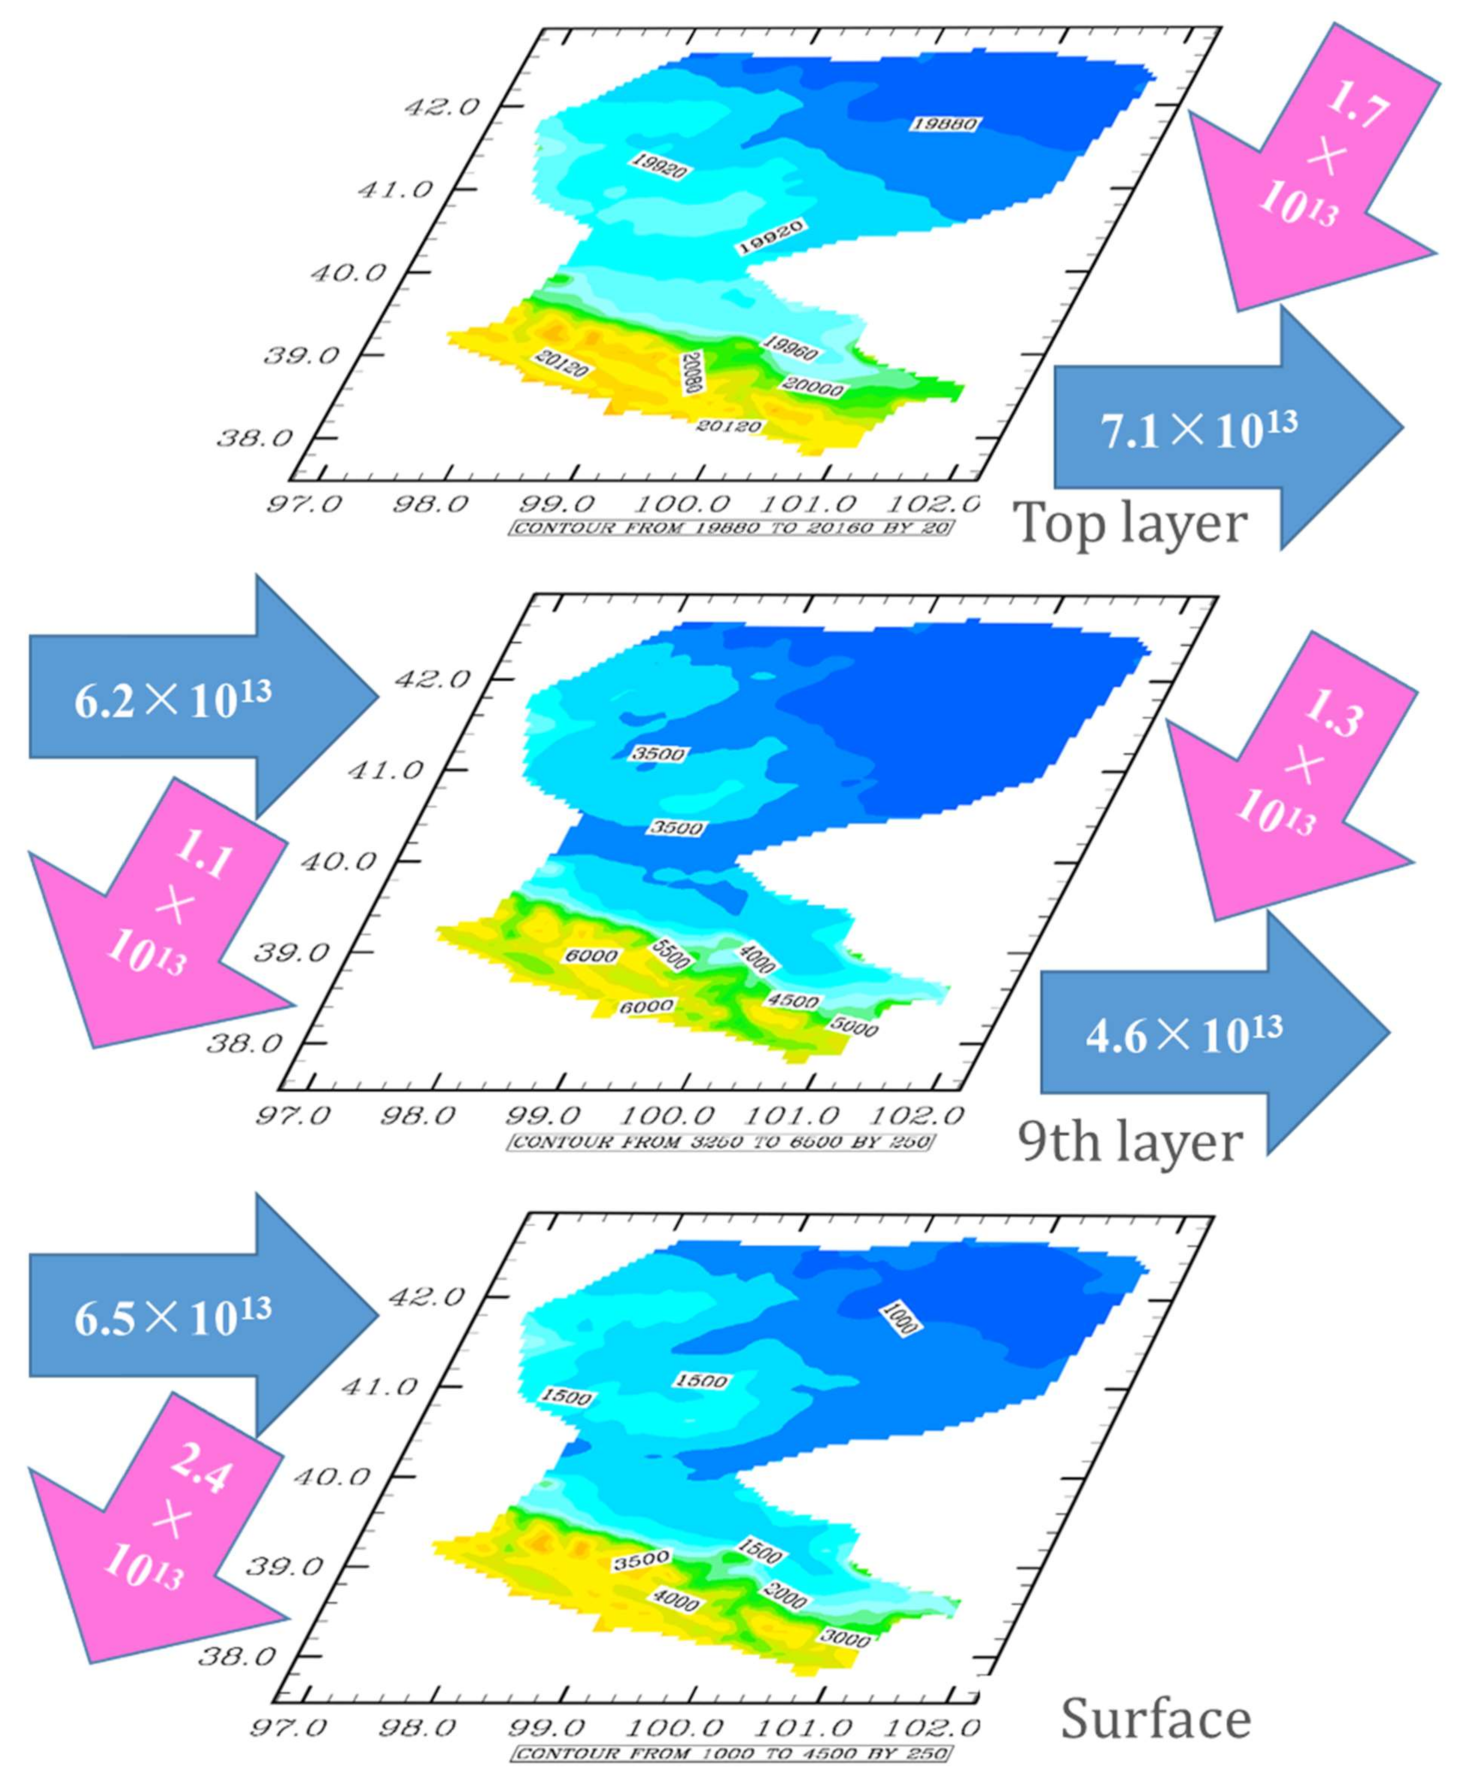
2.4. Finer Box Model for Calculating the Net Water Vapor Flux

Generally, the water vapor flux is calculated by considering the entire research region as a box; this is known as the box model. This method is quite rough, obliterating the boundary complexity of the research region and making the high-resolution atmospheric simulation data essentially useless. Therefore, in this research, the water vapor of every grid along the boundary was calculated, referred to as the “finer box model”, which was designed to improve the accuracy of the net inflow of water vapor through the boundary of the research region based on the high-resolution atmospheric simulation data. These grids are indicated by the red crosses in Figure 1b.
The water vapor flux for each grid is calculated according to Equation (7):
q i , j = 1 g 0 p s W p , i , j q p , i , j · n i , j d p
where i and j are the location identification of the boundary grid in the whole research domain, n i , j is the unit normal vector at the boundary, p is pressure, and W is the wind component at x, y, z directions.
The regional net water-vapor flux ( q ) is calculated by Equation (8):
q = 0   i     M 0   j     N q i , j
where M and N are the sizes of the used grids in the adopted unit of space.

3. Results

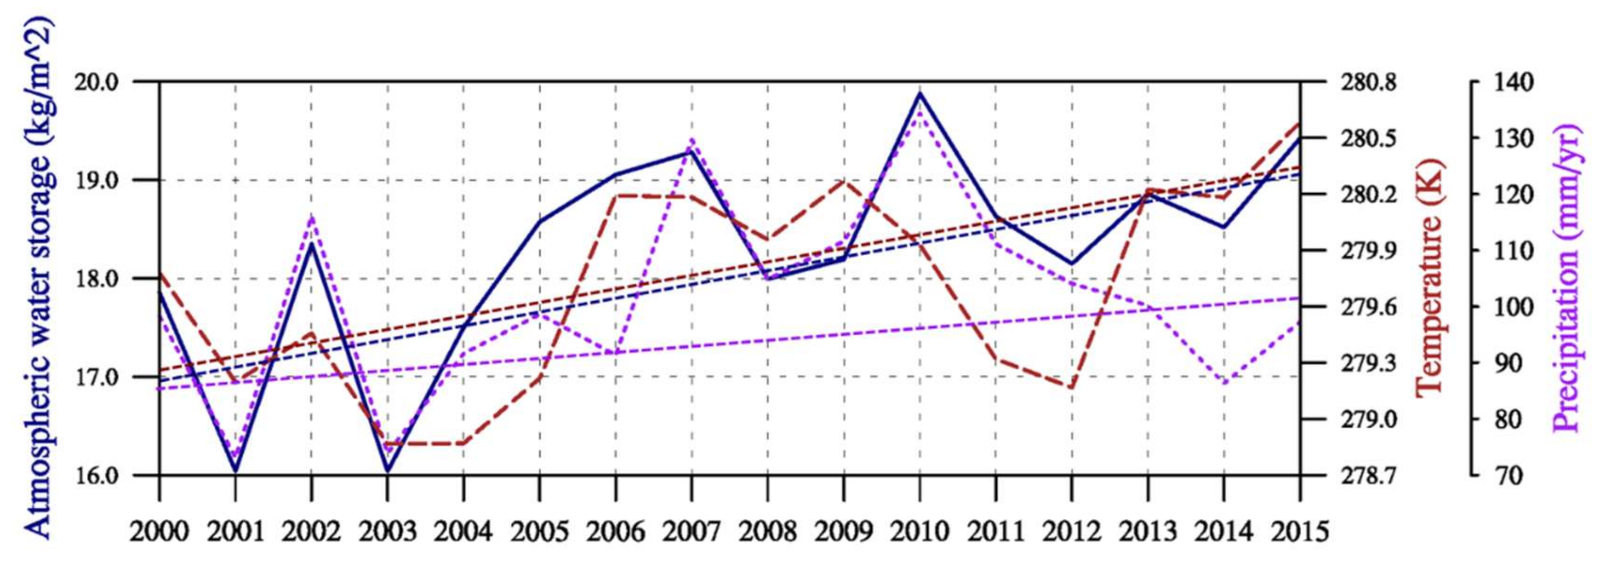
3.1. Atmospheric Water Storage

As mentioned in Section 2, with global warming, the water-holding capability improves, and the atmospheric water-storage change N q cannot be ignored. The annual mean atmospheric water mass (Figure 2) was calculated based on the mixing ratios of the water vapor, cloud water, rain water, ice water, and snow water. According to the annual mean atmospheric water mass from 2000 to 2015, though there were minor variations from year to year, the pattern is shown well in the mean that the maximum and minimum of the atmospheric water mass were located in the southeastern and northeastern regions, respectively.
Figure 3 shows that a strong relationship exists between atmospheric water storage, temperature, and precipitation over the HRB. From 2000 to 2015, the change trends of water vapor and temperature were positive and almost synchronous, the change trend of precipitation was also positive, but not so obvious. The reason may be that the higher temperature increased the capacity to contain atmospheric water mass, which is necessary for the occurrence of precipitation [43]. The water vapor atmosphere increased by approximately 0.13 kg/m2 per year, an important indicator of the net change in condensed water in the air ( N q ) .

3.2. Net Water-Vapor Transport in the X and Y Directions

As analyzed from the NCEP/NCAR reanalysis data set by Wang et al. [33] and Lu et al. [35], the water vapor in the HRB comes mainly from the westerly wind transport via the Black Sea and the Caspian Sea in summer, which is a net income for the water-vapor balance and different from most parts of northwest China; a small part of water vapor in the HRB comes from the polar north wind transport via Mongolia in winter. Meanwhile, according to the net water-vapor transport along the meridional and zonal determined by WRF simulation in this study, it was found that the dominant winds over the HRB were the west wind and the north wind.
The layer-by-layer cumulative analysis shows that the 9th vertical layer (600 ± 100 hPa) is the tuning layer, the altitude of which can be found in Figure 4. Along the meridional, under the tuning layer, the accumulated water vapor from the west crossing the western boundary as input was much bigger than that crossing the eastern boundary as output; above the tuning layer, the accumulated water vapor from the west crossing the western boundary as input was less than that crossing the boundary as output. However, along the zonal, under the tuning layer, the accumulated water vapor from the north crossing the northern boundary as input was much less than that crossing the southern boundary as output; above the tuning layer, the accumulated water vapor from the north crossing the northern boundary as input was larger than that crossing the southern boundary as output.
As shown in Figure 4 and Table 2, the annual cumulative input volumes of water-vapor transport in the upper layers (from the 10th layer to the top) and the lower layers (from the surface to the 9th layer) when crossing the west boundary were 6.2 × 10¹³ kg/year and 6.5 × 10¹³ kg/year, respectively, while the output transport rates when crossing the east boundary were 7.1 × 10¹³ kg/year and 4.6 × 10¹³ kg/year, respectively.
The annual cumulative input volumes of water-vapor transport in the upper layers and lower layers while crossing the north boundary were 1.7 × 10¹³ kg/year and 1.3 × 10¹³ kg/year, respectively, and the output ones while crossing the south boundary were 1.1 × 10¹³ kg/year and 2.4 × 10¹³ kg/year, respectively.

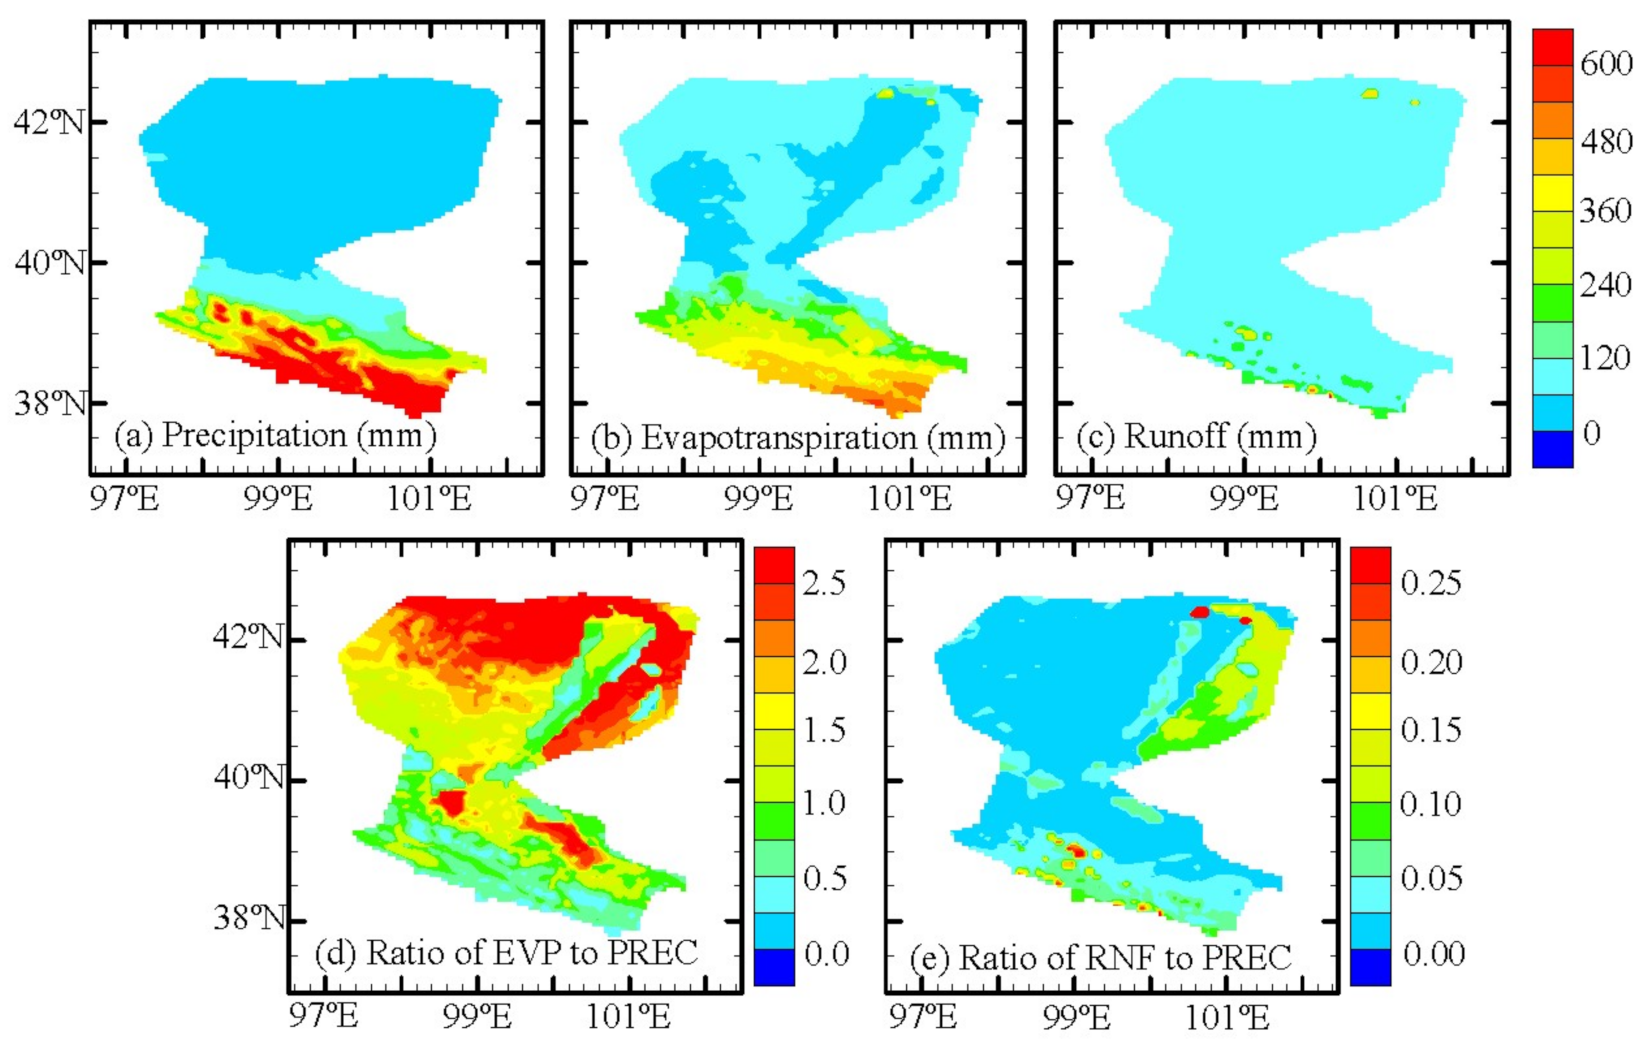
3.3. Precipitation, Evapotranspiration, and Runoff

Figure 5 shows the mean annual spatial distribution of the precipitation, evapotranspiration, runoff, and ratios of evapotranspiration and runoff to precipitation. Much of the precipitation was consumed in evapotranspiration, while some participated in runoff. The figure also indicates that the evapotranspiration was larger than the precipitation in the downstream of the HRB. Parts of the ratios of the evapotranspiration to precipitation in the downstream exceeded 2.0, especially in Juyan Lake, although the runoff over this area was larger than that in other areas of the downstream HRB. The large difference between evapotranspiration and precipitation over this region caused the lake to remain dry for more than 200 days per year. The ratio of runoff to precipitation was much lower than that of evapotranspiration to precipitation.

3.4. Moisture Recycling

Based on the WRF simulation and finer box model, the average annual net water vapor was 0.5 × 10¹³ kg, the annual water vapor storage change was approximately 0.13 kg/m2, the average annual precipitation of the HRB was 103.4 mm, and the area of the HRB was approximately 100,000 km2. According to Equation (6), i.e., γ = P C q N q P , the moisture-recycling rate of the HRB was approximately 0.52.

4. Discussion

4.1. Water-Vapor Transport in the HRB

Based on different methods and data, scientists have consistently concluded that the water-vapor transmission in the HRB is dominated by both westerly transport from the west to the east and the polar (Siberia) cold-air mass from the north to the south, with the intensity of the westerly wind in summer being greater than that of the northerly wind in winter, and that the water-vapor input mainly occurs in the period from June to September [14,34,35,44,45].
However, different opinions exist on the following issues: (1) whether the net water-vapor transport over the entire HRB is positive or negative; (2) which direction of water-vapor transport is positive, westerly or northerly; and (3) the actual volume of water-vapor transport over the HRB.
Lu et al. [36] not only showed that the net water-vapor transport over the entire HRB was negative (approximately −48.8 km3), but also indicated that the water vapor transported by the westerlies over the entire HRB was negative in summer, and that transported by northerlies was positive in winter. Wang et al. [44], Jiang et al. [34], and Xu [45], however, reached a completely opposite conclusion, i.e., the net water-vapor transport was positive, while the net water-vapor transport by the westerlies was positive, and that by the northerlies was negative.
The total input volume of water-vapor transport by the westerlies was larger than that output, which means that the net water-vapor transport by the westerlies was positive. In addition, the net water-vapor transport of the lower layers by the westerlies was positive, and that of the upper layers by the westerlies was negative, which may be due to the water transported by the westerlies being forced to uplift by the gradually strengthening monsoon from south, which is conducive to the formation of precipitation in east, and part of uplifting water vapor is exported from the east boundary in the upper layers, as explained in Xu et al. [46]. However, the phenomenon for the polar north wind was the opposite. The total input volume of water-vapor transport by polar north wind was less than that output, which means that the net water-vapor transport by the polar north wind was negative. Meanwhile, the net water-vapor transport of the lower layers by the polar north wind was negative, and that of the upper layers by the polar north wind was positive, which means that the water transported by the polar north wind underwent a divergence process, which is not conductive to the formation of precipitation, and made the HRB winters drier. The water vapor transported across the southern HRB boundary reaches the Qilian Mountains and then falls as snow, which makes the Qilian Mountains abundant in precipitation [47].
Compared to the question of which water-vapor-transport process is positive, disputes on the volume of water vapor transported over the HRB are much greater. In comparison to this study, Wang et al. [44], Jiang et al. [34], and Xu [45] obtained the same results: the net water-vapor transport over the entire HRB was positive, that by westerlies was positive, and that by polar north winds was negative. However, the total volumes of the net transport, that by westerlies and that by polar north winds in these studies were different from those of our study and were different from each other. The volumes of net water-vapor transport were 17.6 billion m3, 28.8 billion m3, 22.573 billion m3, and 4.0 billion m3 in Wang et al. [44], Jiang et al. [34], Xu [45] and this study, respectively. The net input water vapor was 667.8 billion m3, 248.4 billion m3, and 157.0 billion m3 in Wang et al. [44], Jiang et al. [34], and this study, respectively. The net output water vapor was 650.2 billion m3, 219.6 billion m3, and 153.0 billion m3 in Wang et al. [44], Jiang et al. [34], and this study, respectively. The possible reason for the discrepancies is that the other studies used the box model to calculate the water-vapor transport, which tends to obliterate the jagged complex edge of the natural topography.

4.2. Accuracy of the Moisture Recycling Estimation

In this study, moisture recycling was defined as the contribution of local moisture to precipitation. The accuracy of moisture recycling estimation depends on the following estimation: (1) the accuracy of the water-vapor-transport calculation, (2) the accuracy of the precipitation simulation in the WRF model, and (3) the accuracy of the net change in condensed water in the air. Here, the high resolution of the WRF model in this study was crucial to the moisture-recycling estimation. In addition, compared to the traditional coarse box model, a finer box model was adopted to calculate the net water-vapor flux in detail.
The WRF model is strongly sensitive to the model resolution and underlying surface terrain features in the HRB [48,49]. High spatial resolution not only yields more precise amounts and more reasonable patterns of precipitation (including snow) in complex mountainous regions, but also contributes to more apparent wind-speed patterns [50,51]. Wind speed plays an important role in calculating the water-vapor transport. Additionally, the net change in condensed water in the air ( N q ), which was zero in most studies but plays an increasingly important role in the air water cycle, was considered in this study using long-term atmospheric water storage based on a high-resolution simulation in the WRF model.
Currently, the flux volume of water-vapor transport varies from one researcher to another. This study, based on long-term high-resolution simulations in regional climate models and finer box models, was helpful in resolving this issue, and obtained an accurate moisture-recycling rate over the HRB.

4.3. Higher Moisture Recycling over the Inland River Basin

There was a higher moisture recycling and a much stronger land–atmosphere interaction over the inland river basin than the other regions with same spatial scale, which may be due to the inland river basin being located far from the sea. Wu et al. [52] indicated that the Tarim River Basin, the biggest inland river basin in China, had a high local moisture recycling because it is located far away from ocean and next to the Tibetan Plateau, which is similar to the HRB. Keys et al. [53] indicated that the land surface plays a dominant role in mediating variability in moisture-recycling processes in the inland river basins. Keys et al. [54] and Li et al. [55] indicated that the intermountain basin near the Qilian Mountains, as a relatively closed terrain of the region, is beneficial to local moisture recycling.
Meanwhile, the water from the cryosphere belt, which is generally considered as a belt in addition to the vegetation belt, oases belt, and desert belt over the inland river basin, accounts for a large portion of moisture recycling [55,56]. The cryosphere belt saves water for cold seasons and releases in the flood season when the temperature is highest and the evapotranspiration is most strong in a year, which makes the moisture-recycling ratio of the inland river basin higher than that of the other regions at the same spatial scale.

4.4. Tuning Layer and Other Issues

The tuning layer, i.e., the 9th layer in our research, was approximately 600 ± 100 hPa over the entire HRB. Most atmospheric convergent and divergent activities occur at or near this layer [57]. In this study, the annual cumulative net volume of water-vapor transport in the upper layers (from the 10th layer to the top) was negative, and was positive in the lower layers (from the surface to the 9th layer) while water vapor crossed from west to east. The annual cumulative net volume of water-vapor transport was positive in the upper layers and was negative in the lower layers while water vapor crossed from the north to south. The net volume of vapor transport in the upper layers being positive means that the water-vapor convergence uplifted, and was likely to form precipitation during transport; however, the net volume of vapor transport in the lower layers being positive means that the water-vapor divergence sunk, and was not conductive to forming precipitation.

5. Conclusions

The Heihe River Basin (HRB) is a coupling area of the westerlies and the polar north wind circulation system, with a relatively independent land water-circulating system. The aim of this study was to describe the refined characteristics of the water-vapor transport over the inland river basin, and calculate the contribution of local evapotranspiration to precipitation over the HRB. Based on the long-term WRF simulation and finer box model, the net water-vapor flux as calculated grid by grid, the quantitative change trend of the atmospheric water storage, and the refined characteristics of moisture cycling over the inland Heihe River, the following conclusions were drawn:
(1)
The water vapor of the HRB was dominantly transported by the wind from west and from the north, and the west wind was much larger than the north wind. The net vapor transported by the west wind was positive, and by north wind was negative;
(2)
The precipitation over the HRB was triggered mainly by the vapor from the west, which arose from the lower vertical layer to the higher one during transport from west to east. The vapor from the north sank from a higher layer to a lower one, and crossed the south edge of the HRB;
(3)
The moisture-recycling ratio of evapotranspiration to precipitation over the HRB was much higher than in the other regions, which may be due to the strong land–atmosphere interaction in the arid inland river basin.
Although the climatological pattern of water-vapor transport was the main issue in this study, an issue arose regarding how to calculate the water-vapor budget delicately for the HRB, so it was insufficient that the diurnal/seasonal/yearly variability of water-vapor transport was not analyzed in detail as well; this will be our next step in the future. Furthermore, an extended study of the physical processes based on the combination of models and observations also will be undertaken in the future.

Author Contributions

X.P. conceived, designed and performed the experiments, and wrote the paper; W.M., Y.Z. and H.L. contributed to discussions and revisions. All authors have read and agreed to the published version of the manuscript.

Funding

This work was jointly supported by the Strategic Priority Research Program of the Chinese Academy of Sciences (XDA20060603, XDA19070104) and the National Natural Science Foundation of China (Grant nos. 41471292, 41801271).

Institutional Review Board Statement

Not applicable.

Informed Consent Statement

Not applicable.

Data Availability Statement

The data presented in this study are openly available in National Tibetan Plateau Data Center at doi:10.3972/heihe.019.2013.db. Data citation: PAN Xiaoduo. The atmospheric forcing data in the Heihe River Basin (2000-2018). National Tibetan Plateau Data Center, 2020. doi:10.3972/heihe.019.2013.db.

Acknowledgments

The input data for the WRF model were obtained from the Research Data Archive (RDA), which is maintained by the Computational and Information Systems Laboratory (CISL) at the National Center for Atmospheric Research (NCAR). The original data are available from the RDA (http://rda.ucar.edu/datasets/ds083.2/, accessed on 10 July 2019) in data set number ds083.2. The NCAR Command Language (NCL) (Version 6.1.2, 2013) is available from the UCAR/NCAR/CISL/VETS (http://dx.doi.org/10.5065/D6WD3XH5, Released 7 February 2013), Boulder, Colorado. NCL was used for the data analysis and graphs in this paper. The authors thank the anonymous reviewers and the editor for their very helpful comments.

Conflicts of Interest

The authors declare no conflict of interest. The funders had no role in the design of the study; in the collection, analyses, or interpretation of data; in the writing of the manuscript; or in the decision to publish the results.

References

  1. Brubaker, K.L.; Entekhabi, D.; Eagleson, P.S. Estimation of continental precipitation recycling. J. Clim. 1993, 6, 1077–1089. [Google Scholar] [CrossRef] [Green Version]
  2. Eltahir, E.A.B.; Bras, R.L. Precipitation recycling in the Amazon basin. Q. J. R. Meteorol. Soc. 1994, 120, 861–880. [Google Scholar] [CrossRef]
  3. Koster, R.; Jouzel, J.; Suozzo, R.; Russell, G.; Broecker, W.; Rind, D.; Eagleson, P. Global sources of local precipitation as determined by the Nasa/Giss GCM. Geophys. Res. Lett. 1986, 13, 121–124. [Google Scholar] [CrossRef]
  4. Trenberth, K.E. Atmospheric moisture recycling: Role of advection and local evaporation. J. Clim. 1999, 12, 1368–1381. [Google Scholar] [CrossRef]
  5. Bosilovich, M.G.; Schubert, S.D. Water vapor tracers as diagnostics of the regional hydrologic cycle. J. Hydrometeorol. 2002, 3, 149–165. [Google Scholar] [CrossRef] [Green Version]
  6. Dirmeyer, P.A.; Brubaker, K.L. Contrasting evaporative moisture sources during the drought of 1988 and the flood of 1993. J. Geophys. Res. Space Phys. 1999, 104, 19383–19397. [Google Scholar] [CrossRef]
  7. Dirmeyer, P.A.; Brubaker, K.L. Characterization of the global hydrologic cycle from a back-trajectory analysis of atmospheric water vapor. J. Hydrometeorol. 2007, 8, 20–37. [Google Scholar] [CrossRef]
  8. Hua, L.; Zhong, L.; Ke, Z. Characteristics of the precipitation recycling ratio and its relationship with regional precipitation in China. Theor. Appl. Clim. 2015, 127, 513–531. [Google Scholar] [CrossRef]
  9. Yao, Y.; Zheng, C.; Tian, Y.; Liu, J.; Zheng, Y. Numerical modeling of regional groundwater flow in the Heihe River Basin, China: Advances and new insights. Sci. China Earth Sci. 2015, 58, 3–15. [Google Scholar] [CrossRef]
  10. Ciric, D.; Stojanovic, M.; Drumond, A.; Nieto, R.; Gimeno, L. Tracking the origin of moisture over the Danube river basin using a Lagrangian approach. Atmosphere 2016, 7, 162. [Google Scholar] [CrossRef] [Green Version]
  11. González-Rojí, S.J.; Sáenz, J.; De Argandoña, J.D.; Ibarra-Berastegi, G. Moisture recycling over the Iberian Peninsula: The impact of 3DVAR data assimilation. Atmosphere 2020, 11, 19. [Google Scholar] [CrossRef] [Green Version]
  12. Sorí, R.; Nieto, R.; Drumond, A.; Gimeno, L. The Niger river basin moisture sources: A Lagrangian analysis. Atmosphere 2017, 8, 38. [Google Scholar] [CrossRef] [Green Version]
  13. Ma, J.J.; Yu, B.; Gao, X.Q.; Li, J. Change of large scale circulation and its impact on the water vapor over north china. Plateau Meteorol. 2008, 27, 517–523. (In Chinese) [Google Scholar] [CrossRef]
  14. Zhao, L.; Liu, X.; Wang, N.; Kong, Y.; Song, Y.; He, Z.; Liu, Q.; Wang, L. Contribution of recycled moisture to local precipitation in the inland Heihe River Basin. Agric. For. Meteorol. 2019, 271, 316–335. [Google Scholar] [CrossRef]
  15. Cheng, G.; Li, X. Integrated research methods in watershed science. Sci. China Earth Sci. 2015, 58, 1159–1168. [Google Scholar] [CrossRef]
  16. Cheng, G.D.; Zhao, C.Y. An integrated study of ecological and hydrological processes in the inland river basin of the arid regions, China. Adv. Earth Sci. 2008, 23, 1005–1012. (In Chinese) [Google Scholar]
  17. IPCC. Climate Change 2013: The Physical Science Basis. Contribution of Working Group I to the Fifth Assessment Report of the Intergovernmental Panel on Climate Change; Stocker, T.F., Qin, D., Plattner, G.-K., Tignor, M., Allen, S.K., Boschung, J., Nauels, A., Xia, Y., Bex, V., Midgley, P.M., Eds.; Cambridge University Press: Cambridge, UK; New York, NY, USA, 2013; 1535p. [Google Scholar] [CrossRef] [Green Version]
  18. NOAA. National Centers for Environmental Information, State of the Climate: Global Climate Report for January 2016. Available online: https://www.ncdc.noaa.gov/sotc/global/201601 (accessed on 20 December 2020).
  19. Olsson, J.; Berg, P.; Kawamura, A. Impact of RCM Spatial Resolution on the Reproduction of Local, Subdaily Precipitation. J. Hydrometeorol. 2015, 16, 534–547. [Google Scholar] [CrossRef]
  20. Prein, A.F.; Gobiet, A.; Suklitsch, M.; Truhetz, H.; Awan, N.K.; Keuler, K.; Georgievski, G. Added value of convection permitting seasonal simulations. Clim. Dyn. 2013, 41, 2655–2677. [Google Scholar] [CrossRef] [Green Version]
  21. Jain, R.K.; Cui, Z.; Domen, J. Appendix A—Emission factors for air pollutants related to mining and mineral processing. In Environmental Impact of Mining and Mineral Processing; Butterworth-Heinemann: Oxford, UK, 2016; pp. 271–297. [Google Scholar] [CrossRef]
  22. Li, N.; Kinzelbach, W.; Li, W.; Dong, X. Box model and 1D longitudinal model of flow and transport in Bosten Lake, China. J. Hydrol. 2015, 524, 62–71. [Google Scholar] [CrossRef] [Green Version]
  23. Mareddy, A.R. 5—Impacts on air environment. In Impacts on Air Environment; Butterworth-Heinemann: Oxford, UK, 2017; pp. 171–216. [Google Scholar] [CrossRef]
  24. Romero, J.; Navarro-Esbrí, J.; Belman-Flores, J.; Pérez, J.A.R. A simplified black-box model oriented to chilled water temperature control in a variable speed vapour compression system. Appl. Therm. Eng. 2011, 31, 329–335. [Google Scholar] [CrossRef]
  25. Pan, X.; Li, X.; Cheng, G.; Li, H.; He, X. Development and evaluation of a river-basin-scale high spatio-temporal precipitation data set using the WRF Model: A case study of the Heihe River Basin. Remote. Sens. 2015, 7, 9230–9252. [Google Scholar] [CrossRef] [Green Version]
  26. Pan, X.; Li, X.; Shi, X.; Han, X.; Luo, L.; Wang, L. Dynamic downscaling of near-surface air temperature at the basin scale using WRF-a case study in the Heihe River Basin, China. Front. Earth Sci. 2012, 6, 314–323. [Google Scholar] [CrossRef]
  27. Cheng, G.; Li, X.; Zhao, W.; Xu, Z.; Feng, Q.; Xiao, S.; Xiao, H. Integrated study of the water–ecosystem–economy in the Heihe River Basin. Natl. Sci. Rev. 2014, 1, 413–428. [Google Scholar] [CrossRef] [Green Version]
  28. Li, X.; Cheng, G.; Liu, S.; Xiao, Q.; Ma, M.; Jin, R.; Che, T.; Liu, Q.; Wang, W.; Qi, Y.; et al. Heihe watershed allied telemetry experimental research (HiWATER): Scientific objectives and experimental design. Bull. Am. Meteorol. Soc. 2013, 94, 1145–1160. [Google Scholar] [CrossRef]
  29. Yang, Y.; Zhang, Z.; Xiang, X. Spatial variation of reference crop evapotranspiration on Tibetan Plateau. Water Sci. Eng. 2009, 2, 112–120. [Google Scholar] [CrossRef]
  30. Zhao, L.; Yin, L.; Xiao, H.; Cheng, G.; Zhou, M.; Yang, Y.; Li, C.; Zhou, J. Isotopic evidence for the moisture origin and composition of surface runoff in the headwaters of the Heihe River Basin. Chin. Sci. Bull. 2011, 56, 406–415. [Google Scholar] [CrossRef] [Green Version]
  31. Wang, J.M.; Liu, X.H.; Ma, Y.M. Turbulence structure and transfer characteristics in the surface layer of HEIFE Gobi area. Acta Meteorol. Sin. 1992, 6, 92–104. (In Chinese) [Google Scholar]
  32. Li, X.; Li, X.; Li, Z.; Ma, M.; Wang, J.; Xiao, Q.; Liu, Q.; Che, T.; Chen, E.; Yan, G.; et al. Watershed allied telemetry experimental research. J. Geophys. Res. Atmos. 2009, 114. [Google Scholar] [CrossRef] [Green Version]
  33. Wang, K. The westerly fluctuation and water vapor transport over the Qilian-Heihe valley. Sci. China Ser. D Earth Sci. 2004, 47, 32–38. [Google Scholar] [CrossRef]
  34. Jiang, H.; Wang, K.L.; Cheng, G.D.; Li, H.Y.; Yu, T. Temporal variation and spatial structure of the water vapor transport and budget over the Heihe drainage area. J. Glaciol. Geocryol. 2009, 31, 311–317. (In Chinese) [Google Scholar] [CrossRef]
  35. Lu, G.H.; Dong, X.; He, H. Characteristics of water vapor transportation and budget over the Heihe drainage basin. J. Nat. Resour. 2012, 27, 510–521. (In Chinese) [Google Scholar] [CrossRef]
  36. Skamarock, W.C.; Klemp, J.B. A time-split nonhydrostatic atmospheric model for weather research and forecasting applications. J. Comput. Phys. 2008, 227, 3465–3485. [Google Scholar] [CrossRef]
  37. Hong, S.Y.; Dudhia, J.; Chen, S.H. A revised approach to ice microphysical processes for the bulk parameterization of clouds and precipitation. Mon. Weather Rev. 2004, 132, 103–120. [Google Scholar] [CrossRef]
  38. Kain, J.S.; Kain, J. The Kain—Fritsch convective parameterization: An update. J. Appl. Meteorol. 2004, 43, 170–181. [Google Scholar] [CrossRef] [Green Version]
  39. Hong, S.-Y.; Noh, Y.; Dudhia, J. A new vertical diffusion package with an explicit treatment of entrainment processes. Mon. Weather. Rev. 2006, 134, 2318–2341. [Google Scholar] [CrossRef] [Green Version]
  40. Dudhia, J. Numerical study of convection observed during the Winter Monsoon Experiment using a mesoscale two-dimensional model. J. Atmos. Sci. 1989, 46, 3077–3107. [Google Scholar] [CrossRef]
  41. Mlawer, E.J.; Taubman, S.J.; Brown, P.D.; Iacono, M.J.; Clough, S.A. Radiative transfer for inhomogeneous atmospheres: RRTM, a validated correlated-k model for the longwave. J. Geophys. Res. Atmos. 1997, 102, 16663–16682. [Google Scholar] [CrossRef] [Green Version]
  42. CGIP. Global Energy and Water Cycle Experiment (GEWEX) Continental-Scale International Project: A Review of Progress and Opportunities; National Academies Press: Washington, DC, USA, 1998; pp. 13–22. [Google Scholar]
  43. Zhang, X.; Xiong, Z.; Yan, X. Modeling precipitation changes in the Heihe River Basin, Northwest China, from 1980 to 2014 with the Regional Integrated Environment Modeling System (RIEMS) nested with ERA-Interim reanalysis data. Theor. Appl. Clim. 2018, 137, 493–503. [Google Scholar] [CrossRef]
  44. Wang, K.L.; Cheng, G.D.; Jiang, H.; Zhang, L.J. Atmospheric hydrologic cycle over the Qilian-Heihe valley. Adv. Water Sci. 2003, 14, 91–97. (In Chinese) [Google Scholar]
  45. Xu, B.R.; Zou, S.B.; Du, D.Y.; Xiong, Z.; Lu, Z.X.; Ruan, H.W.; Xiao, H.L. Variation of tropospheric specific humidity upon the middle-lower reaches of the heihe river during 1981–2010. J. Glaciol. Geocryol. 2016, 38, 57–68. (In Chinese) [Google Scholar] [CrossRef]
  46. Xu, J.J.; Wang, K.L.; Jiang, H.; Li, Z.G.; Sun, J.; Luo, X.P.; Zhu, Q.L. A numerical simulation of the effects of westerly and monsoon on precipitation in the Heihe River Basin. J. Glaciol. Geocryol. 2010, 32, 489–496. (In Chinese) [Google Scholar]
  47. Ding, Y.J.; Zhang, S.Q. Study on water internal recycle process and mechanism in typical mountain areas of inland basins, Northwest China: Progress and Challenge. Adv. Earth Sci. 2018, 33, 719–728. (In Chinese) [Google Scholar] [CrossRef]
  48. Pan, X.D.; Li, X. Impact of spatial resolution on WRF model in Heihe river basin. eScience Technol. Appl. 2011, 2, 126–137. (In Chinese) [Google Scholar]
  49. Pan, X.D.; Li, X.; Ran, Y.H.; Liu, C. Impact of underlying surface information on WRF modeling in Heihe River Basin. Plateau Meteorol. 2012, 31, 657–667. (In Chinese) [Google Scholar]
  50. Bonekamp, P.N.J.; Collier, E.; Immerzeel, W.W. The impact of spatial resolution, land use, and spinup time on resolving spatial precipitation patterns in the Himalayas. J. Hydrometeorol. 2018, 19, 1565–1581. [Google Scholar] [CrossRef] [Green Version]
  51. Gimeno, L.; Vázquez, M.; Eiras-Barca, J.; Sorí, R.; Stojanovic, M.; Algarra, I.; Nieto, R.; Ramos, A.M.; Durán-Quesada, A.M.; Dominguez, F. Recent progress on the sources of continental precipitation as revealed by moisture transport analysis. Earth Sci. Rev. 2020, 201, 103070. [Google Scholar] [CrossRef]
  52. Wu, Y.-P.; Shen, Y.; Larry, P.; Li, B. Possible physical mechanism of water vapor transport over Tarim River Basin. Ecol. Complex. 2012, 9, 63–70. [Google Scholar] [CrossRef]
  53. Keys, P.W.; Barnes, E.A.; Van Der Ent, R.J.; Gordon, L.J. Variability of moisture recycling using a precipitationshed framework. Hydrol. Earth Syst. Sci. 2014, 18, 3937–3950. [Google Scholar] [CrossRef] [Green Version]
  54. Keys, P.W.; Porkka, M.; Wang-Erlandsson, L.; Fetzer, I.; Gleeson, T.; Gordon, L.J. Invisible water security: Moisture recycling and water resilience. Water Secur. 2019, 8, 100046. [Google Scholar] [CrossRef] [PubMed]
  55. Zongxing, L.; Qi, F.; Wang, Q.; Song, Y.; Jianguo, L.; Yongge, L.; Yamin, W. Quantitative evaluation on the influence from cryosphere meltwater on runoff in an inland river basin of China. Glob. Planet. Chang. 2016, 143, 189–195. [Google Scholar] [CrossRef]
  56. Li, Z.; Gui, J.; Wang, X.; Feng, Q.; Zhao, T.; Ouyang, C.; Guo, X.; Zhang, B.; Shi, Y. Water resources in inland regions of central Asia: Evidence from stable isotope tracing. J. Hydrol. 2019, 570, 1–16. [Google Scholar] [CrossRef]
  57. De Wekker, S.F.J.; Kossmann, M. Convective boundary layer heights over mountainous terrain—A review of concepts. Front. Earth Sci. 2015, 3, 1–22. [Google Scholar] [CrossRef] [Green Version]
Figure 1. The study region: (a) the location of the HRB; (b) the research domain.
Atmosphere 12 00399 g001
Figure 2. The mean atmospheric water storage over the HRB from 2000 to 2015 (kg/m2).
Atmosphere 12 00399 g002
Figure 3. The change trend of the atmospheric water storage, temperature, and precipitation from 2000 to 2015. The trendline in dark blue is for water vapor, the trendline in dark red is for temperature, and the trendline in purple is for precipitation.
Atmosphere 12 00399 g003
Figure 4. The net water vapor transport in the X and Y directions (kg/year). The blue arrow represents the water vapor transported by west wind, and the pink arrow represents the water vapor transported by north wind.
Atmosphere 12 00399 g004
Figure 5. The spatial distribution of the precipitation, evapotranspiration, runoff, and their ratios.
Atmosphere 12 00399 g005
Table 1. Physical configuration of the WRF model used in this experiment.
Physics ProcessesDomain 1
(25 km)
Domain 2
(5 km)
Horizontal60 × 60130 × 130
Time step150 s30 s
Microphysicssingle-moment 5-class schemesingle-moment 5-class scheme
CumulusKain–Fritsch schemeKain–Fritsch scheme
PBLYSU schemeYSU scheme
Shortwave radiationDudhia schemeDudhia scheme
Longwave radiationRapid radiative transfer modelRapid radiative transfer model
Surface–land5-layer thermal diffusion5-layer thermal diffusion
Initial and boundaryNCEP/FNL analysisDomain 1
Table 2. The input and output of water vapor by the west wind and north wind over the HRB.
WindLayerInput (kg/year)Output (kg/year)Net (kg/year)
West windSurface—9th layer6.5 × 10134.6 × 10131.9 × 1013
10th layer—Top6.2 × 10137.1 × 1013−0.9 × 10¹³
North windSurface—9th layer1.3 × 10132.4 × 1013−1.1 × 10¹³
10th layer—Top 1.7 × 10131.1 × 10130.6 × 1013
Publisher’s Note: MDPI stays neutral with regard to jurisdictional claims in published maps and institutional affiliations.

