
Identification of High Personal PM2.5 Exposure during Real Time Commuting in the Taipei Metropolitan Area


Abstract
:1. Introduction
2. Materials and Methods
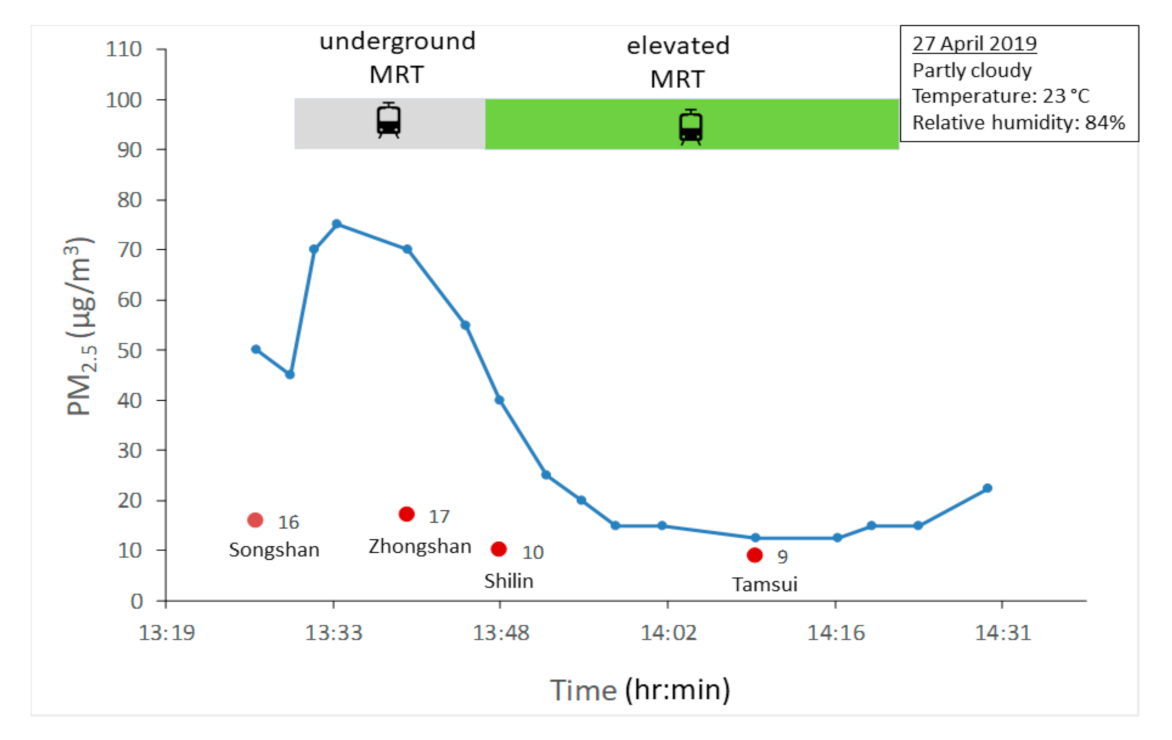
2.1. MRT
2.2. Walking
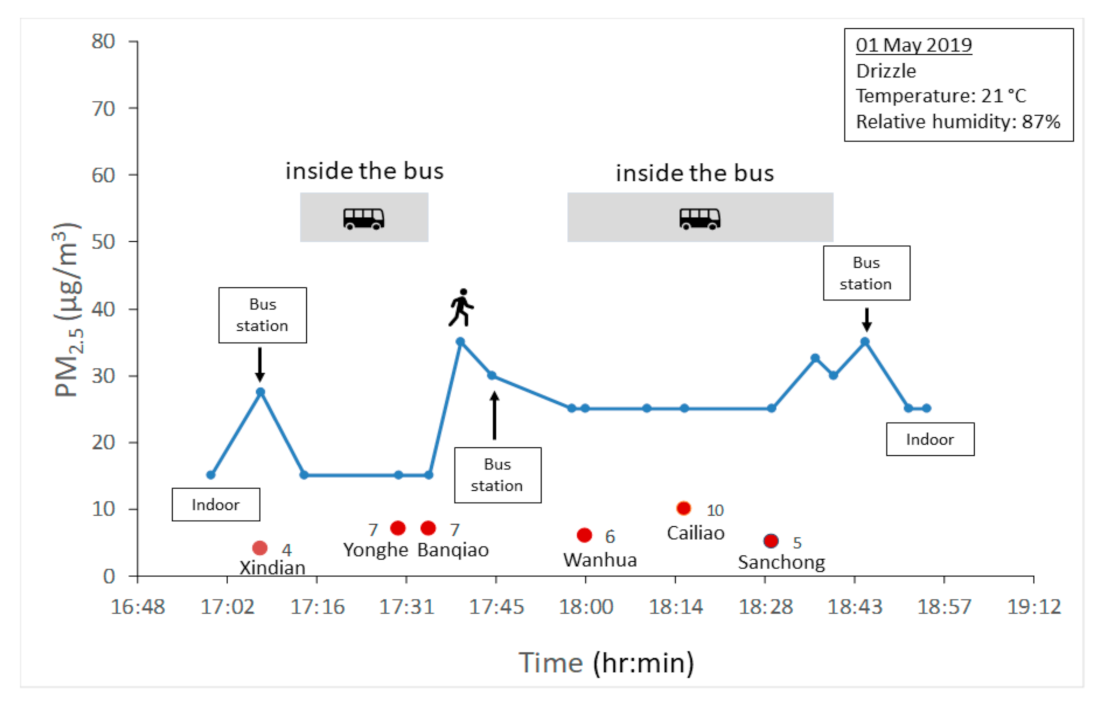
2.3. Bus
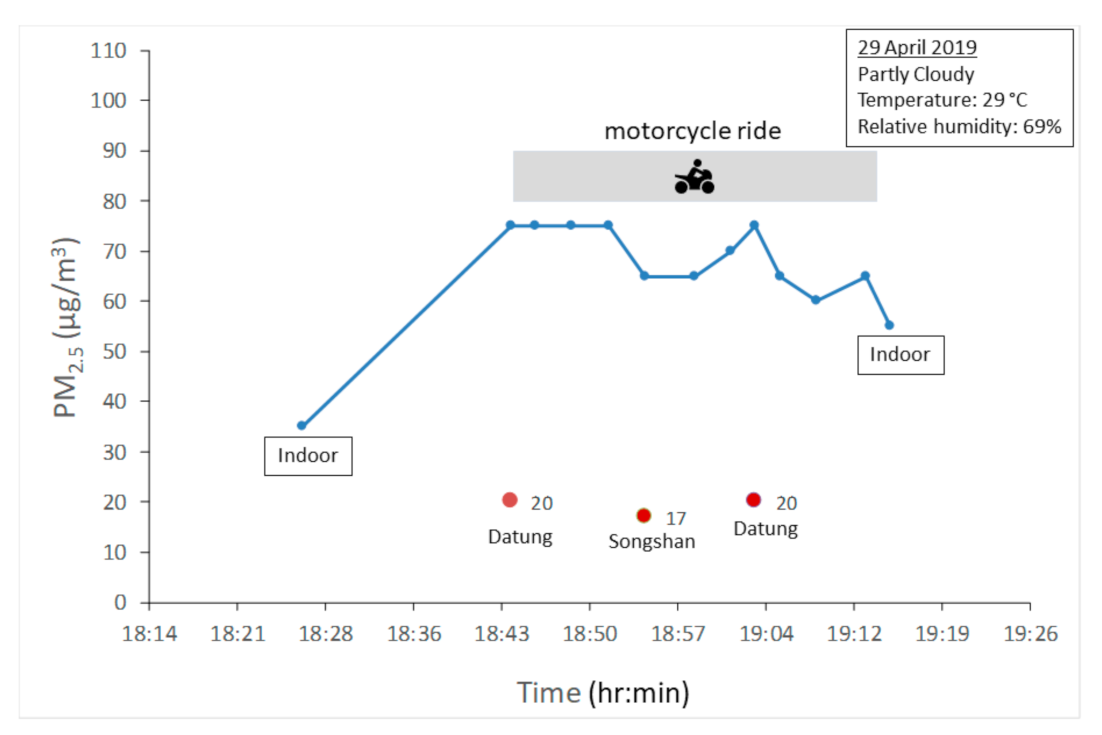
2.4. Motorcycle
2.5. Private Car
2.6. Recording of Environmental Conditions
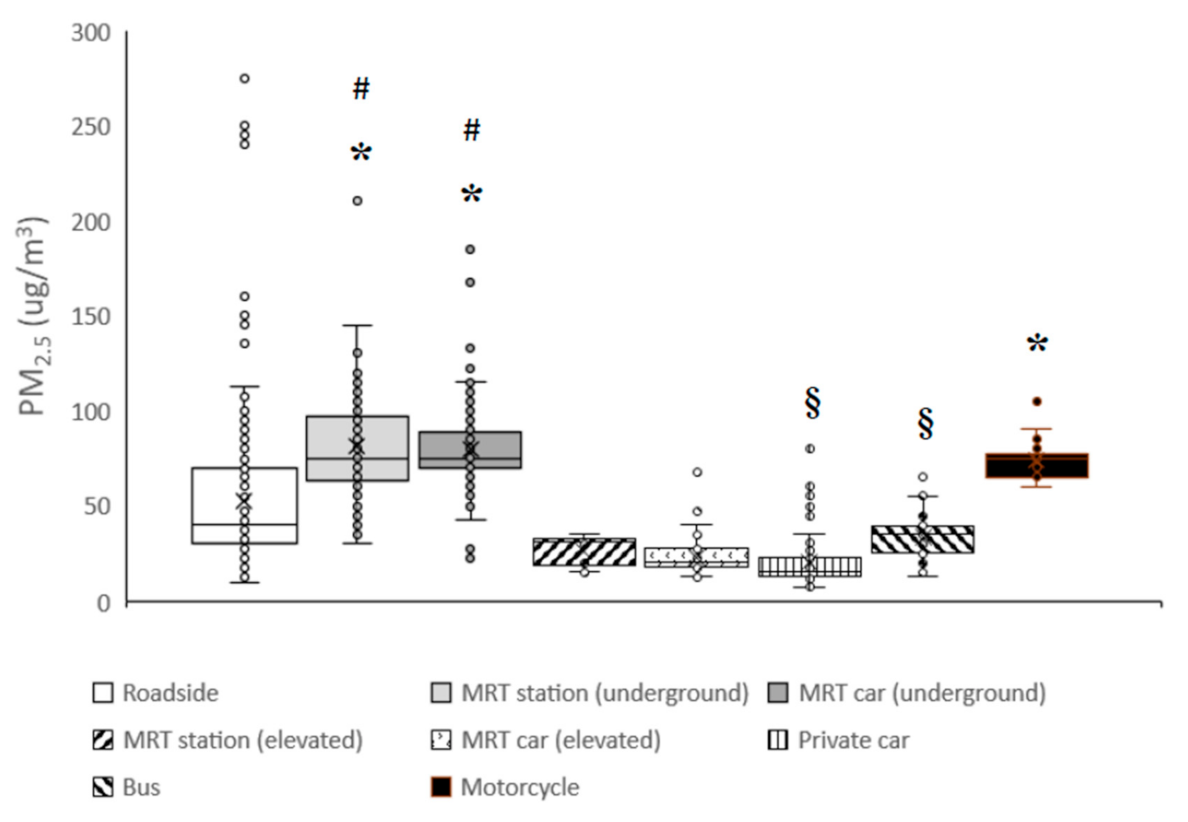
2.7. Statistical Analysis
3. Results
4. Discussion
Author Contributions
Funding
Institutional Review Board Statement
Informed Consent Statement
Data Availability Statement
Acknowledgments
Conflicts of Interest
References
- Samet, J.M.; Dominici, F.; Curriero, F.C.; Coursac, I.; Zeger, S.L. Fine particulate air pollution and mortality in 20 U.S. cities, 1987–1994. N. Engl. J. Med. 2000, 343, 1742–1749. [Google Scholar] [CrossRef]
- Borja-Aburto, V.H.; Castillejos, M.; Gold, D.R.; Bierzwinski, S.; Loomis, D. Mortality and ambient fine particles in southwest Mexico City, 1993–1995. Environ. Health Perspect. 1998, 106, 849–855. [Google Scholar] [CrossRef] [PubMed]
- Dockery, D.W.; Pope, A.C.d.; Xu, X.; Spengler, J.D.; Ware, J.H.; Fay, M.E.; Ferris, B.G., Jr.; Speizer, F.E. An association between air pollution and mortality in six U.S. cities. N. Engl. J Med. 1993, 329, 1753–1759. [Google Scholar] [CrossRef] [Green Version]
- Michelozzi, P.; Forastiere, F.; Fusco, D.; Perucci, C.A.; Ostro, B.; Ancona, C.; Pallotti, G. Air pollution and daily mortality in Rome, Italy. Occup. Environ. Med. 1998, 55, 605–610. [Google Scholar] [CrossRef] [PubMed] [Green Version]
- Pope, C.A., 3rd; Burnett, R.T.; Thun, M.J.; Calle, E.E.; Krewski, D.; Ito, K.; Thurston, G.D. Lung cancer, cardiopulmonary mortality, and long-term exposure to fine particulate air pollution. JAMA 2002, 287, 1132–1141. [Google Scholar] [CrossRef] [PubMed] [Green Version]
- Schwarze, P.E.; Ovrevik, J.; Lag, M.; Refsnes, M.; Nafstad, P.; Hetland, R.B.; Dybing, E. Particulate matter properties and health effects: Consistency of epidemiological and toxicological studies. Hum. Exp. Toxicol. 2006, 25, 559–579. [Google Scholar] [CrossRef] [PubMed]
- Thurston, G.D.; Ito, K.; Hayes, C.G.; Bates, D.V.; Lippmann, M. Respiratory hospital admissions and summertime haze air pollution in Toronto, Ontario: Consideration of the role of acid aerosols. Environ. Res. 1994, 65, 271–290. [Google Scholar] [CrossRef]
- Franklin, M.; Zeka, A.; Schwartz, J. Association between PM2.5 and all-cause and specific-cause mortality in 27 US communities. J. Expo. Sci Environ. Epidemiol. 2007, 17, 279–287. [Google Scholar] [CrossRef] [PubMed] [Green Version]
- Chen, J.; Hoek, G. Long-term exposure to PM and all-cause and cause-specific mortality: A systematic review and meta-analysis. Environ. Int. 2020, 143, 105974. [Google Scholar] [CrossRef]
- Hoek, G.; Krishnan, R.M.; Beelen, R.; Peters, A.; Ostro, B.; Brunekreef, B.; Kaufman, J.D. Long-term air pollution exposure and cardio- respiratory mortality: A review. Environ. Health 2013, 12, 43. [Google Scholar] [CrossRef] [Green Version]
- Chen, H.; Goldberg, M.S.; Villeneuve, P.J. A systematic review of the relation between long-term exposure to ambient air pollution and chronic diseases. Rev. Environ. Health 2008, 23, 243–297. [Google Scholar] [CrossRef] [PubMed]
- Committee of the Environmental and Occupational Health Assembly of the American Thoracic Society Health effects of outdoor air pollution. Am. J. Respir. Crit. Care Med. 1996, 153, 3–50. [CrossRef]
- Brunekreef, B.; Forsberg, B. Epidemiological evidence of effects of coarse airborne particles on health. Eur. Respir. J. 2005, 26, 309–318. [Google Scholar] [CrossRef] [PubMed]
- Liu, L.J.; Box, M.; Kalman, D.; Kaufman, J.; Koenig, J.; Larson, T.; Lumley, T.; Sheppard, L.; Wallace, L. Exposure assessment of particulate matter for susceptible populations in Seattle. Environ. Health Perspect. 2003, 111, 909–918. [Google Scholar] [CrossRef] [Green Version]
- Trasande, L.; Thurston, G.D. The role of air pollution in asthma and other pediatric morbidities. J. Allergy Clin. Immunol. 2005, 115, 689–699. [Google Scholar] [CrossRef]
- Pope, C.A., 3rd; Thun, M.J.; Namboodiri, M.M.; Dockery, D.W.; Evans, J.S.; Speizer, F.E.; Heath, C.W., Jr. Particulate air pollution as a predictor of mortality in a prospective study of U.S. adults. Am. J. Respir. Crit. Care Med. 1995, 151, 669–674. [Google Scholar] [CrossRef]
- Goldberg, M.S.; Burnett, R.T.; Bailar, J.C., 3rd; Tamblyn, R.; Ernst, P.; Flegel, K.; Brook, J.; Bonvalot, Y.; Singh, R.; Valois, M.F.; et al. Identification of persons with cardiorespiratory conditions who are at risk of dying from the acute effects of ambient air particles. Environ. Health Perspect. 2001, 109 (Suppl. S4), 487–494. [Google Scholar]
- Pope, C.A., 3rd; Dockery, D.W.; Spengler, J.D.; Raizenne, M.E. Respiratory health and PM10 pollution. A daily time series analysis. Am. Rev. Respir. Dis. 1991, 144, 668–674. [Google Scholar] [CrossRef]
- Pope, C.A., 3rd; Burnett, R.T.; Thurston, G.D.; Thun, M.J.; Calle, E.E.; Krewski, D.; Godleski, J.J. Cardiovascular mortality and long-term exposure to particulate air pollution: Epidemiological evidence of general pathophysiological pathways of disease. Circulation 2004, 109, 71–77. [Google Scholar] [CrossRef] [Green Version]
- Mann, J.K.; Tager, I.B.; Lurmann, F.; Segal, M.; Quesenberry, C.P., Jr.; Lugg, M.M.; Shan, J.; Van Den Eeden, S.K. Air pollution and hospital admissions for ischemic heart disease in persons with congestive heart failure or arrhythmia. Environ. Health Perspect. 2002, 110, 1247–1252. [Google Scholar] [CrossRef] [Green Version]
- Kettunen, J.; Lanki, T.; Tiittanen, P.; Aalto, P.P.; Koskentalo, T.; Kulmala, M.; Salomaa, V.; Pekkanen, J. Associations of fine and ultrafine particulate air pollution with stroke mortality in an area of low air pollution levels. Stroke 2007, 38, 918–922. [Google Scholar] [CrossRef] [PubMed] [Green Version]
- Low, R.B.; Bielory, L.; Qureshi, A.I.; Dunn, V.; Stuhlmiller, D.F.; Dickey, D.A. The relation of stroke admissions to recent weather, airborne allergens, air pollution, seasons, upper respiratory infections, and asthma incidence, September 11, 2001, and day of the week. Stroke 2006, 37, 951–957. [Google Scholar] [CrossRef] [PubMed] [Green Version]
- Tsai, S.S.; Goggins, W.B.; Chiu, H.F.; Yang, C.Y. Evidence for an association between air pollution and daily stroke admissions in Kaohsiung, Taiwan. Stroke 2003, 34, 2612–2616. [Google Scholar] [CrossRef] [PubMed] [Green Version]
- Wellenius, G.A.; Schwartz, J.; Mittleman, M.A. Air pollution and hospital admissions for ischemic and hemorrhagic stroke among medicare beneficiaries. Stroke 2005, 36, 2549–2553. [Google Scholar] [CrossRef] [PubMed] [Green Version]
- Zuurbier, M.; Hoek, G.; Oldenwening, M.; Lenters, V.; Meliefste, K.; Van den Hazel, P.; Brunekreef, B. Commuters’ exposure to particulate matter air pollution is affected by mode of transport, fuel type, and route. Environ. Health Perspect. 2010, 118, 783–789. [Google Scholar] [CrossRef] [PubMed] [Green Version]
- Rojas-Rueda, D.; De Nazelle, A.; Teixido, O.; Nieuwenhuijsen, M.J. Replacing car trips by increasing bike and public transport in the greater Barcelona metropolitan area: A health impact assessment study. Environ. Int. 2012, 49, 100–109. [Google Scholar] [CrossRef]
- Cepeda, M.; Schoufour, J.; Freak-Poli, R.; Koolhaas, C.M.; Dhana, K.; Bramer, W.M.; Franco, O.H. Levels of ambient air pollution according to mode of transport: A systematic review. Lancet Public Health 2017, 2, e23–e34. [Google Scholar] [CrossRef] [Green Version]
- Peace, H.; Owen, B.; Raper, D.W. Identifying the contribution of different urban highway air pollution sources. Sci. Total Environ. 2004, 334–335, 347–357. [Google Scholar] [CrossRef]
- Tsai, D.H.; Wu, Y.H.; Chan, C.C. Comparisons of commuter’s exposure to particulate matters while using different transportation modes. Sci. Total Environ. 2008, 405, 71–77. [Google Scholar] [CrossRef]
- Wu, C.F.; Lin, H.I.; Ho, C.C.; Yang, T.H.; Chen, C.C.; Chan, C.C. Modeling horizontal and vertical variation in intraurban exposure to PM2.5 concentrations and compositions. Environ. Res. 2014, 133, 96–102. [Google Scholar] [CrossRef]
- Carvalho, A.M.; Krecl, P.; Targino, A.C. Variations in individuals’ exposure to black carbon particles during their daily activities: A screening study in Brazil. Environ. Sci. Pollut. Res. Int. 2018, 25, 18412–18423. [Google Scholar] [CrossRef] [PubMed]
- Targino, A.C.; Rodrigues, M.V.C.; Krecl, P.; Cipoli, Y.A.; Ribeiro, J.P.M. Commuter exposure to black carbon particles on diesel buses, on bicycles and on foot: A case study in a Brazilian city. Environ. Sci. Pollut. Res. Int. 2018, 25, 1132–1146. [Google Scholar] [CrossRef] [PubMed]
- De Nazelle, A.; Bode, O.; Orjuela, J.P. Comparison of air pollution exposures in active vs. passive travel modes in European cities: A quantitative review. Environ. Int. 2017, 99, 151–160. [Google Scholar] [CrossRef] [PubMed]
- Chaney, R.A.; Sloan, C.D.; Cooper, V.C.; Robinson, D.R.; Hendrickson, N.R.; McCord, T.A.; Johnston, J.D. Personal exposure to fine particulate air pollution while commuting: An examination of six transport modes on an urban arterial roadway. PLoS ONE 2017, 12, e0188053. [Google Scholar] [CrossRef] [PubMed]
- Karanasiou, A.; Viana, M.; Querol, X.; Moreno, T.; De Leeuw, F. Assessment of personal exposure to particulate air pollution during commuting in European cities--recommendations and policy implications. Sci. Total Environ. 2014, 490, 785–797. [Google Scholar] [CrossRef]
- Liu, Y.; Lan, B.; Shirai, J.; Austin, E.; Yang, C.; Seto, E. Exposures to Air Pollution and Noise from Multi-Modal Commuting in a Chinese City. Int. J. Environ. Res. Public Health 2019, 16, 2539. [Google Scholar] [CrossRef] [PubMed] [Green Version]
- Okokon, E.O.; Yli-Tuomi, T.; Turunen, A.W.; Taimisto, P.; Pennanen, A.; Vouitsis, I.; Samaras, Z.; Voogt, M.; Keuken, M.; Lanki, T. Particulates and noise exposure during bicycle, bus and car commuting: A study in three European cities. Environ. Res. 2017, 154, 181–189. [Google Scholar] [CrossRef]
- Suarez, L.; Mesias, S.; Iglesias, V.; Silva, C.; Caceres, D.D.; Ruiz-Rudolph, P. Personal exposure to particulate matter in commuters using different transport modes (bus, bicycle, car and subway) in an assigned route in downtown Santiago, Chile. Environ. Sci. Process Impacts 2014, 16, 1309–1317. [Google Scholar] [CrossRef]
- Transport Volume Statistics. Available online: https://web.metro.taipei/RidershipCounts/E/10806e.htm (accessed on 20 June 2019).
- Martins, V.; Moreno, T.; Minguillon, M.C.; van Drooge, B.L.; Reche, C.; Amato, F.; De Miguel, E.; Capdevila, M.; Centelles, S.; Querol, X. Origin of inorganic and organic components of PM2.5 in subway stations of Barcelona, Spain. Environ. Pollut. 2016, 208, 125–136. [Google Scholar] [CrossRef] [PubMed] [Green Version]
- Minguillon, M.C.; Reche, C.; Martins, V.; Amato, F.; De Miguel, E.; Capdevila, M.; Centelles, S.; Querol, X.; Moreno, T. Aerosol sources in subway environments. Environ. Res. 2018, 167, 314–328. [Google Scholar] [CrossRef]
- Moreno, T.; Querol, X.; Martins, V.; Minguillon, M.C.; Reche, C.; Ku, L.H.; Eun, H.R.; Ahn, K.H.; Capdevila, M.; De Miguel, E. Formation and alteration of airborne particles in the subway environment. Environ. Sci Process. Impacts 2017, 19, 59–64. [Google Scholar] [CrossRef] [PubMed]
- Martins, V.; Moreno, T.; Mendes, L.; Eleftheriadis, K.; Diapouli, E.; Alves, C.A.; Duarte, M.; De Miguel, E.; Capdevila, M.; Querol, X.; et al. Factors controlling air quality in different European subway systems. Environ. Res. 2016, 146, 35–46. [Google Scholar] [CrossRef] [PubMed] [Green Version]
- Martins, V.; Moreno, T.; Minguillon, M.C.; Amato, F.; De Miguel, E.; Capdevila, M.; Querol, X. Exposure to airborne particulate matter in the subway system. Sci. Total Environ. 2015, 511, 711–722. [Google Scholar] [CrossRef] [Green Version]
- Park, D.U.; Ha, K.C. Characteristics of PM10, PM2.5, CO2 and CO monitored in interiors and platforms of subway train in Seoul, Korea. Environ. Int. 2008, 34, 629–634. [Google Scholar] [CrossRef]
- Zheng, H.L.; Deng, W.J.; Cheng, Y.; Guo, W. Characteristics of PM2.5, CO2 and particle-number concentration in mass transit railway carriages in Hong Kong. Environ. Geochem. Health 2017, 39, 739–750. [Google Scholar] [CrossRef] [PubMed]
- Velasco, E.; Retama, A.; Segovia, E.; Ramos, R. Particle exposure and inhaled dose while commuting by public transport in Mexico City. Atmos. Environ. 2019, 219, 117044. [Google Scholar] [CrossRef]
- Ministry of the Interior, Republic of China. Demography Quarterly. Available online: https://www.ris.gov.tw/documents/data/en/3/Demographic-Quarterly(Spring-2019).pdf (accessed on 20 June 2019).
- Elitech. Field Evaluation, Elitech Temtop LKC-1000S+. Available online: http://www.aqmd.gov/docs/default-source/aq-spec/field-evaluations/elitech-temtop-lkc-1000s---field-evaluation.pdf?sfvrsn=14 (accessed on 2 January 2021).
- Elitech. Laboratory Evaluation: Elitech Temtop LKC-1000S+. Available online: http://www.aqmd.gov/docs/default-source/aq-spec/laboratory-evaluations/elitech-temtop-lkc-1000s---lab-evaluation.pdf?sfvrsn=8 (accessed on 3 January 2021).
- Yang, G.-L. Spatial and seasonal variation of PM10 massconcentrations in Taiwan. Atmos. Environ. 2002, 36, 3403–3411. [Google Scholar] [CrossRef]
- Environmental Protection Administration, R.T. Manual Monitoring of Fine Suspended Particulates. Available online: https://airtw.epa.gov.tw/ENG/EnvMonitoring/Central/spm.aspx (accessed on 20 June 2019).
- Environmental Protection Administration, R.T. Introduction and Background of Quality Assurance. Available online: https://airtw.epa.gov.tw/ENG/Information/QualityAssurance/QAIntro.aspx (accessed on 20 June 2019).
- Chen, Y.Y.; Sung, F.C.; Chen, M.L.; Mao, I.F.; Lu, C.Y. Indoor Air Quality in the Metro System in North Taiwan. Int. J. Environ. Res. Public Health 2016, 13, 1200. [Google Scholar] [CrossRef] [Green Version]
- EPA, U. Exposure Assessment Tools by Routes—Inhalation. Available online: https://www.epa.gov/expobox/exposure-assessment-tools-routes-inhalation (accessed on 10 March 2020).
- Moreno, T.; Martins, V.; Querol, X.; Jones, T.; BeruBe, K.; Minguillon, M.C.; Amato, F.; Capdevila, M.; De Miguel, E.; Centelles, S.; et al. A new look at inhalable metalliferous airborne particles on rail subway platforms. Sci. Total Environ. 2015, 505, 367–375. [Google Scholar] [CrossRef] [Green Version]
- Costa, S.; Ferreira, J.; Silveira, C.; Costa, C.; Lopes, D.; Relvas, H.; Borrego, C.; Roebeling, P.; Miranda, A.I.; Teixeira, J.P. Integrating health on air quality assessment–Review report on health risks of two major European outdoor air pollutants: PM and NO(2). J. Toxicol. Environ. Health B Crit. Rev. 2014, 17, 307–340. [Google Scholar] [CrossRef] [PubMed]
- Chiang, K.C.; Liao, C.M. Heavy incense burning in temples promotes exposure risk from airborne PMs and carcinogenic PAHs. Sci. Total Environ. 2006, 372, 64–75. [Google Scholar] [CrossRef]
- Liao, C.M.; Chen, S.C.; Chen, J.W.; Liang, H.M. Contributions of Chinese-style cooking and incense burning to personal exposure and residential PM concentrations in Taiwan region. Sci. Total Environ. 2006, 358, 72–84. [Google Scholar] [CrossRef]
- Lui, K.H.; Bandowe, B.A.M.; Ho, S.S.H.; Chuang, H.C.; Cao, J.J.; Chuang, K.J.; Lee, S.C.; Hu, D.; Ho, K.F. Characterization of chemical components and bioreactivity of fine particulate matter (PM2.5) during incense burning. Environ. Pollut. 2016, 213, 524–532. [Google Scholar] [CrossRef] [PubMed]
- Wang, B.; Lee, S.C.; Ho, K.F.; Kang, Y.M. Characteristics of emissions of air pollutants from burning of incense in temples, Hong Kong. Sci. Total Environ. 2007, 377, 52–60. [Google Scholar] [CrossRef]
- Font, A.; Guiseppin, L.; Blangiardo, M.; Ghersi, V.; Fuller, G.W. A tale of two cities: Is air pollution improving in Paris and London? Environ. Pollut. 2019, 249, 1–12. [Google Scholar] [CrossRef]
- Li, H.C.; Chiueh, P.T.; Liu, S.P.; Huang, Y.Y. Assessment of different route choice on commuters’ exposure to air pollution in Taipei, Taiwan. Environ. Sci. Pollut. Res. Int. 2017, 24, 3163–3171. [Google Scholar] [CrossRef] [PubMed]
- Number of Motor Vehicles in Taiwan. Ministry of Transportation and Communications ROC (Taiwan). Available online: https://stat.motc.gov.tw/mocdb/stmain.jsp?sys=100&funid=b3301 (accessed on 20 June 2019).
- Lin, Y.C.; Chou, F.C.; Li, Y.C.; Jhang, S.R.; Shangdiar, S. Effect of air pollutants and toxic emissions from various mileage of motorcycles and aerosol related carcinogenicity and mutagenicity assessment. J. Hazard. Mater. 2019, 365, 771–777. [Google Scholar] [CrossRef] [PubMed]
- Woodall, G.M.; Hoover, M.D.; Williams, R.; Benedict, K.; Harper, M.; Soo, J.C.; Jarabek, A.M.; Stewart, M.J.; Brown, J.S.; Hulla, J.E.; et al. Interpreting Mobile and Handheld Air Sensor Readings in Relation to Air Quality Standards and Health Effect Reference Values: Tackling the Challenges. Atmosphere 2017, 8, 182. [Google Scholar] [CrossRef] [Green Version]
- Badura, M.; Batog, P.; Drzeniecka-Osiadacz, A.; Modzel, P. Evaluation of Low-Cost Sensors for Ambient PM2.5 Monitoring. J. Sens. 2018, 2018, 5096540. [Google Scholar] [CrossRef] [Green Version]
- Sayahi, T.; Butterfield, A.; Kelly, K.E. Long-term field evaluation of the Plantower PMS low-cost particulate matter sensors. Environ. Pollut. 2019, 245, 932–940. [Google Scholar] [CrossRef] [PubMed]
- Liu, X.; Jayaratne, R.; Thai, P.; Kuhn, T.; Zing, I.; Christensen, B.; Lamont, R.; Dunbabin, M.; Zhu, S.; Gao, J.; et al. Low-cost sensors as an alternative for long-term air quality monitoring. Environ. Res. 2020, 185, 109438. [Google Scholar] [CrossRef] [PubMed]


| Time of the Day (hr:min) | Location | PM2.5 (µg/m3) |
|---|---|---|
| 8:07 | In the alley | 65 |
| 8:10 | Intersection of major roads | 95 |
| 8:15 | Intersection of major roads | 100 |
| 8:17 | Hospital 1st floor | 65 |
| 8:20 | Office in the hospital | 57.5 |
| Time of the Day (hr:min) | Location | PM2.5 (µg/m3) |
|---|---|---|
| 14:21 | In front of the hospital | 24 |
| 14:25 | Bus stop by a major road | 36 |
| 14:36 | Bus stop by a major road | 22.5 |
| 14:40 | Crossing the road | 45 |
| 14:42 | Walking by a temple | 85 |
| 14:46 | At family courtyard | 42.5 |
| 14:48 | Inside the house | 20 |
| Time of the Day (hr:min) | Location | PM2.5 (µg/m3) |
|---|---|---|
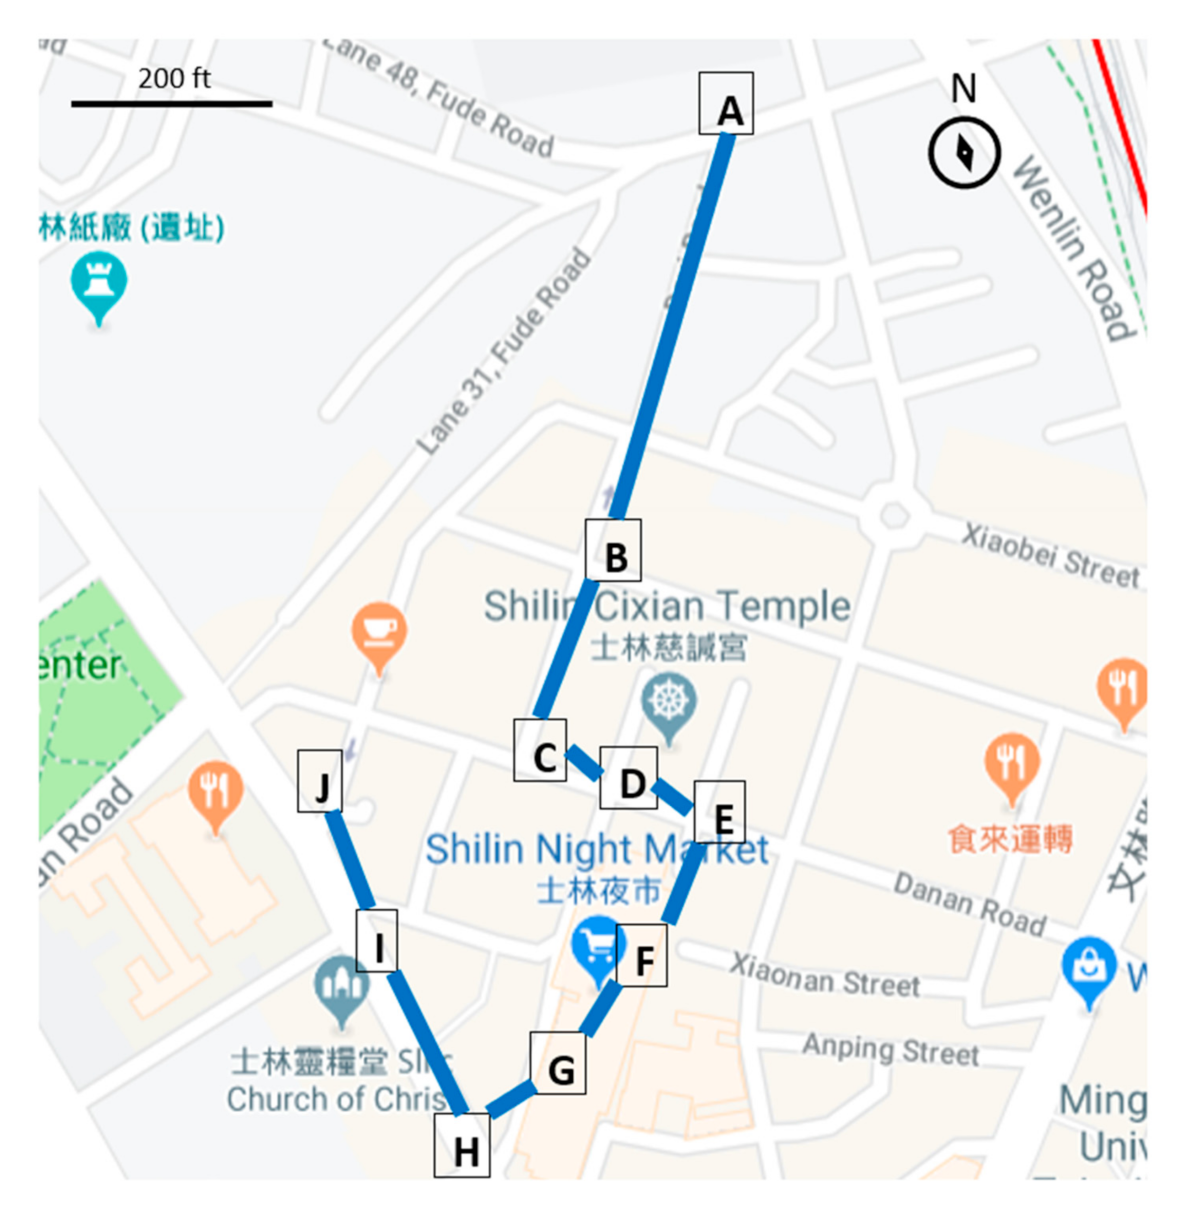
| 16:32 | A (Fude Rd/Daxi Rd intersection) | 30 |
| 16:35 | B (Daxi Rd/Dabei Rd intersection) | 40 |
| 16:38 | C (Danan Rd) | 35 |
| 16:57 | D (Outside a Mazu temple) | 700 |
| 17:05 | E Night market entrance | 40 |
| 17:10 | F (Fried oyster cake stand) | 400 |
| 17:15 | F Fried chicken patty stand | 150 |
| 17:17 | F Grilled steak stand | 95 |
| 17:20 | G (Road by the night market) | 85 |
| 17:25 | H (night market/Jihe Rd Intersection) | 80 |
| 17:27 | I (Jihe Rd/Chengde Rd intersection) | 50 |
| 17:30 | J (Jihe Rd/Xiaoshi St intersection) | 30 |
Publisher’s Note: MDPI stays neutral with regard to jurisdictional claims in published maps and institutional affiliations. |
© 2021 by the authors. Licensee MDPI, Basel, Switzerland. This article is an open access article distributed under the terms and conditions of the Creative Commons Attribution (CC BY) license (http://creativecommons.org/licenses/by/4.0/).
Share and Cite
Wang, C.-Y.; Lim, B.-S.; Wang, Y.-H.; Huang, Y.-C.T. Identification of High Personal PM2.5 Exposure during Real Time Commuting in the Taipei Metropolitan Area. Atmosphere 2021, 12, 396. https://doi.org/10.3390/atmos12030396
Wang C-Y, Lim B-S, Wang Y-H, Huang Y-CT. Identification of High Personal PM2.5 Exposure during Real Time Commuting in the Taipei Metropolitan Area. Atmosphere. 2021; 12(3):396. https://doi.org/10.3390/atmos12030396
Chicago/Turabian StyleWang, Cheng-Yi, Biing-Suan Lim, Ya-Hui Wang, and Yuh-Chin T. Huang. 2021. "Identification of High Personal PM2.5 Exposure during Real Time Commuting in the Taipei Metropolitan Area" Atmosphere 12, no. 3: 396. https://doi.org/10.3390/atmos12030396