Article

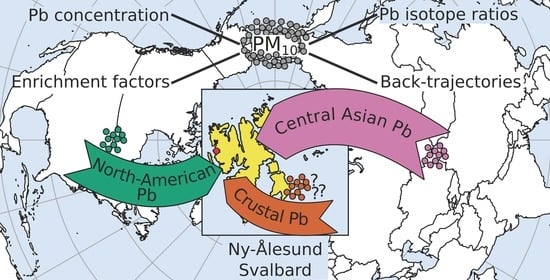
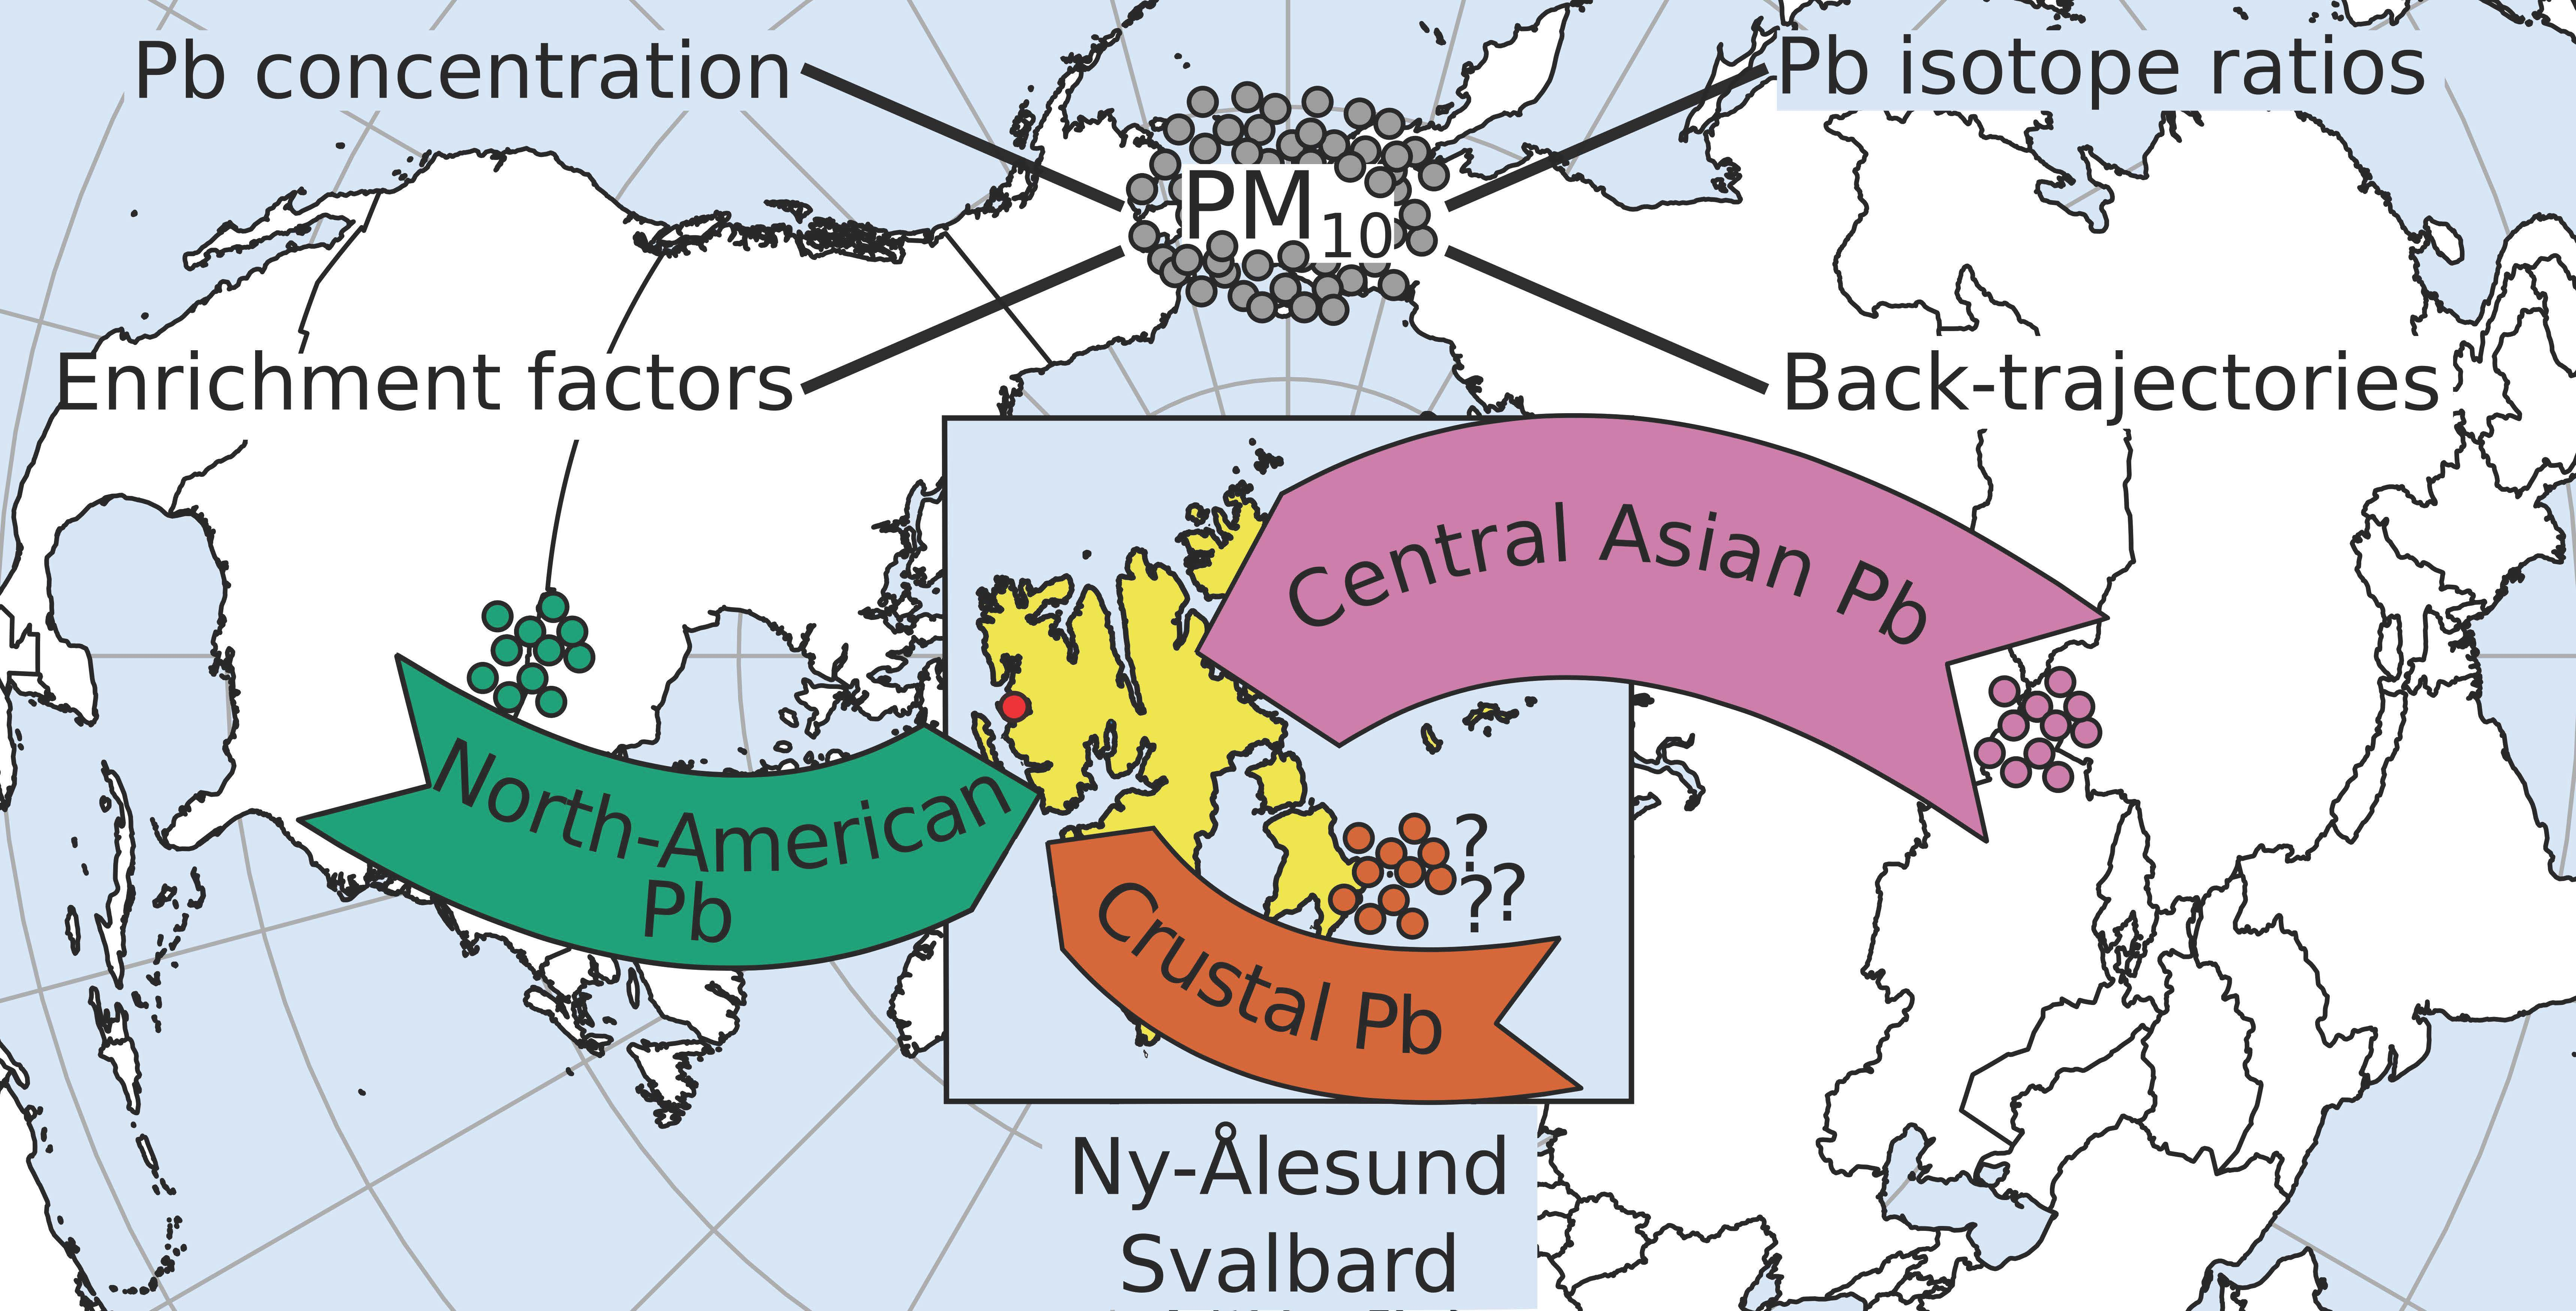
Potential Source Areas for Atmospheric Lead Reaching Ny-Ålesund from 2010 to 2018

1
Department of Chemistry and Industrial Chemistry, University of Genoa, 16146 Genoa, Italy
2
Department of Chemistry, Biology and Biotechnologies, University of Perugia, 06123 Perugia, Italy
*
Author to whom correspondence should be addressed.
Atmosphere 2021, 12(3), 388; https://doi.org/10.3390/atmos12030388
Submission received: 25 February 2021 / Revised: 12 March 2021 / Accepted: 15 March 2021 / Published: 17 March 2021
(This article belongs to the Special Issue Air Pollution in the Polar Regions: Levels, Sources and Trends)

Abstract

:
Lead content, enrichment factors, and isotopic composition (208Pb/206Pb and 207Pb/206Pb) measured in atmospheric particulate matter (PM10) samples collected for nine years at Ny-Ålesund (Svalbard islands, Norwegian Arctic) during spring and summer are presented and discussed. The possible source areas (PSA) for particulate inferred from Pb isotope ratio values were compared to cluster analysis of back-trajectories. Results show that anthropogenic Pb dominates over natural crustal Pb, with a recurring higher influence in spring, compared to summer. Crustal Pb accounted for 5–16% of the measured Pb concentration. Anthropogenic Pb was affected by (i) a Central Asian PSA with Pb isotope signature compatible with ores smelted in the Rudny Altai region, at the Russian and Kazakhstan border, which accounted for 85% of the anthropogenic Pb concentration, and (ii) a weaker North American PSA, contributing for the remaining 15%. Central Asian PSA exerted an influence on 71–86% of spring samples, without any significant interannual variation. On the contrary, 59–87% of summer samples were influenced by the North American PSA, with higher contributions during 2015 and 2018. Back-trajectory analysis agreed on the seasonal difference in PSA and highlighted a possible increased influence for North American air masses during summer 2010 and 2018, but not for summer 2015.

Graphical Abstract

1. Introduction

The global climatic variations occurring in the last decades have a substantial impact on the polar areas, particularly in the Arctic. In fact, regions at higher latitudes are the first to be affected by the effects of climatic changes [1], resulting in fast rises in surface air temperature [2], reduction of sea ice extent and thickness [3], warming of the surface waters [4], and permafrost thawing [5]. Moreover, the Arctic can receive many anthropogenic pollutants via long-range atmospheric transport processes [6,7,8]. Besides its function as a carrier of contaminants, atmospheric aerosol also plays a significant role in the evolution of local and global climate, interacting with the solar radiation and influencing the balance of the energy fluxes in the atmosphere and the characteristics of clouds (e.g., [9,10]). Hence, a deep comprehension of pollutants’ transport mechanisms to the Arctic can provide significant insights into climate change effects, requiring a long-term assessment of their sources, transport pathways, and seasonal variations [9].
Several chemical markers are used to trace the origin of atmospheric aerosol to the Arctic, including nss-SO42− [11] and black carbon [12] as tracers of anthropogenic sources, methanesulfonic acid as an indication of phytoplanktonic S-compounds emissions [13], and nss-Mg and nss-Ca as dust tracers [14,15]. Moreover, trace metal concentrations have been used to discriminate between anthropogenic and natural inputs, by using enrichment factors, or to observe a different seasonal origin of the airborne particulate matter (e.g., [16,17]). However, lead isotope ratios represent today the most valuable tool for the identification of the source areas of atmospheric particulate matter, having been used in several environmental studies [18], also in the Arctic [19].
In fact, lead has four stable isotopes, 204Pb, 206Pb, 207Pb and 208Pb; the last three are due to the radioactive decay of 238U, 235U, and 232Th, respectively. Therefore, their relative abundance in ores is related to both the abundance of their parent nuclide at the moment of the ore formation, and to the rock’s age. As a consequence, the lead isotopic composition has a relatively high variability among the ores all over the world, which is not significantly affected by physical or bio(chemical) isotopic fractionation. Moreover, Pb is introduced into the atmosphere by weathering processes and human activities (such as smelting, mining, and the use of antiknocking agents for fossil fuels), associating mainly with particles with diameter comprised between 0.4 and 0.9 mm when it is of anthropic origin [20]. Hence, the study of lead isotopic composition can help to evaluate the different sources of atmospheric particulate matter and, in combination with meteorological data, the movement of air-masses over the mid- and high-latitudes of the Northern Hemisphere [21,22]. However, despite the valuable information provided by this proxy on the status and trends of atmosphere Pb contamination, isotopic ratios data for the Arctic atmosphere are scarce and sporadic [19] and, to the best of our knowledge, no systematic long-term record is currently available.
In this paper, we present the results of a systematic investigation on the lead content and isotopic composition of the atmospheric particulate sampled at Ny-Ålesund (Svalbard Islands, Norwegian Arctic) during spring-summer campaigns over nine years (2010–2018). In particular, short-term data reported in previous studies [16,23,24] have been gathered with new results from more recent campaigns, obtaining valuable information over a more extended period, more suitable for climatic assessments than single campaigns. The overall dataset has been extensively subjected to statistical evaluation and used to assess the potential source areas and the natural and anthropogenic contributions to atmospheric lead, with the support of calculated air mass back-trajectories.

2. Methods

2.1. Sampling

Details about the sampling procedure and characteristics of the sampling site are reported in [23]. In summary, the sampling of PM10 (particles with aerodynamic equivalent diameter lower than 10 µm) was carried out over nine spring-summer (April-September) campaigns, from 2010 to 2018, on the roof of the Gruvebadet (GVB) observatory at Ny-Ålesund, Svalbard (78.918° N, 11.895° E) with a 4-day resolution. The sampling device was a Tecora ECHO PM sampler, which employed 90-mm hydrophilic PTFE membrane filters (H100A090C) by Advantec MFS (Dublin, CA, USA) and operated at the constant flow rate of 200 L/min. Filter efficiency was >99% for 0.3 μm particles and the sampling time was 96 h for each filter.
The GVB observatory is located in a clean area, about 800 m south-west of the Ny-Ålesund village. Anthropic activities, including snowmobile traffic, are forbidden at a distance up to 500 m from the sampling site. Because of the particular orography of the Kongsfjorden, the dominant winds follow the north-west to south-est direction, preventing the sampling site to be affected by air masses coming from Ny-Ålesund [25]. After the sampling, the filters were placed in polystyrene Petri dishes, sealed in polyethylene bags, and stored at −20 °C until analysis.

2.2. Sample Analysis

The samples were submitted to analysis following the procedure and the quality control protocol described in [23]. Briefly, a quarter of each filter was solubilized with 2 mL of Trace Select® Ultra 65% nitric acid from Sigma−Aldrich (St. Louis, MO, USA) and 0.5 mL of Suprapur® 30% hydrogen peroxide from Merck (Darmstadt, Germany), using the microwave digestion system MARS-5 (CEM, Matthews, NC, USA). After the digestion, the samples were diluted to 10 mL with ultrapure water (Milli-Q from Merck Millipore) and analyzed by inductively coupled plasma mass spectrometry (Elan DRCII by Perkin−Elmer, Waltham, MA, USA) for the determination of lead content and isotope ratios.
The concentration of Al was determined by inductively coupled plasma atomic emission spectrometry (Vista PRO by Varian, Springvale, Australia), using Lu as internal standard to correct for non-spectral interferences and instrumental drift. Further details and instrumental parameters are reported in [16].

2.3. Data Analysis

Data analysis and plots were performed using R [26].
The R package mclust was used to perform Gaussian finite mixture modeling (GMM) on Pb isotope ratio data [27]. This technique is commonly used both for decomposing and estimating density distributions, both for unsupervised clustering, when the modeled variables are expected to behave like a multivariate normal distribution.
In summary, the algorithm models the data by a finite number of clusters with different shape, orientation, and volume parameters. Finally, the model with the lowest Bayesian Information Criterion (BIC) is selected as the best candidate to represent the structure of the data [27].
Data are reported as median ± interquartile range (IQR) throughout the manuscript, unless stated otherwise.
Kruskal–Wallis test was used to check whether differences among multiple groups were significant. When significant p-values were achieved, the Dunn’s post-hoc test was performed, adjusting the p-values with the Benjiamini-Hochberg correction. In the text, only the results of the Kruskal-Wallis test or Dunn’s test are reported.
The entire data analysis and figures presented in Section 3.1, Section 3.2, Section 3.3 and Section 3.4 are available as R scripts at https://doi.org/10.5281/zenodo.4484121 (accessed on 16 March 2021) on Zenodo [28]. See Supplementary Material for additional information.

2.4. Back Trajectory Analysis

Air mass back-trajectories (BTs) were calculated using the HYSPLIT 5.0 transport model [29] and meteorological data fields were supplied by the ARL (Air Resources Lab, http://ready.arl.noaa.gov/gdas1.php, accessed on 16 March 2021) archiving programs input data. It produces a 3 hourly, global, 1° latitude/longitude of spatial resolution dataset on pressure surface. In order to characterize the general behavior of air masses in the period 2010–2018, 10-day back-trajectories were run every 6 hours at the Ny-Ålesund endpoint at the altitude of 500, 1000, and 1500 meters above ground level (a.g.l.). Each ensemble of monthly BTs was characterized by cluster analysis, using the package included in the software. BTs have been clustered for 240 h, and the number of clusters for each run has been taken as that giving the last largest change in the total spatial variance. The typical number of monthly clusters ranged between 2 and 4. The number of clusters found for each month was lower than that previously reported [23], as a consequence of the longer period of time considered. The origin of the monthly cluster was attributed by considering the coordinates of the last calculated endpoint of the mean trajectory of each cluster and their routes during the 10 days of simulation. Three geographic macro-sectors were chosen: Eurasia (Europe and Asia), North America (Greenland, Canada, and United States), and Arctic Ocean (Arctic Ocean, Barents Sea, Greenland Sea, and the Northern Norwegian Sea). Moreover, the fraction of the back-trajectories (%BT) belonging to each monthly cluster was computed, as an index of the relative contribution of the different sectors.
Finally, the monthly BTs have been divided into two classes. The first one, called winter, included the BTs from November to April, and the second one, called summer, those from May to October. This sorting was based on the results by [30], who showed that the aerosol transport to the Arctic is significantly different between these periods. The sorted BTs have been characterized by cluster analysis as previously reported. In this case, the number of clusters was generally 3 for the class winter (4 for 2015) and 2 for the class summer (3 for 2016 and 2017). For each cluster, the distance between the first and the last endpoints and the altitude of the last endpoint of the mean trajectory were also defined.

3. Results

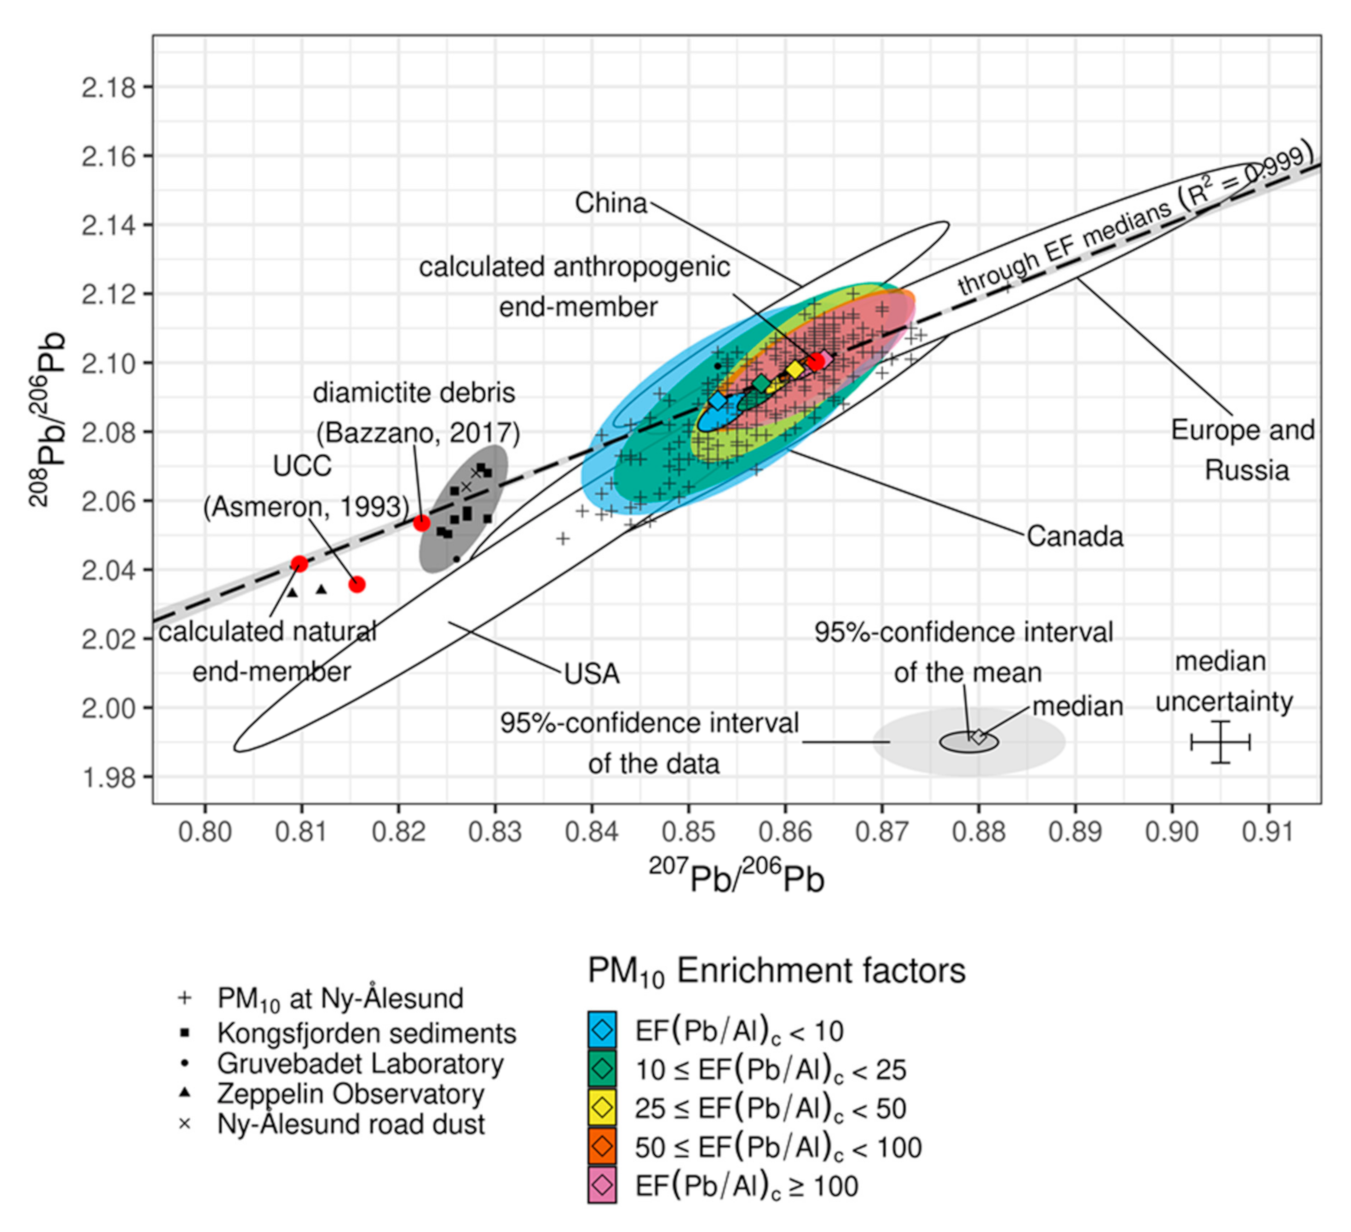
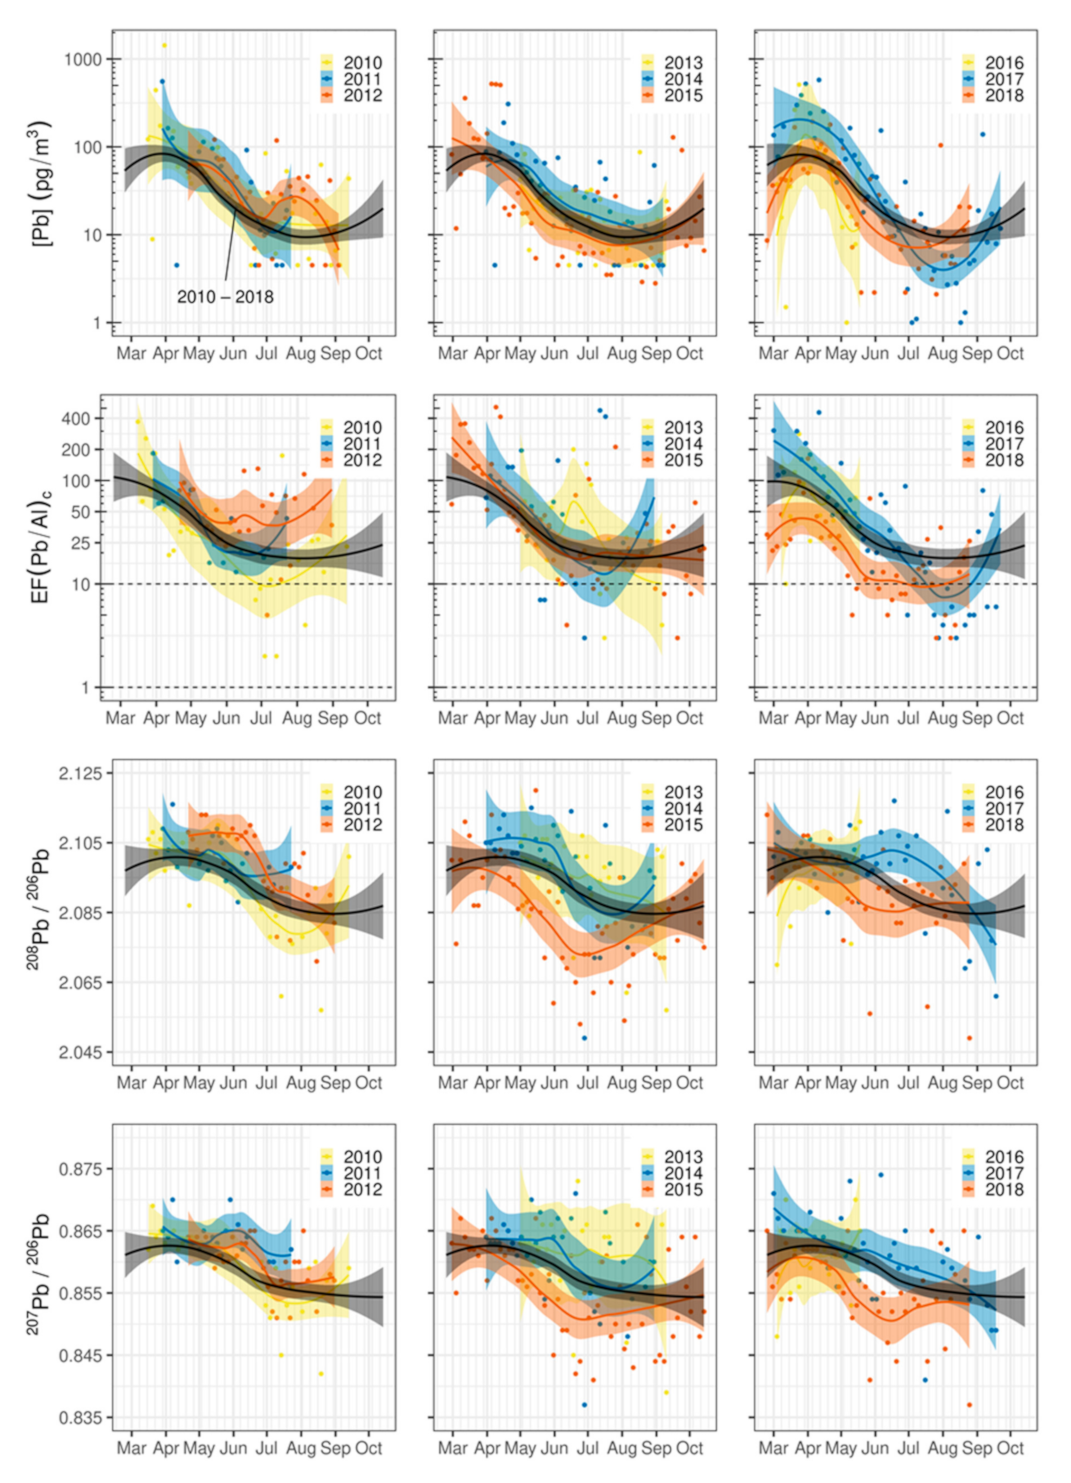
3.1. Lead Concentration, Enrichment, and Isotopic Composition

The investigated dataset is reported in Table S1 from the Supplementary Material and summarized in Table 1. It comprises 331 Pb concentration and Pb isotope ratio values spread over a period of 9 years, from 2010 to 2018.
Pb concentrations are characterized by a mean and median of 59 and 24 pg/m3, respectively, in good agreement with values previously reported for PM10 samples collected in the same area [23,31]. Data appears highly skewed towards higher values and, although three-quarters of the measured Pb concentration values is ≤68 pg/m3, the median of the right-end quarter is about 110 pg/m3 and the maximum measured value is 1428 pg/m3. As a result, the data distribution satisfactorily fits a log-normal distribution with mean = 3.16 ± 0.07 and standard deviation (sd) = 1.34 ± 0.05 (Kolmogorov-Smirnov test, p-value = 0.51).
In order to better investigate the natural and anthropogenic contribution to Pb measured in PM10 samples, enrichment factors (EFs) were calculated using the following equation:
EF Pb / Al c = Pb / Al s Pb / Al UCC
where (Pb/Al)s is the ratio measured in each sample and (Pb/Al)UCC is the mean ratio for the upper continental crust (2.195 × 10⁻⁴, according to [32]). The resulting average EF(Pb/Al) was 65, as that measured in samples collected in previous campaigns [23]. Similar to Pb concentration data, EFs data distribution is strongly skewed towards higher values and satisfactorily fits a log-normal distribution with mean = 3.50 ± 0.07 and sd = 1.17 ± 0.05 (Kolmogorov-Smirnov test, p-value = 0.95).
The values for the two studied Pb isotope ratios appear strongly linearly correlated (r = 0.83 and Pearson product-moment correlation p-value < 0.001), with average values similar to those measured in previous studies on samples collected in the same area [16,23,24], as well as other sites in the high Arctic [19,33,34]. 207Pb/206Pb and 208Pb/206Pb values show a joint distribution which significantly departs from a bivariate normal distribution due to moderate skewness towards lower isotope ratio values (Mardia test and E-test by parametric bootstrap, p-value < 0.001).
The entire dataset shows a strong recurring seasonal trend, with higher values of Pb concentrations, EFs and isotope ratio values in samples collected in spring compared to summer (Mann–Whitney p-value < 0.001). This feature was observed also in previous works [16,23,24,31] and it will be discussed in Section 3.4.

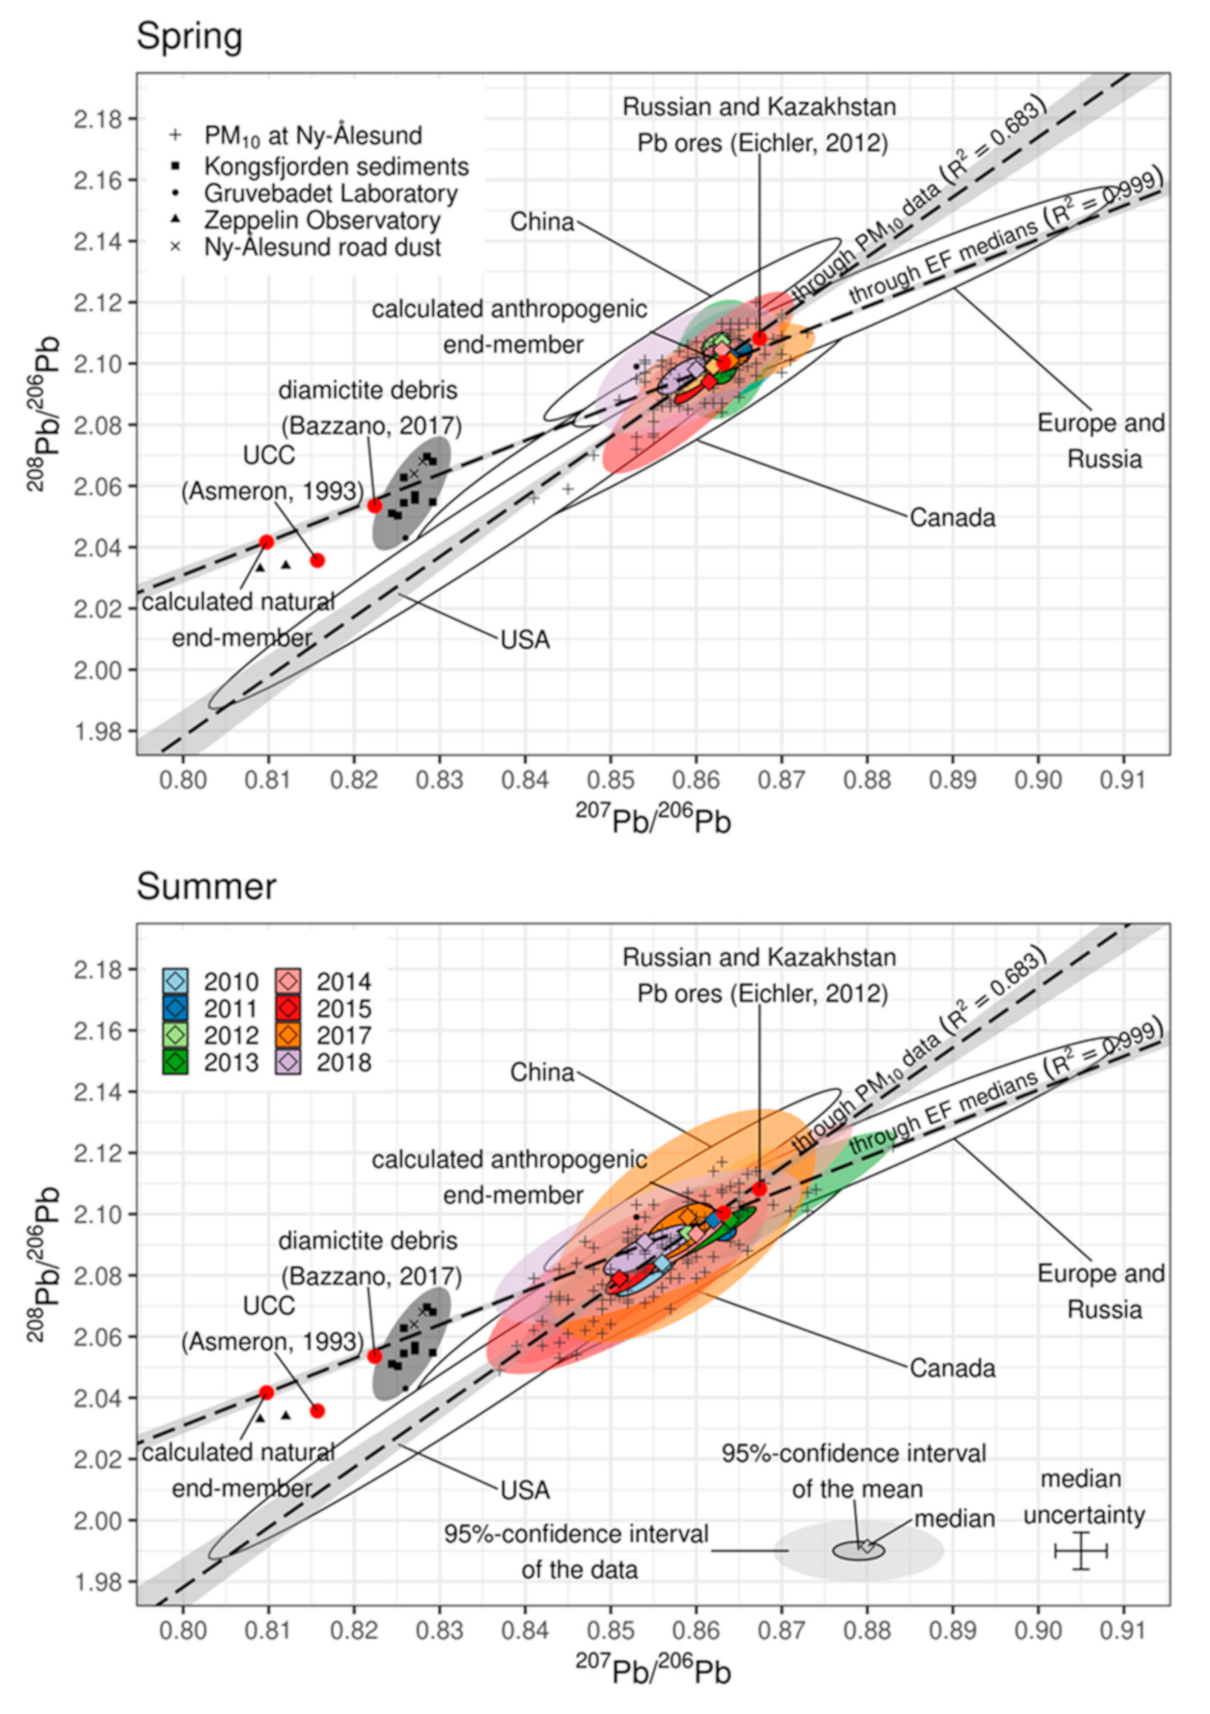
3.2. Natural Contribution to Atmospheric Lead

The signature and magnitude of a possible natural contribution to Pb measured in PM10 samples was investigated by combining information given by both EFs and Pb isotope ratio values. Indeed, calculated 1/EFs, 208Pb/206Pb, and 207Pb/206Pb appeared strongly linearly correlated (Pearson’s p-value < 0,001), with lower EFs associated to relatively low Pb isotope ratios.
However, to reduce the amount of random noise in the data and mitigate the predominance of highly enriched samples compared to moderately and not enriched samples, data were divided into classes of EFs ranges, each containing about the same number of samples. For each EFs class the median EFs and Pb isotope ratio were computed. Finally, robust regression by iterated re-weighted least squares (IWLS) was performed using median Pb isotope ratio values as response variables and median 1/EF as predictor variable. The obtained linear models are reported in Equations (2) and (3).
208Pb/206Pb = −0.059 × 1/EF(Pb/Al)c + 2.100 (R2 = 0.91, p-value = 0.01)
207Pb/206Pb = −0.054 × 1/EF(Pb/Al)c + 0.863 (R2 = 0.90, p-value = 0.01)
Replacing EF(Pb/Al)c = ∞ in Equations (2) and (3), it is possible to calculate the median Pb isotope signature for the anthropogenic end-member, which is 208Pb/206Pb = 2.100 ± 0.003 and 207Pb/206Pb = 0.863 ± 0.001 (95%-confidence interval). Such values are similar to those previously reported for spring samples collected at the same site [16,23,24], as discussed in the following section.
Similarly, for EF(Pb/Al)c = 1 it is possible to calculate the signature for the natural end-member, which is 208Pb/206Pb = 2.041 ± 0.011 and 207Pb/206Pb = 0.810 ± 0.012 (95%-confidence interval).
In Figure 1, the calculated end-members are reported in a three-isotope plot along Pb isotope ratio values measured in PM10, sediment, and soil samples collected near Ny-Ålesund. In addition, the average Pb isotope signature for the upper continental crust (UCC) is reported [35]. The mixing line between the anthropogenic and natural end-members stretches towards the area of Pb isotope ratio values for sediment and soil samples collected in the Kongsfjorden and at Ny-Ålesund and passes close to both the Pb isotope signature for local diamictite [36] and for UCC. This finding suggests that the natural contribution to atmospheric Pb at Ny-Ålesund is due to crustal material. However, due to the uncertainty in the calculated signature for the natural end-member, it is not possible to clearly relate such input to a local or distant source.
The relative contribution of this crustal input was estimated by applying Equation (4) and taking into account the median Pb isotope ratio values reported in Table 1 (m subscript) and the signatures calculated for the two end-members (ant and nat subscript for anthropogenic and natural end-members, respectively).
% n a t = 1 P 208 b / P 206 b m P 208 b / P 206 b n a t 2 + P 207 b / P 206 b m P 207 b / P 206 b n a t 2 P 208 b / P 206 b a n t P 208 b / P 206 b n a t 2 + P 207 b / P 206 b a n t P 207 b / P 206 b n a t 2
The results suggest that the crustal input accounts for about 5–16% of Pb measured in PM10 samples, corresponding to a concentration of 1–4 pg/m3. Although the estimated crustal contribution is relatively small, this finding refines the results reported for PM10 samples collected at Ny-Ålesund from 2010 to 2014, for which, as a result of the relatively small dataset analyzed, the contribution from natural sources appeared negligible [23]. On the other hand, [37], using geochemical and mineralogical characterization by X-ray diffraction and scanning electron microscopy coupled with X-ray microanalysis, demonstrated the importance and the impact of both local and distant High Latitude Dust sources for atmospheric particulate samples collected at Ny-Ålesund.
Figure 1. Three-isotope plot for Pb isotope ratio values measured in PM10 samples collected at Ny-Ålesund from 2010 to 2018. Ellipses represent the joint-distribution (95% confidence level) of literature data. Canada and USA: [22,38], Europe: [21,22,39] Russia: [21,22], China: [22,40]. Pb isotope ratio values for crustal samples from: Kongsfjorden sediments and diamictite debris [36,41,42], UCC [35], Gruvebadet Laboratory, Zeppelin Observatory and Ny-Ålesund road dust are unpublished data from the research group of the University of Genoa.
Atmosphere 12 00388 g001

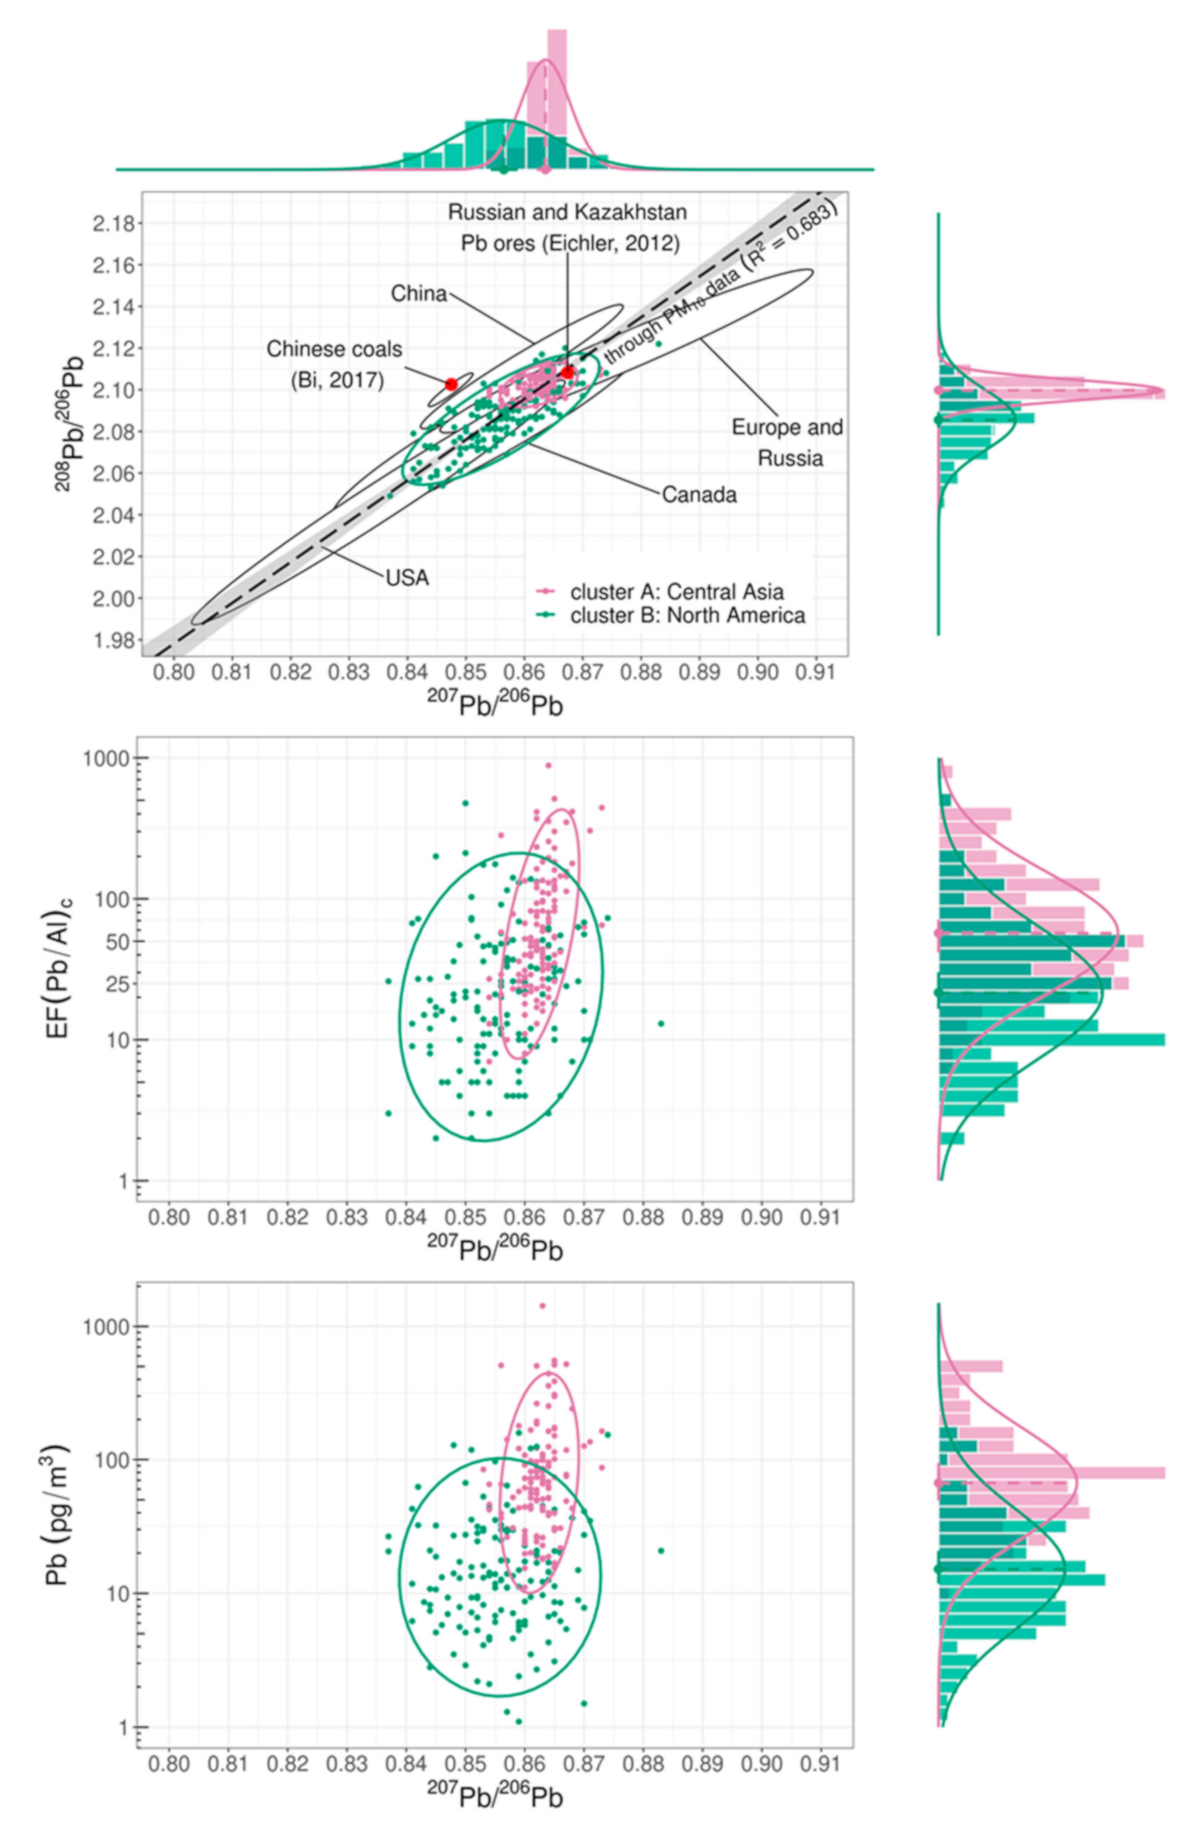
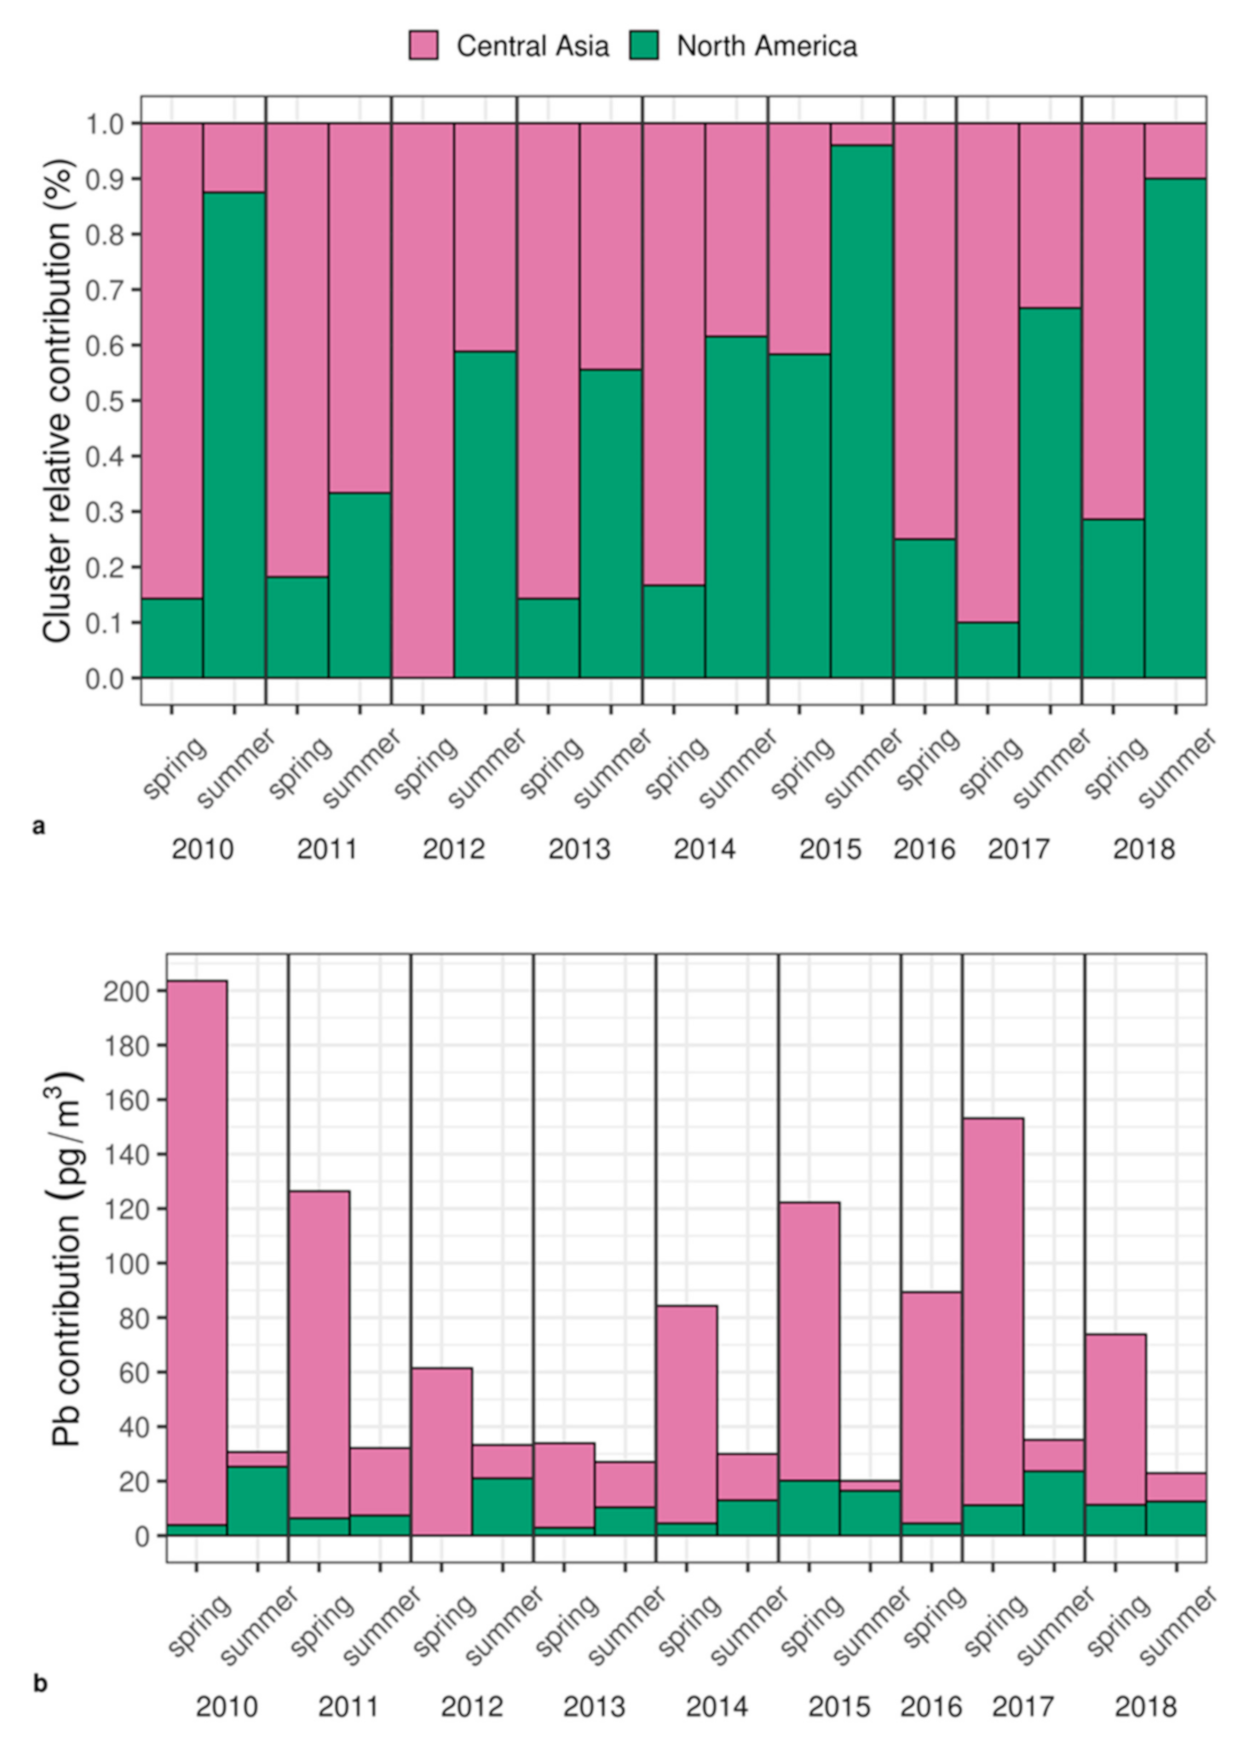
3.3. Disentangling Anthropogenic Contributions to Atmospheric Lead

About 85% of the data has an EF(Pb/Al) > 10, resulting in significant Pb enrichment in comparison to the average UCC and highlighting the role of anthropogenic contributions to atmospheric Pb.
Possible anthropogenic sources can be investigated by comparing measured Pb isotope ratio values with literature reference values. As shown in Figure 1, the Pb isotopic signatures for the collected samples spread across Pb isotope ratio signatures for North American, European, and Chinese atmospheric particulate matter, in accordance with data collected in the previous campaigns [16,23,24]. Comparing the measured Pb isotope ratio data with values measured in other Arctic areas it appeared that the Ny-Ålesund sampling site is subjected to Pb inputs with similar average isotopic signature (208Pb/206Pb = 2.1000 ± 0.0319, 207Pb/206Pb = 0.8628 ± 0.0175), as already reported by [19].
However, similarly to previous campaigns [16,23,24], two distinct Pb isotope ratio signatures were observed for spring and summer samples characterized by 208Pb/206Pb = 2.101 ± 0.010, 207Pb/206Pb = 0.862 ± 0.04 and 208Pb/206Pb = 2.091 ± 0.021, 207Pb/206Pb = 0.857 ± 0.011, respectively, thus indicating the presence of at least two anthropogenic inputs.
In order to better discriminate the different inputs and providing an estimate of their magnitude, Pb isotope ratio values, log-transformed EFs and Pb concentrations were subjected to GMM, obtaining two multivariate Gaussian distributions, as represented in Figure 2.
The two distributions are described by the parameters reported in Table 2 and they define two clusters.
The Pb isotope signature for cluster A is relatively narrow and it is compatible with the values measured in ice cores, dated from 1935 to 1990, collected in the Rudny Altai region, at the Russian border with Kazakhstan and Mongolia (weighted average 208Pb/206Pb = 2.1082 ± 0.0045 and 207Pb/206Pb = 0.8674 ± 0.0020), reflecting inputs from the intensive mining activities in the area [43]. In agreement, similar isotopic values were also found in ores from the main mining sites for Pb extraction in East Kazakhstan and Altai region (Zyranovsk: 208Pb/206Pb = 2.099, 207Pb/206Pb = 0.865 and Leninogorsk: 208Pb/206Pb = 2.098, 207Pb/206Pb = 0.867, [44]). The Pb isotope ratio values for cluster A are scattered on the same range of data obtained by isotope ratio measurements in Greenland snow samples dated from 2003 to 2009, and for which significant influences from Chinese coal combustion and Central Asian aerosols were stated [45].
As shown in Figure 2 and Figure S1 from the Supplementary Material, the Pb isotope signature for cluster A seems to be different from both the weighted average for Chinese coals (208Pb/206Pb = 2.099–2.106, 207Pb/206Pb = 0.846–0.849), as well as the signature for coals produced by different Chinese regions [46], possibly suggesting that input from Chinese coal combustion is not playing a major role in atmospheric Pb reaching Ny-Ålesund.
The Pb isotope signature for cluster B is considerably broader compared to that for cluster A and it is compatible with those reported for lichens [38], snowpack [47], and precipitation samples collected in north-eastern North America [48], as already discussed in [23] for summer samples collected in previous campaigns.
Pb isotope ratio values for cluster B are scattered on the same range of data measured in Greenland ice core samples dated after 1980 and collected at Summit [49] and NorthGRIP camp site (208Pb/206Pb = 2.0908 ± 0.0205, 207Pb/206Pb = 0.8576 ± 0.0130 [33], possibly reflecting mixed contributions from US and Canadian Pb sources.
The A cluster has a significantly higher proportion of spring samples (78%) compared to B cluster (26%, χ2-test, p-value < 0.001). In addition, the A cluster is associated with significantly higher Pb concentrations (68 ± 46 pg/m3) and EFs (52 ± 42) compared to B cluster (13 ± 11 pg/m3 and 21 ± 19, for Pb concentrations and EFs, respectively; Mann–Whitney test p-value < 0.001).
Taking into account the entire studied period, data points with EFs > 10, classified in cluster A and cluster B are associated to 85 and 15% of anthropogenic Pb, respectively, thus reflecting the different contributions from Central Asian and North American sources to atmospheric Pb reaching Ny-Ålesund. This result appears in strong contrast from estimates obtained by modeling for the 1991–2000 period, which reported that European and Russian emissions accounted for 61–68% of Pb deposited above the Arctic Circle, whereas sources in the Asian part of Russia were responsible for about its 20–25% [9]. The disagreement may be the result of local differences within the Arctic or temporal changes in the relative magnitude of main potential source areas for Pb emissions. The same models estimated that less than 10% of Pb deposited above the Arctic Circle was due to Asian sources outside Russian borders [9], whereas recent Pb isotope ratio measurements highlighted an increased influence from Chinese Pb to the Greenland ice-cap, with contributions as high as 73% [33,45].
Figure 2. Result of the Gaussian Mixture Modeling for Pb isotope ratio values, enrichment factors (EFs), and Pb concentration measured in PM10 samples collected at Ny-Ålesund from 2010 to 2018 represented in a three-isotope plot. The regression line for PM10 data was obtained by Deming regression, considering an uncertainty on 208Pb/206Pb values double in comparison to 207Pb/206Pb values. Data for Russian and Kazakhstan Pb ores: [43], data for Chinese coals: [46]. Black ellipses represent the joint-distribution (95% confidence level) of literature data. Canada and USA: [22,38], Europe: [21,22,39] Russia: [21,22], China: [22,40].
Atmosphere 12 00388 g002

3.4. Temporal Variations in Lead Concentration, Enrichment and Isotopic Composition

In Figure 3, temporal trends for Pb concentration, EF, and isotopic composition in PM10 samples are represented. A strong recurring seasonal trend, with higher values in spring compared to summer, is both evident and statistically significant (Wilcoxon test, p-value < 0.001). Such seasonal trend is statistically significant also comparing data for the different months, whereas differences within spring or summer months were not detected (Dunn’s post-hoc test, p-value < 0.001).
Pb concentration appear not affected by significant inter-annual variations (Kruskal–Wallis test, p-value = 0.2), confirming a stationary trend already observed previously and different from the decreasing trend in Pb concentration, described in studies performed on data from late 1990s to the first years of 2000 [6,9,50].
Inter-annual variations did not affect EFs, with the exception of 2018, for which a lower enrichment was observed compared with other years (21 ± 18 and 38 ± 37, for 2018 and other years, respectively; Dunn’s post-hoc test, p-value = 0.002).
Taking into account the Pb isotopic composition, 2015 and 2018 appeared characterized by significantly lower Pb isotope ratio values compared with other years (Dunn’s post-hoc test, p-value < 0.001). Such difference seems to be more pronounced during the summer seasons, as shown by the median values in Figure 4. Interestingly, the median isotopic composition for summer 2018 (208Pb/206Pb = 2.091 ± 0.010, 207Pb/206Pb = 0.854 ± 0.007) lays on the mixing-line between the average anthropogenic and crustal end-members defined in Section 3.2 and it is shifted towards the crustal term in comparison with other years, possibly confirming the higher natural contribution highlighted by EFs. Differently, the median Pb isotope ratio values for summer 2015 (208Pb/206Pb = 2.079 ± 0.017, 207Pb/206Pb = 0.851 ± 0.010) appears to be slightly more influenced by US sources compared to summer data for the other years. Similar to 2015 and 2018, the median Pb isotope ratio value for summer 2010 (208Pb/206Pb = 2.084 ± 0.014, 207Pb/206Pb = 0.856 ± 0.007) appears to differ slightly from those calculated for the other years. However, the number of measured values (n = 13) in 2010 are not enough to claim that the difference is statistically significant.
In Figure 5, seasonal and annual variations for the estimated contribution from Central Asian sources and North American sources are represented. During spring, 71–86% of the samples were assigned to cluster A, reflecting a dominant input from Central Asia, which appeared not significantly affected by inter-annual variations (Pairwise proportion test, p-value > 0.1). Conversely, about 59–87% of summer samples were assigned to cluster B, suggesting the main relative contribution derived from North American inputs. During summer 2015 and 2018, such proportion increased up to 95 and 97% of the samples, resulting in a significantly higher proportion in comparison with 2011 and 2012, for which 33 and 61% of samples were assigned to cluster B (Pairwise proportion test, p-value < 0.05). Taking into account Pb concentrations, both Central Asian and North American inputs are enhanced during spring compared to summer (Wilcoxon test, p-value < 0.001) with about 74 ± 49 and 31 ± 19 pg/m3 of Pb from Central Asian sources during spring and summer, respectively, and 21 ± 13 and 11 ± 9 pg/m3 of Pb from North American sources during spring and summer, respectively.

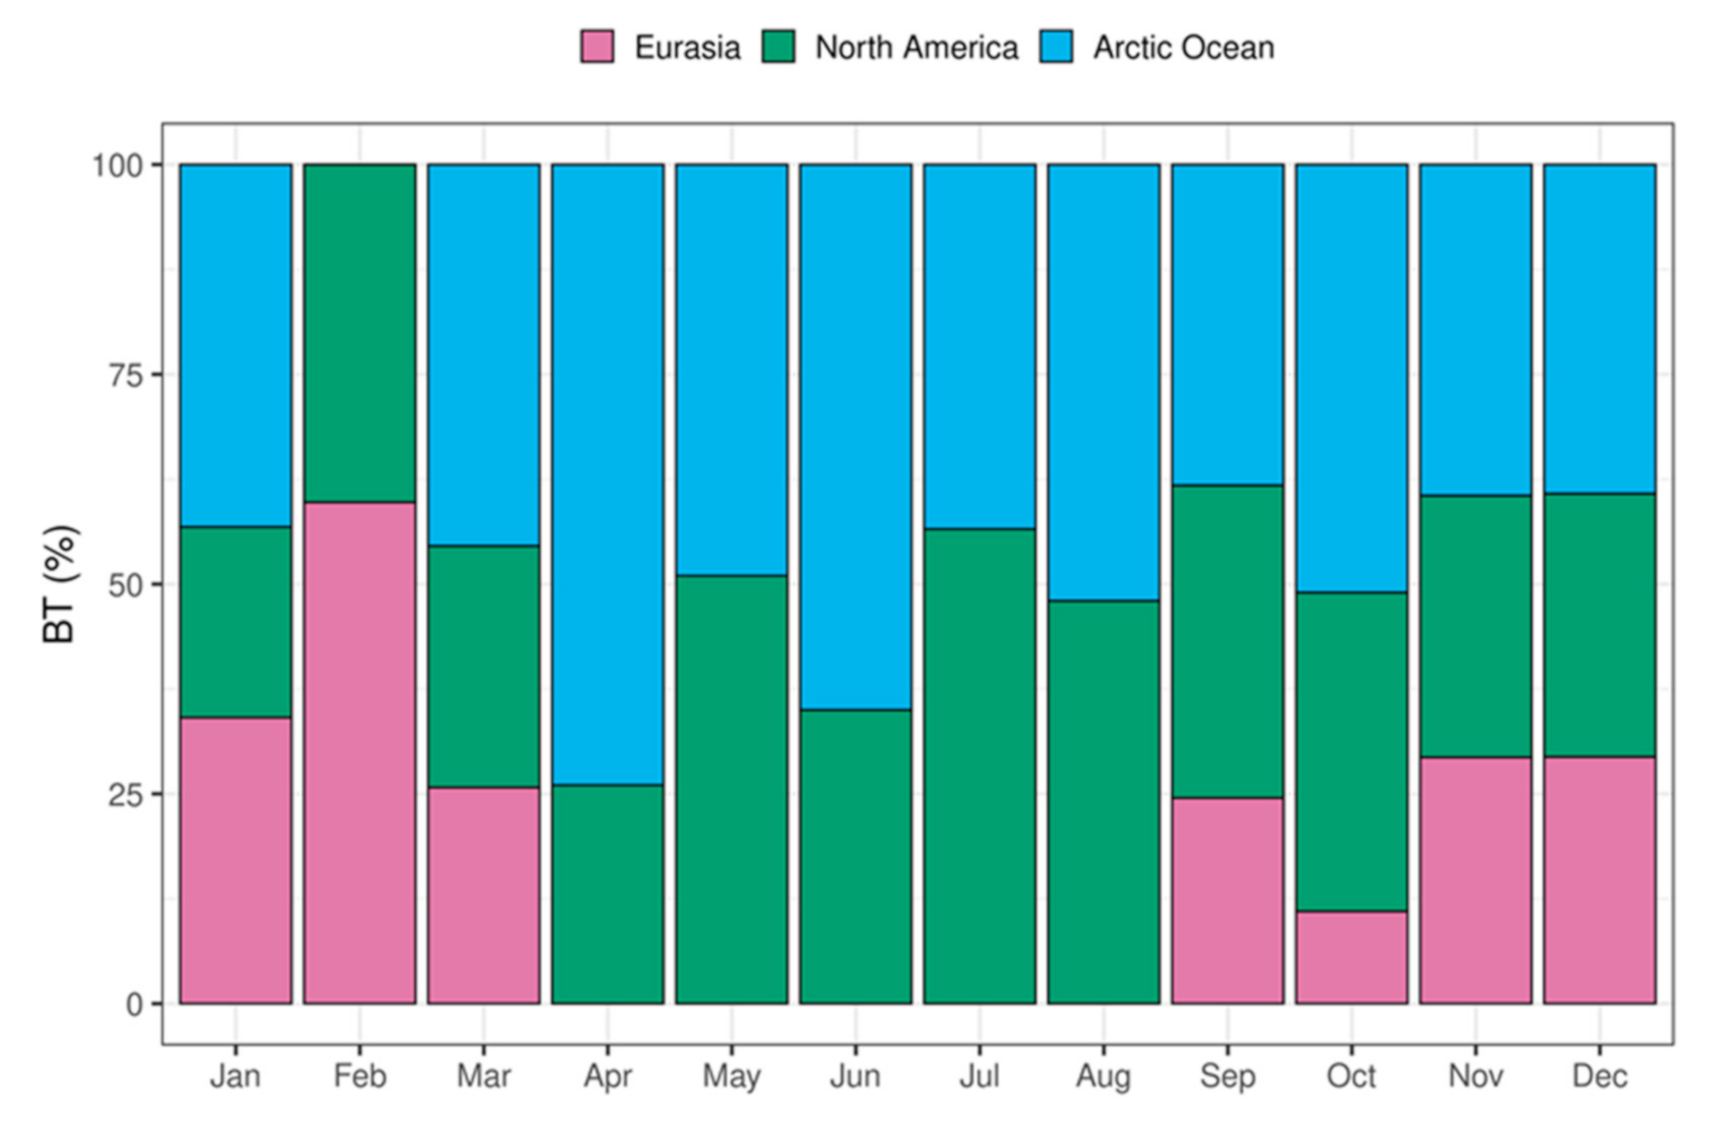
3.5. Back-Trajectory Analysis

In order to investigate the reliability of the interpretation presented in the previous sections, regarding the geographical attribution and the temporal variation in the PSA affecting Pb in the collected PM10 samples, a cluster analysis on calculated BTs was performed. In addition, the analysis of BTs can provide useful insights about the physical characteristics of potentially contaminated air masses reaching the Arctic from lower latitudes. Despite such promising features, it is worth noting that BTs only represent movement of air parcels toward a selected endpoint, whereas the actual deposition of contaminants potentially carried by such air masses further depends by local variables such as the height of the planetary boundary layer and meteorological conditions. Therefore, in the context of PSA investigations and temporal trend analysis, BTs should only be used for qualitative comparisons.
The cluster analysis results of the monthly BTs (Table S2 and Figure S2 from the Supplementary Material), confirm the seasonal trend highlighted by the Pb isotopic composition and EF data, with remarkable differences between the spring and summer months in every year. Considering the median value for each month through the different years, the %BT for the Eurasian macro-sector drops down by moving from the spring to summer, whereas the value for the North American macro-sector increases in that period (Figure 6), even if the difference among the months for this macro-sector is not statistically significant (Kruskal–Wallis test, p-value = 0.69). This result could suggest that the seasonal change in the Pb isotopic composition is mostly driven by the loss of advection from the East.
The monthly BTs were divided into two classes, winter and summer, as described above, and processed by cluster analysis. The results are shown in Table S3 from the Supplementary Material. For the winter class, there is almost one cluster for each geographic macro-sector for each year, while for the summer class there are typically two clusters: One associated with the Arctic Ocean and the other one to North America. Only for 2016 and 2017 can three clusters for summer be observed, with lower differences between the two classes compared to the other years.
Although high interannual variations characterize the patterns, it is possible to highlight some general trends. Considering the number of BTs associated with each cluster, a significant reduction of the Eurasian contribution may be observed by moving from winter to summer, along with a concomitant (minor) increase in the North American air masses.
Regarding the velocity of the advection, estimated by the distance between the first and the last endpoint of the clusters’ mean trajectory, the cluster analysis showed that the air parcels coming from North America move faster in the winter months than in summer (Kruskal-Wallis test, p-value < 0.01) [30,51]. On the other hand, no significant difference between the classes is observed for the Arctic Ocean cluster (Kruskal–Wallis test, p-value = 0.12).
Law and Stohl [51] reported that the winter polar dome over the Arctic lower troposphere forces the warmer and moister air masses from North America and East Asia to travel at a higher altitude than those from Europe and West Asia. This might justify the observed difference between the altitude of the tenth day calculated endpoints for the North American and Eurasian winter back-trajectories, 2286 ± 426 m a.g.l. and 1893 ± 674 m a.g.l., respectively (median ± IQR, Kruskall-Wallis test, p-value = 0.02). Moreover, the altitude of the mean trajectory of the class winter is meaningful higher than that of class summer for North America (1948 ± 309 m a.g.l., Kruskall–Wallis test, p-value = 0.02).
Finally, considering the temporal trend of the fraction of BTs associated with the North American macro-sector for the class summer, 2016 and 2017 showed the lowest values (27 and 26%, respectively), whereas 2018 and 2010 the highest ones (55 and 54%, respectively). What was said previously in Section 3.4, about the slightly significant influence of the western air masses for 2015, unfortunately, does not find support in the results from the study of the BTs.

4. Conclusions

Pb concentration and isotope ratio values measured in PM10 collected at Ny-Ålesund from 2010 to 2018 fall within well-defined ranges and show a recurring seasonal trend.
Most of Pb resulted of anthropogenic origin, with an estimated natural contribution from crustal material ranging from 5 to 16%, by taking into account EFs and Pb isotope ratio values.
Higher concentrations of anthropogenic Pb were observed in spring compared to summer, whereas two different PSA seems to influence the two periods. Spring is dominated by a contribution with a Pb isotopic signature compatible with smelting activities taking place in East Kazakhstan, at the Russian and Mongolian border, whereas in summer, the Central Asian contributions appeared weaker and a less Pb-enriched contribution, with Pb isotope ratios compatible with North American inputs, was more evident. This seasonal pattern and the identified source areas are compatible with results from back-trajectory analysis for air masses reaching Ny-Ålesund in the studied period.
The contribution of the Central Asian inputs was estimated to account for about 85% of the Pb measured in the studied period, whereas the remaining 15% was associated to North American contributions.
The study of inter-annual variability for the relative contributions from Central Asian and North American inputs highlighted a stable dominant contribution from Central Asian inputs in spring, whereas significant differences were evident only during summer. In particular, Pb isotope ratios recorded a possible increased relative contribution from North American inputs during summer 2010, 2015 and 2018, compared to data for the same season in other considered years. Results from back-trajectory analysis showed an increased influence from North American air masses for 2010 and 2018 summer only, suggesting that our current interpretation of Pb isotope ratio data in PM10 from Ny-Ålesund needs to be improved by further studies.
Extending the temporal coverage of the dataset and using other chemical tracers in conjunction with Pb isotope ratios and EFs may help both in the characterization of potential source areas and estimating relative contributions with lower uncertainties.

Supplementary Materials

The following are available online at https://www.mdpi.com/2073-4433/12/3/388/s1, Table S1: Pb concentration (pg/m3), enrichment factors (EFs) and Pb isotope ratio values for PM10 samples collected at Ny-Ålesund from 2010 to 2018. The entire dataset is available in electronic format at https://doi.org/10.5281/zenodo.4484136 (accessed on 16 March 2021), Table S2: Percentage of monthly BTs calculated from 2010 to 2018 associated to the different geographical macro-sector, Table S3: Percentage of BTs, distance between the first and last endpoints (after 240 hours of simulation) and altitude of the last endpoint for the classes winter and summer from 2010 to 2018, Figure S1: Result of the Gaussian Mixture Modeling for Pb isotope ratio values, enrichment factors (EFs) and Pb concentration measured in PM10 samples collected at Ny-Ålesund from 2010 to 2018 represented in a three-isotope plot. The regression line for PM10 data was obtained by Deming regression, considering an uncertainty on 208Pb/206Pb values double in comparison to 207Pb/206Pb values. Data for Chinese coals: [46]. Black ellipses represent the 95% confidence interval of the mean for literature data. Figure S2: Geographic representation of the centroids obtained from the cluster analysis of the monthly BTs from 2010 to 2018, for 1000 m a.g.l as altitude of the endpoint at Ny-Alesund. For the other altitudes (500 and 1500 m a.g.l.) the results are similar. The percentages of the BTs associated to each cluster are also showed.

Author Contributions

Conceptualization, M.G., F.A., and A.B.; methodology, A.B. and D.C.; formal analysis, A.B. and S.B; investigation, A.B. and S.B.; writing—original draft preparation, A.B. and S.B.; writing—review and editing, all authors; visualization, A.B. and S.B.; supervision, M.G. and D.C. All authors have read and agreed to the published version of the manuscript.

Funding

This work has been funded by the Italian National Program of Research in Antarctica (projects PNRA14_00091, PNRA16_00252).

Institutional Review Board Statement

Not applicable.

Informed Consent Statement

Not applicable.

Data Availability Statement

Data available in a publicly accessible repository. The data presented in this study are openly available in Zenodo at [doi], reference number 10.5281/zenodo.4484121.

Acknowledgments

The logistic assistance of the Polar Support Unit of the Italian National Research Council (Department of Earth and Environment) is gratefully acknowledged.

Conflicts of Interest

The authors declare no conflict of interest.

References

  1. IPPC. Climate Change 2007: The Physical Science Basis. Contribution of Working Group I to the Fourth Assessment Report of the Intergovernmental Panel on Climate Change; Solomon, S., Quin, D., Manning, M., Marquis, M., Averyt, K., Tignor, M., LeRoy Miller, H., Jr., Eds.; Cambridge University Press: Cambridge, UK; New York, NY, USA, 2007. [Google Scholar]
  2. Serreze, M.C.; Francis, J.A. The Arctic Amplification Debate. Clim. Chang. 2006, 76, 241–264. [Google Scholar] [CrossRef] [Green Version]
  3. Meier, W.N.; Hovelsrud, G.K.; van Oort, B.E.H.; Key, J.R.; Kovacs, K.M.; Michel, C.; Haas, C.; Granskog, M.A.; Gerland, S.; Perovich, D.K.; et al. Arctic Sea Ice in Transformation: A Review of Recent Observed Changes and Impacts on Biology and Human Activity. Rev. Geophys. 2014, 52, 185–217. [Google Scholar] [CrossRef]
  4. Timmermans, M.-L.; Jayne, S.R. The Arctic Ocean Spices Up. J. Phys. Oceanogr. 2016, 46, 1277–1284. [Google Scholar] [CrossRef]
  5. Blunden, J.; Arndt, D.S.; Hartfield, G. State of the Climate in 2017. Bull. Am. Meteorol. Soc. 2018, 99, Si–S310. [Google Scholar] [CrossRef]
  6. Macdonald, R.W.; Barrie, L.A.; Bidleman, T.F.; Diamond, M.L.; Gregor, D.J.; Semkin, R.G.; Strachan, W.M.J.; Li, Y.F.; Wania, F.; Alaee, M.; et al. Contaminants in the Canadian Arctic: 5 Years of Progress in Understanding Sources, Occurrence and Pathways. Sci. Total Environ. 2000, 254, 93–234. [Google Scholar] [CrossRef]
  7. Muir, D.; Braune, B.; DeMarch, B.; Norstrom, R.; Wagemann, R.; Lockhart, L.; Hargrave, B.; Bright, D.; Addison, R.; Payne, J.; et al. Spatial and Temporal Trends and Effects of Contaminants in the Canadian Arctic Marine Ecosystem: A Review. Sci. Total Environ. 1999, 230, 83–144. [Google Scholar] [CrossRef]
  8. Muir, D.C.G.; Wagemann, R.; Hargrave, B.T.; Thomas, D.J.; Peakall, D.B.; Norstrom, R.J. Arctic Marine Ecosystem Contamination. Sci. Total Environ. 1992, 122, 75–134. [Google Scholar] [CrossRef]
  9. AMAP. AMAP Assessment 2002: Heavy Metals in the Arctic; Arctic Monitoring and Assessment Programme (AMAP): Oslo, Norway, 2004; p. xvi. [Google Scholar]
  10. Ramanathan, V.; Ramana, M.V.; Roberts, G.; Kim, D.; Corrigan, C.; Chung, C.; Winker, D. Warming Trends in Asia Amplified by Brown Cloud Solar Absorption. Nature 2007, 448, 575–578. [Google Scholar] [CrossRef]
  11. Udisti, R.; Bazzano, A.; Becagli, S.; Bolzacchini, E.; Caiazzo, L.; Cappelletti, D.; Ferrero, L.; Frosini, D.; Giardi, F.; Grotti, M.; et al. Sulfate Source Apportionment in the Ny-Ålesund (Svalbard Islands) Arctic Aerosol. Rend. Lincei 2016. [Google Scholar] [CrossRef]
  12. Winiger, P.; Andersson, A.; Eckhardt, S.; Stohl, A.; Gustafsson, Ö. The Sources of Atmospheric Black Carbon at a European Gateway to the Arctic. Nat. Commun. 2016, 7, 12776. [Google Scholar] [CrossRef]
  13. Choi, J.H.; Jang, E.; Yoon, Y.J.; Park, J.Y.; Kim, T.-W.; Becagli, S.; Caiazzo, L.; Cappelletti, D.; Krejci, R.; Eleftheriadis, K.; et al. Influence of Biogenic Organics on the Chemical Composition of Arctic Aerosols. Glob. Biogeochem. Cycles 2019, 33, 1238–1250. [Google Scholar] [CrossRef]
  14. Quinn, P.K.; Shaw, G.; Andrews, E.; Dutton, E.G.; Ruoho-Airola, T.; Gong, S.L. Arctic Haze: Current Trends and Knowledge Gaps. Tellus Ser. B Chem. Phys. Meteorol. 2007, 59, 99–114. [Google Scholar] [CrossRef] [Green Version]
  15. Quinn, P.K.; Miller, T.L.; Bates, T.S. A 3-Year Record of Simultaneously Measured Aerosol Chemical and Optical Properties at Barrow, Alaska. J. Geophys. Res. 2002, 107, 4130. [Google Scholar] [CrossRef]
  16. Bazzano, A.; Ardini, F.; Becagli, S.; Traversi, R.; Udisti, R.; Cappelletti, D.; Grotti, M. Source Assessment of Atmospheric Lead Measured at Ny-Ålesund, Svalbard. Atmos. Environ. 2015, 113, 20–26. [Google Scholar] [CrossRef]
  17. Gong, S.L.; Barrie, L.A. Trends of Heavy Metal Components in the Arctic Aerosols and Their Relationship to the Emissions in the Northern Hemisphere. Sci. Total Environ. 2005, 342, 175–183. [Google Scholar] [CrossRef]
  18. Komárek, M.; Ettler, V.; Chrastný, V.; Mihaljevič, M. Lead Isotopes in Environmental Sciences: A Review. Environ. Int. 2008, 34, 562–577. [Google Scholar] [CrossRef] [PubMed]
  19. Ardini, F.; Bazzano, A.; Grotti, M. Lead Isotopic Ratios in the Arctic Environment. Environ. Chem. 2020, 17, 213–239. [Google Scholar] [CrossRef]
  20. Flament, P.; Bertho, M.L.; Deboudt, K.; Véron, A.; Puskaric, E. European Isotopic Signatures for Lead in Atmospheric Aerosols: A Source Apportionment Based upon 206Pb/207Pb Ratios. Sci. Total Environ. 2002, 296, 35–57. [Google Scholar] [CrossRef]
  21. Bollhöfer, A.; Rosman, K.J.R. The Temporal Stability in Lead Isotopic Signatures at Selected Sites in the Southern and Northern Hemispheres. Geochim. Cosmochim. Acta 2002, 66, 1375–1386. [Google Scholar] [CrossRef]
  22. Bollhöfer, A.; Rosman, K.J.R. Isotopic Source Signatures for Atmospheric Lead: The Northern Hemisphere. Geochim. Cosmochim. Acta 2001, 65, 1727–1740. [Google Scholar] [CrossRef]
  23. Bazzano, A.; Cappelletti, D.; Udisti, R.; Grotti, M. Long-Range Transport of Atmospheric Lead Reaching Ny-Ålesund: Inter-Annual and Seasonal Variations of Potential Source Areas. Atmos. Environ. 2016, 139, 11–19. [Google Scholar] [CrossRef]
  24. Bazzano, A.; Ardini, F.; Grotti, M.; Malandrino, M.; Giacomino, A.; Abollino, O.; Cappelletti, D.; Becagli, S.; Traversi, R.; Udisti, R. Elemental and Lead Isotopic Composition of Atmospheric Particulate Measured in the Arctic Region (Ny-Ålesund, Svalbard Islands). Rend. Lincei 2016. [Google Scholar] [CrossRef]
  25. Mazzola, M.; Viola, A.P.; Lanconelli, C.; Vitale, V. Atmospheric Observations at the Amundsen-Nobile Climate Change Tower in Ny-Ålesund, Svalbard. Rend. Lincei 2016, 27, 7–18. [Google Scholar] [CrossRef]
  26. R Core Team. R: A Language and Environment for Statistical Computing; R Foundation for Statistical Computing: Vienna, Austria, 2012. [Google Scholar]
  27. Scrucca, L.; Fop, M.; Murphy, T.B.; Raftery, A.E. Mclust 5: Clustering, Classification and Density Estimation Using Gaussian Finite Mixture Models. R J. 2016, 8, 289–317. [Google Scholar] [CrossRef] [PubMed] [Green Version]
  28. European Organization for Nuclear Research, OpenAIRE, Zenodo: CERN, Geneva (CH). 2013. Available online: https://www.zenodo.org/ (accessed on 16 March 2021). [CrossRef]
  29. Stein, A.F.; Draxler, R.R.; Rolph, G.D.; Stunder, B.J.B.; Cohen, M.D.; Ngan, F. NOAA’s HYSPLIT Atmospheric Transport and Dispersion Modeling System. Bull. Am. Meteorol. Soc. 2015, 96, 2059–2077. [Google Scholar] [CrossRef]
  30. Freud, E.; Krejci, R.; Tunved, P.; Leaitch, R.; Nguyen, Q.T.; Massling, A.; Skov, H.; Barrie, L. Pan-Arctic Aerosol Number Size Distributions: Seasonality and Transport Patterns. Atmos. Chem. Phys. 2017, 17, 8101–8128. [Google Scholar] [CrossRef] [Green Version]
  31. Conca, E.; Abollino, O.; Giacomino, A.; Buoso, S.; Traversi, R.; Becagli, S.; Grotti, M.; Malandrino, M. Source Identification and Temporal Evolution of Trace Elements in PM10 Collected near to Ny-Ålesund (Norwegian Arctic). Atmos. Environ. 2019, 203, 153–165. [Google Scholar] [CrossRef]
  32. Wedepohl, K.H. The Composition of the Continental Crust. Geochim. Cosmochim. Acta 1995, 58A, 959–960. [Google Scholar] [CrossRef]
  33. Bory, A.J.M.; Abouchami, W.; Galer, S.J.G.; Svensson, A.; Christensen, J.N.; Biscaye, P.E. A Chinese Imprint in Insoluble Pollutants Recently Deposited in Central Greenland as Indicated by Lead Isotopes. Environ. Sci. Technol. 2014, 48, 1451–1457. [Google Scholar] [CrossRef] [PubMed] [Green Version]
  34. Shotyk, W.; Zheng, J.; Krachler, M.; Zdanowicz, C.; Koerner, R.; Fisher, D. Predominance of Industrial Pb in Recent Snow (1994–2004) and Ice (1842–1996) from Devon Island, Arctic Canada. Geophys. Res. Lett. 2005, 32, 1–4. [Google Scholar] [CrossRef]
  35. Asmerom, Y.; Jacobsen, S.B. The Pb Isotopic Evolution of the Earth: Inferences from River Water Suspended Loads. Earth Planet. Sci. Lett. 1993, 115, 245–256. [Google Scholar] [CrossRef]
  36. Bazzano, A.; Rivaro, P.; Soggia, F.; Ardini, F.; Grotti, M. Anthropogenic and Natural Sources of Particulate Trace Elements in the Coastal Marine Environment of Kongsfjorden, Svalbard. Mar. Chem. 2014, 163, 28–35. [Google Scholar] [CrossRef]
  37. Moroni, B.; Arnalds, O.; Dagsson-Waldhauserová, P.; Crocchianti, S.; Vivani, R.; Cappelletti, D. Mineralogical and Chemical Records of Icelandic Dust Sources Upon Ny-Ålesund (Svalbard Islands). Front. Earth Sci. 2018, 6. [Google Scholar] [CrossRef]
  38. Carignan, J.; Simonetti, A.; Gariépy, C. Dispersal of Atmospheric Lead in Northeastern North America as Recorded by Epiphytic Lichens. Atmos. Env. 2002, 36, 3759–3766. [Google Scholar] [CrossRef]
  39. Bollhöfer, A.; Rosman, K.J.R. Lead Isotopic Ratios in European Atmospheric Aerosols. Phys. Chem. Earth Part B Hydrol. Ocean Atmos. 2001, 26, 835–838. [Google Scholar] [CrossRef]
  40. Mukai, H.; Tanaka, A.; Fujii, T.; Zeng, Y.; Hong, Y.; Tang, J.; Guo, S.; Xue, H.; Sun, Z.; Zhou, J.; et al. Regional Characteristics of Sulfur and Lead Isotope Ratios in the Atmosphere at Several Chinese Urban Sites. Environ. Sci. Technol. 2001, 35, 1064–1071. [Google Scholar] [CrossRef]
  41. Bazzano, A.; Ardini, F.; Terol, A.; Rivaro, P.; Soggia, F.; Grotti, M. Effects of the Atlantic Water and Glacial Run-off on the Spatial Distribution of Particulate Trace Elements in the Kongsfjorden. Mar. Chem. 2017, 191, 16–23. [Google Scholar] [CrossRef]
  42. Grotti, M.; Soggia, F.; Ardini, F.; Bazzano, A.; Moroni, B.; Vivani, R.; Cappelletti, D.; Misic, C. Trace Elements in Surface Sediments from Kongsfjorden, Svalbard: Occurrence, Sources and Bioavailability. Int. J. Environ. Anal. Chem. 2017. [Google Scholar] [CrossRef]
  43. Eichler, A.; Tobler, L.; Eyrikh, S.; Gramlich, G.; Malygina, N.; Papina, T.; Schwikowski, M. Three Centuries of Eastern European and Altai Lead Emissions Recorded in a Belukha Ice Core. Environ. Sci. Technol. 2012, 46, 4323–4330. [Google Scholar] [CrossRef]
  44. Mukai, H.; Machida, T.; Tanaka, A.; Vera, Y.P.; Uematsu, M. Lead Isotope Ratios in the Urban Air of Eastern and Central Russia. Atmos. Environ. 2001, 35, 2783–2793. [Google Scholar] [CrossRef]
  45. Kang, J.-H.; Hwang, H.; Han, C.; Hur, S.D.; Kim, S.-J.; Hong, S. Pb Concentrations and Isotopic Record Preserved in Northwest Greenland Snow. Chemosphere 2017, 187, 294–301. [Google Scholar] [CrossRef] [PubMed]
  46. Bi, X.-Y.; Li, Z.-G.; Wang, S.-X.; Zhang, L.; Xu, R.; Liu, J.-L.; Yang, H.-M.; Guo, M.-Z. Lead Isotopic Compositions of Selected Coals, Pb/Zn Ores and Fuels in China and the Application for Source Tracing. Environ. Sci. Technol. 2017, 51, 13502–13508. [Google Scholar] [CrossRef]
  47. Simonetti, A.; Gariépy, C.; Carignan, J. Pb and Sr Isotopic Compositions of Snowpack from Québec, Canada: Inferences on the Sources and Deposition Budgets of Atmospheric Heavy Metals. Geochim. Cosmochim. Acta 2000, 64, 5–20. [Google Scholar] [CrossRef]
  48. Sherman, L.S.; Blum, J.D.; Dvonch, J.T.; Gratz, L.E.; Landis, M.S. The Use of Pb, Sr, and Hg Isotopes in Great Lakes Precipitation as a Tool for Pollution Source Attribution. Sci. Total Environ. 2015, 502, 362–374. [Google Scholar] [CrossRef] [PubMed]
  49. Rosman, K.J.R.; Chisholm, W.; Boutron, C.F.; Candelone, J.P.; Hong, S. Isotopic Evidence to Account for Changes in the Concentration of Lead in Greenland Snow between 1960 and 1988. Geochim. Cosmochim. Acta 1994, 58, 3265–3269. [Google Scholar] [CrossRef]
  50. Steinnes, E.; Berg, T.; Uggerud, H.T. Three Decades of Atmospheric Metal Deposition in Norway as Evident from Analysis of Moss Samples. Sci. Total Environ. 2011, 412–413, 351–358. [Google Scholar] [CrossRef] [PubMed]
  51. Law, K.S.; Stohl, A. Arctic Air Pollution: Origins and Impacts. Science 2007, 315, 1537–1540. [Google Scholar] [CrossRef] [Green Version]
Figure 3. Time series for Pb concentrations, enrichment factors (EFs) and 208Pb/206Pb, 207Pb/206Pb isotope ratio values measured in PM10 samples at Ny-Ålesund from 2010 to 2018. Solid lines are calculated by locally estimated scatterplot smoothing (loess) and black solid line represent the smoothed time series for the period 2010–2018.
Atmosphere 12 00388 g003
Figure 4. Annual median Pb isotope ratio values for PM10 samples collected at Ny-Ålesund from 2010 to 2018 during spring and summer, represented in three-isotope plots. Black ellipses represent the joint-distribution (95% confidence level) of literature data. Canada and USA: [22,38], Europe: [21,22,39] Russia: [21,22], China: [22,40].
Atmosphere 12 00388 g004
Figure 5. Spring and summer contributions from Central Asian and North American to anthropogenic atmospheric Pb measured in PM10 samples collected at Ny-Ålesund from 2010 to 2018. (a) percentage of samples assigned to each possible source, (b) estimated Pb concentrations.
Atmosphere 12 00388 g005
Figure 6. Median of the fraction of back-trajectories belonging to clusters associated to the macro-sectors Eurasia, North America, and Arctic Ocean (defined in the text) for the period 2010–2018.
Atmosphere 12 00388 g006
Table 1. Summary statistics for Pb concentration, isotope ratio values, and crustal enrichment factors (EFs) for PM10 samples collected at Ny-Ålesund from 2010 to 2018. Median absolute deviation (MAD) and interquartile range (IQR) are reported as robust estimations of data dispersion. Data above the limit of quantification of the analytical techniques are reported as n > LoQ.
Pb (pg/m3)207Pb/206Pb208Pb/206PbEF(Pb/Al)c
Mean590.8592.09465
Std. Dev1190.0070.01497
Min1.00.8372.0492.0
Q18.20.8552.08715
Median240.8612.09833
Q3640.8642.10368
Max14280.8832.122883
MAD280.0060.01233
IQR550.0090.01653
Skewness6.2−0.6−0.93.9
n > LoQ300286286287
n331331331331
Table 2. Parameters for the two clusters resulting from Gaussian Mixture Modeling (GMM) on Pb isotope ratio, enrichment factors (EFs), and Pb concentration values measured in PM10 samples collected at Ny-Ålesund from 2010 to 2018.
ParametersCluster A: Central AsiaCluster B: North America
Mean208Pb/206Pb = 2.1019
207Pb/206Pb = 0.8623
log(EF) = 1.76
log(Pb) = 1.82
208Pb/206Pb = 2.0870
207Pb/206Pb = 0.8563
log(EF) = 1.33
log(Pb) = 1.80
Standard deviation208Pb/206Pb = 0.0052
207Pb/206Pb = 0.0036
log(EF) = 0.43
log(Pb) = 0.41
208Pb/206Pb = 0.0151
207Pb/206Pb = 0.0079
log(EF) = 0.47
log(Pb) = 0.45
Covariance208Pb/206Pb, 207Pb/206Pb = 1.1 × 10⁻⁵
208Pb/206Pb, log(EF) = 6.5 × 10⁻⁴
208Pb/206Pb, log(Pb) = 4.2 × 10⁻⁴
207Pb/206Pb, log(EF) = 6.7 × 10⁻⁴
207Pb/206Pb, log(Pb) = 3.6 × 10⁻⁴
log(EF), log(Pb) = 0.11
208Pb/206Pb, 207Pb/206Pb = 9.6 × 10⁻⁵
208Pb/206Pb, log(EF) = 7.8 × 10⁻⁴
208Pb/206Pb, log(Pb) = 5.1 × 10⁻⁴
207Pb/206Pb, log(EF) = 8.0 × 10⁻⁴
207Pb/206Pb, log(Pb) = 4.3 × 10⁻⁴
log(EF), log(Pb) = 0.13
Publisher’s Note: MDPI stays neutral with regard to jurisdictional claims in published maps and institutional affiliations.

