1. Introduction
Solar ultraviolet (UV) radiation is the main environmental risk factor leading to adverse health outcomes such as skin cancers and cataracts [
1,
2,
3]. However, the dose-response relationship between UV exposure and the occurrence of health outcomes is not yet fully understood. The strong inter- and intra-individual (anatomical) variations in the UV doses received make exposure assessment difficult. While low UV doses have beneficial effects on human health (such as triggering vitamin D production), moderate and high UV doses have been linked to skin damage, ocular disease, and immune suppression [
4]. Existing dose-response models are based on crude exposure indicators, such as the average number of hours spent outdoors each day (indicating chronic exposure) or a history of sunburn (indicating acute exposure) [
2]. Chronic exposure has been linked to squamous cell and basal cell carcinomas, while acute exposure has been linked to the more deadly melanoma skin cancers [
1,
5]. A better knowledge of the effective dose received and the spatial and temporal patterns of exposure is therefore essential for developing better dose-response models, furthering epidemiological research, and improving public health regarding skin cancers and other health outcomes.
The most common approach for the quantification of individual solar UV doses received during a defined exposure setting is personal dosimetry, where a dosimeter is worn on a specific anatomic zone, commonly the wrist or chest [
6,
7]. However, there are a range of factors that introduce an unknown level of uncertainty to dosimetry measurements. Individual factors include body posture, the use of protective clothing (hats, sunglasses), sunscreen usage, and individual variations in shade-seeking behaviour [
8,
9,
10]. Environmental factors include cloudiness, ozone, atmospheric turbidity, sun elevation (season, time of day), altitude, surface reflectivity, and the abundance of shading from man-made cover (e.g., structures) or natural cover (e.g., trees) [
10,
11]. Measurement errors include poorly mounted and misaligned dosimeters [
12], the hardware-based uncertainties of each particular dosimeter [
13,
14,
15], and the psychological effect that wearing a dosimeter can encourage a higher degree of shade-seeking behaviour in participants (the Hawthorne effect) [
16]. Some of these challenges can be overcome by increasing the number of measurements and participants in a campaign, but this is costly and fails to address those factors that introduce a systematic bias.
Surveys are a common alternative approach to personal dosimetry for assessing UV exposure as they avoid the costly process of buying and calibrating large numbers of dosimeters. The surveys are used to determine average exposure times of selected population groups. Sometimes this information is used to infer the average UV exposure [
17,
18], but more commonly, the annual UV doses or annual averaged daily UV doses (indicative of chronic UV exposure) have been estimated by integrating ambient UV data over average exposure times [
19]. (Sometimes daily doses are computed assuming complete exposure, representing the maximum possible dose [
20].) The ambient UV is typically taken from satellite-derived clear-sky UV data which includes only a limited consideration of environmental factors (such as cloudiness) that significantly affect UV intensity [
21,
22] although such studies sometimes explicitly account for the average effect of cloudiness [
23,
24]. Other studies avoid satellite data all together by using all-sky UV data measured by the nearest meteorological station [
25]. Surveys can also be utilised without relying on any ambient UV data as some studies have estimated annual doses by relating different activities to average exposures as determined by personal dosimetry [
26,
27]. The doses determined from surveys have rarely been validated at the population level [
28]. While each study has its own limitations, the use of surveys to estimate annual UV doses is fundamentally aimed at investigating chronic UV exposure. It is thus most limited by the inability to query day-to-day variations in doses that would allow an investigation of acute exposure episodes.
The advent of smartphone technology has presented new opportunities for studying and communicating the dangers of UV exposure. There are many apps that provide easy access to UV information but do not attempt to estimate specific doses received by the user. The few such apps that have been subject to peer-reviewed study have been found to achieve low levels of user uptake and engagement [
29,
30] and sometimes offer unreliable data [
31]. Those apps that do attempt to estimate user doses often rely on an external (usually wearable) device to connect to the phone [
32], and so are still burdensome to the user and prone to dosimeter-related measurement errors. A recent review on the topic [
32] noted just one example of an app attempting to estimate doses without using an external device: the HappySun app developed by Morelli et al. [
33]. Once triggered by the user, this app integrates real time satellite-derived clear-sky UV data to estimate doses, even accounting for sunscreen usage. The doses have been validated as accurate in controlled, clear-sky conditions, however, the app is limited to use by outdoor sunbathers only as it does not account for the effects of posture.
In this study, we present a new approach using satellite-derived ambient UV data and exposure ratio (ER) modelling to accurately estimate personal UV doses. We build upon the work of survey-based approaches and the smartphone app developed by Morelli et al. to ensure that our approach is suitable for use in a smartphone app, while also overcoming many of the limitations of previous works and still circumventing the shortcomings of personal dosimeters. Unlike survey-based approaches, our technique is suitable for analysing both chronic and acute UV exposure and, by utilising ER modelling, our approach can be applied far more generally than that of Morelli et al. Recent papers have discussed the core principles of estimating personal doses from ambient UV data and ERs and the promise this approach holds for the future of public health and epidemiology research related to UV exposure [
19,
34], but this is the first publication to calculate and validate doses using such an approach. Satellite-based personal UV dose estimation can serve as an accessible, low-cost method for accurately estimating UV exposure on a population level, thereby aiding epidemiology research into health outcomes related to UV exposure and public health efforts targeting overexposed or at-risk populations.
2. Methods
There are three key data sources for this paper: the dosimetry measurements, the satellite-derived UV climatology, and the model for estimating ERs. The dosimetry measurements come from two campaigns conducted in Switzerland. All of them have been carried out using CIE erythemally [
35,
36] weighted spore film dosimeters (BioSense, Bornheim, Germany). They had a limit of detection of 100 J/m
2 (1 SED), with a standard deviation uncertainty of ±5 to ±20% (dose dependent) [
37,
38]. In total, 97 dosimeter measurements were taken from various anatomic zones on builders in Swiss villages for a 2005 campaign [
39] and a further 31 dosimeter measurements were taken from the foreheads of ski instructors in the Swiss Alps as a part of an unpublished 2008 campaign. These dosimetry measurements include additional information essential for this research, specifically the date, location, and start and end times for each exposure period. The builders’ data also includes the predominant posture during the exposure period and the anatomic zone upon which the dosimeter was mounted. The complete dataset is included as
Supplementary Material.
The second key data source for this paper is the recently published UV climatology for Switzerland from Vuilleumier et al. [
11]. By utilising a variety of satellite data sources, this climatology is able to provide the all-sky, erythemally-weighted UV intensity across Switzerland from 2004 to 2018. It includes multiple key advancements over previously available data. In addition to having a particularly high spatial resolution (1.5–2 km) and temporal resolution (one hour), it also accounts for almost all environmental factors that can significantly affect a UV dose, namely cloudiness, ozone, atmospheric turbidity, sun elevation, altitude, and surface reflectivity. Cloudiness is especially important as it can have a drastic effect on erythemal UV intensity at the ground-level, and yet it was not accounted for by Morelli et al. [
33] in their attempts to calculate satellite-based UV dose estimates. The Vuilleumier et al. climatology has been validated with ground measurements at multiple locations and represents the state-of-the-art in terms of satellite-based all-sky UV estimation. The data are given in units of W m
−2; multiplying by 40 converts these values to UV-Index (UVI) values, therefore, one hour of exposure to 1 UVI is equivalent to 0.9 standard erythemal doses (SED, 100 J m
−2) on a flat horizontal surface.
The third key data source for this paper is the ER model. With the exception of sunbathers, people do not lie horizontally and fully exposed to the sun, so a transformation is required to estimate UV doses affecting human subjects performing common activities. An ER, sometimes referred to as an ERTA (exposure ratio to ambience), is the ratio between the ambient erythemal UV intensity for a flat horizontal surface and the actual amount received by a particular anatomic zone on a person. It is important to consider the posture of a person when estimating anatomical ERs; for example, a person’s face is exposed with a certain ER when in a standing posture, but if the person looks down, their face is more shaded and so the corresponding ER would be lower. Historically, ERs have been calculated empirically by comparing dosimetry measurements to the ambient UV doses measured simultaneously using a meteorological instrument placed near the exposure location [
34,
40]. More recently, detailed light simulations by Vernez et al. (2011, 2015a) [
41,
42] led to the development of a mathematical model that can be used to calculate these posture-dependent anatomic ERs without the need for dosimetry measurements. Their approach involves a digital manikin placed in a static posture within the light simulation, rotating four times an hour with average environmental conditions for the Swiss plateau. The radiation received by each anatomic zone on the digital manikin is integrated into daily doses, which are then compared to the total ambient UV dose to give the ERs. By performing many such simulations, they fitted a polynomial model to calculate ERs based on three variables: posture, anatomic zone, and the daily minimal solar zenith angle representing the solar elevation at midday (thereby allowing seasonal variation in the ERs). The model includes five postures: standing with arms down, standing with arms up, bowing, sitting, and kneeling. The model also includes thirteen possible anatomic zones: face, skull, back of hand, forearm, upper arm, back of neck, shoulder, top of shoulder, belly, upper back, lower back, thigh, and calf.
In this paper, we perform three main calculations. First, we use the date, time, and location information that accompanies the dosimetry measurements and the Vuilleumier et al. erythemal UV climatology to calculate satellite-based ambient UV dose estimates for each corresponding dosimetry measurement. This is equivalent to the ambient UV for a flat horizontal surface measured at the corresponding date, time, and location. This calculation can be written as
where
UV represents the Vuilleumier et al. satellite-derived UV climatology from which values can be pulled based on the latitude (
), longitude (
),
and
.
represents what we call the exposure schedule. This includes information about the times of day that the subject is outdoors (i.e., exposed) versus indoors. This information can be represented as a vector of 24 values corresponding to the proportion of time exposed for each hour of the day. So, a subject that is outdoors only from 9 a.m. to 10 a.m. would have a value of 1 for the tenth entry of their exposure schedule, while all other entries would be zero. If the subject was instead exposed from 9:15 a.m. to 10:15 a.m., the tenth entry of their exposure schedule’s time component would be 0.75, i.e., the proportion of the hour for which the subject was exposed and, by the same logic, the eleventh entry would be 0.25. This calculation is similar to those performed by Morelli et al. [
33] and some survey-based studies [
21], except they only account for the time and location of the exposure period, whereas our approach includes a much more complete consideration of the environmental factors that affect the dose simply by utilising the Vuilleumier et al. all-sky UV climatology, as opposed to clear-sky UV data.
The second main calculation performed in this paper is that of satellite-based personal UV dose estimations. This is similar to the ambient dose calculation above, but with the inclusion of ER modelling, thereby making the dose estimates (in principle) equivalent to the corresponding dosimetry measurements, barring any consideration of dosimeter-related measurement errors. This calculation can be written as
where
ER is the function described by Vernez et al. [
42] that depends only on a subject’s posture (
), anatomic zone (
), and the daily minimal solar Zenith angle (
mSZA), itself a function of date and latitude. In principle, posture could also be a function of the hour, for example, builders may have done a job sitting for one hour and then be standing for the next hour. However the dosimetry measurements used in this study do not include sufficient information to describe more than a single posture per subject.
The satellite-based ambient and personal UV dose estimates are plotted against the corresponding dosimetry measurements to visualise the relationship between these dose estimates and dose measurements. While individual and environmental factors are mostly accounted for by our method, the measurement errors that affect dosimetry are not. Given that the Vuilleumier et al. climatology has already been validated [
11], we know that our ambient UV dose estimates are accurate. Therefore, to illustrate the challenges of personal dosimetry, the third main calculation performed in this paper is an empirical calculation of ERs by comparing the
calculations from Equation (
1) to the corresponding dosimetry measurements. These empirical ER estimates can be compared across the different postures and anatomic zones, as well as to other empirical ER estimates in the broader literature.
3. Results
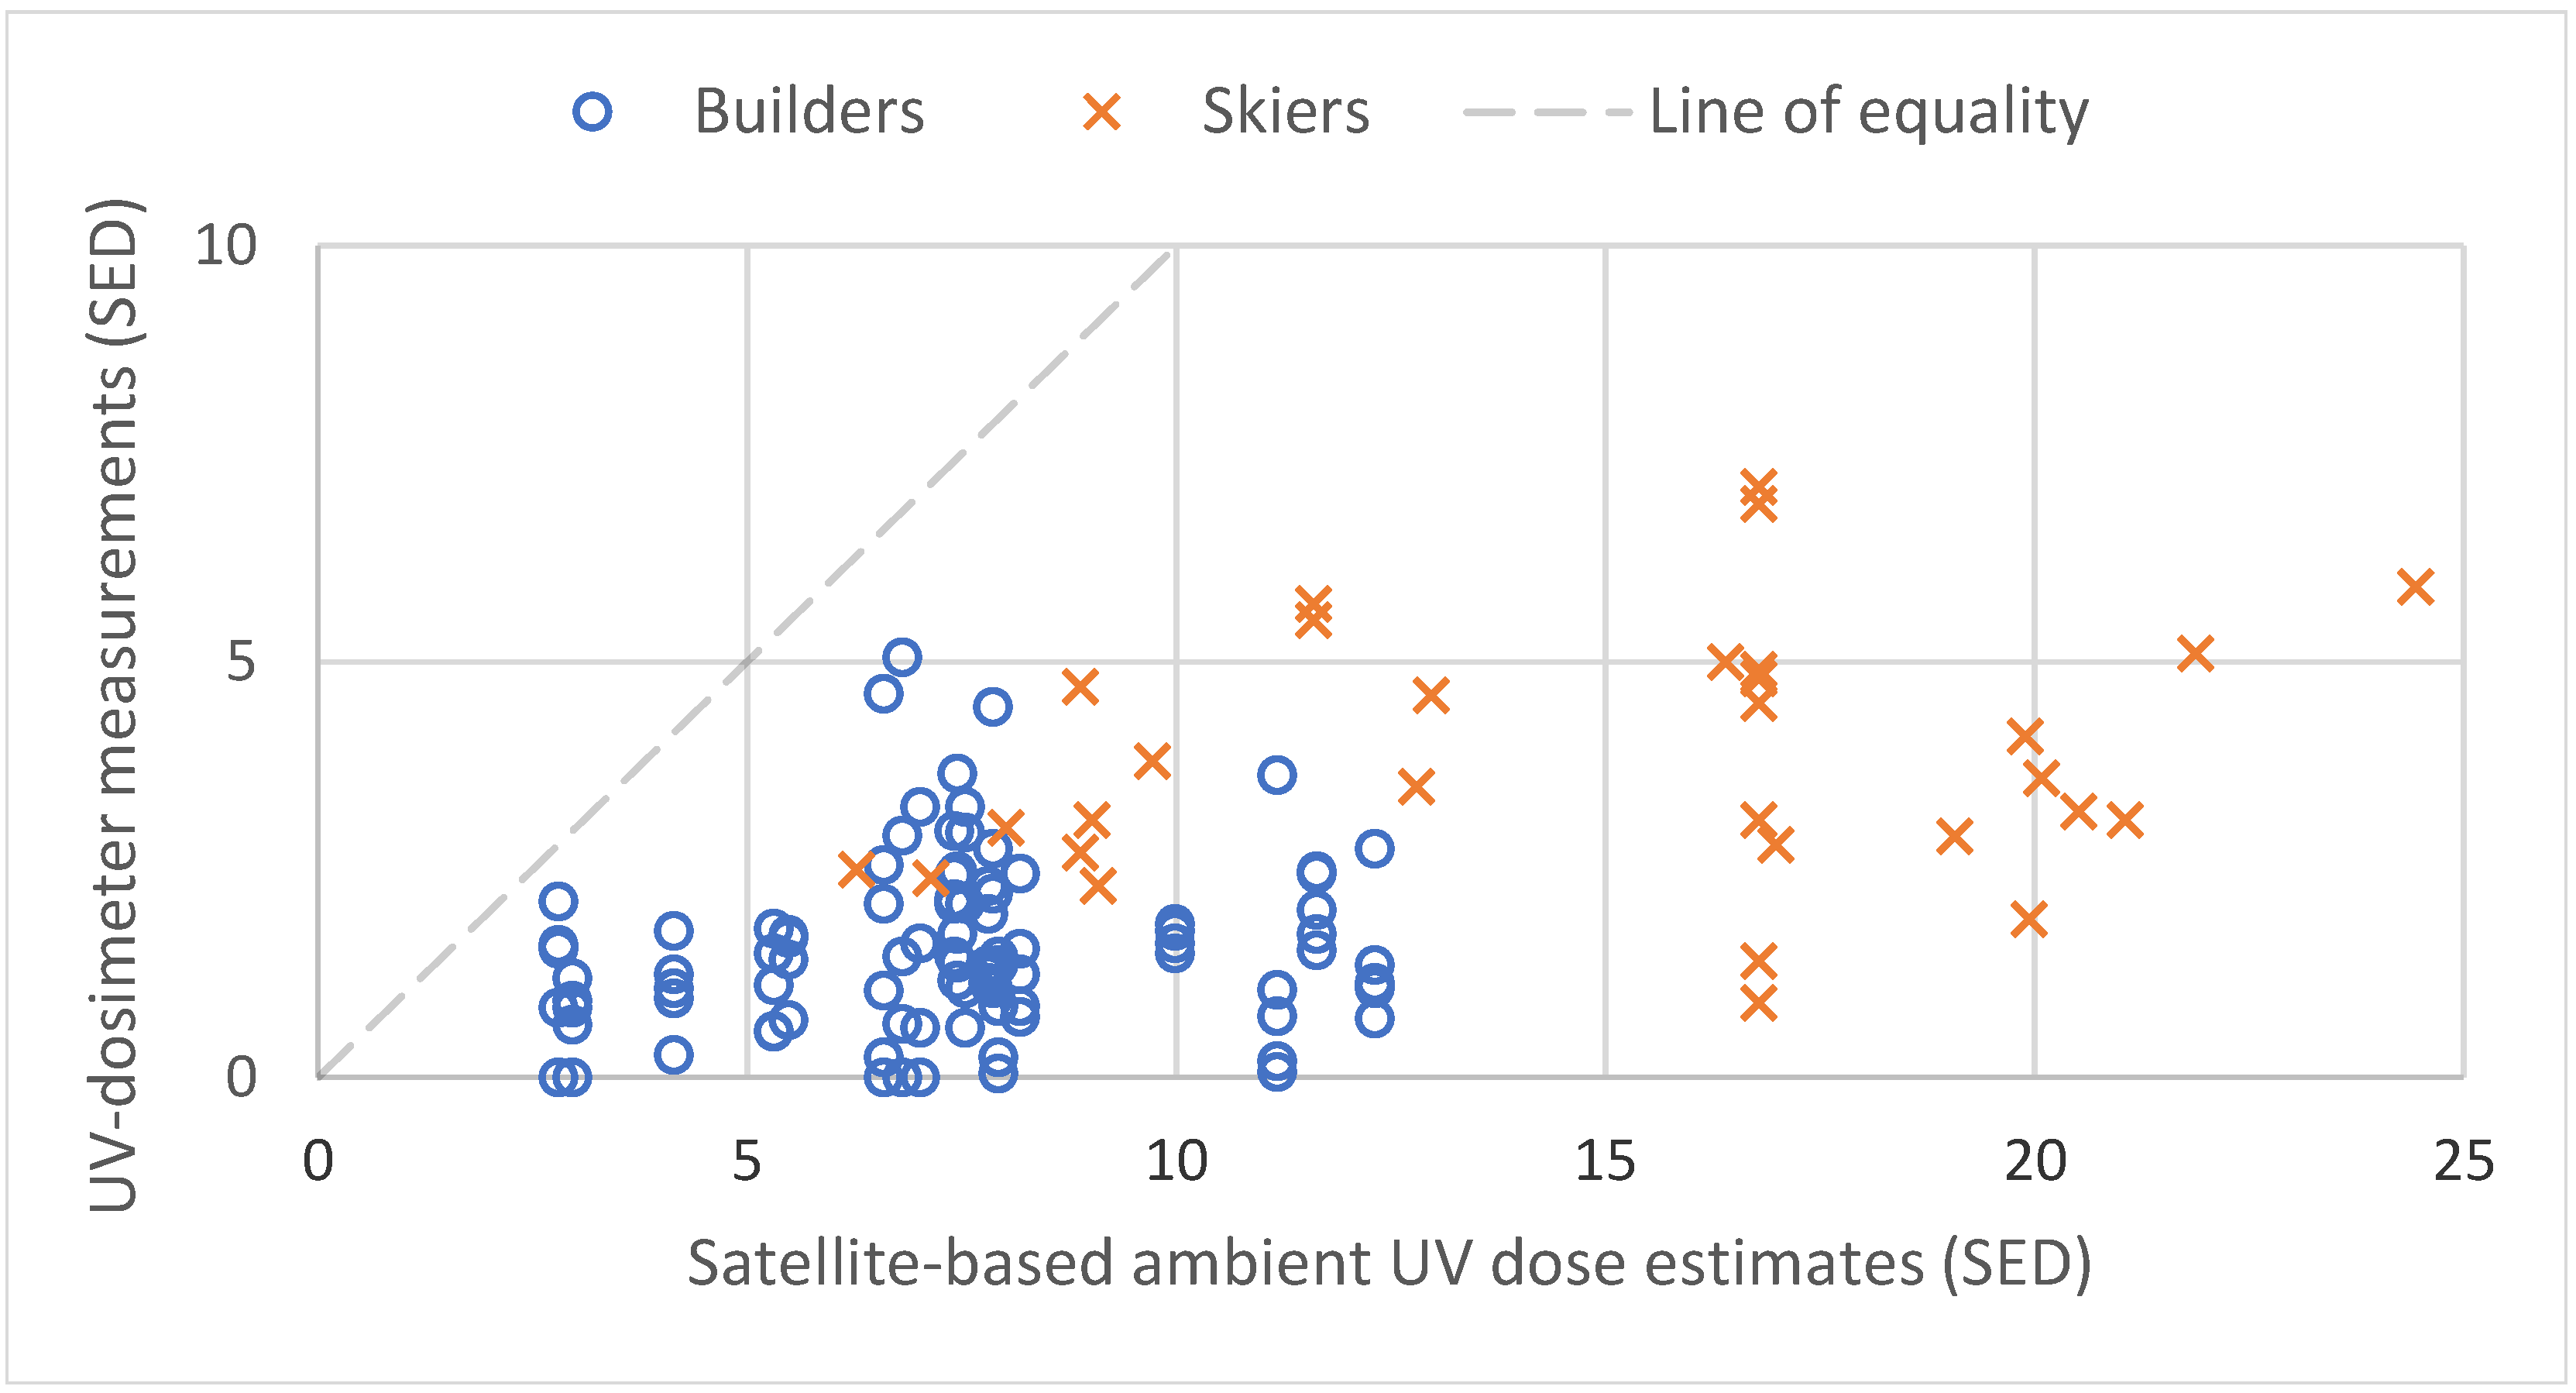
A scatter plot comparing the dosimeter measurements to the satellite-based ambient dose estimates (i.e., without ER modelling according to Equation (
1)) is shown in
Figure 1. This scatter plot includes the line of equality demonstrating where the points would lie if the satellite estimates perfectly replicated the dosimeter measurements. The key result here is that all of the dosimeter results lie below the line of equality, showing that, without ER modelling, a satellite-based ambient dose estimate differs significantly from personal dosimetry. The median deviation from the model is −6.2 SED, with the full range being −18.5 to −0.7 SED.
The points in
Figure 1 often appear in columns, illustrating how, for the given environmental conditions (date, time, location) that lead to the same corresponding satellite-based ambient UV dose estimate, individual factors and measurement errors can significantly affect the dosimetry measurements. For example, consider two ski instructors at Nendaz on the 5th of April, 2008, out on the fields from 9 a.m. to 3 p.m. with dosimeters on their foreheads (cases 24 and 27 in the
Supplementary Material). One of the corresponding dosimeter measurements was 7.1 SED, while the other dosimeter measurement was 0.9 SED—nearly an order of magnitude lower. Both of these doses are substantially below the satellite-based ambient dose estimate without ER modelling (16.8 SED). Therefore, it is not clear what causes the discrepancy between the measurements.
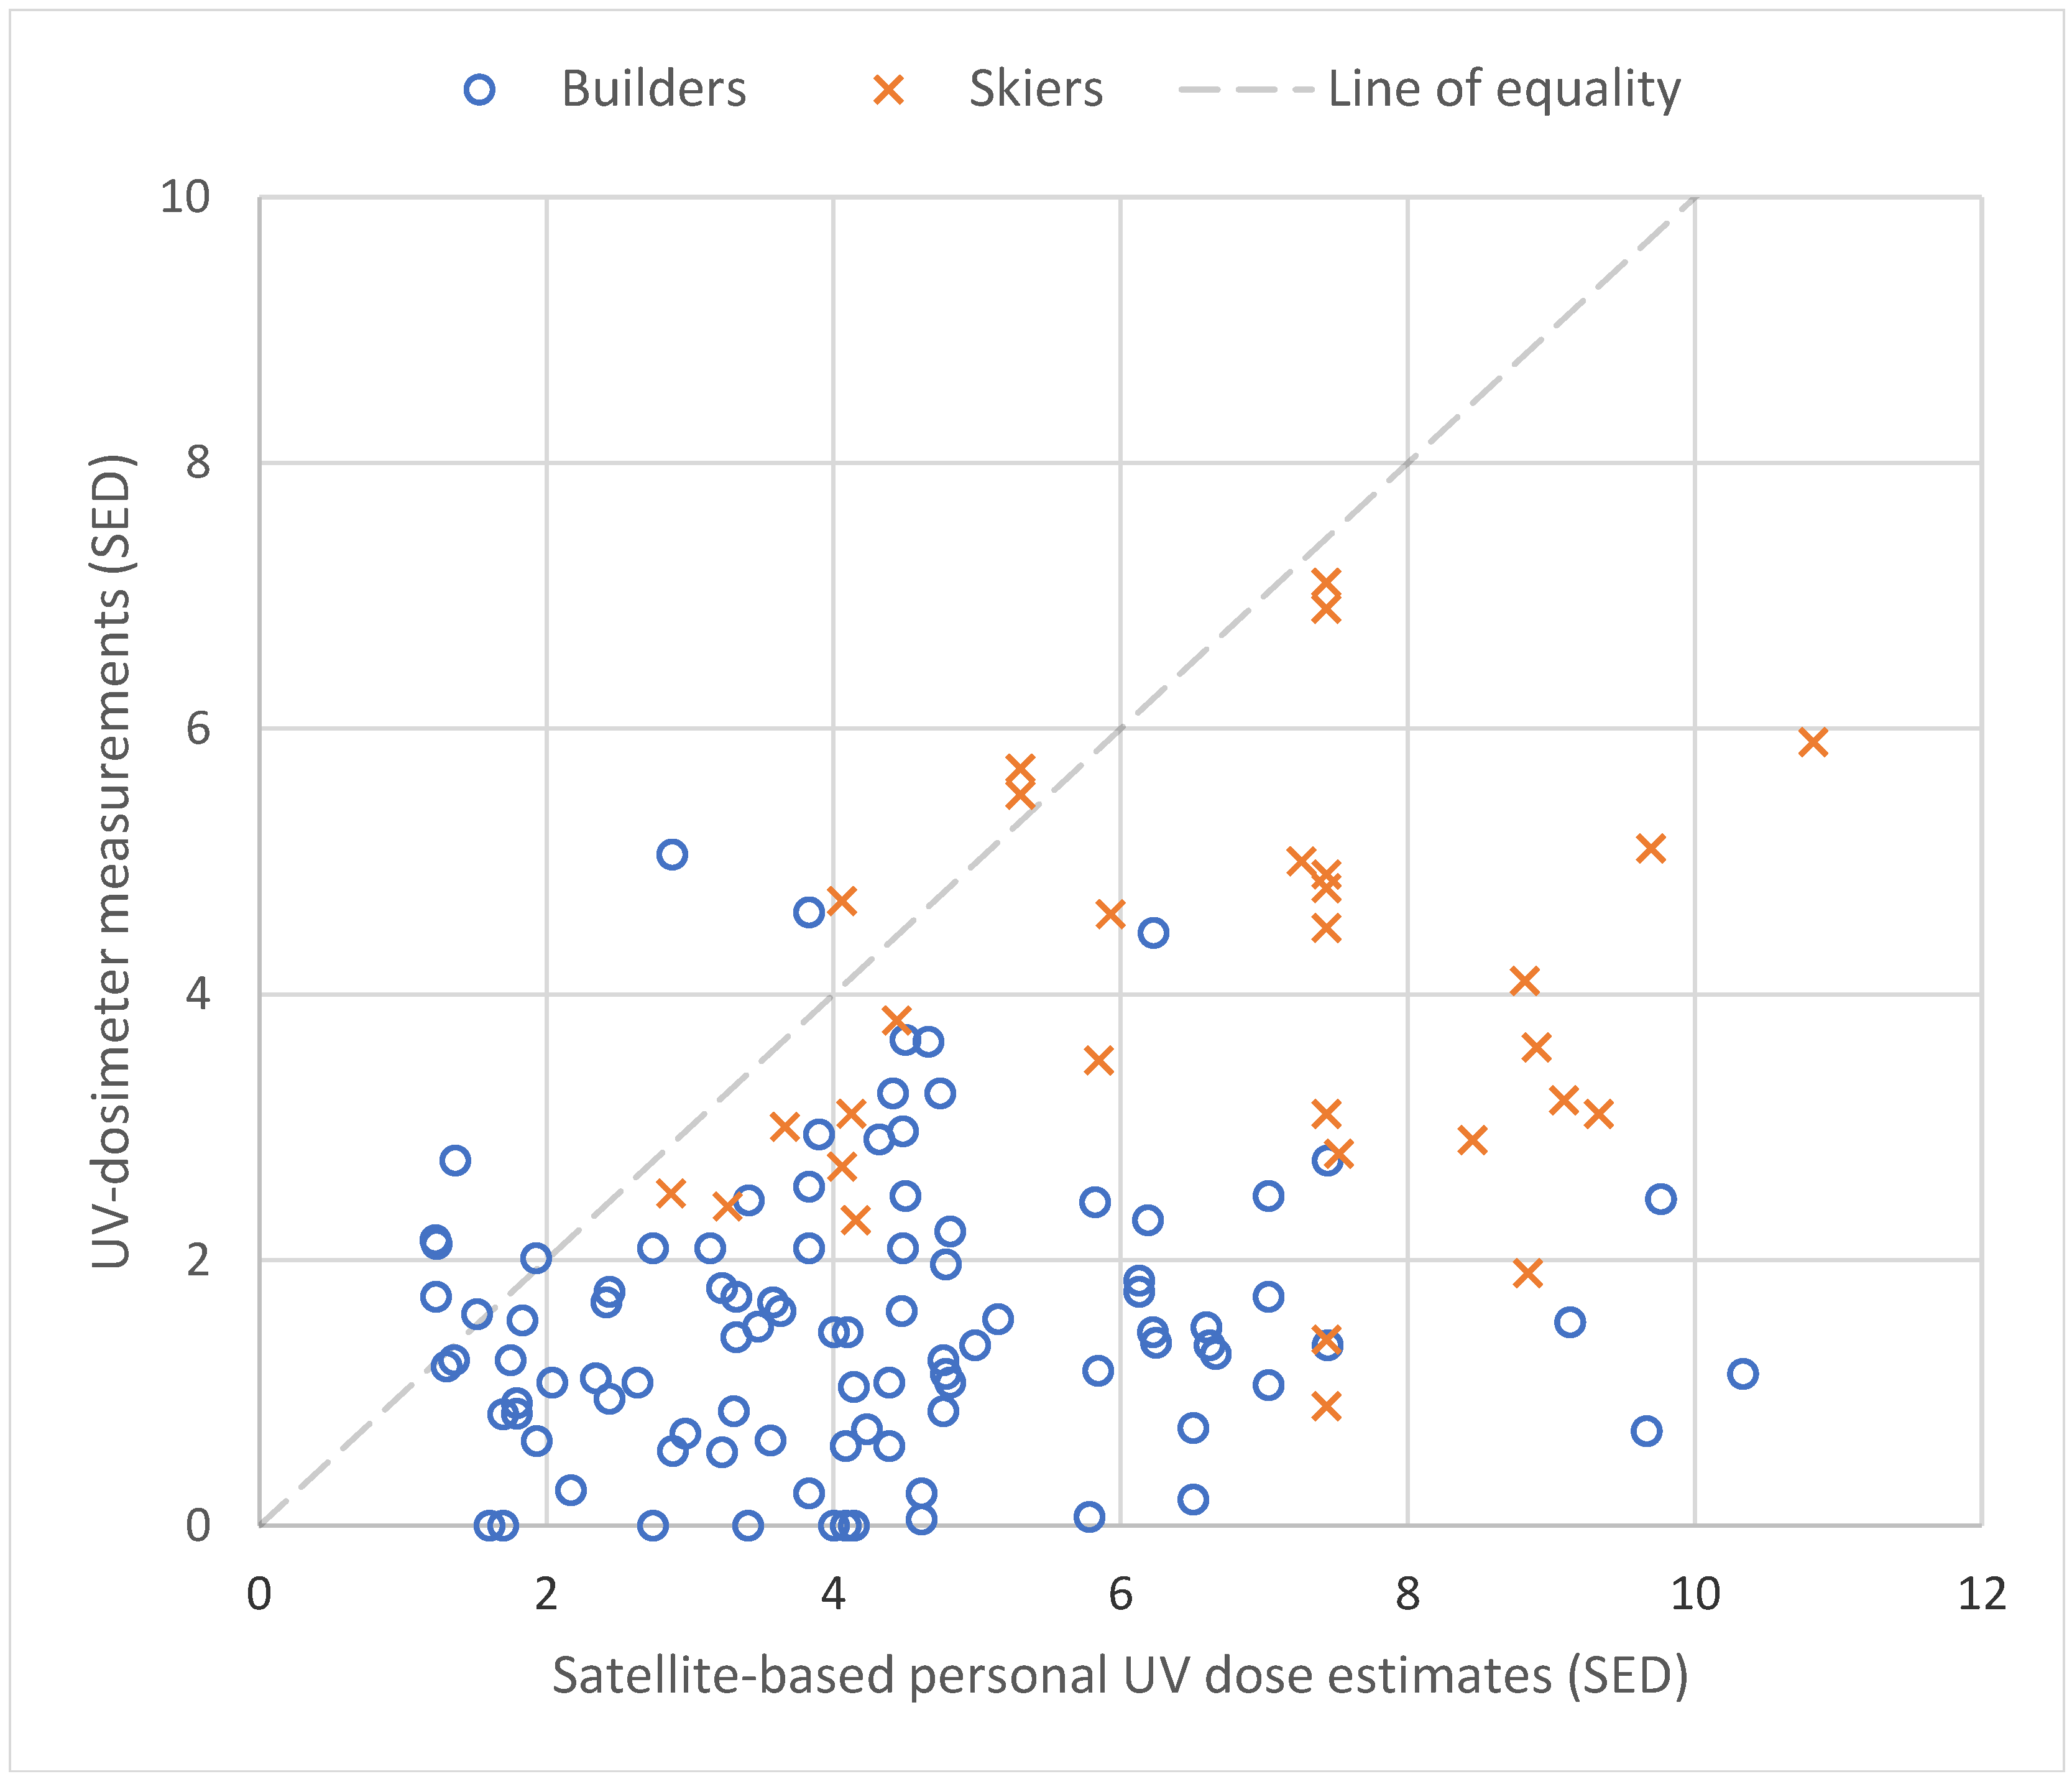
The influence of the individual factors on these skiers’ exposure can be better understood by including ER modelling to produce our satellite-based personal dose estimates.
Figure 2 shows that such estimates come much closer to the values measured by dosimeters. For the two skiers mentioned above, the modelled ER is 0.44, and so the dose of 7.1 SED is very close to the satellite-based estimate of 7.4 SED. This suggests that the individual factors are consistent with the scenario described by the ER model—the skier did not spend much time with their forehead shaded (i.e., due to shade-seeking behaviour) and their dosimeter likely was not significantly affected by measurement errors. On the other hand, the dose of 0.9 SED is so far below the satellite-based dose estimate that individual factors such as shade-seeking behaviour are probably not sufficient to explain such a low dose—a more likely explanation would be that the dosimeter was poorly mounted and being blocked by headgear or potentially malfunctioning. This is information that could not be gleaned without the inclusion of ER modelling in the satellite-based dose estimate and it is important for public health researchers who would attempt to use such measurements to make inferences about population exposure (in this case, specifically the skiing population). Importantly,
Figure 2 still shows the majority of dosimeter measurements as being lower than the corresponding satellite-based dose estimates. This is likely due to the systematic nature of the common measurement errors that dosimetry measurements are subject to, although there are numerous sources of uncertainty that must be considered. The median deviation from the model is −2.4 SED, with the full range being from −9.2 to +2.2 SED.
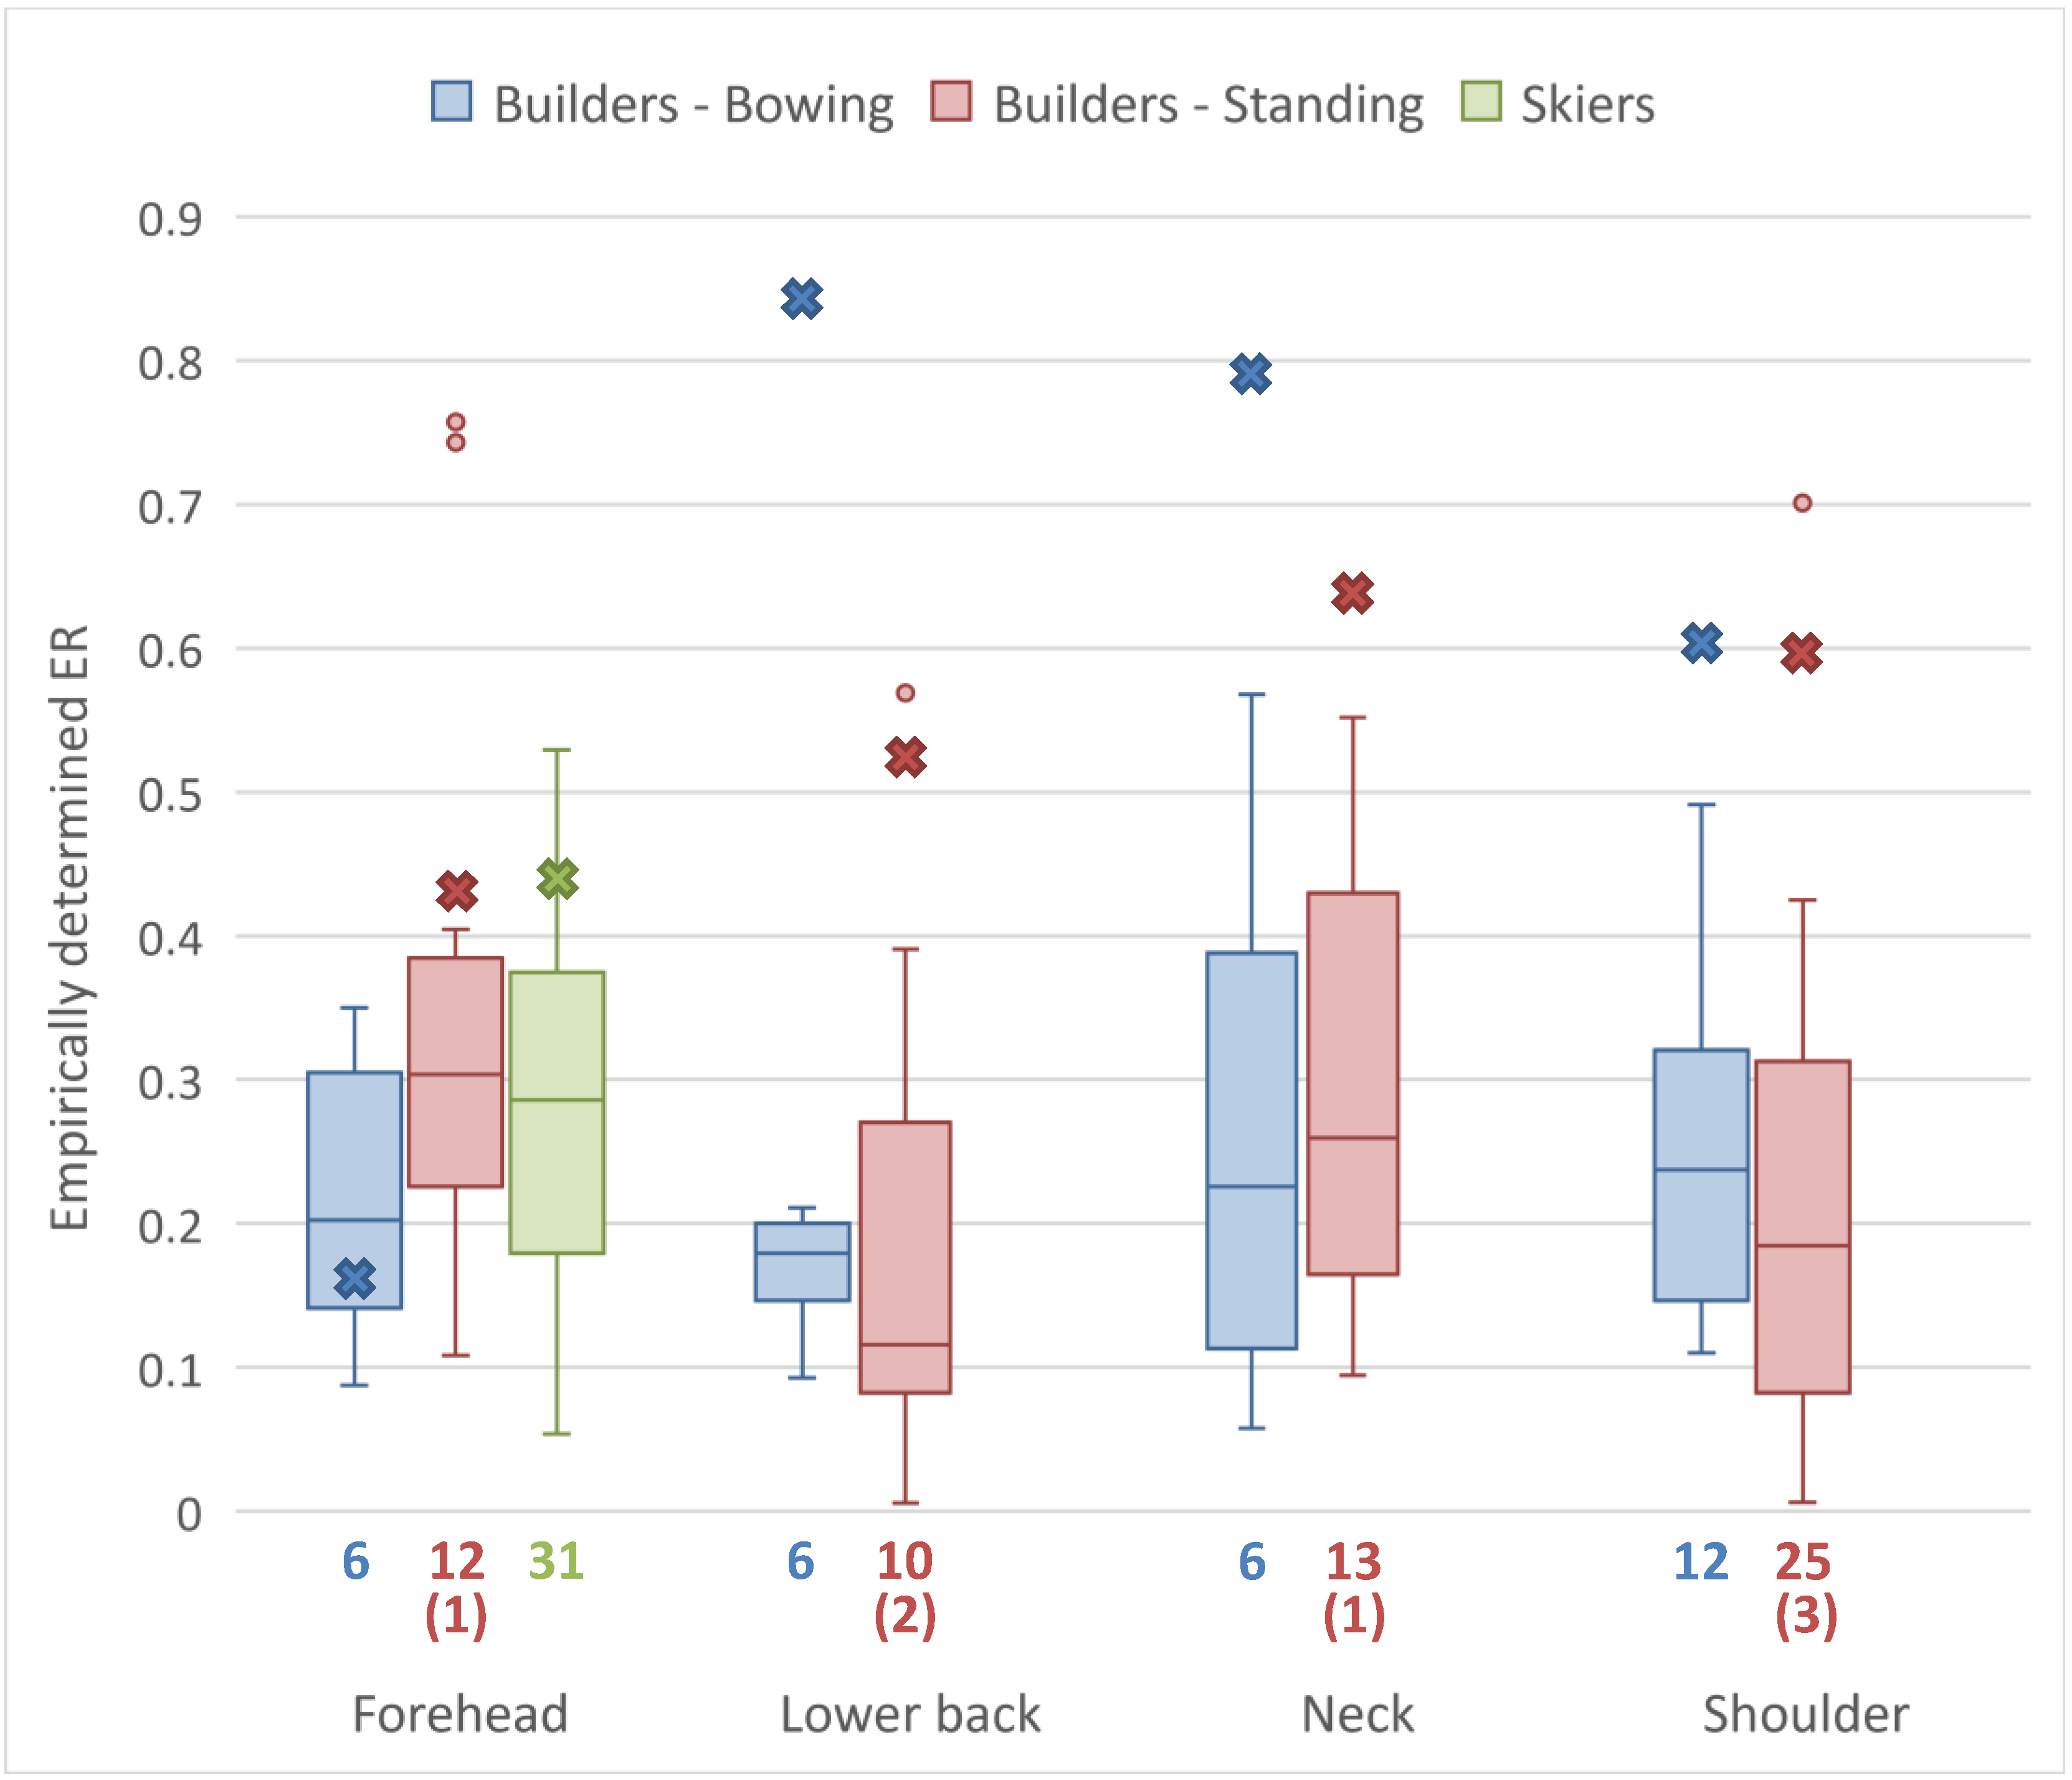
The empirically calculated ERs for each posture and anatomic zone are illustrated as box plots in
Figure 3. We see that there are large ranges of ERs in each case, except the foreheads and lower backs of construction workers with a predominantly bowing posture. However, both of these exceptions are based on just 6 measurements each, and so coincidence cannot be ruled out. For the purposes of comparison,
Table 1 includes empirically derived ER estimates for similar contexts from multiple previous studies. These include construction work, farming and walking, which are similar to the standing builders in our study, as well as other skiers.
4. Discussion
4.1. Why Are the Dosimetry Measurements Generally Lower than the Satellite-Based Personal Dose Estimates?
Figure 1 and
Figure 2 demonstrate the importance of considering ERs when estimating doses. The discrepancy between the model and the dosimetry measurements is visually much smaller in
Figure 2—quantitatively the median deviation improves from −6.2 to −2.4 SED. The ERs used in this study were all less than 1 (c.f.
Table 1) and so their inclusion in the calculation lowered the personal dose estimate relative to the ambient dose estimate, bringing them closer to the line of equality with the dosimetry measurements. However, the majority of dosimetry measurements in
Figure 2 still fall below the line of equality. This is expected due to the systematic negative bias introduced by dosimetry-related measurement errors. In particular, dosimeters can easily be partially blocked due to debris such as snow and dirt [
14] or due to poor mounting (i.e., under long sleeves [
50], or within folds on loose clothes [
39]), which would erroneously lower the measured dose by an unknown amount.
Additionally, the abundance of local shading and varying levels of shade seeking behaviour are (respectively) environmental and individual factors that lower doses and can vary substantially, but that our model does not yet account for due to a lack of information [
11,
34,
51,
52]. Our model assumes that subjects are fully exposed for the entire duration of their exposure period when, in reality, builders and skiers could find themselves on slopes that are topographically shaded, and builders especially could be occasionally shaded by foliage, structures, or even their colleagues and vehicles. On hot days, people will naturally seek such shade more so than on cold days. Additionally, recent research has found that dosimeters are prone to underestimating doses when subject to complex environmental shading such as man-made canopies [
52]. By not accounting for any level of environmental shading or individual shade-seeking behaviour, our approach can over-estimate doses, but it is not clear if this over-estimation is significant here as the original study for the builders data specifically chose locations with a lack of shade to avoid these issues [
39] and most ski slopes are not shaded. Future studies must continue to work to quantify the effect of individual shade-seeking for different populations and contexts. However, studying this is particularly challenging due to the Hawthorne effect, where a dosimetry participant feels more compelled to seek shade due to the knowledge that they are being monitored [
16].
The measurement errors (poorly mounted or blocked sensors and the Hawthorne effect) and the unaccounted-for individual factor of shade seeking behaviour all serve to explain why our approach, even with ER modelling, predicts UV doses that are generally greater than or equal to the corresponding dosimetry measurements. The only previous attempt to validate satellite-based dose estimates against dosimetry measurements did not find an upper-limit relationship like that in
Figure 2, but rather a clear linear correlation (c.f. Figure 6 in Morelli et al. [
33]). However, that study was performed under strictly controlled conditions and only considered sunbathers lying horizontally. That specific context avoids the need for ER modelling as horizontal sunbathers would have an ER of 1. We are not attempting to replicate dosimetry measurements, but rather to calculate real doses, which are expected to be higher than what dosimetry measurements suggest because of the variety of factors and measurement errors that affect real-world dosimetry. Therefore, a clear correlation like that in Morelli et al. would be surprising outside of a fully exposed sunbathing context.
4.2. What Are the Additional Sources of Uncertainty that Led to Some Dosimetry Measurements Exceeding Their Corresponding Satellite-Based Personal Dose Estimates?
While the vast majority of points in
Figure 2 lie below the line of equality, there are 11 instances where a measured dose exceeds the satellite-based estimate. Details about the posture and anatomic zone of these measurements are given in
Table 2. The four largest exceedances are all for builders’ foreheads; there are two further instances of builders’ foreheads in the table, then one builder’s shoulder and one builder’s lower back.
Figure 1a in Milon et al. [
39] (where the builders data was originally taken) shows that these dosimeters were mounted to the front of the builders’ hard hats and, as a result, they are angled more towards the sky than the builders’ actual foreheads. This makes the dosimeters more exposed to direct radiation, leading to erroneously high measured doses. There are also three instances of skiers in this table, however, the level of exceedance for these cases is relatively small (at most 0.64 SED).
There is a range of possible explanations for the remaining cases of exceedance listed in
Table 2: uncertainty in the UV and dosimetry data, uncertainty in the location, and uncertainty in the ER model. Firstly, as discussed by Vuilleumier et al. [
11], there are uncertainties in the UV dataset. The validation against ground measurements found that 10% of the hourly UV values were off by more than ±0.5 UVI, which could culminate in a dose error on the order of 1 SED when integrated over multiple hours if the error was autocorrelated. This could have potentially contributed to any of the cases of exceedance. This uncertainty can be expected to improve over time as the development of satellite-based UV climatologies is ongoing. Similarly, hardware limitations introduce uncertainty associated with the dosimeters themselves [
53,
54]; the specific type of devices used in this study have a standard deviation uncertainty of up to 20% in field conditions [
37,
38]. Similarly, hardware failure was thought to explain the seven instances of no dose being recorded by dosimeters for standing builders. This uncertainty can be expected to improve for future studies involving more advanced dosimeters.
Another source of uncertainty is the location. The pixels in the Vuilleumier et al. UV climatology are roughly 1.5 × 2 km, but some locations are not so precisely defined. In this study, we do not have access to precise location information for the builders or skiers, only the name of the village where they were operating, which could span multiple pixels in the UV climatology. To minimise this error, we selected locations either in the center of the village (for builders) or the center of the nearest ski field (for skiers), but it remains possible that the subject could have spent the majority of their time in a different pixel with different levels of UV irradiance, introducing uncertainty into this study (but not into our approach in general). Future studies could use more precise location information, such as that collected by smartphones, to reduce this uncertainty.
The largest source of uncertainty that could help to explain
Table 2 is from the ER model, or more precisely, from the translation of the theoretical ER model to real-world situations. Firstly, we note that the model was built for manikins assuming static postures and rotating at a constant rate. In applying this model to calculate the dose estimates in this study, we are forced to apply this rotating assumption, but it is not unlikely that the builders, whose exposure periods are mostly on the order of 1–2 h, could have spent significant portions of that time orientated in a particular direction. This is inconsistent with the rotationally symmetric ER model and could result in both under- and over-estimation of ERs. This same effect is also possible for the skiers if they spent a significant proportion of their time on a ski-lift facing a particular direction. Secondly, the ER model was constructed based on manikins assuming static postures, but real people are not static. The contributions of a dynamic combination of postures could lead to the effective ER of the subject differing from that predicted by the static model, introducing uncertainty into our dose estimation approach.
4.3. How Does This Compare to Previous Studies?
The difficulty to compare doses from different studies is a fundamental challenge of dosimetry due to the differing individual and environmental factors between studies, as well as a lack of cross-calibration between different dosimeters (i.e., measurement errors) [
19]. However, one quantity that can potentially be compared across studies is the ER. Historically, ERs were calculated by measuring a personal dose and comparing that to the ambient dose. Mimicking this style of ER estimation, we took the ratio of dosimetry measurements to the ambient UV dose estimates in
Figure 1 to empirically derive ERs for the builders and skiers in our study. These ERs are shown in
Figure 3, which demonstrates a very high level of variation and little agreement with the ERs calculated by the Vernez et al. model. This is indicative of the challenges of dosimetry.
Table 1 lists these empirical estimates along with other empirical ER estimates from previous studies for skiers, builders, and other contexts similar to building. We focused on studies where the dosimeter was placed in one of the four anatomic zones we considered. Most studies find a spread of ERs similar to what we found in
Figure 3, with even the median values of (for example) skiers’ faces ranging from 0.22 to 1.06. Dosimetry is affected by so many different individual and environmental factors, as well as measurement errors (note the different ER estimate from the same study using two different dosimeter types [
49]) that this empirical approach to ER estimation will always be subject to large variations [
34,
40,
45]. For this reason, it does not make sense to try to determine if our empirical ERs or those from the Vernez et al. model agree with the broader literature; there will inevitably be agreement with some studies and discrepancies with others.
While a more in-depth quantitative comparison with other studies is not possible, there are several qualitative points of comparison to be made. Firstly, we can compare our approach to the similar approach taken by Morelli et al. [
33]. Our approach accounts for far more environmental and individual factors, most importantly cloudiness and posture, but Morelli et al. do include a consideration of sunscreen which our model is currently lacking. Secondly, the survey-based approach developed by Wittlich et al. [
27] accounts for many of the same environmental and individual factors accounted for by our approach, however, it calculates average doses rather than the specific doses we calculate here and it ultimately relies on personal dosimetry to provide reference values. Thirdly, the Vernez et al. ER model used in our dose estimation approach has one critical advantage: it is not empirical and gives reasonable values. Our approach could have used empirical ER values from existing literature to calculate the personal doses, but as
Table 1 shows, we would have had to choose between (or take the average of) multiple studies that disagree significantly with one another on the actual ER value. On the other hand, the Vernez et al. model is based on a realistic light simulation, and so the ER estimates (and consequently our entire approach) are not affected by the many dosimetry-related challenges we have discussed. Our dose estimation approach is therefore a rare example of doses being estimated without dosimetry measurements contributing to any part of the calculation. This is a unique advantage of our approach given the measurement errors that dosimetry is subject to.
As a final point of comparison, we consider how this approach compares to personal dosimetry. The many existing dosimetry measurements in the literature cannot be easily grouped together into a larger dataset as the variety of differing factors make each dosimetry campaign incomparable to the next. This makes dosimetry research costly; participants must be recruited and compensated, many dosimeters must be purchased and cross-calibrated and the whole process can be very time consuming while the resulting dosimetry data may only be suitable to answer the few highly specific research questions around which the campaign was designed. Furthermore, even the largest dosimetry studies are still subject to systematic measurement errors (poorly mounted or blocked dosimeters, different hardware limitations, and the Hawthorne effect), which lower the measured doses by unknown amounts. It is therefore virtually impossible to obtain dosimetry measurements that are truly representative of a population’s UV exposure. Our approach has the potential to overcome this challenge. Different studies using our approach could be collated as the environmental factors are accounted for by the Vuilleumier et al. UV climatology (or datasets that follow the same methodology) and the individual factors would be described by exposure schedules, detailing activity and therefore posture as a function of time. Furthermore, as ER modelling improves over time, older studies do not become obsolete, as they can simply be recalculated with the latest model. As a result of these points, our approach could become very cost-effective relative to dosimetry campaigns.
4.4. What Are the Key Avenues for Future Research?
Firstly, erythemal UV climatologies of a verifiable accuracy and precision comparable or better than that of Vuilleumier et al. [
11] should be produced for the entire globe. The approach used for the Vuilleumier et al. UV climatology can be easily extended to include the entire MeteoSat disk which covers all of Europe and a large part of Africa—it was only limited to Switzerland due to very limited computing and storage resources. Producing accurate, continent-scale, erythemal UV climatologies is a fairly low-cost proposition, accessible for all, with a potentially huge return on investment for public health research. It is therefore the most important first step for making this satellite-based dose estimation method accessible for countries besides Switzerland. Eventually, such erythemal UV data could be nowcasted and even forecasted.
Another major avenue for future research is ER modelling. The Vernez et al. ER model used in this study is essentially limited to a consideration of posture, anatomic zone, and the average environmental conditions to determine the origin of the radiation (direct, diffuse or reflected). Yet, there are other factors that could be used to more accurately estimate ERs according to activity and dynamic environmental conditions. Future research should begin to quantify the effects of shading at the population level, as there may be significant differences depending on activity and location. For example, a builder working in a city may be better shaded by tall buildings compared to one in a village or rural area. More advanced ER models should also be able to account for rotational asymmetry, as certain activities are likely to result in a favoured orientation, e.g., skiers may spend much of their time facing the direction of ski-lifts, beach-goers may spend most of their time facing the water, and hikers will favour the direction of the trail that they are taking. With the increased accessibility of ray-tracing technology and high quality animations, the potential accuracy achievable for an ER model dependent on anatomic zone, activity (instead of just posture), and location (to consider effects of local shading and environmental conditions) is very promising.
In a few years’ time, we envisage a mobile app that uses a phone or smart-watch’s gyro and location data to determine the user’s activity to be used as input for an advanced ER model. Combined with precise UV data (either from a climatology or from nowcasting), the app could accurately calculate the UV dose received by the user. This approach would not require the user to use a wearable dosimeter (most likely a wrist-mounted device, as is already common [
32]) which, as has been noted in this paper and others [
12,
50], would be prone to uncertain negative error. Still, data from wearable dosimeters (or perhaps smart-watches as a more convenient alternative) could be used in tandem with location and gyro information to provide a means to track environmental shading and shade-seeking behaviour and thereby continually improve the app’s dose estimates. Such an app could be an invaluable tool for tracking the population’s UV exposure and provide users with reliably appropriate recommendations to ensure a safe level of UV exposure depending on their skin type. This methodology could be integrated into already popular health and fitness tracking apps without requiring any additional input from the user (except skin type), while providing them with specifically tailored recommendations, which research [
55] has shown to be more effective than the kind of general advice provided to but not always adhered to by users of existing apps [
30,
56]. Such an app might be thought of as similar to COVID tracing apps, in that privacy concerns about location tracking may affect uptake despite the important health implications, but a minimal burden on the user is nonetheless important for ensuring high rates of app uptake [
57,
58] and is a key advantage of our approach going forward.


 ,
, 


