Article

Investigation of Aeolian Dust Deposition Rates in Different Climate Zones of Southwestern Iran

by
Mansour Ahmadi Foroushani
*,
Christian Opp
and
Michael Groll
Department of Geography, University of Marburg, 35037 Marburg, Germany
*
Author to whom correspondence should be addressed.
Atmosphere 2021, 12(2), 229; https://doi.org/10.3390/atmos12020229
Submission received: 10 December 2020 / Revised: 29 January 2021 / Accepted: 2 February 2021 / Published: 7 February 2021
(This article belongs to the Special Issue Feature Papers of Aerosol Impacts on Climate and Air Quality)

Abstract

:
Dust and atmospheric particles have been described in southwestern Iran primarily in terms of load, concentration and transport. The passive deposition, however, has been discussed inadequately. Therefore, the relationships between different climate zones in southwestern Iran and dust deposition rates were quantified between 2014 and 2017 using both space- (second modern-era retrospective analysis for research and applications, version 2 reanalysis model) and ground-based (eolian ground deposition rate) tools. In addition, the surface meteorological records, including the wind patterns favoring the occurrence of dust events, were examined. A hot desert climate (BWh), hot semi-arid climate (BSh), and temperate hot and dry summer climate (Csa) were identified as the three dominant climate regions in the study area, exhibiting the highest average dust deposition rates. In this study, correlations between the most relevant climate patterns and deposition rate weather parameters were found to describe a region’s deposition rate when a dust event occurred. Based on these results, the BSh and Csa regions were found to be associated with the seasonal cycle of dust events in March, April, and May, revealing that in the long run meteorological conditions were responsible for the varying dust deposition rates. Relatively, precipitation and temperature were the two major factors influencing dust deposition rates, not wind speed. Moreover, the peak seasonal deposition rates in the spring and summer were 8.40 t km−2 month−1, 6.06 t km−2 month−1, and 3.30 t km−2 month−1 for the BWh, BSh, and Csa climate regions, respectively. However, each of these climate types was directly related to the specific quantity of the dust deposition rates. Overall, the highest dust deposition rates were detected over the years studied were 100.80 t km−2 year−1, 79.27 t km−2 year−1, and 39.60 t km−2 year−1 for BWh, BSh, and Csa, respectively.

1. Introduction

Over hundreds of years, dislocated eolian dust materials create positive and negative feedback between dust particles in the atmosphere and climate, which can influence terrestrial ecosystems [1]. Fertilized dust provides essential nutrients for plant growth, causing the revegetation of desert surfaces [2,3]. However, eolian dust also increases soil salinity, reduces air quality, and impairs human health e.g., [4,5,6,7].
Globally, eolian dust transport cycles and dust loads are closely connected to climate change e.g., [8,9] and have reciprocal effects. On the one hand, variations in meteorological episodes influence dust concentration [10,11], while on the other hand, the amount of eolian dust suspended in the atmosphere influences the climate, e.g., [12].
In particular, particles can travel over long distances before they are removed from the atmosphere by dry and/or wet deposition [13]. Thus, a particle’s longevity in the atmosphere alters the radiative balance by scattering and absorbing incoming solar radiation [14] or changing the optical properties of clouds, e.g., [15]. Changing the long-term optical properties may push the climate system toward warmer and wetter conditions or amplify sudden changes in the climate, e.g., [16,17,18]. A multi-model climate study showed that climate change is correlated with the negative impacts of eolian dust in the atmosphere, which is pronounced by a decrease in the mean precipitation over land in warmer climates, thus increasing the lifetime of aerosols with a lower wet deposition rate, e.g., [19]. In both scenarios, airborne dust is slowly removed from the atmosphere to the Earth’s surface at a certain dry deposition rate.
According to [20], the annual atmospheric dust load originating in the Sahara Desert, the Arabian Peninsula, Central Asia, Northern China, and Australia is estimated to be more than 200 million tons. This high concentration affects both the air quality [21,22] and global climate, e.g., [17,23]. Ref. [23] suggested that major sources of dust in the Middle East can be identified by analyzing the surface meteorological records at each station as follows:
DE = DIS + BD + DS + SDS.
From 1998 to 2003, the synoptic records of land surface observations were classified into four definitions based on the maximum number of dust events (DE) under the following conditions [24]:
  • Dust in suspension (DIS), which is identified as widespread dust particles in suspension that influence visibility, limiting it to approximately 10 km.
  • Blowing dust (BD) is defined as a raised dust particle that reduces visibility to 1–10 km.
  • Dust storms (DS) occur when a large amount of dust particles is raised, reducing visibility to between 200 m and 1000 m.
  • Severe dust storms (SDS) represent large quantities of lifting dust particles that reduce visibility to less than 200 m.
In the Middle East, which is one of the regions most affected by dust, the Arabian Peninsula ranks in the global top five of the most significant dust source regions, e.g., [23,24]. Ref. [25] examined five years of data, from 2009 to 2014, finding that the southwestern regions of Iran were most affected by dust, characterized by annual mean concentrations of more than 300 µg/m3 of suspended atmospheric particles. [26], defined the same value as 372 µg/m3 in the south (Ahwaz) and approximately 229 µg/m3 in the west (Kermanshah).
Similarly, the deposition rate is a comparatively essential point for identifying eolian activity and environmental quality, e.g., [27,28]. In contrast to atmospheric contributions, few experiments have measured the deposition rate from ground observations (Table 1).
Similar to the other contributions, southwestern Iran is significantly at risk of dust deposition, which affects water quality, e.g., [36], soil productivity, e.g., [37], crop and live-stock, e.g., [38], human welfare, e.g., [7,39], political discontent, emigration, national costs, e.g., [40], and the economy, e.g., [41].
Although several studies have examined the, e.g., [25,39,42] mineralogical and chemical compositions of dust via different techniques in western and southwestern Iran, the connection between deposition and climate has rarely been discussed, e.g., [43]. Furthermore, the influence of climate zones on ground deposition rates has hardly been utilized in this region. Therefore, this study provides new and valuable insights into the spatial and temporal distributions of dust deposition correlated to climate factors in southwestern Iran.
The main objectives of this study are: (1) to investigate the spatial and temporal variability of dust deposition rates, (2) to determine the seasonal and spatial variability of the dust deposition rate in relation to the climate zones, and (3) to identify the correlation between the most relevant climate patterns and weather parameters to the deposition rate.

2. Material and Methods
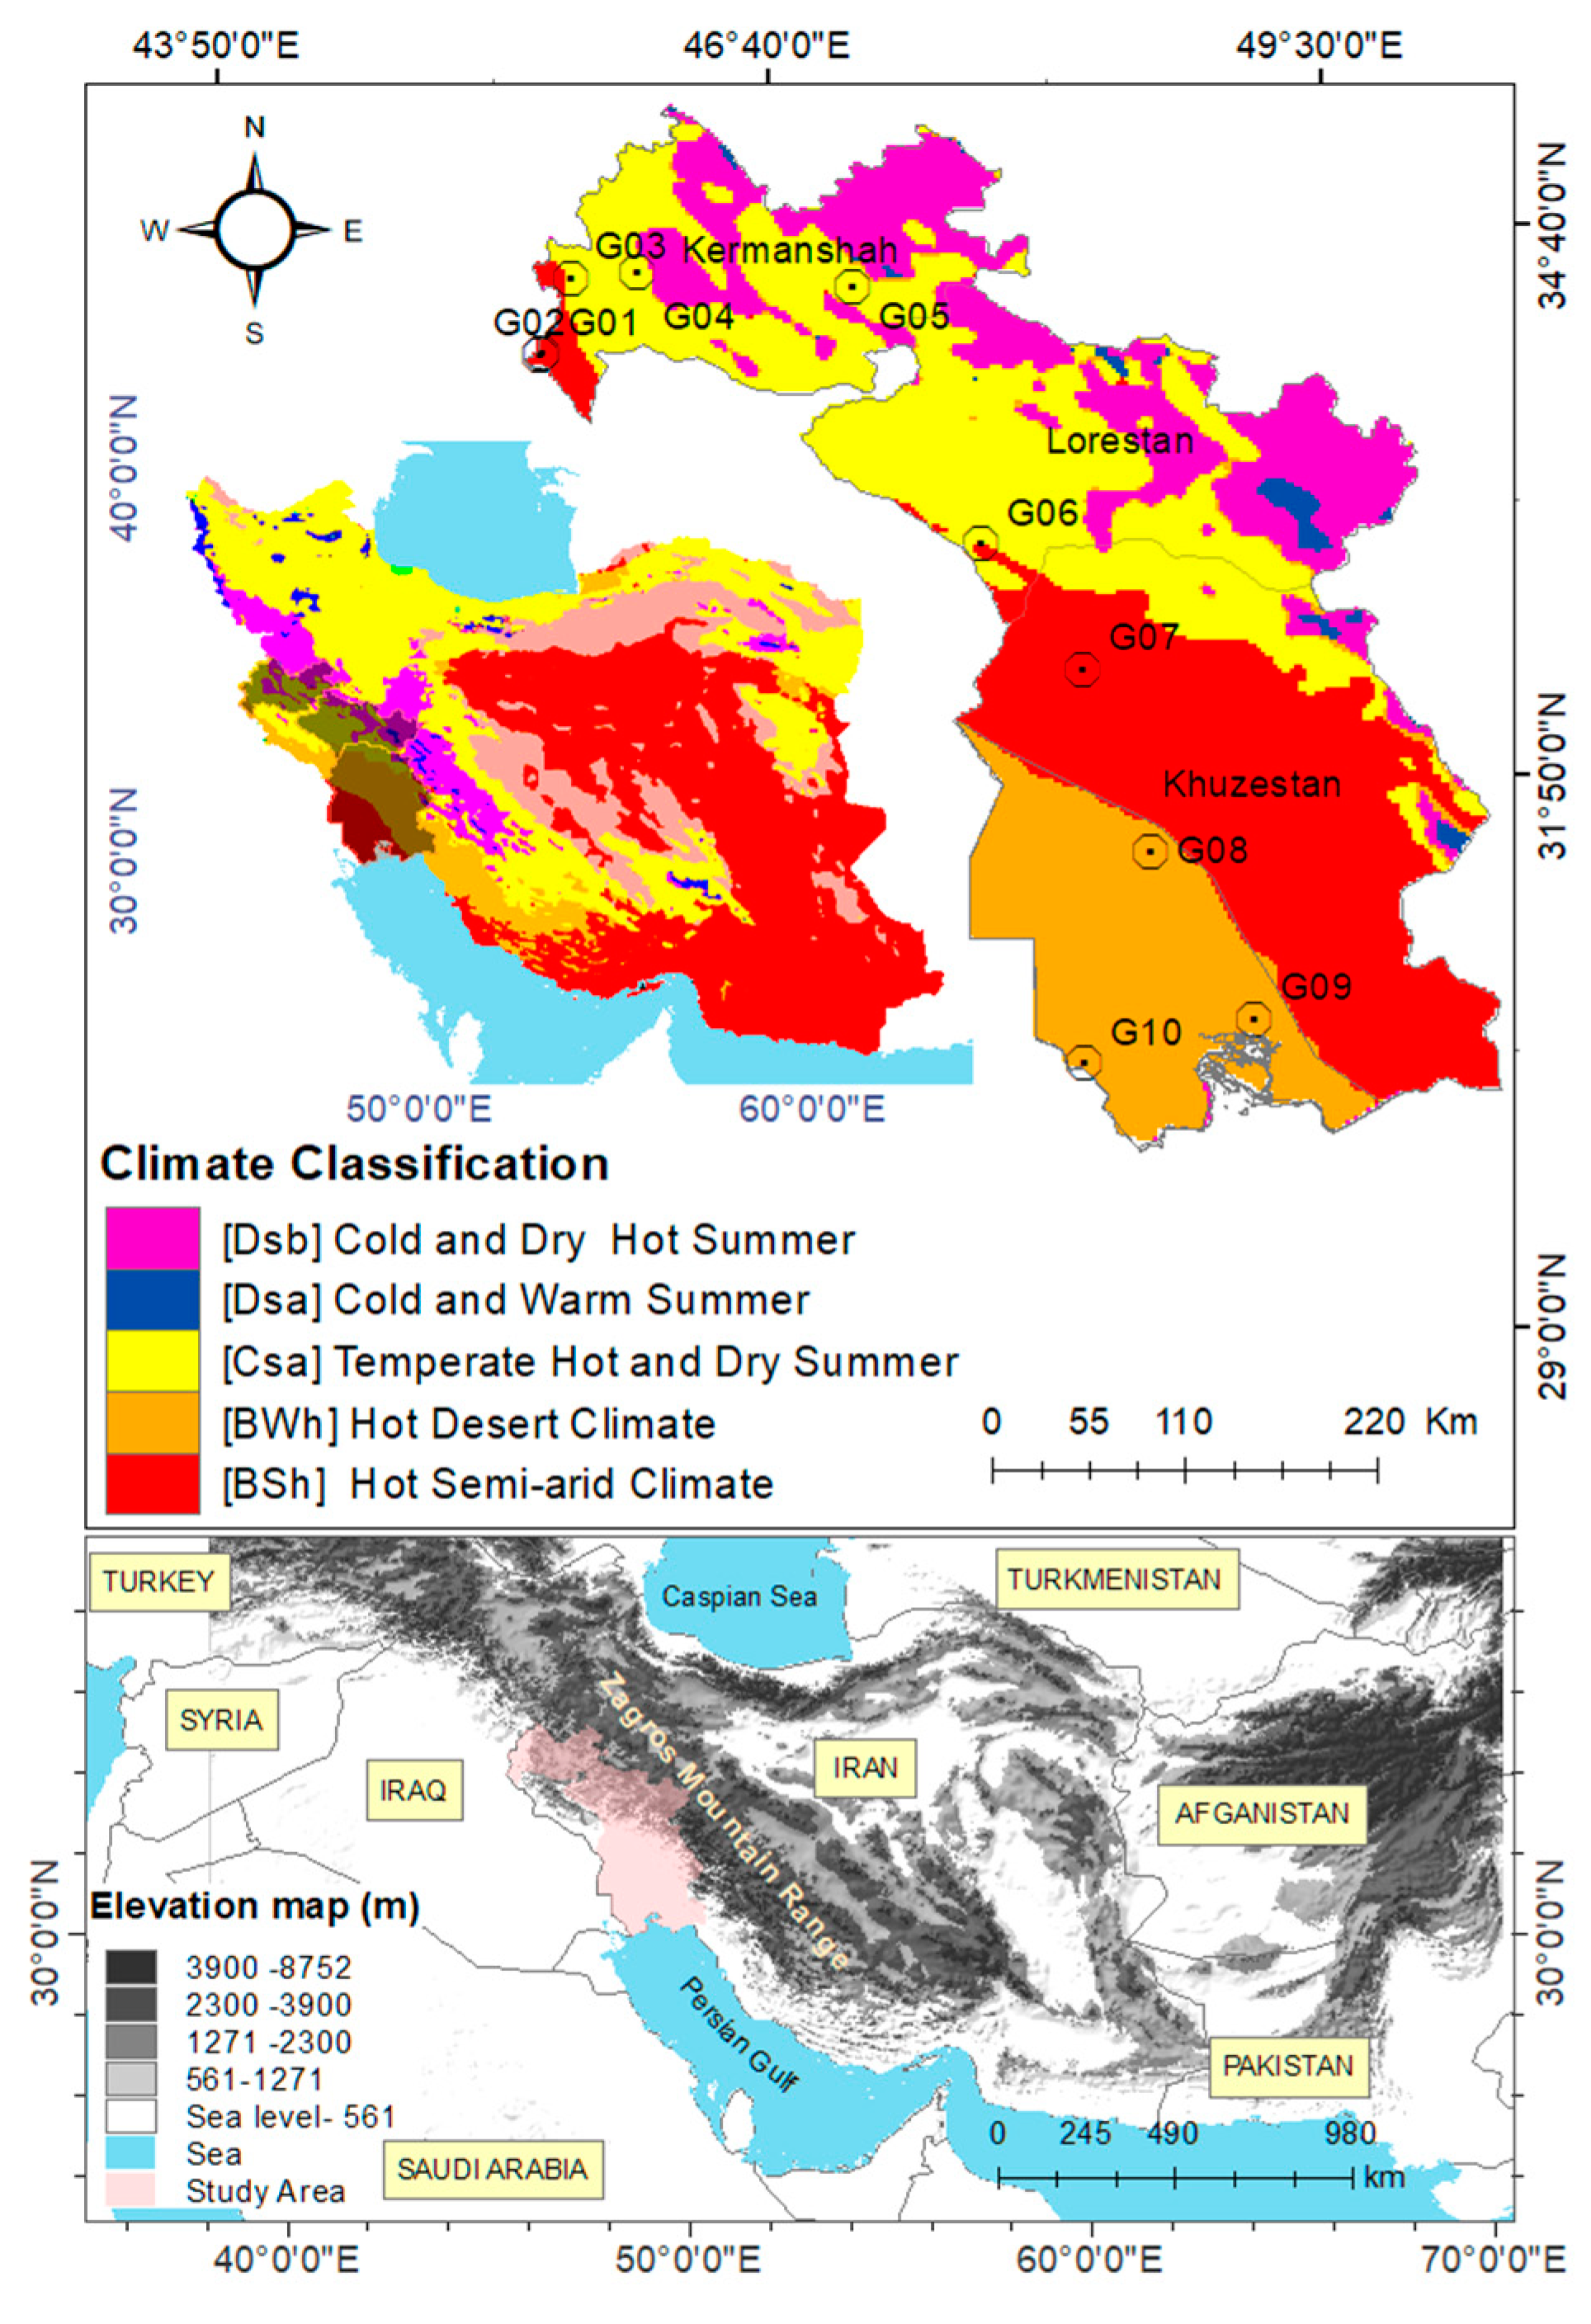
2.1. Study Area

The study area is located between 35°30′00″ N, 45°30′00″ E and 30°30′00″ N, 49°30′00″ E in southwestern Iran, covering an area of approximately 117,000 km2, as shown in Figure 1 [44]. The eastern part of this area is dominated by the Zagros mountain range (running from the northwest to the south). Because of this geographic setting, the study area occupies a broad latitudinal range of climates. In general, the climate of the study area is characterized as semi-dry hot and occasionally humid, which is especially common in the south, while the region’s winters can be cold and dry [45]. The area has great potential for agricultural development because of the permanent river flows that contribute to the area’s fertility. The observed seasonal dust events indicate that southwestern Iran is strongly affected by annual dust events from the large deserts in Iraq, Saudi Arabia, and Syria, especially during the hot season, e.g., [46,47,48]. Thus, southwestern Iran is recognized as a global hotspot of eolian dust.

2.2. Climates of Study Area

Figure 1 shows the distribution of ground dust collectors (G01–G10) within the Köppen climate classification system in the study area [49]. The study area was classified on the basis of standard climate zone properties of the Köppen climate system, which has also been used in previous research [45,51]. In the Köppen climate classification scheme, a climate is defined with three letters, the first of which represents a world climate at a 1 km resolution, of which there are five different groups [49]: A: tropical, B: arid (dry), C: warm (temperate), D: continental (cold), and E: polar. While most of these groups are classified based on the temperature of a region, group B emphasizes the aridity of a region. The second letter in the Köppen classification is the seasonal precipitation type, represented by steppe (S) desert (W) rain force without dry season (f), monsoon (m), savanna dry winter (w), and dry summer (s). Finally, the third letter indicates the level of heat as cold (k), hot (h), and, in general, hot summer (a), warm summer (b), cold summer (c), and very cold winter (d). Herein, the climate of the study area was divided into three main climate zones (Table 2).
As shown in Figure 1, the study area was categorized into three main climate groups (B, C, and D). The dust event history and availability of consistent monthly data collection (access to data for approximately four years) are the main issues during the research period. Samplers were constructed and placed in the area to enable more exposure to the frequent dust events. According to the definition of the study area setting, the high-altitude areas of the Dsa and Dsb climate zones (belonging to the D group) did not contribute to the data collection process, and studies on climatic regions belonging to the D group were excluded.
The hot desert climate (BWh) in the southern region of the northern coastal plains of the Persian Gulf covers the locations of G08, G09, and G10 between latitudes of 30 N and 31 N. A hot semi-arid climate zone (BSh) in the western areas is indicated over the locations of G01, G02, and G07, which are located between 34 N and 32 N. The temperate hot summer zone (Csa) is located between 33 N and 34 N from the extreme western regions of G04 and G05 to G06.
According to the recent land use and land cover (LULC) pattern and in accordance with the Land Use/Cover Area framework of the Statistical Survey (LUCAS), the study area has five major classifications: artificial (6.5%), industrial (0.05%), wet land (4.5%), vegetation (27%), and bare land (61%). As the deposition rate may have been provided using passive samplers (gravimetric method of sampling), the samples should not be influenced by artificial or natural obstacles. Therefore, the samplers were placed at unhindered areas in a radius of 1 km and 2 m high in order to minimize obstacle impacts. Dust particles were collected before settling on the surface. Detailed information on the LULC of each station is provided by [52].

2.3. Methods and Data

To identify the impact of the climate on the deposition rates in southwestern Iran, the ground-based deposition rate was recorded and classified into three climate zones in the study area. Wind, precipitation, and temperature are important for determining the synoptic conditions responsible for the dust deposition rate. Thus, the maximum, minimum, and average values for all the climate zone-based data derived from the operating meteorological stations were calculated by the I.R. Iran Meteorological Organization. The data used include the monthly average ground deposition rate (GDR), wind speed and direction (northward and eastward winds), precipitation, and temperature during the study period of 2014–2017. To evaluate the correlation between the deposition rates and climate zones, the results of ten dust sampling sites were reclassified using climate gradients. The rates distinguished with seasonal variation responses to the regional climate provided using the second modern-era retrospective analysis for research and applications (MERRA-II) model output had reasonable accuracy. By evaluating the relationship between high temporal variation (model output) and seasonal rate (from GDR), the spatiotemporal pattern of the dust deposition rate over different climate zones revealed the probable uncertainty of the deposition rate.

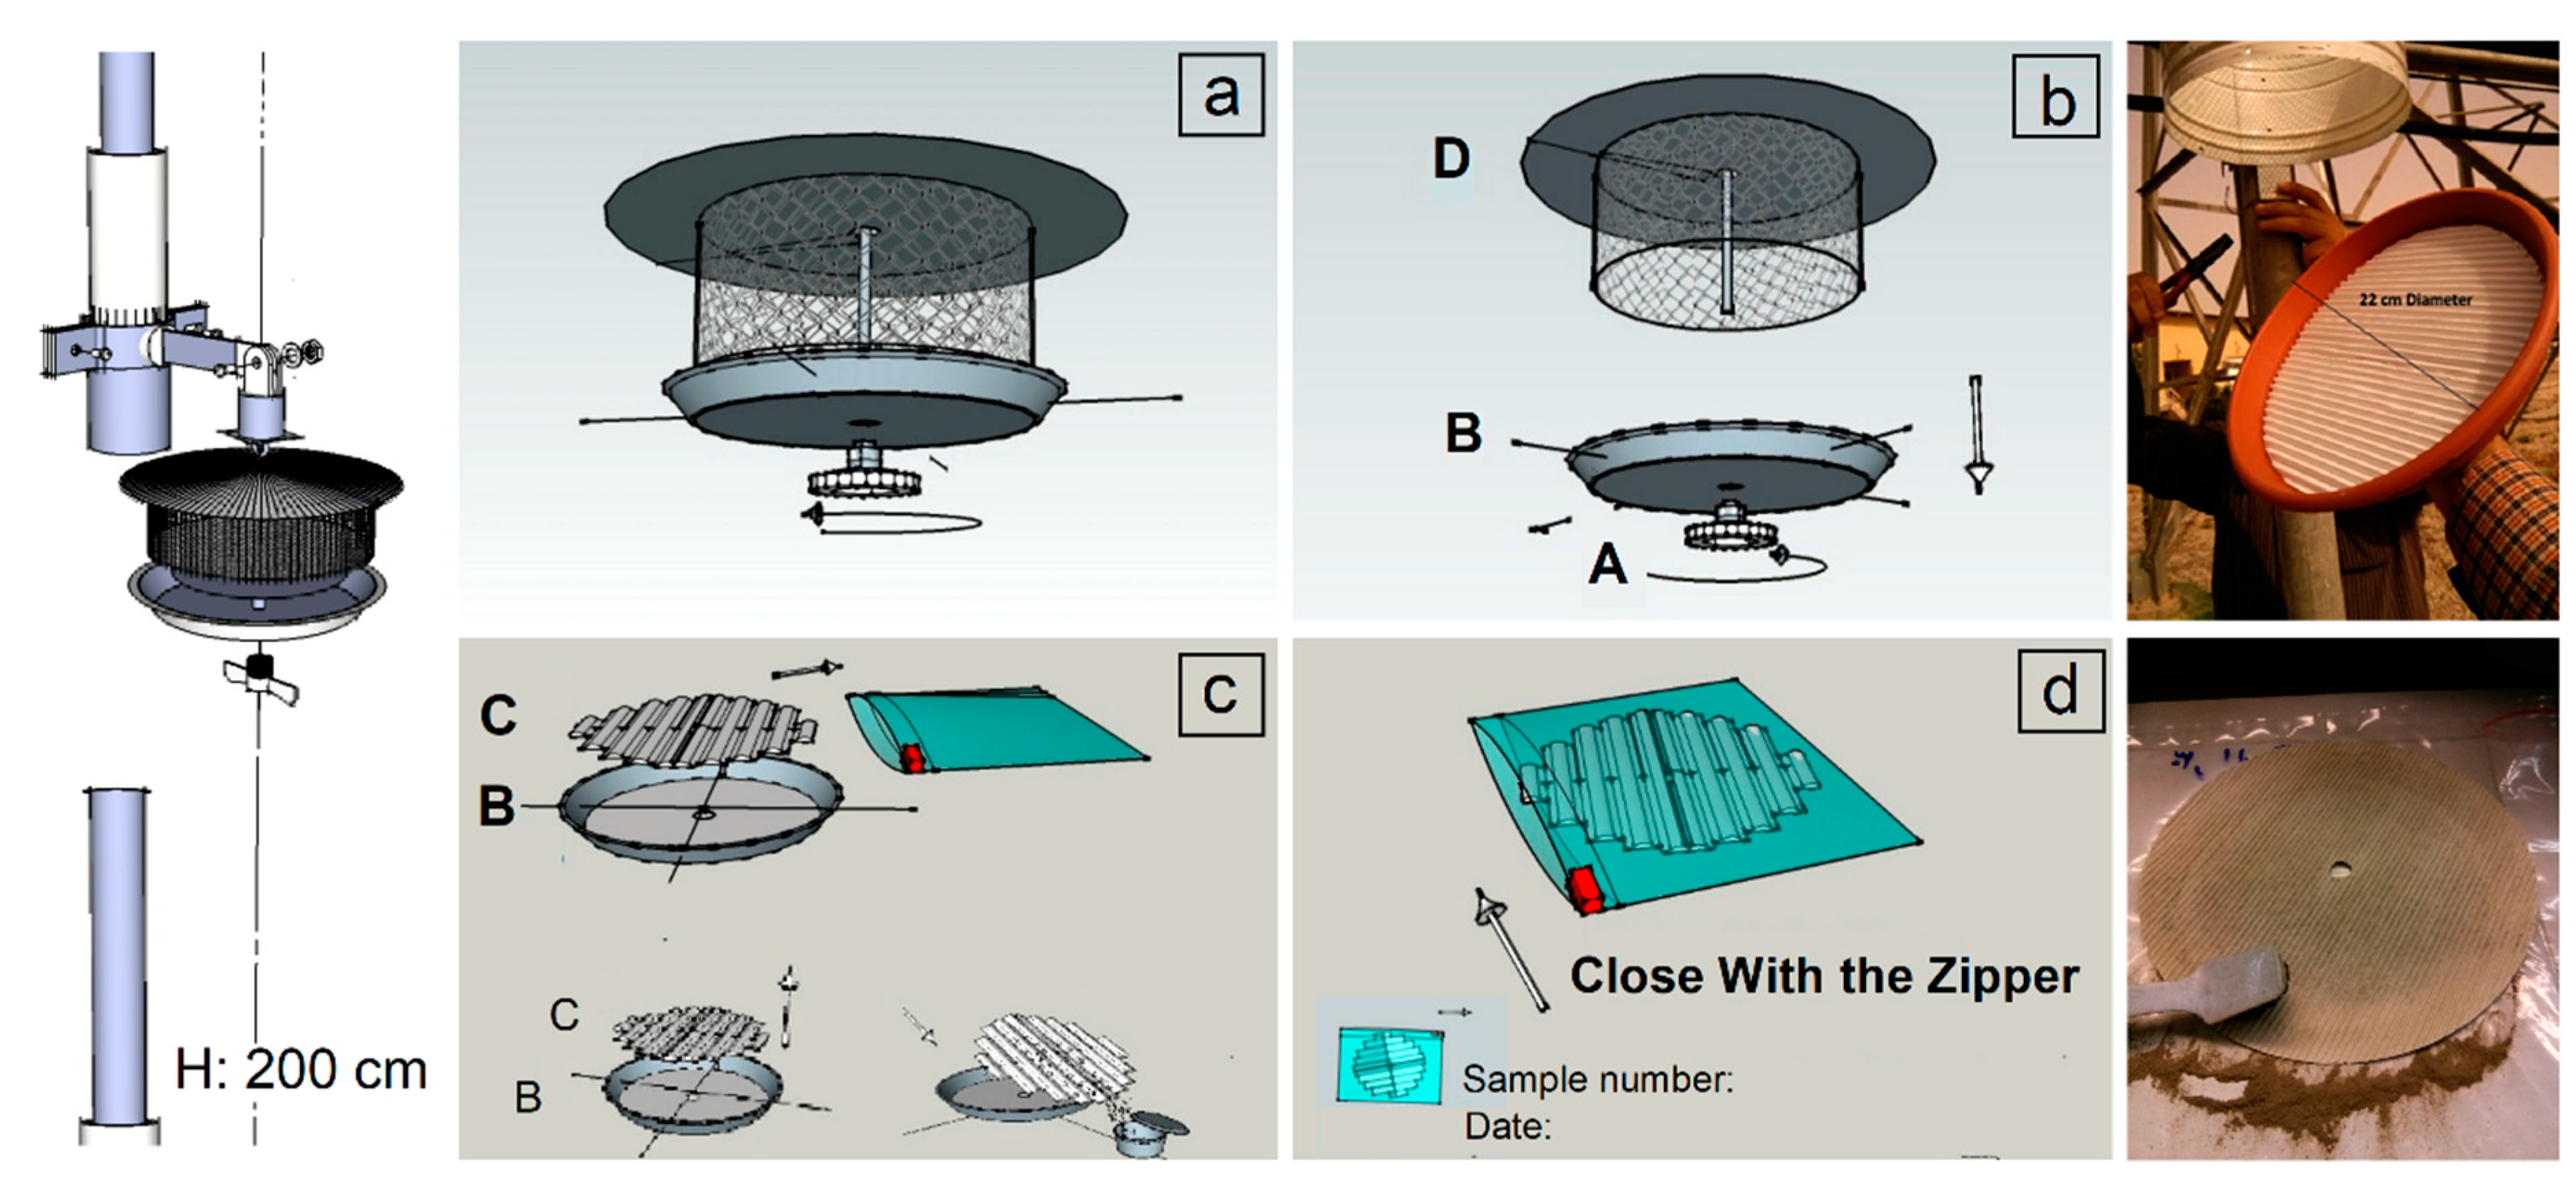
2.3.1. Ground Survey Setup

Both gravimetric and directional dust samplers (total of 20) were deployed to satisfy the requirements of ASTM international D1356-05 which is formaly known as American Society for Testing and Material [53], and began operation in 2014. Each sampler was mounted 2 m above the ground surface and kept away from possibly anthropogenic impact (traffic, human activities, and commotion). The dust was collected passively on a single piece of paper (waterproof) with a diameter of 20 cm. The directional samplers collected dust from the wind direction to the plate, while gravimetric samplers collected particles returning to the surface by gravity.
As summarized in Table 3, among the 10 ground stations, G03 and G06 appeared on the boundary of two climate zones (BSh and Csa). According to the map scale and climate resolution of 1 km, the stations belong to Csa, which encompasses a range of topographic and meteorological conditions. The detailed meteorological data and GDR datasets from the stations in southwestern Iran were analyzed to assess the seasonality of the dust deposition rates.
As shown in Figure 2, the monthly dust collection was weighted and classified according to the climate zone. Data from the weighted GDRs were used to investigate the spatiotemporal distribution of dust events.

2.3.2. MERRA-II Application

As of late, several new reanalysis applications, including those from the National Center for Environmental Prediction, North American Regional Reanalysis, was released by NASA [54]. In particular, in 1980, the second modern-era retrospective analysis for research and applications (MERRA-II) reanalysis tool was introduced. It was called M2TMNXSLV, and replaced the original MERRA reanalysis tool with an upgraded version of the Goddard Earth Observing System Model, Version 5 (GEOS-5) data assimilation system with a numerical model. For three main variables, including aerosols, atmospheric dynamic measurements, and dust, meteorological observations can be obtained. The MERRA-II has a spatial resolution of 0.5° × 0.025° at 550 nm, and hourly to monthly temporal data are available. As these data were integrated from a variety of satellite systems with numerical models in order to produce a temporally and spatially consistent composite of the climate [54,55], MERRA-II is ideal for investigating climate variability. Given this dynamic, the MERRA-II dataset using GEOS-5 (version 5.12.4) can also function extensively with an expanding array of application areas, such as ecological forecasting, air quality, wind flow patterns, meteorological observations, and dust, as part of its routine reports [55,56,57]. Because various parameters of MERRA-II were evaluated, validating its results, the dry deposition values obtained using MERRA-II with latitude and longitude of the climate zone were obtained for each climate area using the NASA official website [58]. Further, the MERRA-II results were used to evaluate the correlation between the dry deposition rates and GDR during the period 2014–2017.

3. Results

This section presents the results of the weather pattern analysis for the study area, as well as the ground-based and MERRA-II deposition rates. After a detailed description of the meteorological and dust deposition rate data in Section 3.1 and Section 3.2, their connection was analyzed for further discussion in Section 4.

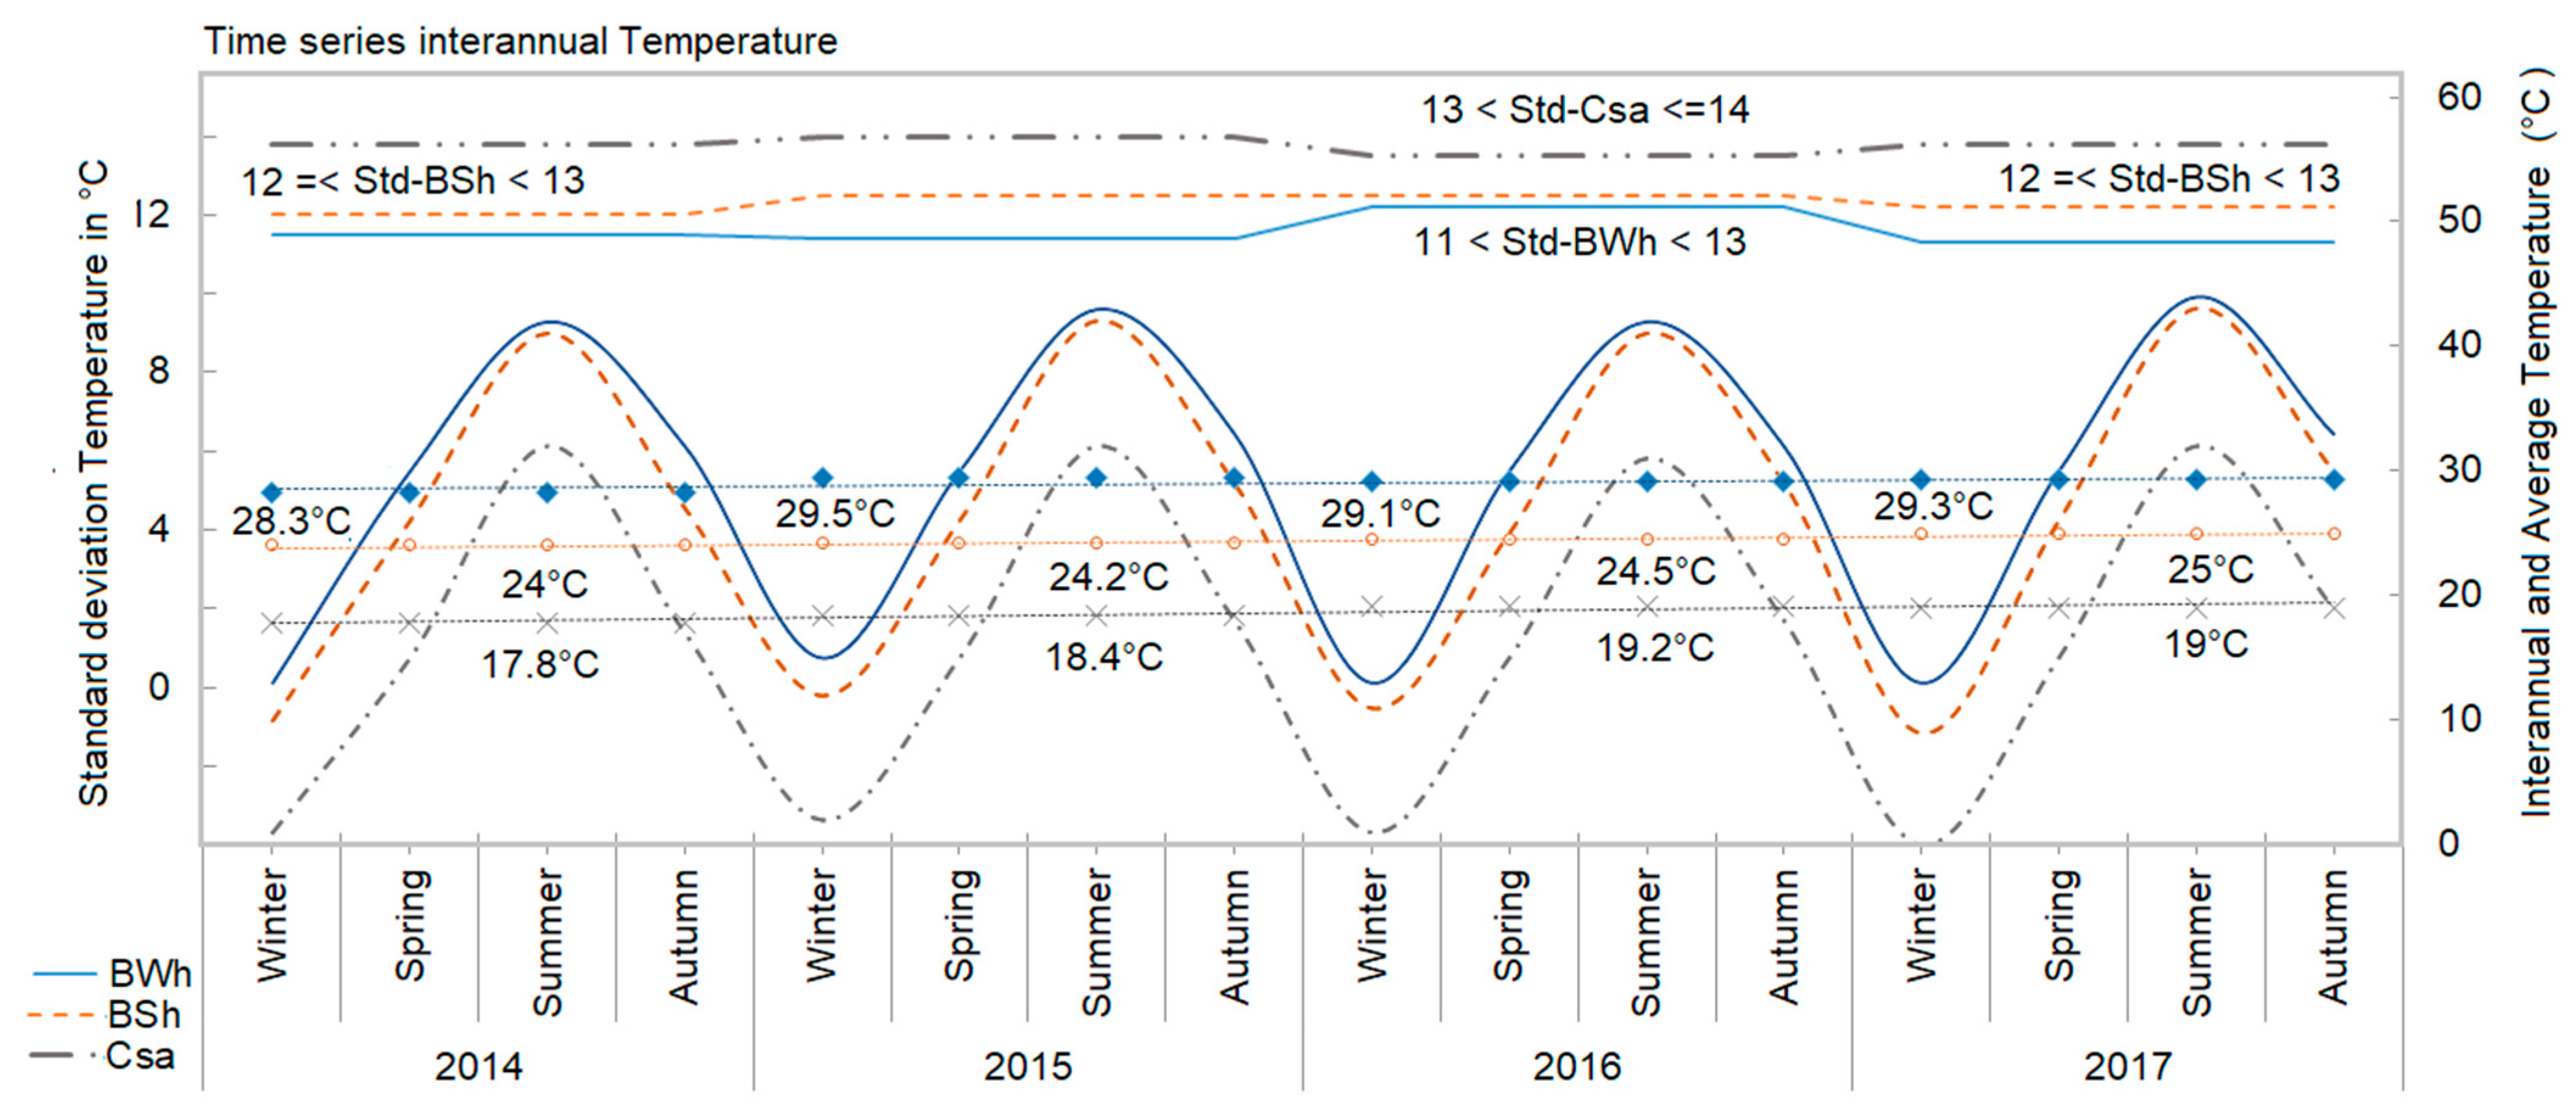
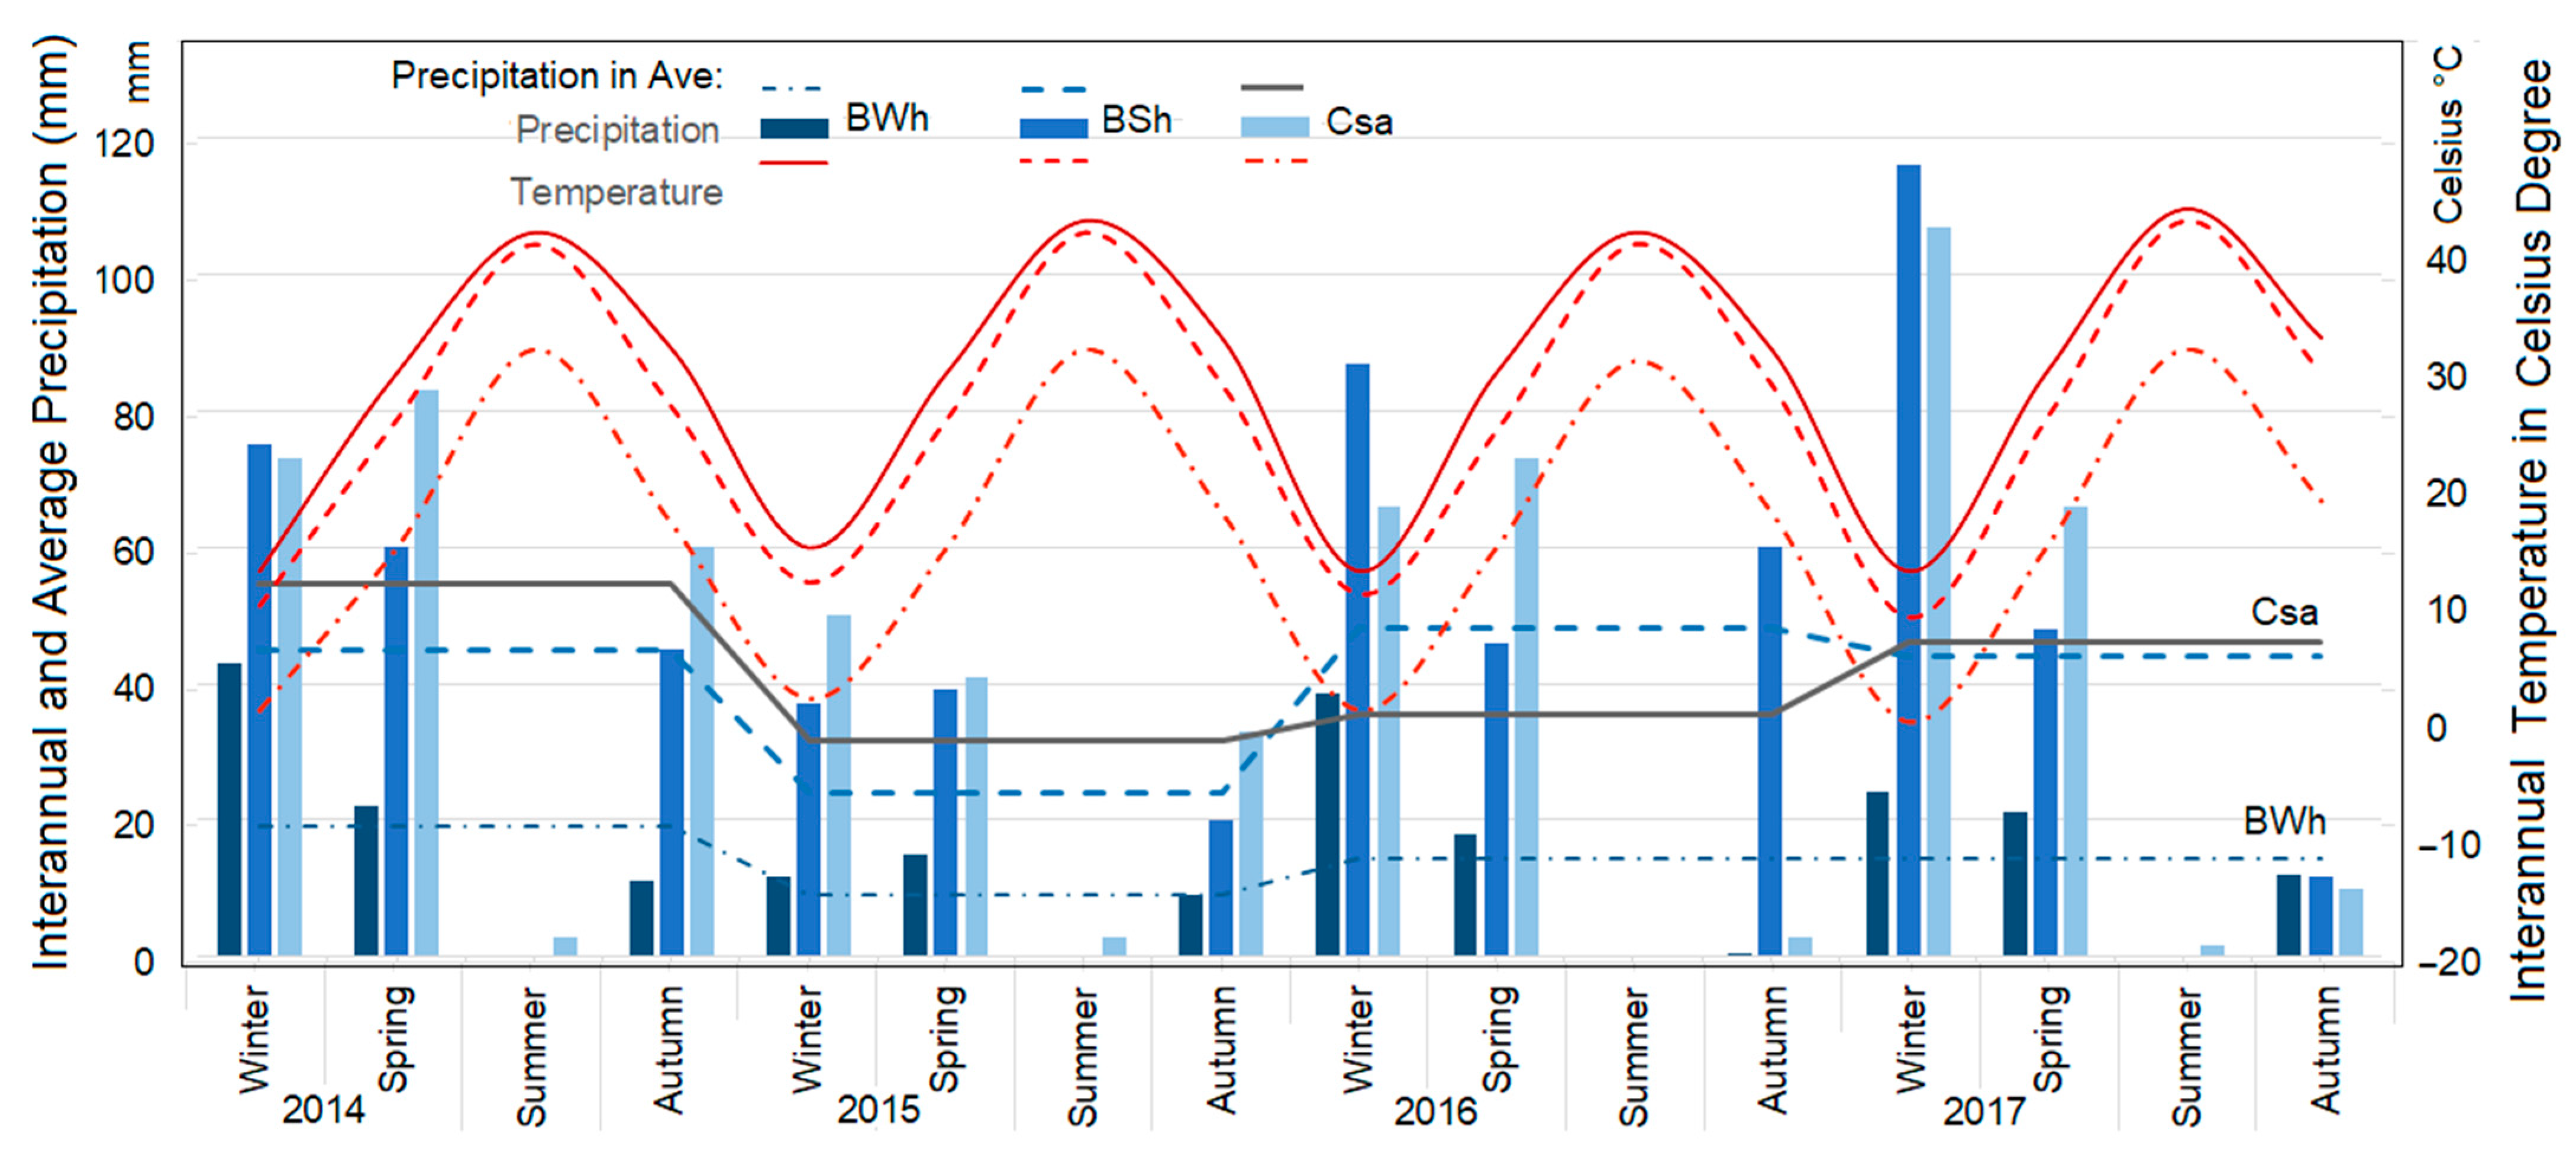
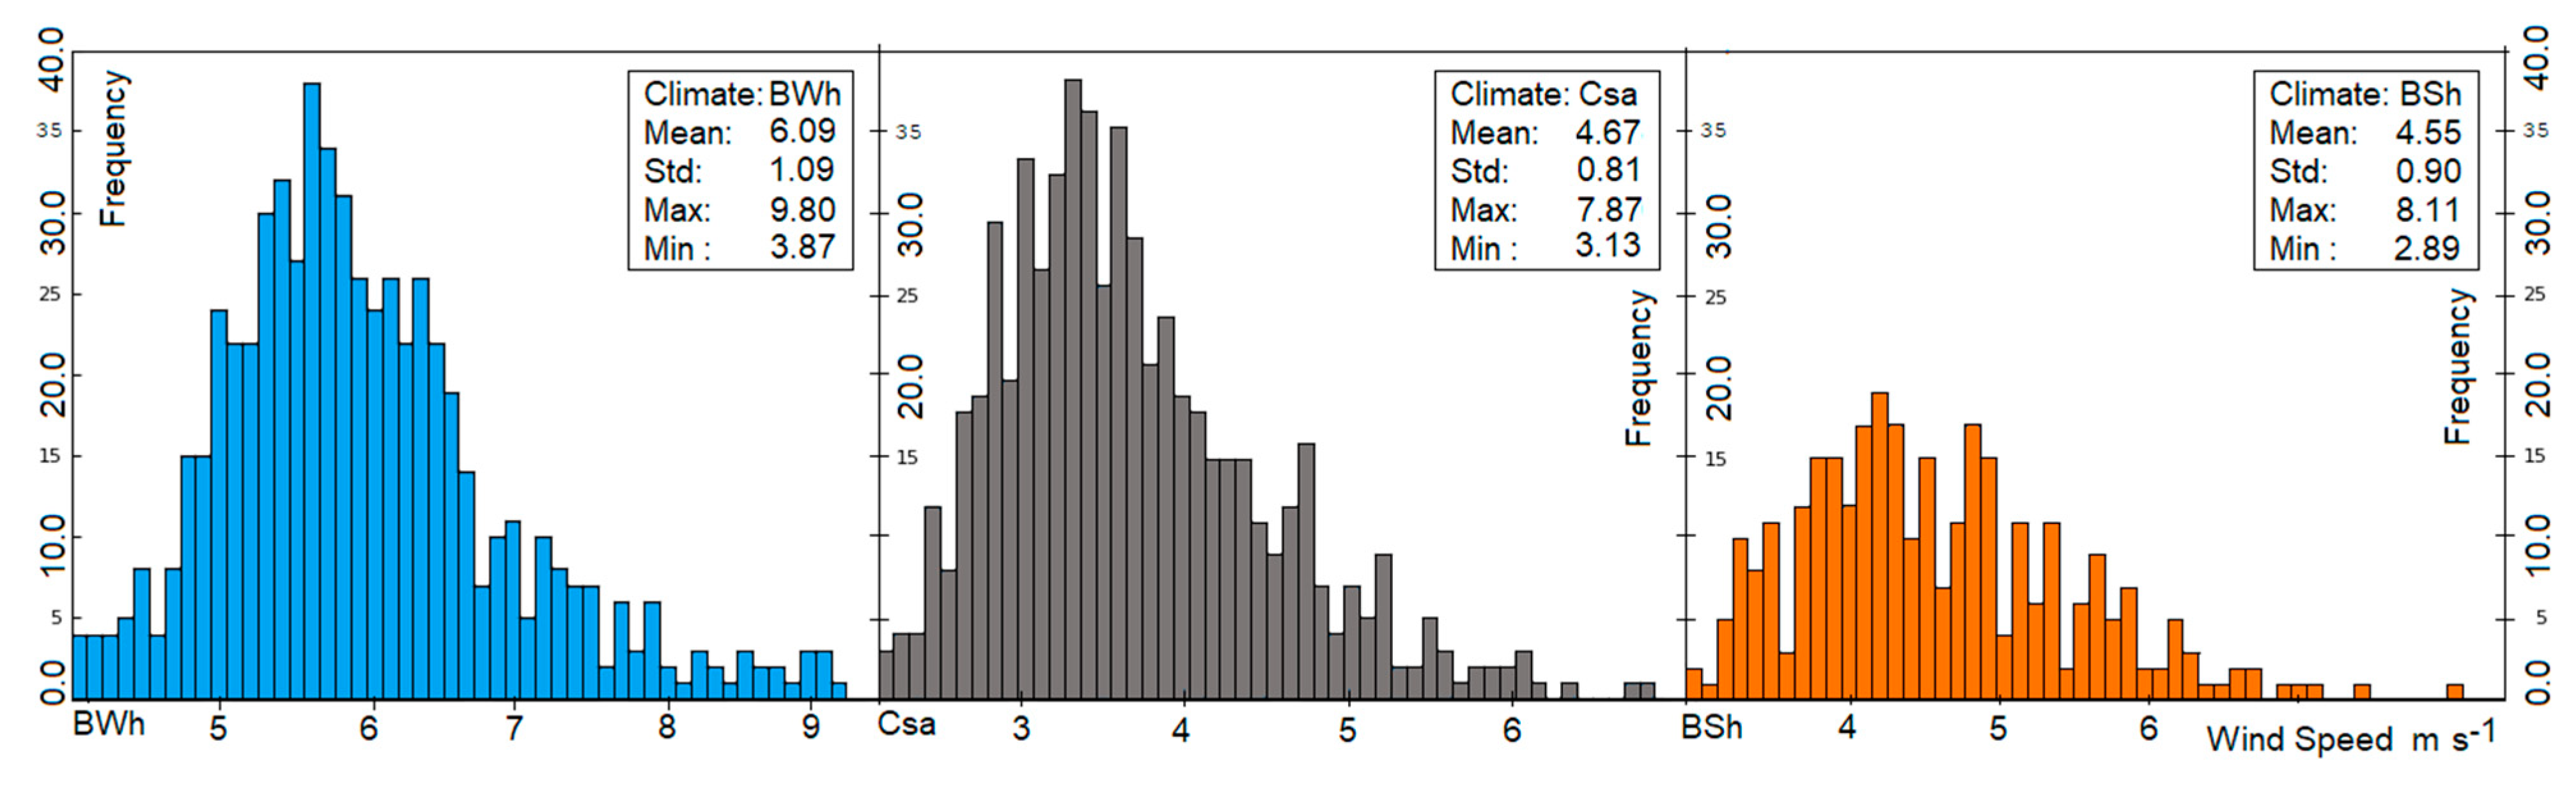
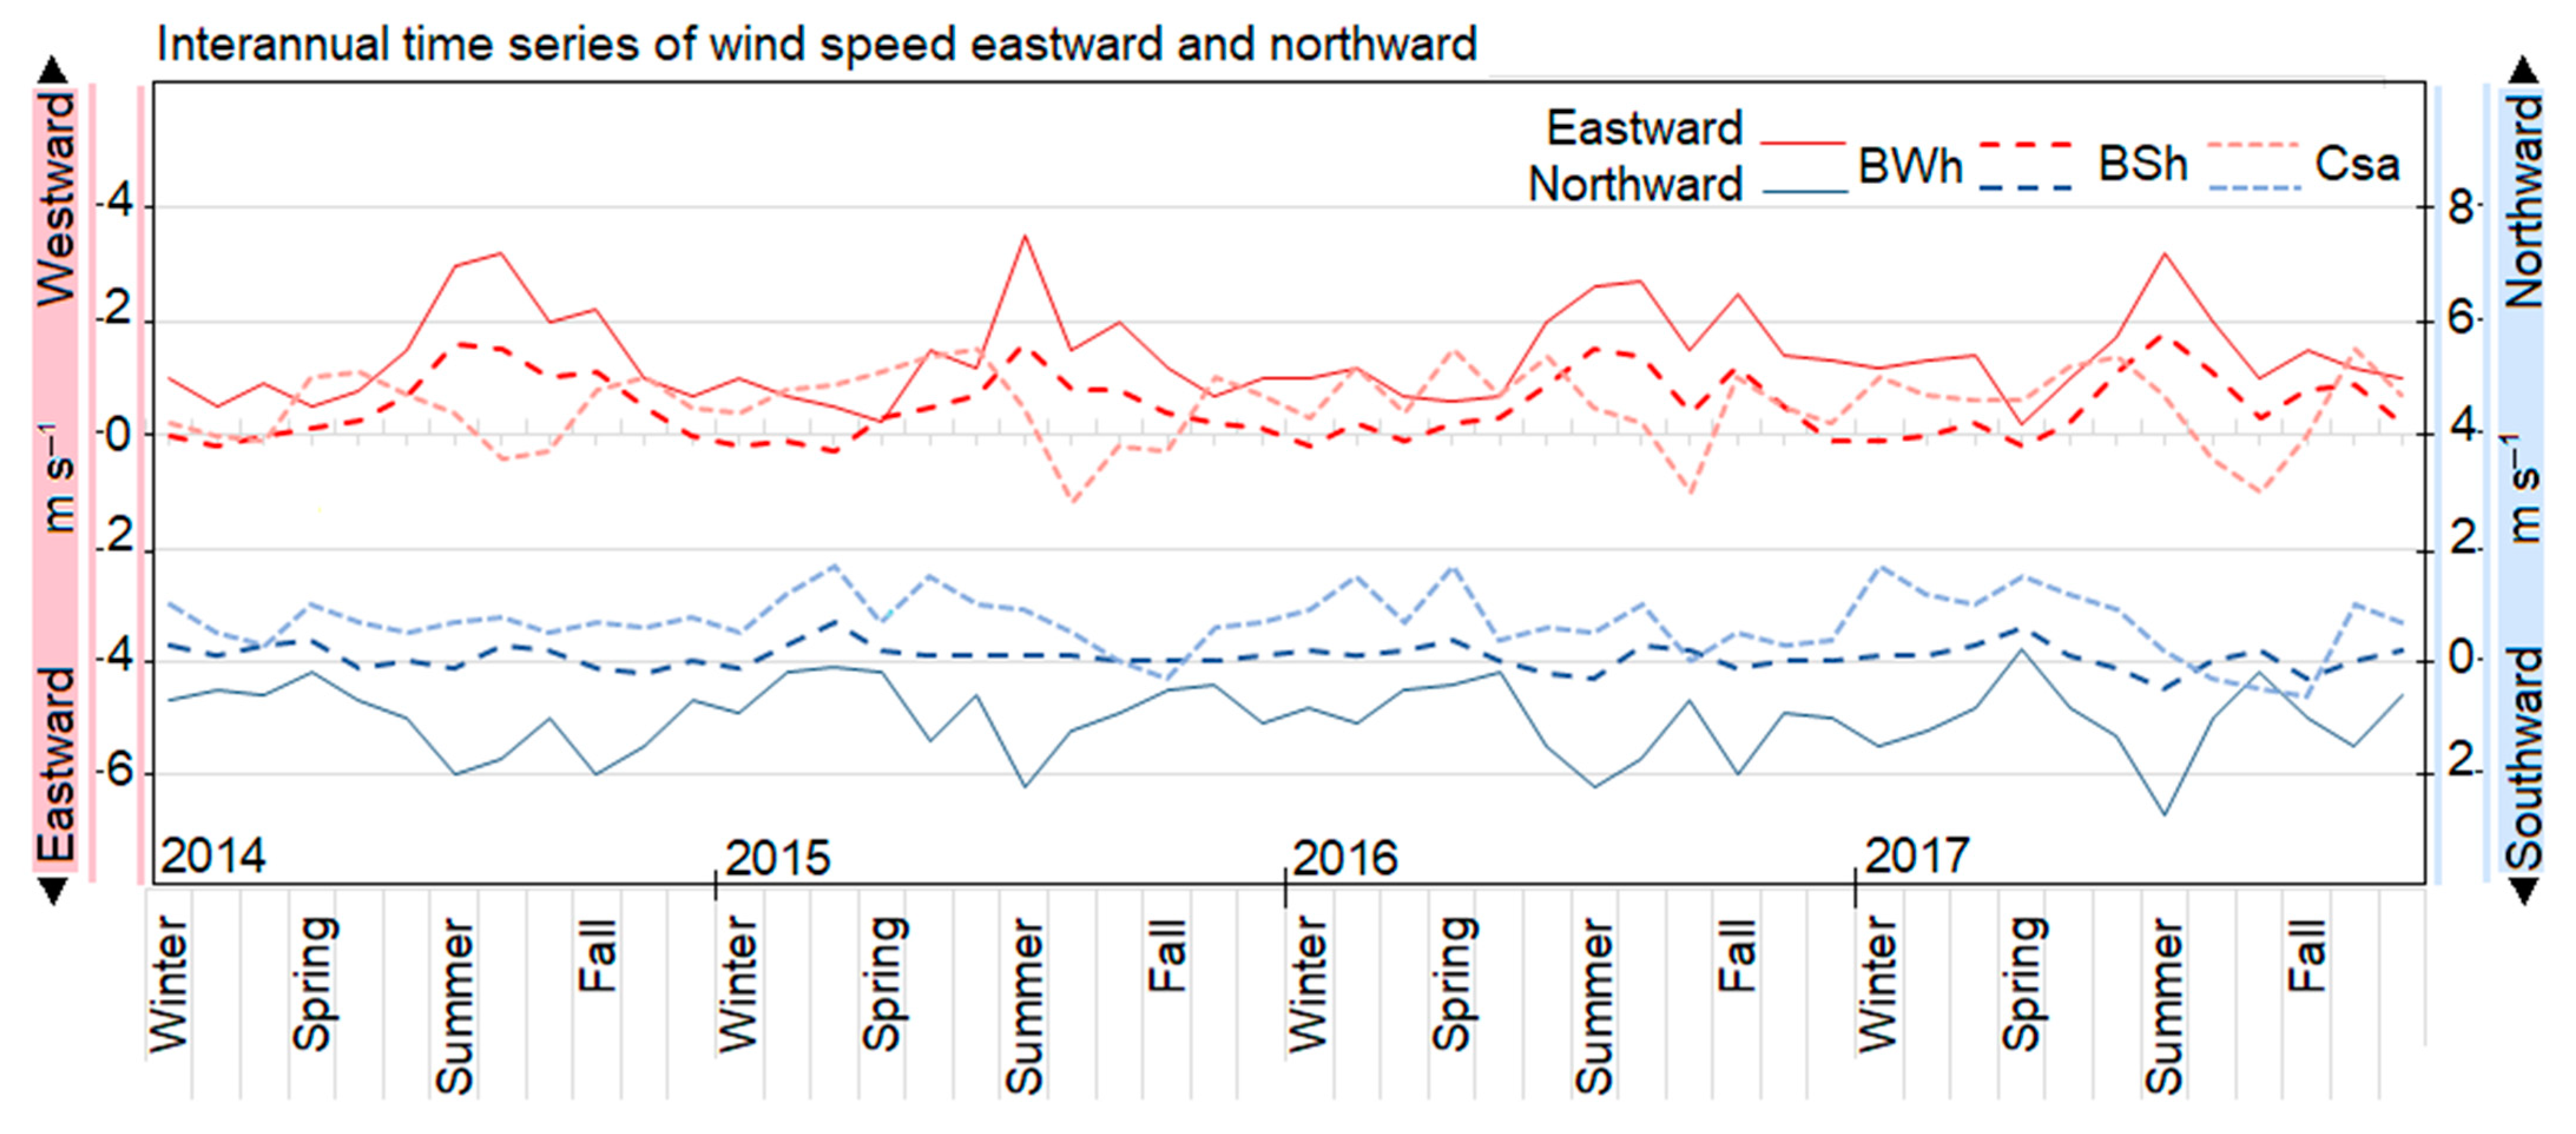
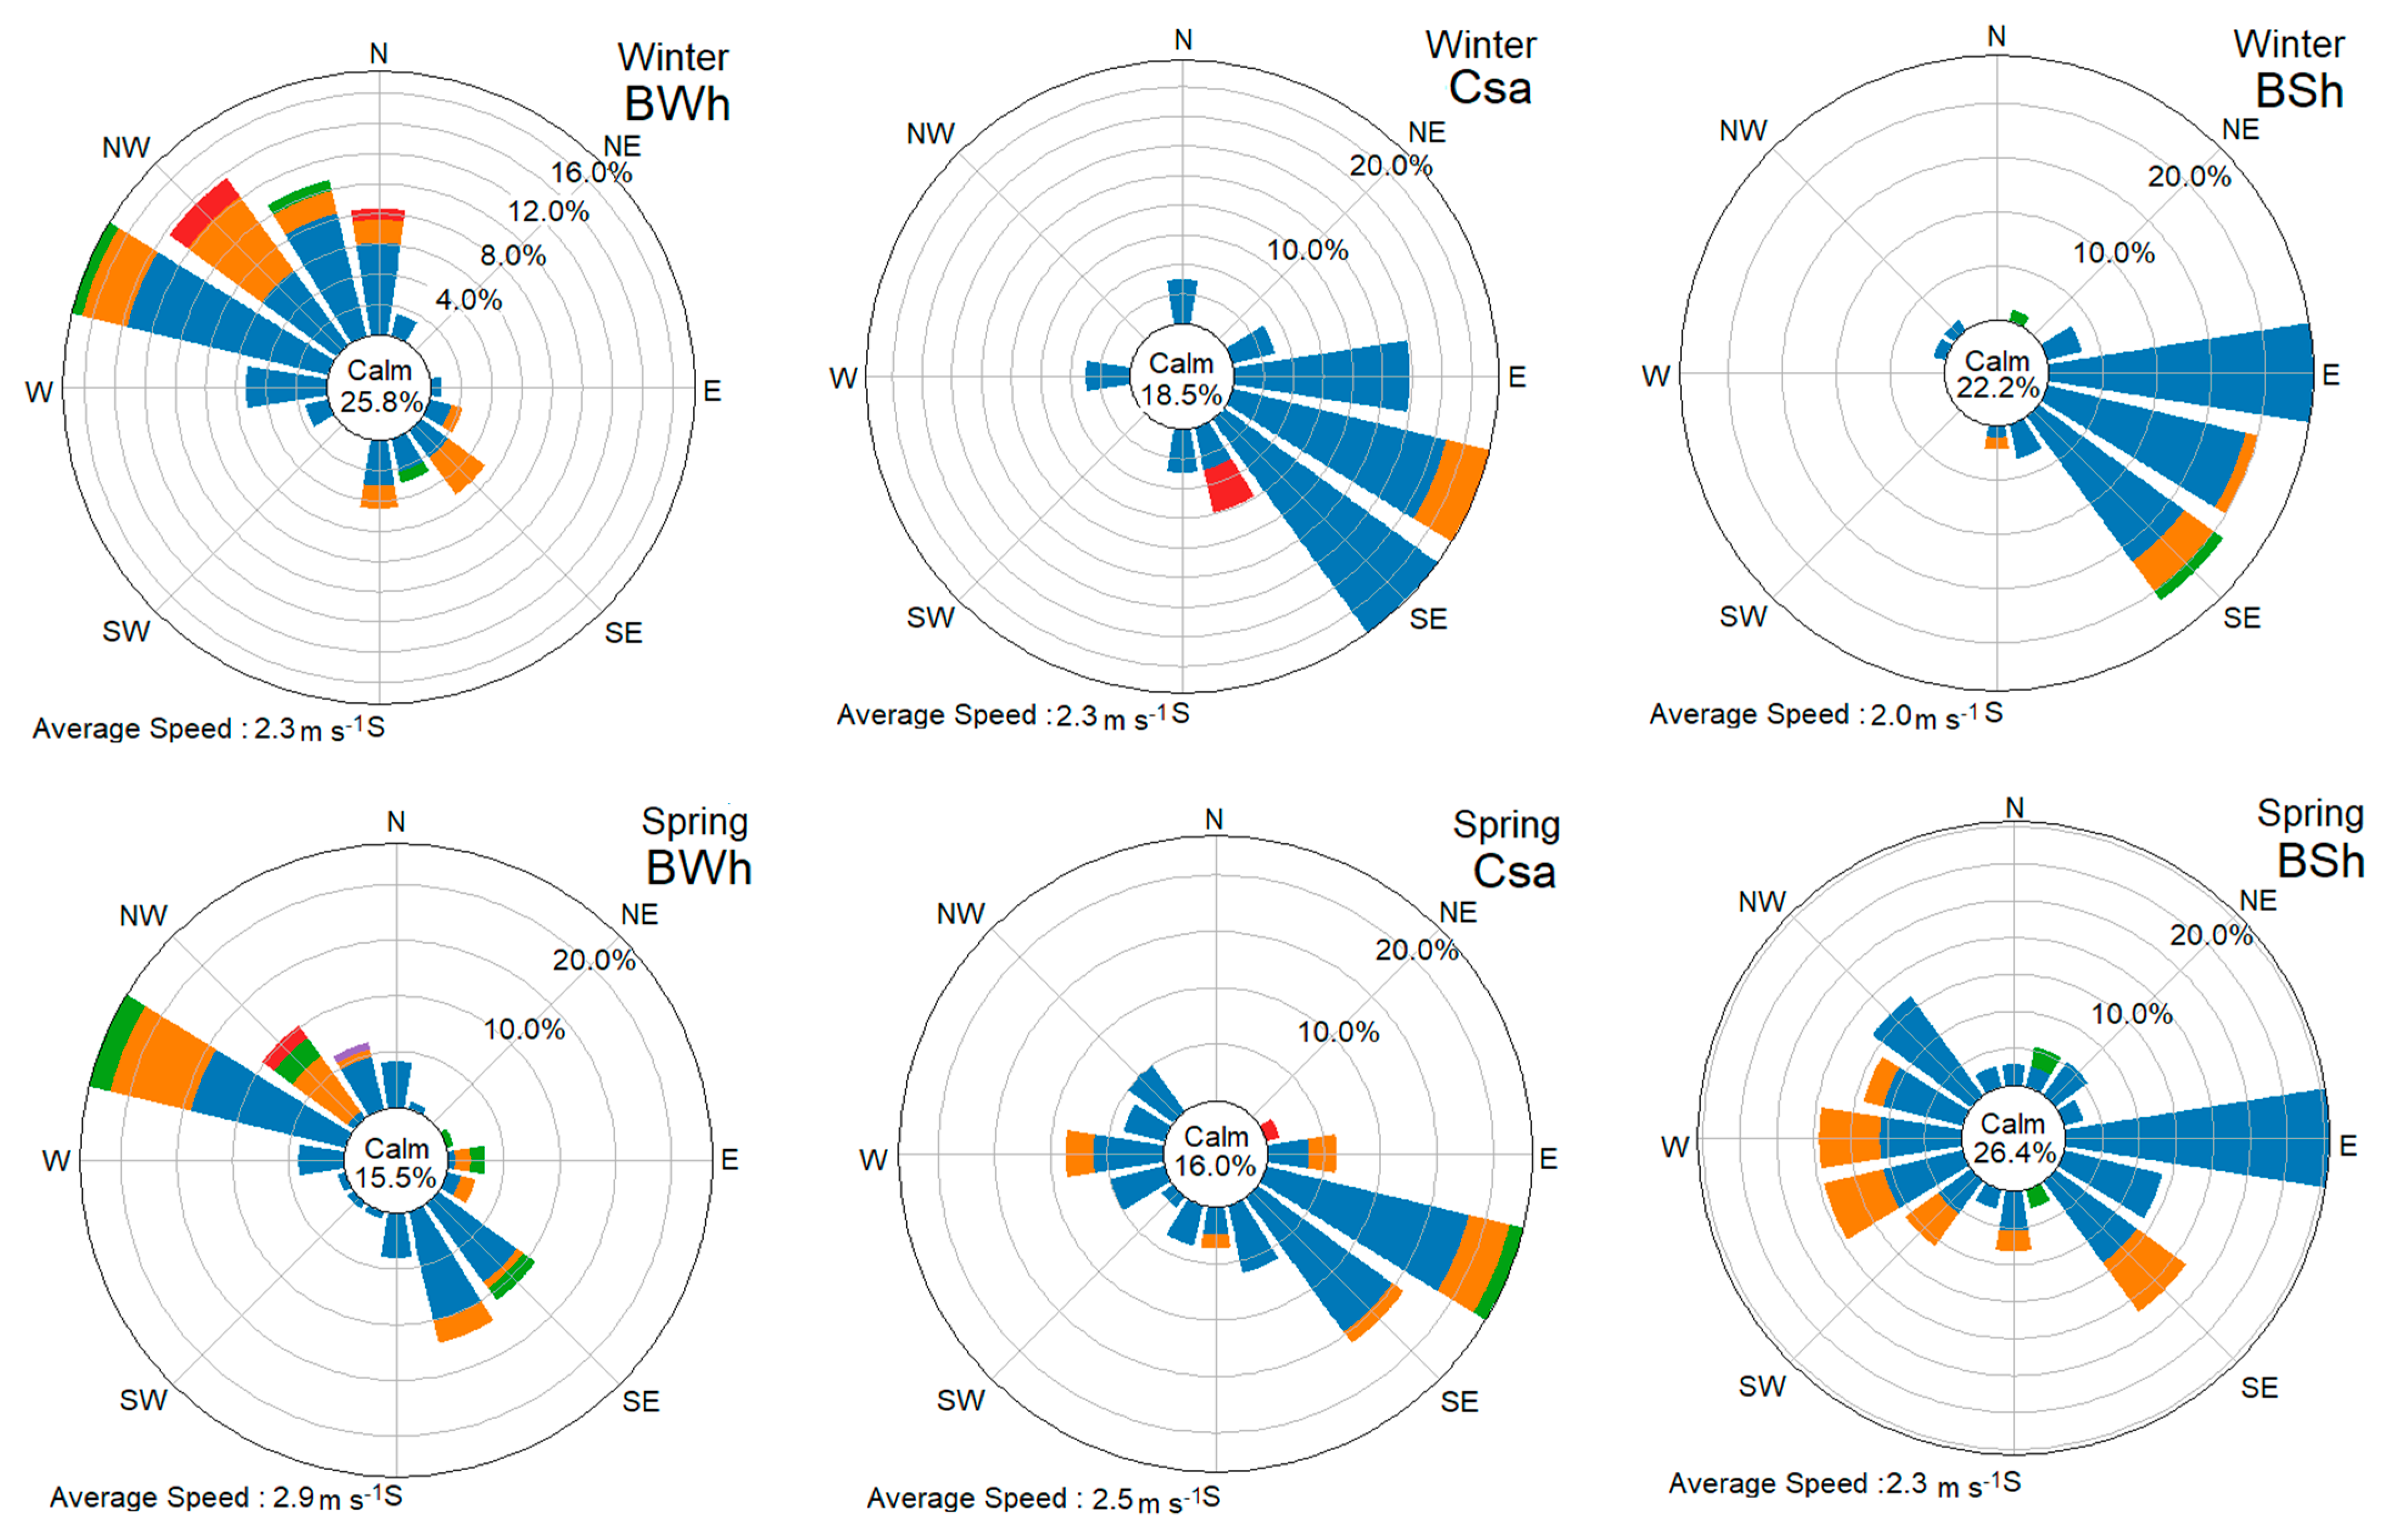
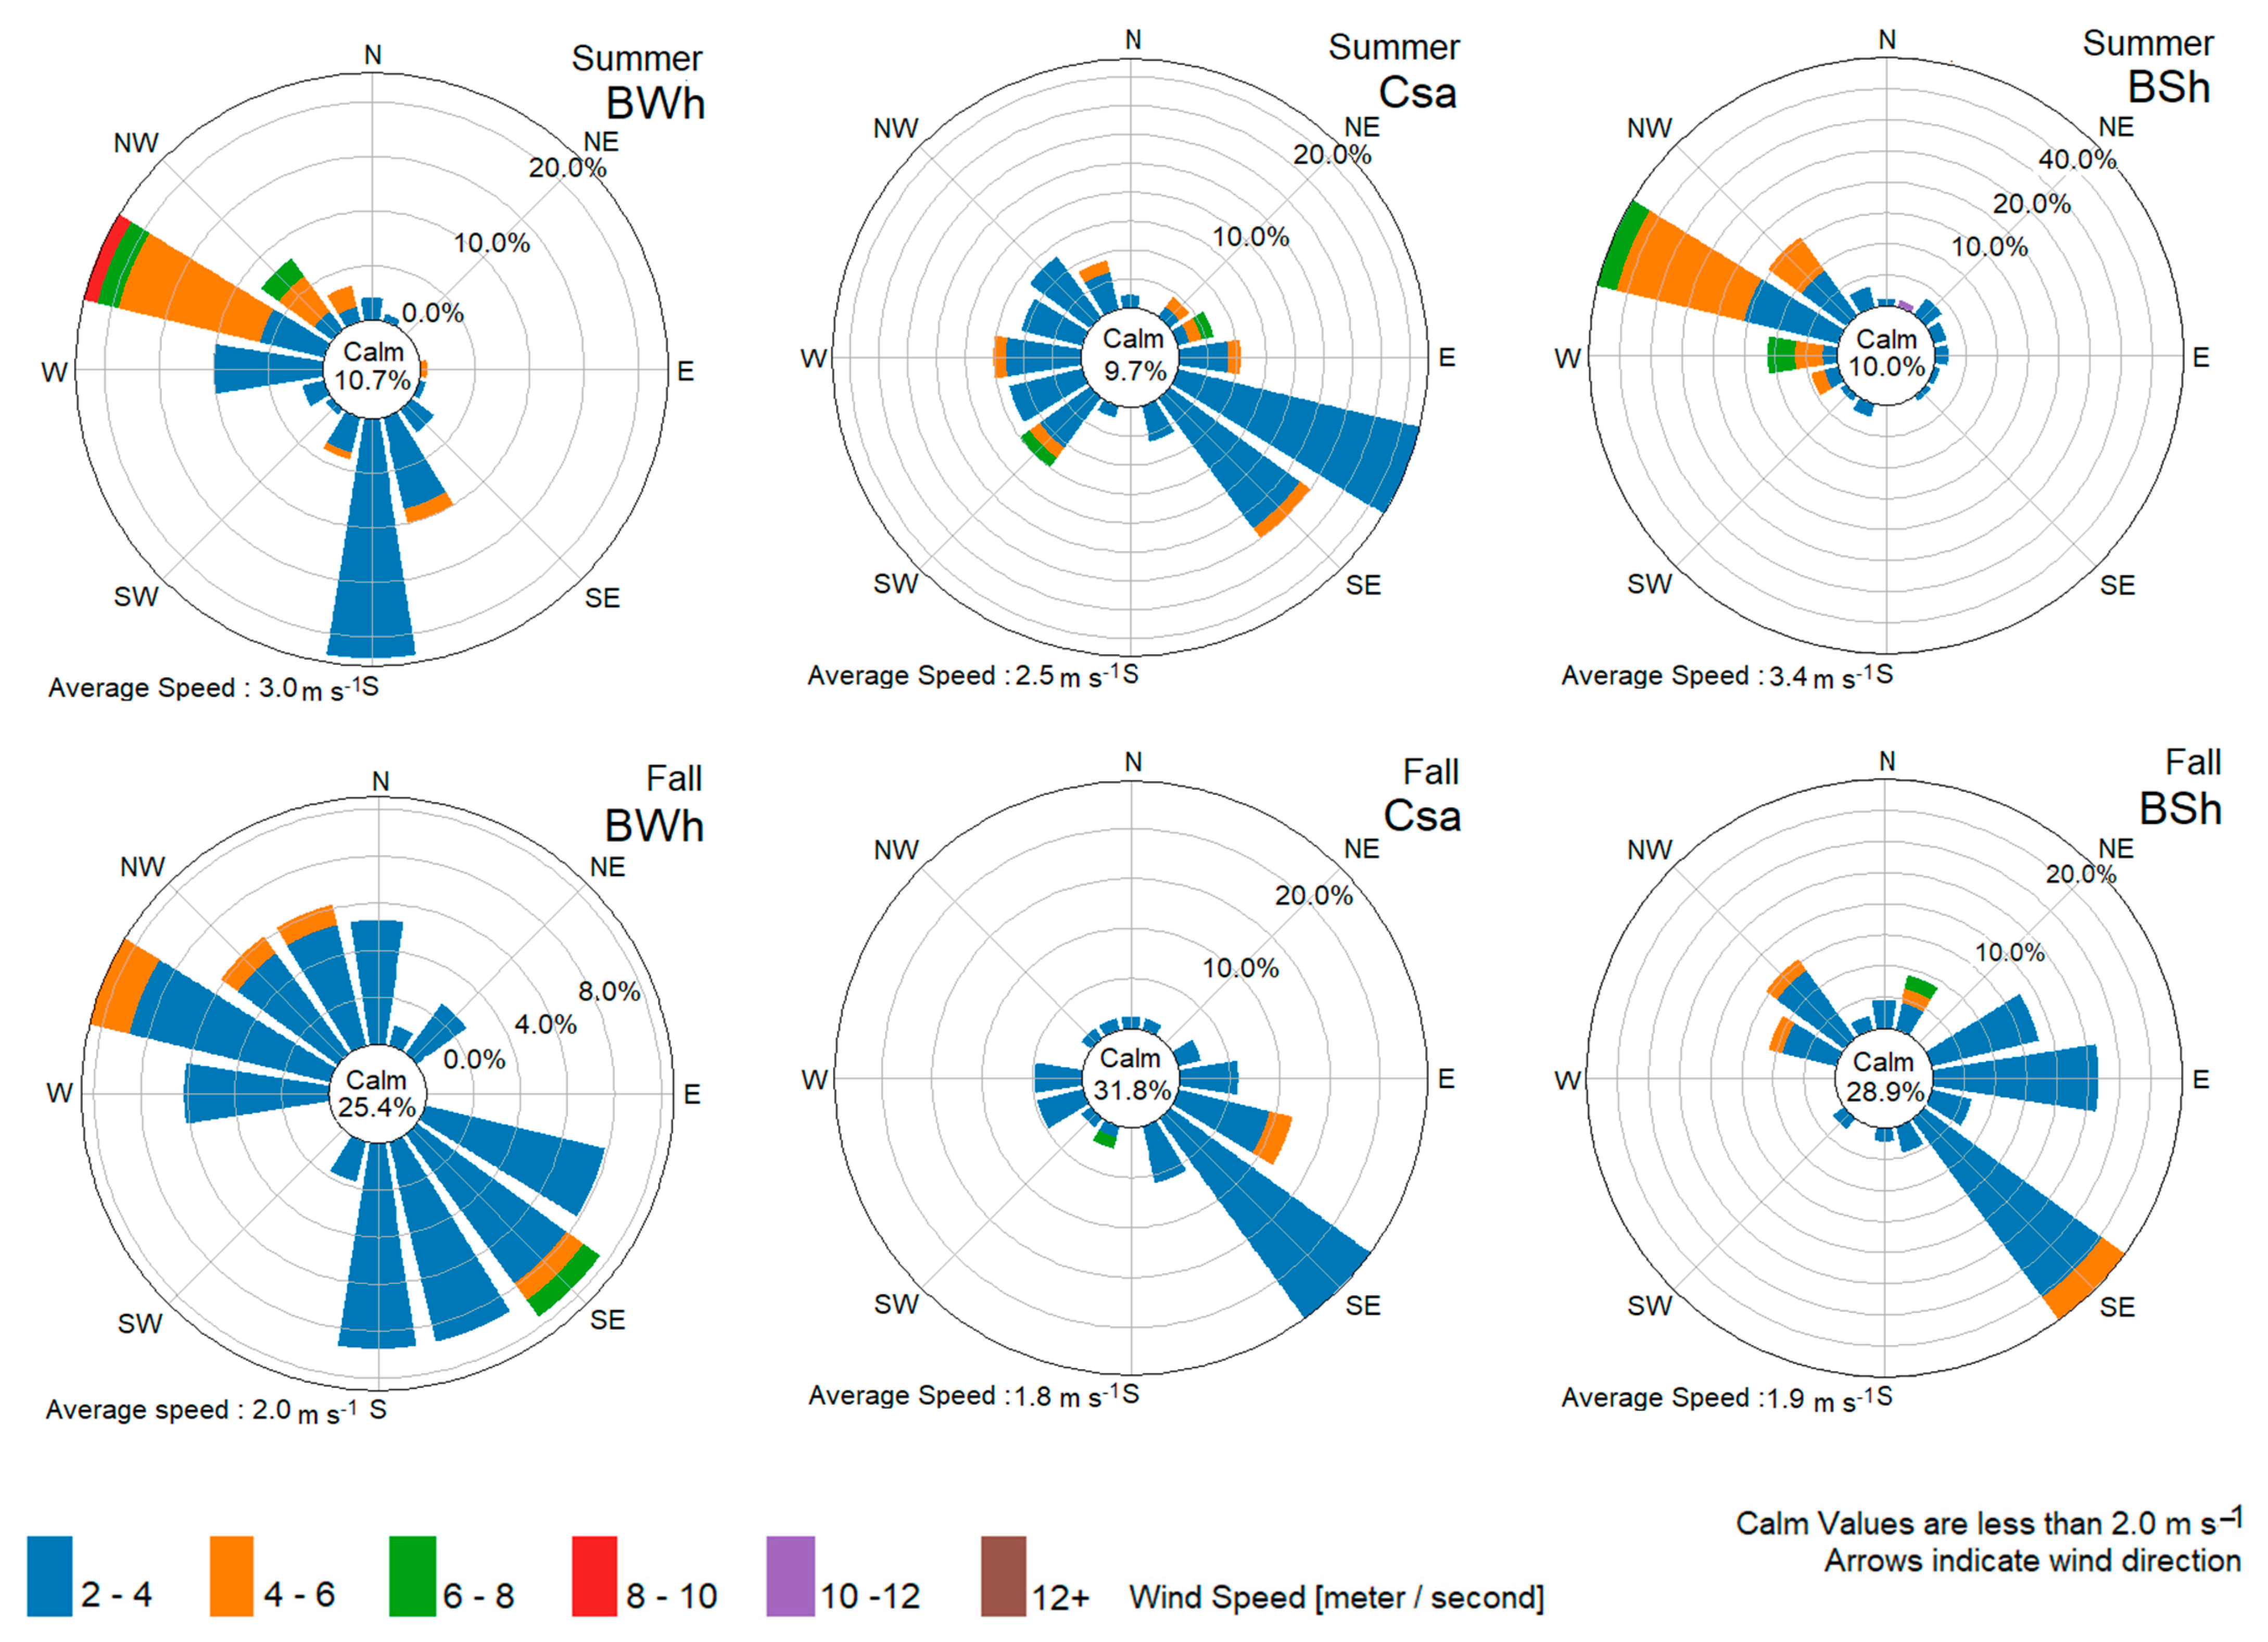
3.1. Meteorological Setting

Figure 3 illustrates the average interannual monthly temperatures of the three climate zones (BWh, BSh, and Csa). The data compare the temperatures in each climate zone over time.
Each climate zone had a maximum average (BWh: 29.5 °C, 2015; BSh: 25 °C, 2017; and Csa: 19.2 °C, 2016) that occurred at varying times during the study period. Each zone’s minimum average occurred in 2014, revealing desert-hot (BWh: 28.3 °C), steppe hot (BSh: 24 °C), and temperate-hot-(Csa: 17.8 °C) summers. The fluctuating trend with the highest standard deviation (Std) was recorded for the temperate-hot-summer zone (13 °C < Csa < 14 °C). Meanwhile, the steppe hot zone temperature Std remained between 12 °C and 13 °C. Moreover, the desert-hot zone had a smaller Std than that of the other two zones with an Std range of 11 °C < BWh < 13 °C.
As shown in Figure 4, the precipitation and average temperatures of the three climate zones were calculated from 2014 to 2017. The seasonal distribution of the precipitation data showed that the highest amounts of rainfall were detected during the winter and spring, while the summer months received very little precipitation. Moreover, the average annual precipitation in the hot desert climate (BWh) was between 107 mm in 2015 and 228 mm in 2014. That of the hot steppe area (BSh) was considerably higher, typically around 540 mm year−1, with the exception of 2015, which had average precipitation of only 228 mm. The warm temperate climate zone (Csa) followed the same trend with below-average precipitation in 2015 (381 mm), while the precipitation in 2014 reached 667 mm. This temporal pattern was also detected by NOAA researchers [59], who identified 2015 as the warmest year on record for Asia and South America, with a global temperature deviation of 0.90 °C above average for the period 1901–2000. New monthly records were set in each month of 2015, with the exceptions of January and April In addition, the summer of 2015 was the driest season in central Europe from 1901 to 2015 [60]. Conversely, in monsoon-influenced regions, more extreme precipitation evens related to the temperature anomaly were recorded [61]. Recently, the global total precipitation from January 2015 to December 2018 was compared with the data from 1951 to 2010 [62] revealing that the region east of the Persian Gulf (including the study area) was, among other regions (North America, northern South America, Europe, northeast Australia, and southern and south-west Africa), characterized by a significant negative precipitation anomaly during recent years. This indicates a negative correlation between summer precipitation and air temperature, although it is non-linear.
Wind characteristics are also highly important synoptic parameters as they heavily influence the temporal distribution and intensity of dust events and dust deposition rates. Herein, clear wind data distinctions were found between the three climate zones.
Figure 5 shows the frequency of the average monthly wind speeds over all four years of observation. The overall mean wind speeds for BWh, BSh, and Csa were 6.09 m s−1, 4.55 m s−1, and 4.67 m s−1, respectively. Note that the data distribution is skewed toward lower wind speeds, suggesting that the most frequent wind speeds are below the mean values. The Stds of the wind speed variation are representative of the unsteady wind speeds in BWh, BSh, and Csa, which are 1.09 m s−1, 0.90 m s−1, and 0.81 m s−1, respectively.
Westward winds in Figure 6 showed a similar seasonal variation pattern in the BWh and BSh climate zones, with maximum wind speeds of 3.5 m s−1 and 1.8 m s−1, respectively, during the summer and minimum speeds during the winter and spring. Meanwhile, the Csa climate was characterized by maximum eastward wind speeds of 1.2 m s−1 in the summer and minima in the spring and winter. Further, the northward wind speed over the Csa region exhibits bimodal seasonal variation with two maxima, one during the spring and another during the winter, while the minima were recorded in fall and summer. Conversely, regions with southward wind speeds revealed a complex temporal dynamic with double peaks during the spring and summer of 2015 and 2016, and during the summer and fall of 2014. During summer in 2017, however, a unimodal seasonal variation with one maximum was observed.
To further illustrate the seasonal differences within and between the three climate zones, seasonal wind roses were designed using the frequency of different wind speeds as a percentage of the total wind (Figure 7). The predominant seasonal wind directions in the BWh are along the northwest axis in every season, with average frequencies of 54% (winter), 52% (spring), 50% (summer), and 34% (fall). During summer and fall, southern and southeastern wind directions became more dominant, reaching up to 25%. The average seasonal wind speed in the BWh was the lowest in the fall (2.0 m s−1) and winter (2.3 m s−1) and the highest in spring (2.9 m s−1) and summer (3.0 m s−1).
In all seasons, the dominant wind direction in the Csa climate zone was southeast, with average frequencies of 40%, 40%, 39%, and 35% in the winter, spring, summer, and fall, respectively. Calms and events with no discernable wind direction occurred around the year, with frequencies of 18.5% (winter), 18.5% (spring), 9.7% (summer), and 31.8% (fall). Further, the Csa wind rose plots illustrated that the average seasonal wind speed was the lowest during the fall (1.8 m s−1) and highest (2.5 m s−1) during the spring and summer, while winter had an average of 2.3 m s−1.
The predominant seasonal wind direction over the BSh was also along the southeast axis, with frequencies of 52% and 40% in the fall and winter, respectively. However, the most frequent single wind directions were detected during the spring (east: 22.5%; west: 20%) and summer (west-northwest: 50%; northwest: 10%). The average wind speeds were 1.9 m s−1, 2.0 m s−1, 2.3 m s−1, and 3.4 m s−1 during the fall, winter, spring, and summer, respectively. Calms and events with no discernable wind direction were recorded in every season at frequencies of 22.2% (winter), 26.4% (spring), 10% (summer), and 28.9% (fall).

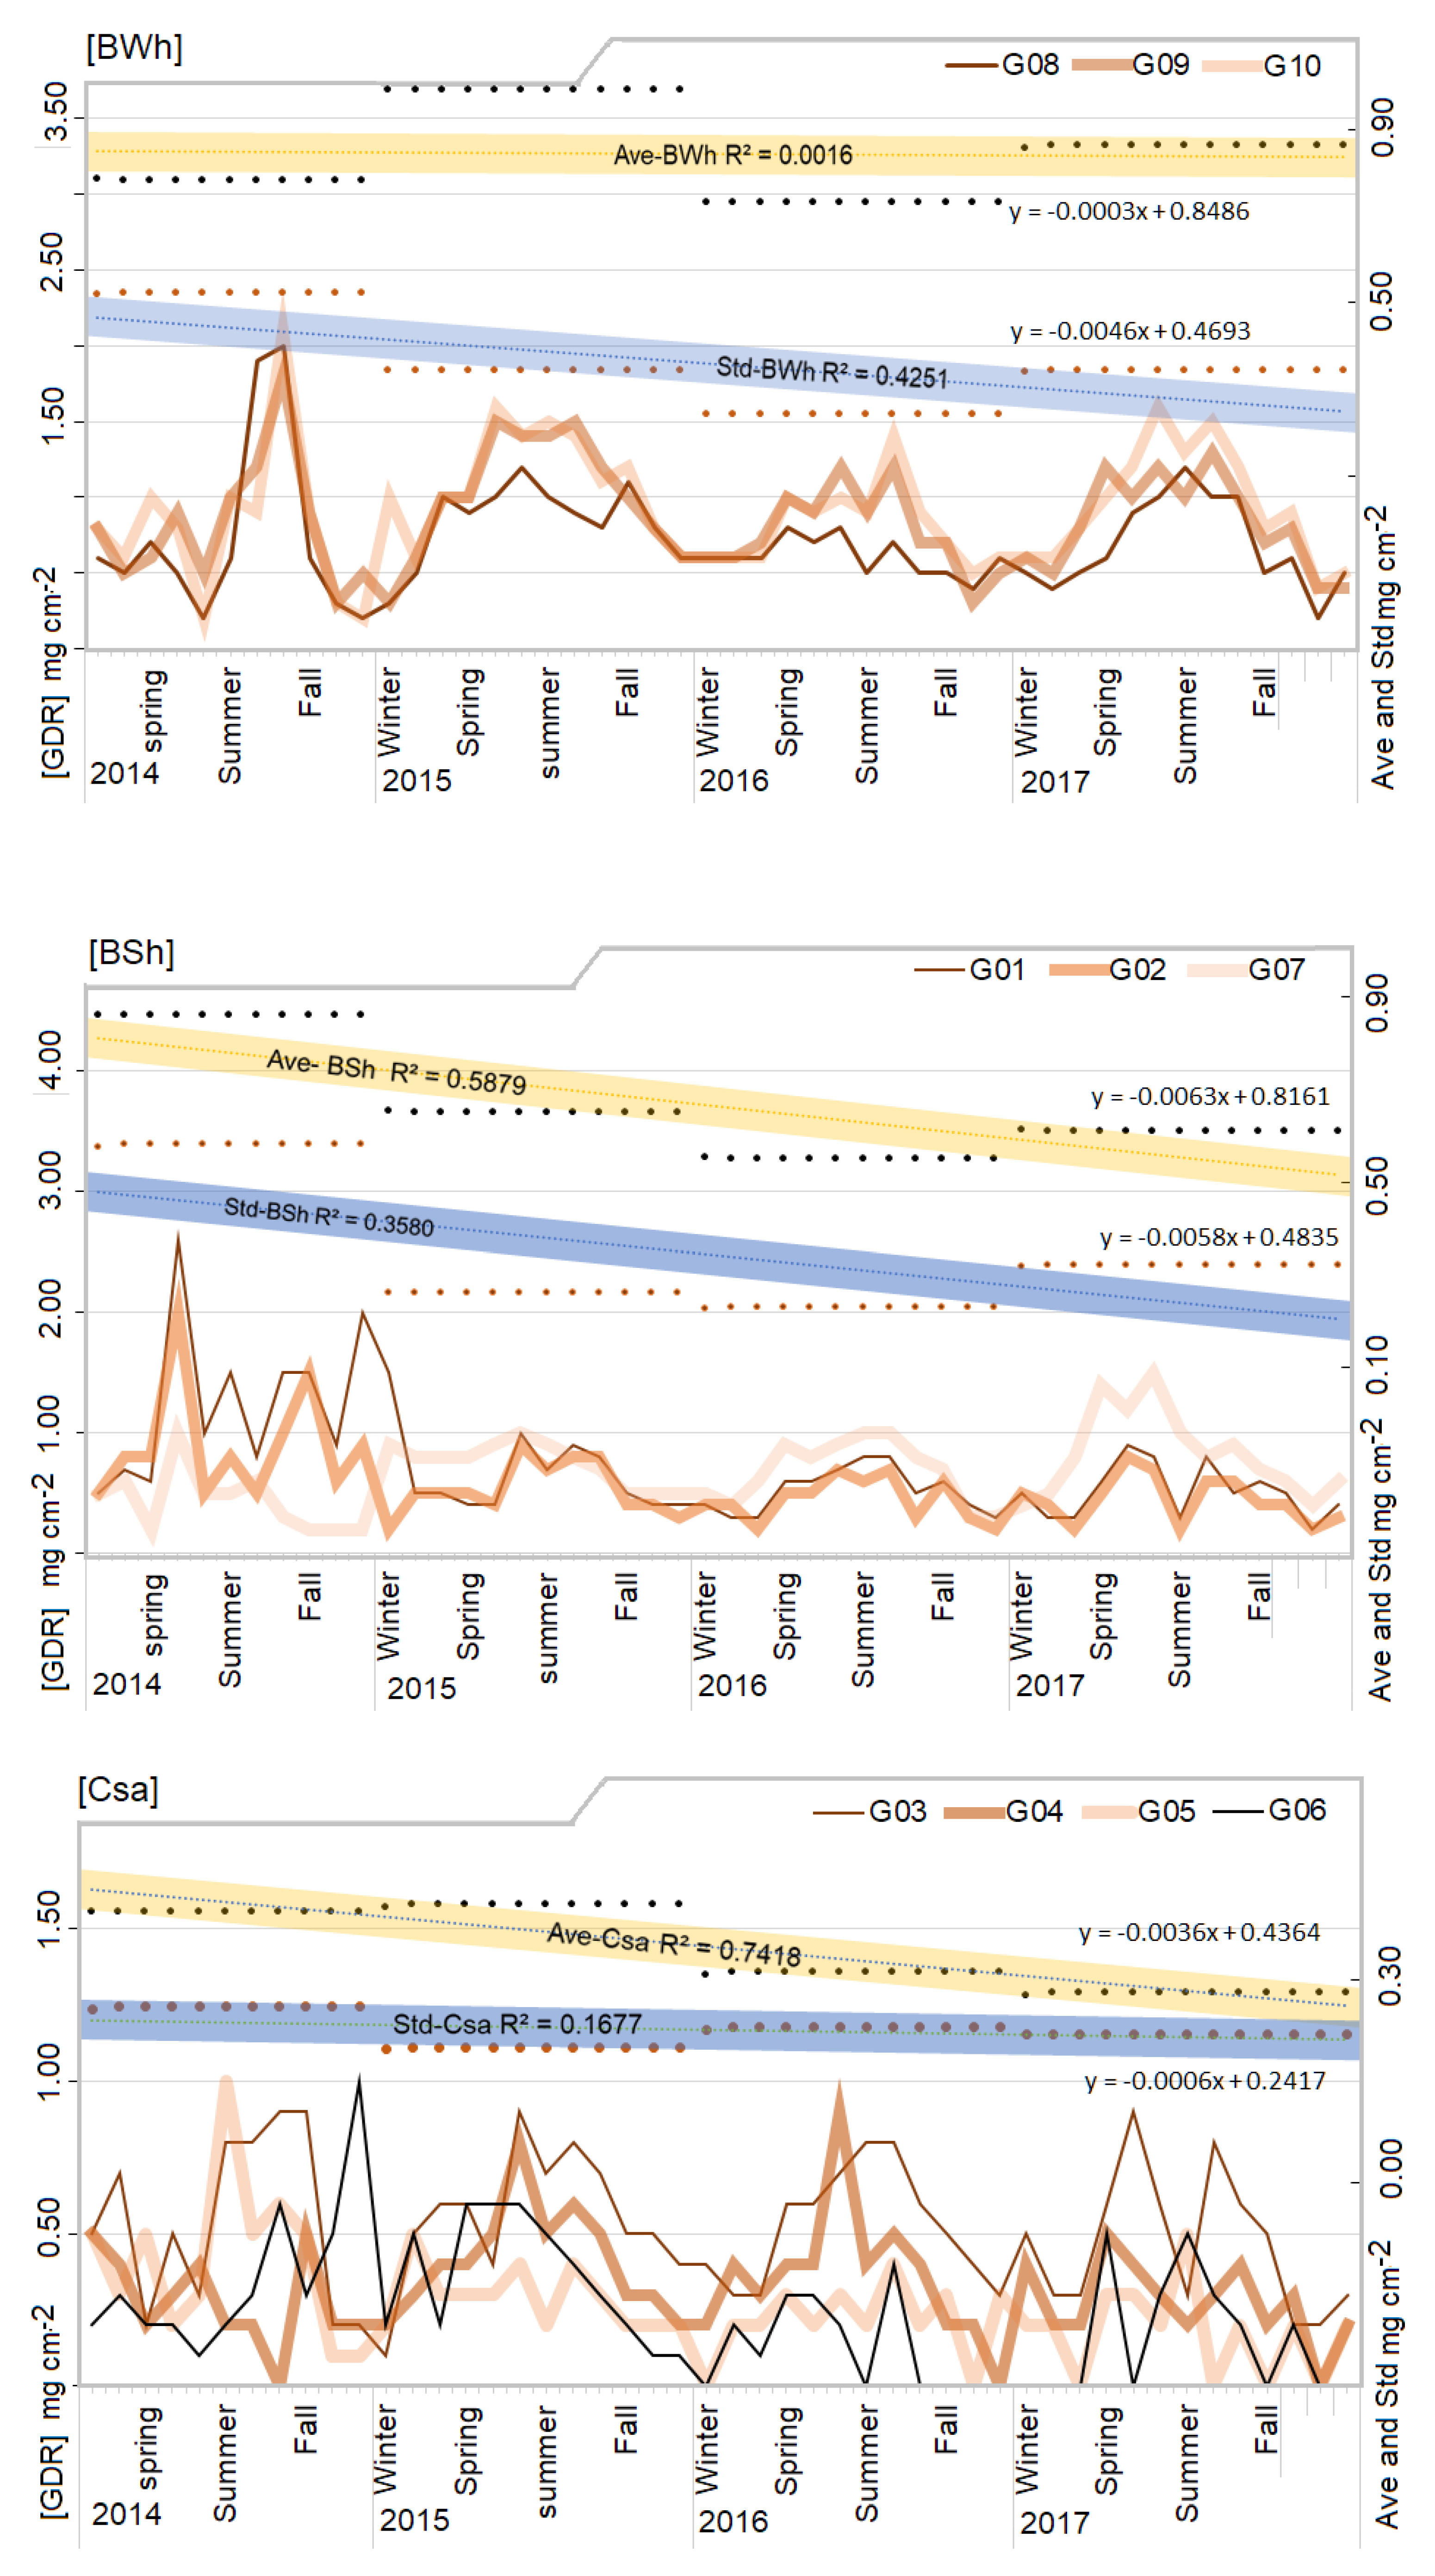
3.2. Ground Dust Deposition Rate

The GDR was determined for each station used for meteorological measurements during the same study period. The temporal variability of the GDR is shown in Figure 8. The average dust deposition rates were 0.35 mg cm−2 month−1, 0.64 mg cm−2 month−1, and 0.86 mg cm−2 month−1 for the Csa, BSh, and BWh climate zones, respectively, during the period 2014–2017. Further, the Csa, BSh, and BWh zones had dispersion values of 0.23 mg cm−2 month−1, 0.34 mg cm−2 month−1, and 0.36 mg cm−2 month−1, respectively.

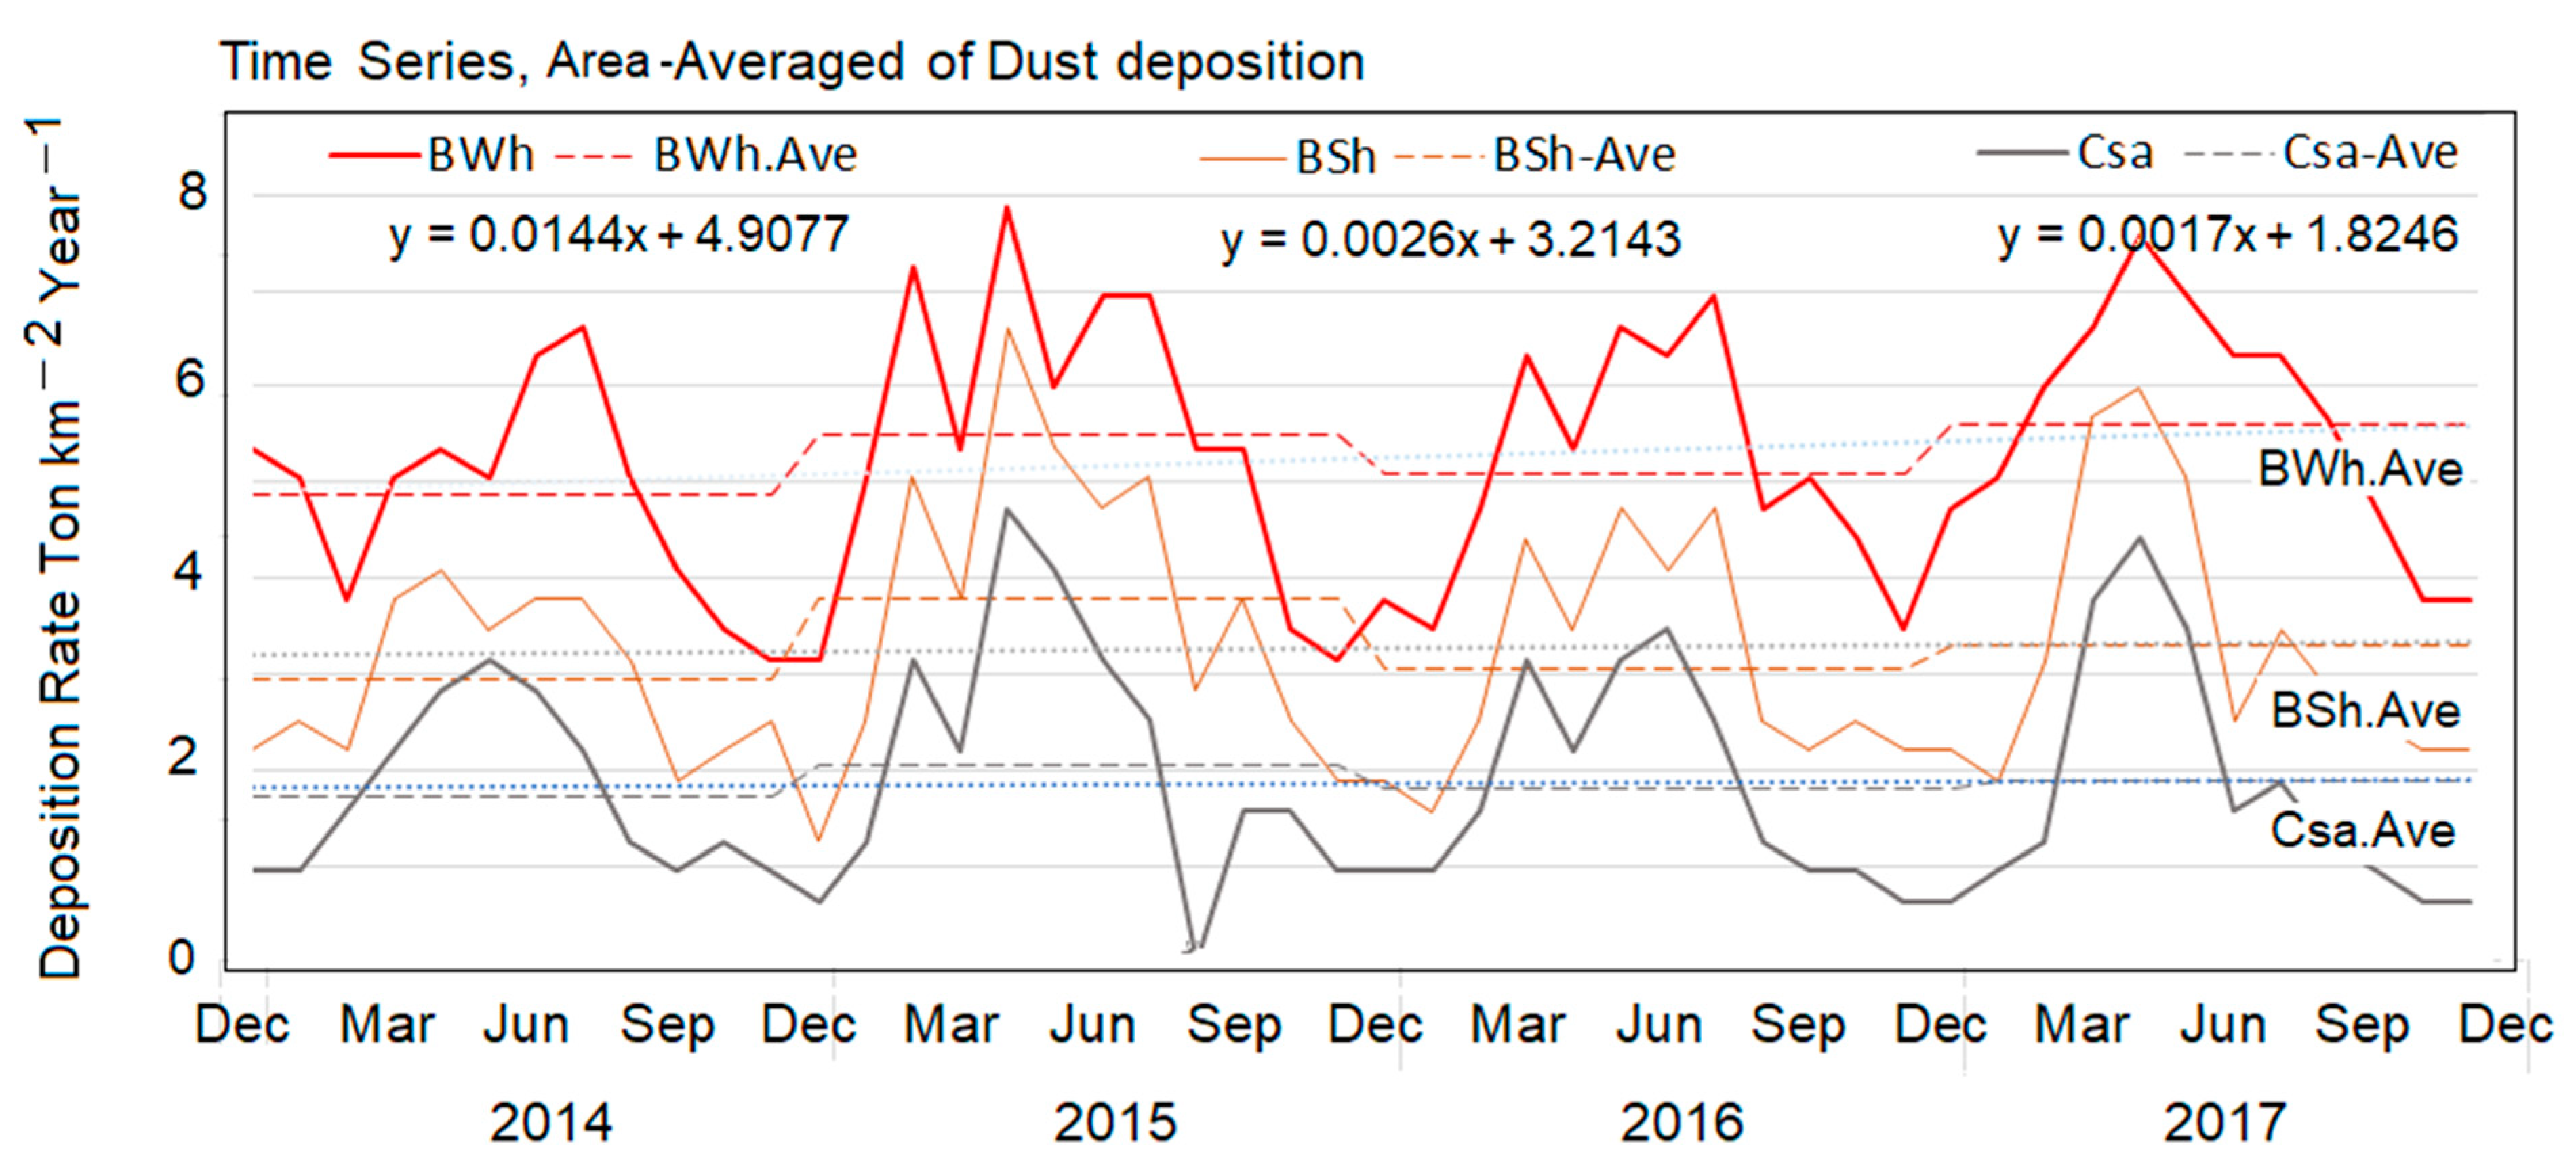
3.3. MERRA-II Deposition Rate

The MERRA-II model application data were downloaded and prepared according to the study area’s coordinate system in order to determine the time series of the monthly deposition rate against seasonal variation. Figure 9 shows the monthly and annual average deposition rates. The maximum deposition rates occurred during the spring and summer, whereas the lowest values were observed in the fall and winter. In particular, the average dust deposition rate in BWh fluctuated between 4.86 t km−2 year−1 and 5.61 t km−2 year−1, while in the steppe hot climate (BSh), the year-to-year deposition rate varied on average from 2.96 t km−2 year−1 to 3.78 t km−2 year−1. The temperate hot summer zone (Csa) was characterized by an average deposition rate of less than 2.05 t km−2 year−1, or less than 50% that of the hot desert zone. An important feature of the seasonal variation patterns for each climate zone is that their trends have the same seasonality, but at different deposition rate levels.
The recorded trends of the GDR and MERRA II-output agree well with the seasonal dust distribution. Both datasets show the same summer maximum deposition rate factor, which is consistent with the climate pattern variation. Therefore, climate variability is closely related to deposition rate [10,11] and strongly governed by meteorological factors, e.g., [9,63]. Moreover, large-scale precipitation over land during cold seasons (fall and winter) resulted in lower deposition rates.

4. Discussion

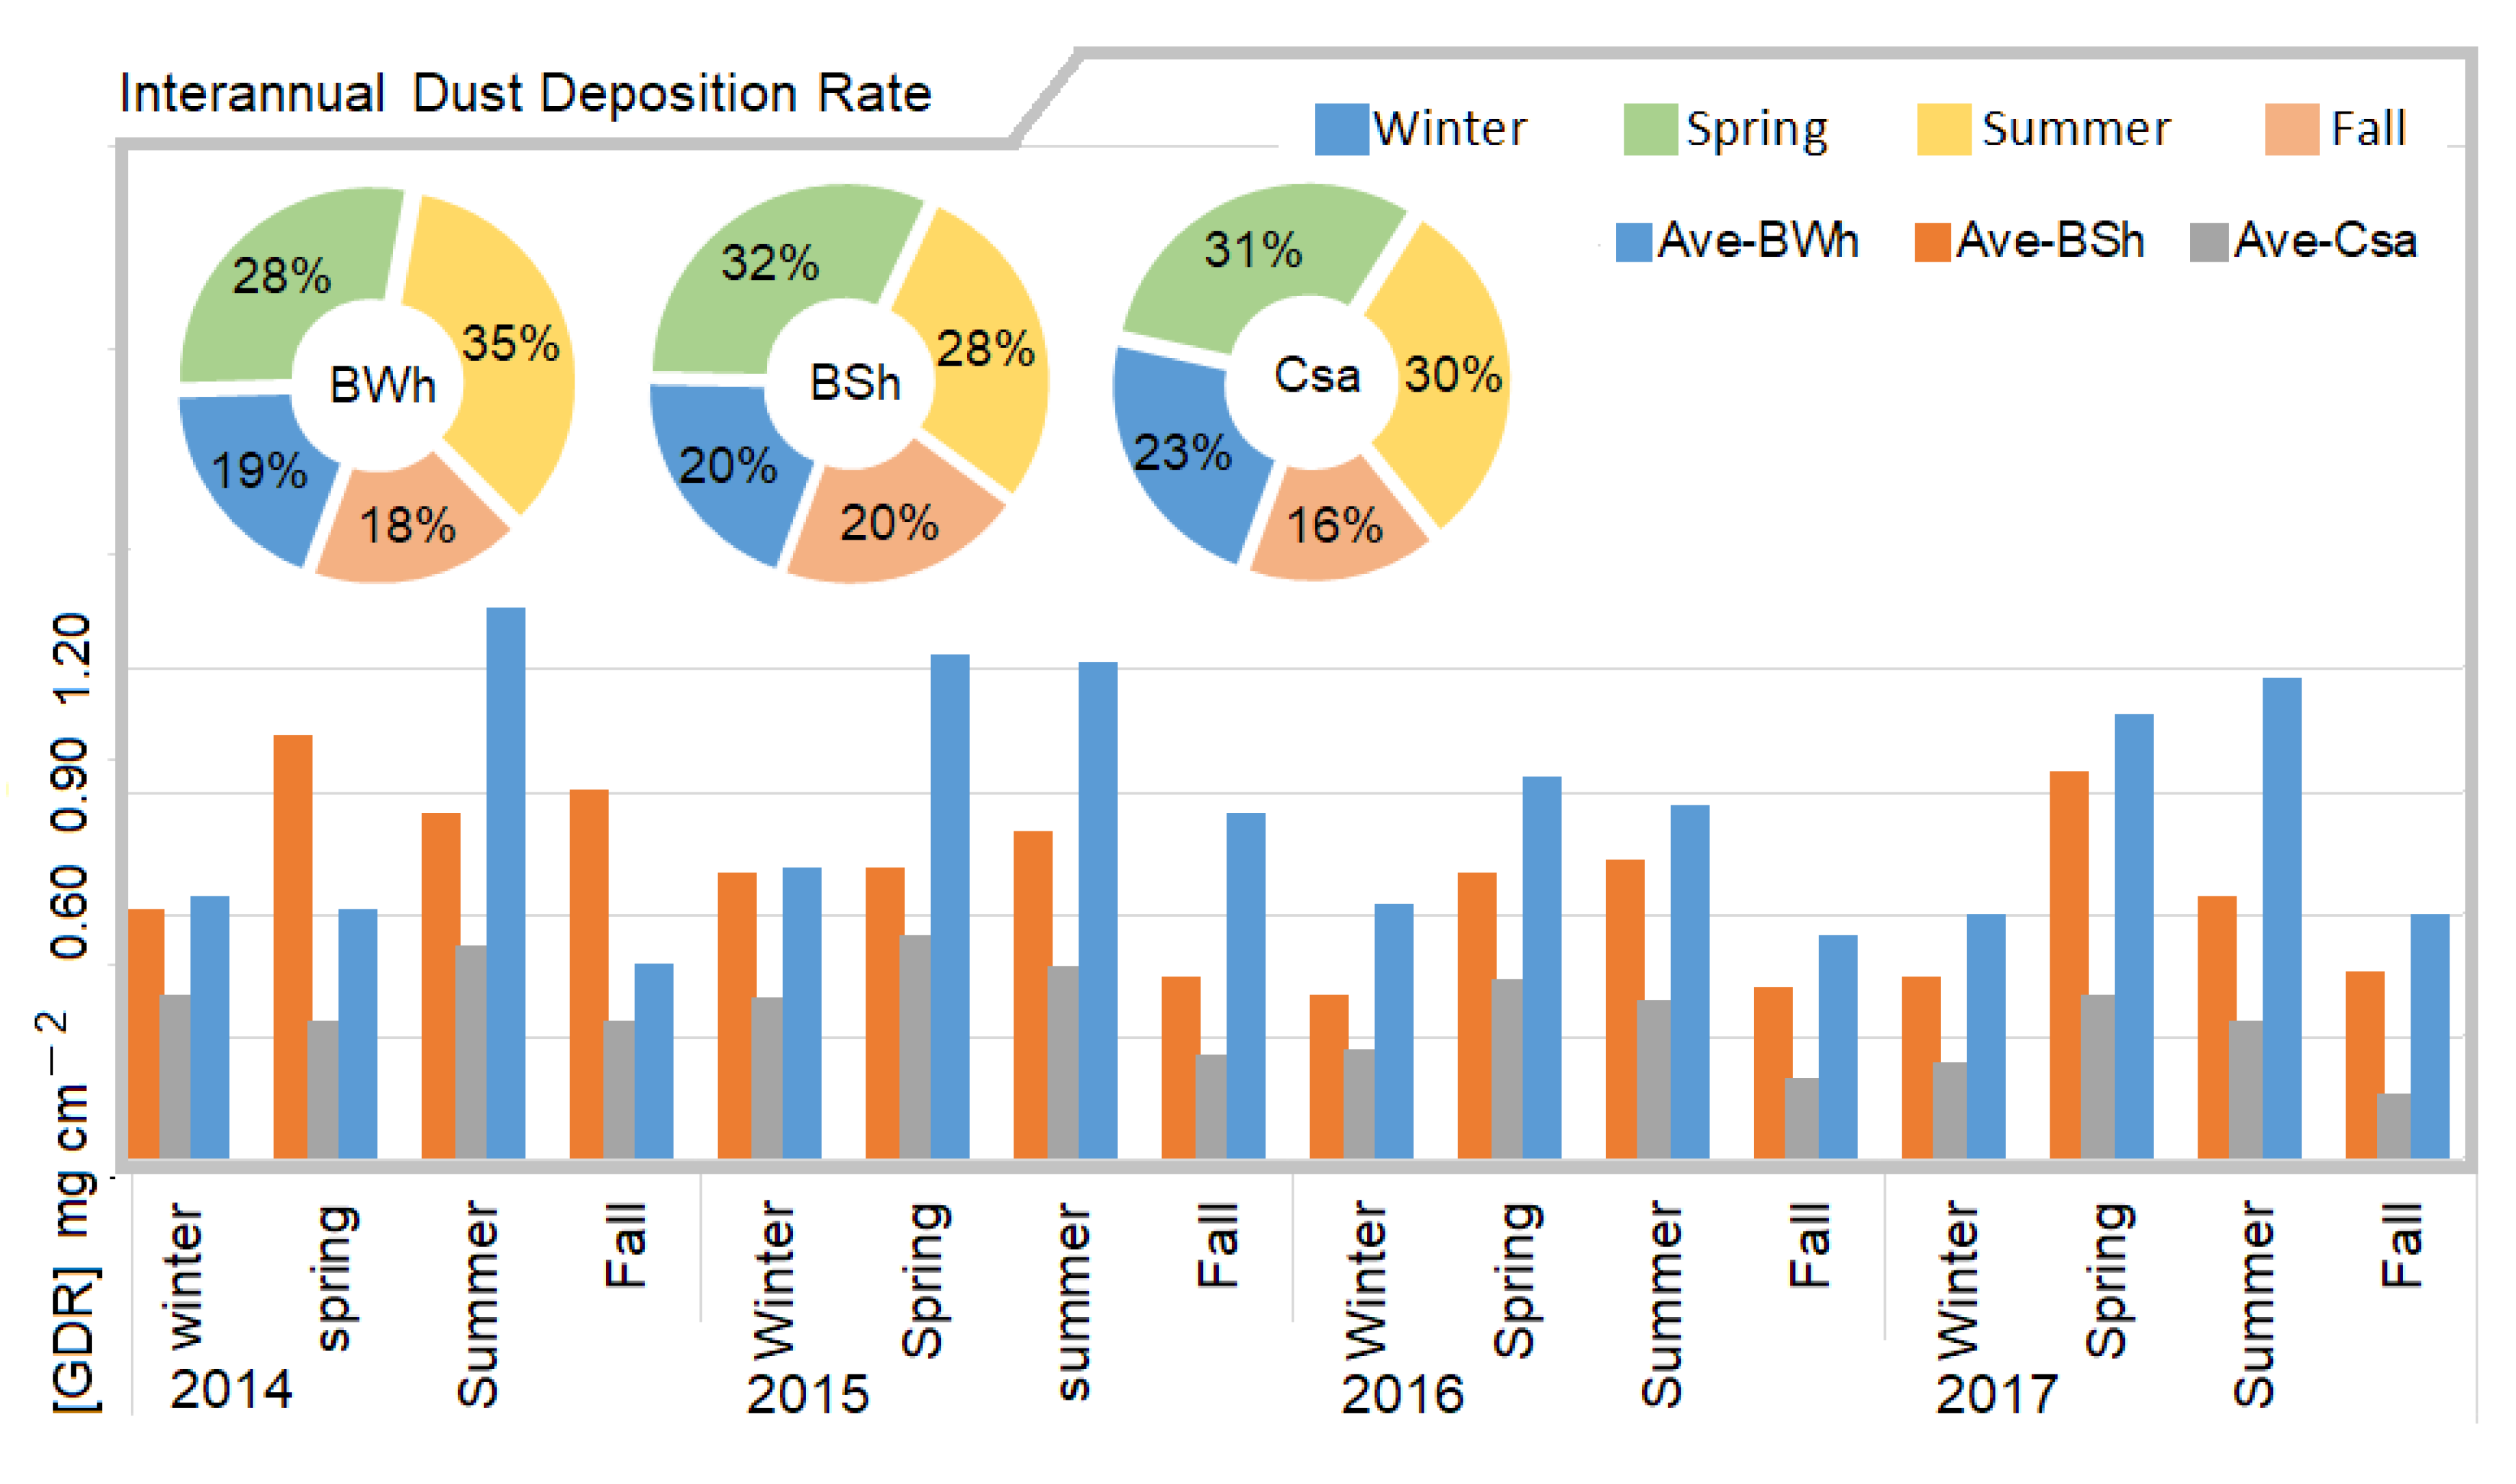
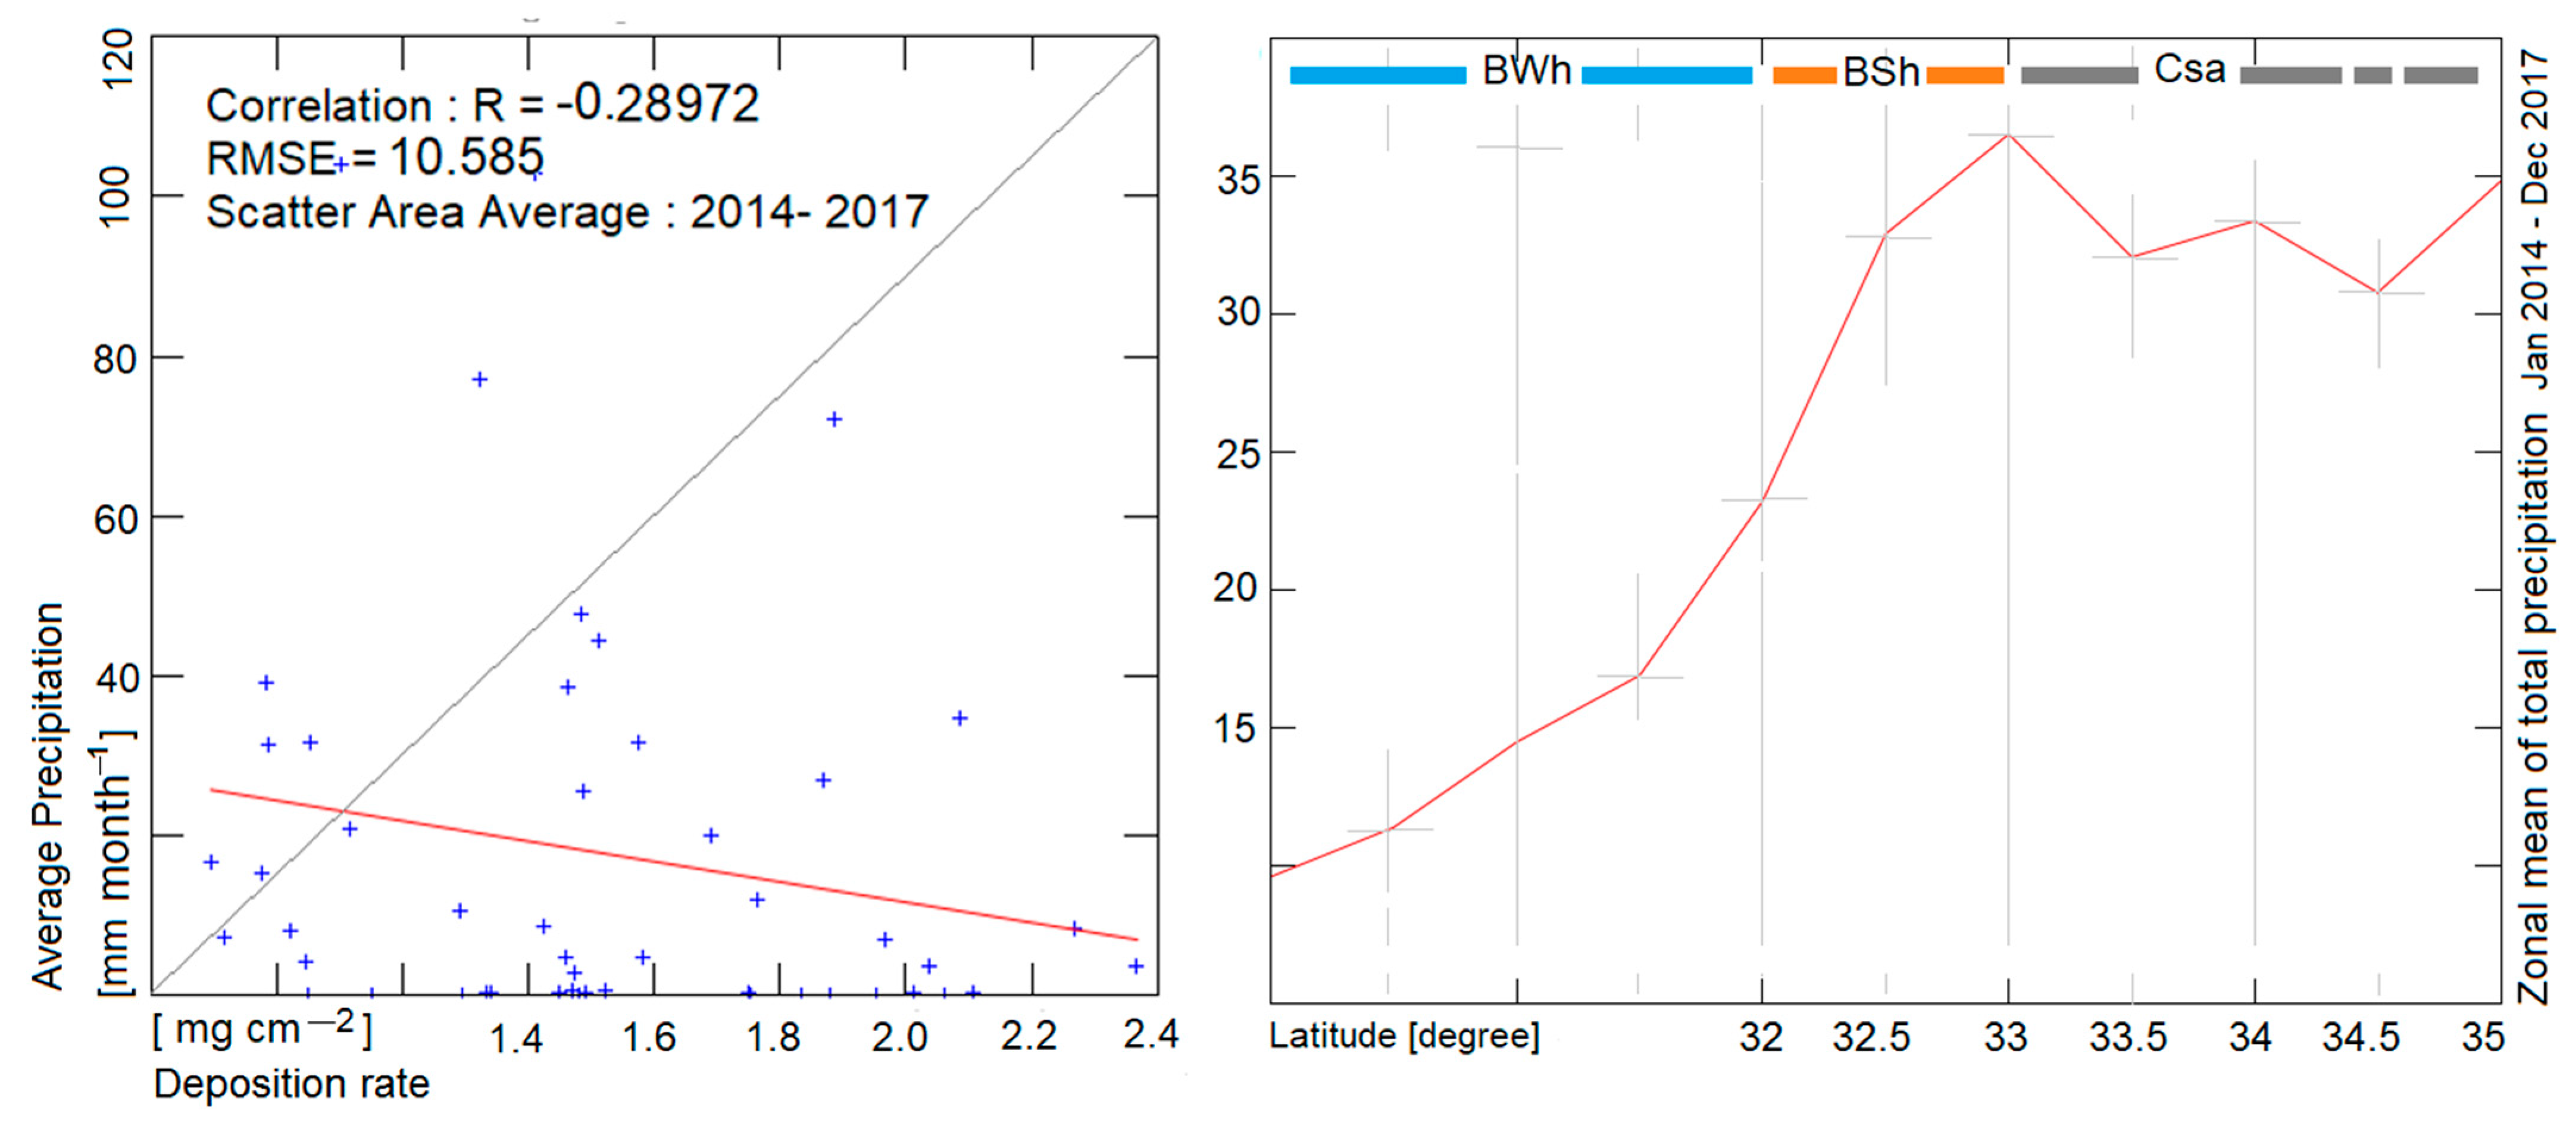
4.1. Mapping Seasonal GDR and Role of Climate

As shown in Figure 10, during the summer, the maximum percentages of the accumulated deposition rates were 35%, 28%, and 30% of the annual deposition rate in the BWh, BSh, and Csa, respectively. Further, in the spring, peak monthly dust deposition rates were 28%, 32%, and 31% in the BWh, BSh, and Csa regions, respectively.
This seasonal contribution rate is in accordance with the findings of previous studies conducted in eastern Iran, western Afghanistan [64,65], and Khuzestan [66]. Ref. [67] also obtained similar results for the Gansu Province and Gobi Desert (China), wherein the highest deposition rates were observed during the spring (32.51%) and the lowest values occurred in the fall. Although the prominent dust deposition rates occurred in the order of spring > summer, the BWh region results did not fit this rule. Rather, its dominant deposition rates occurred in the order of summer > spring for 2014 and 2017.
A study in Shuwaikh city [68] showed a similar pattern of monthly deposition rates in the summer (July and August 2009). Conversely, in western Taiwan [69] and northwestern Spain [70], observations showed unusually high winter deposition rates.

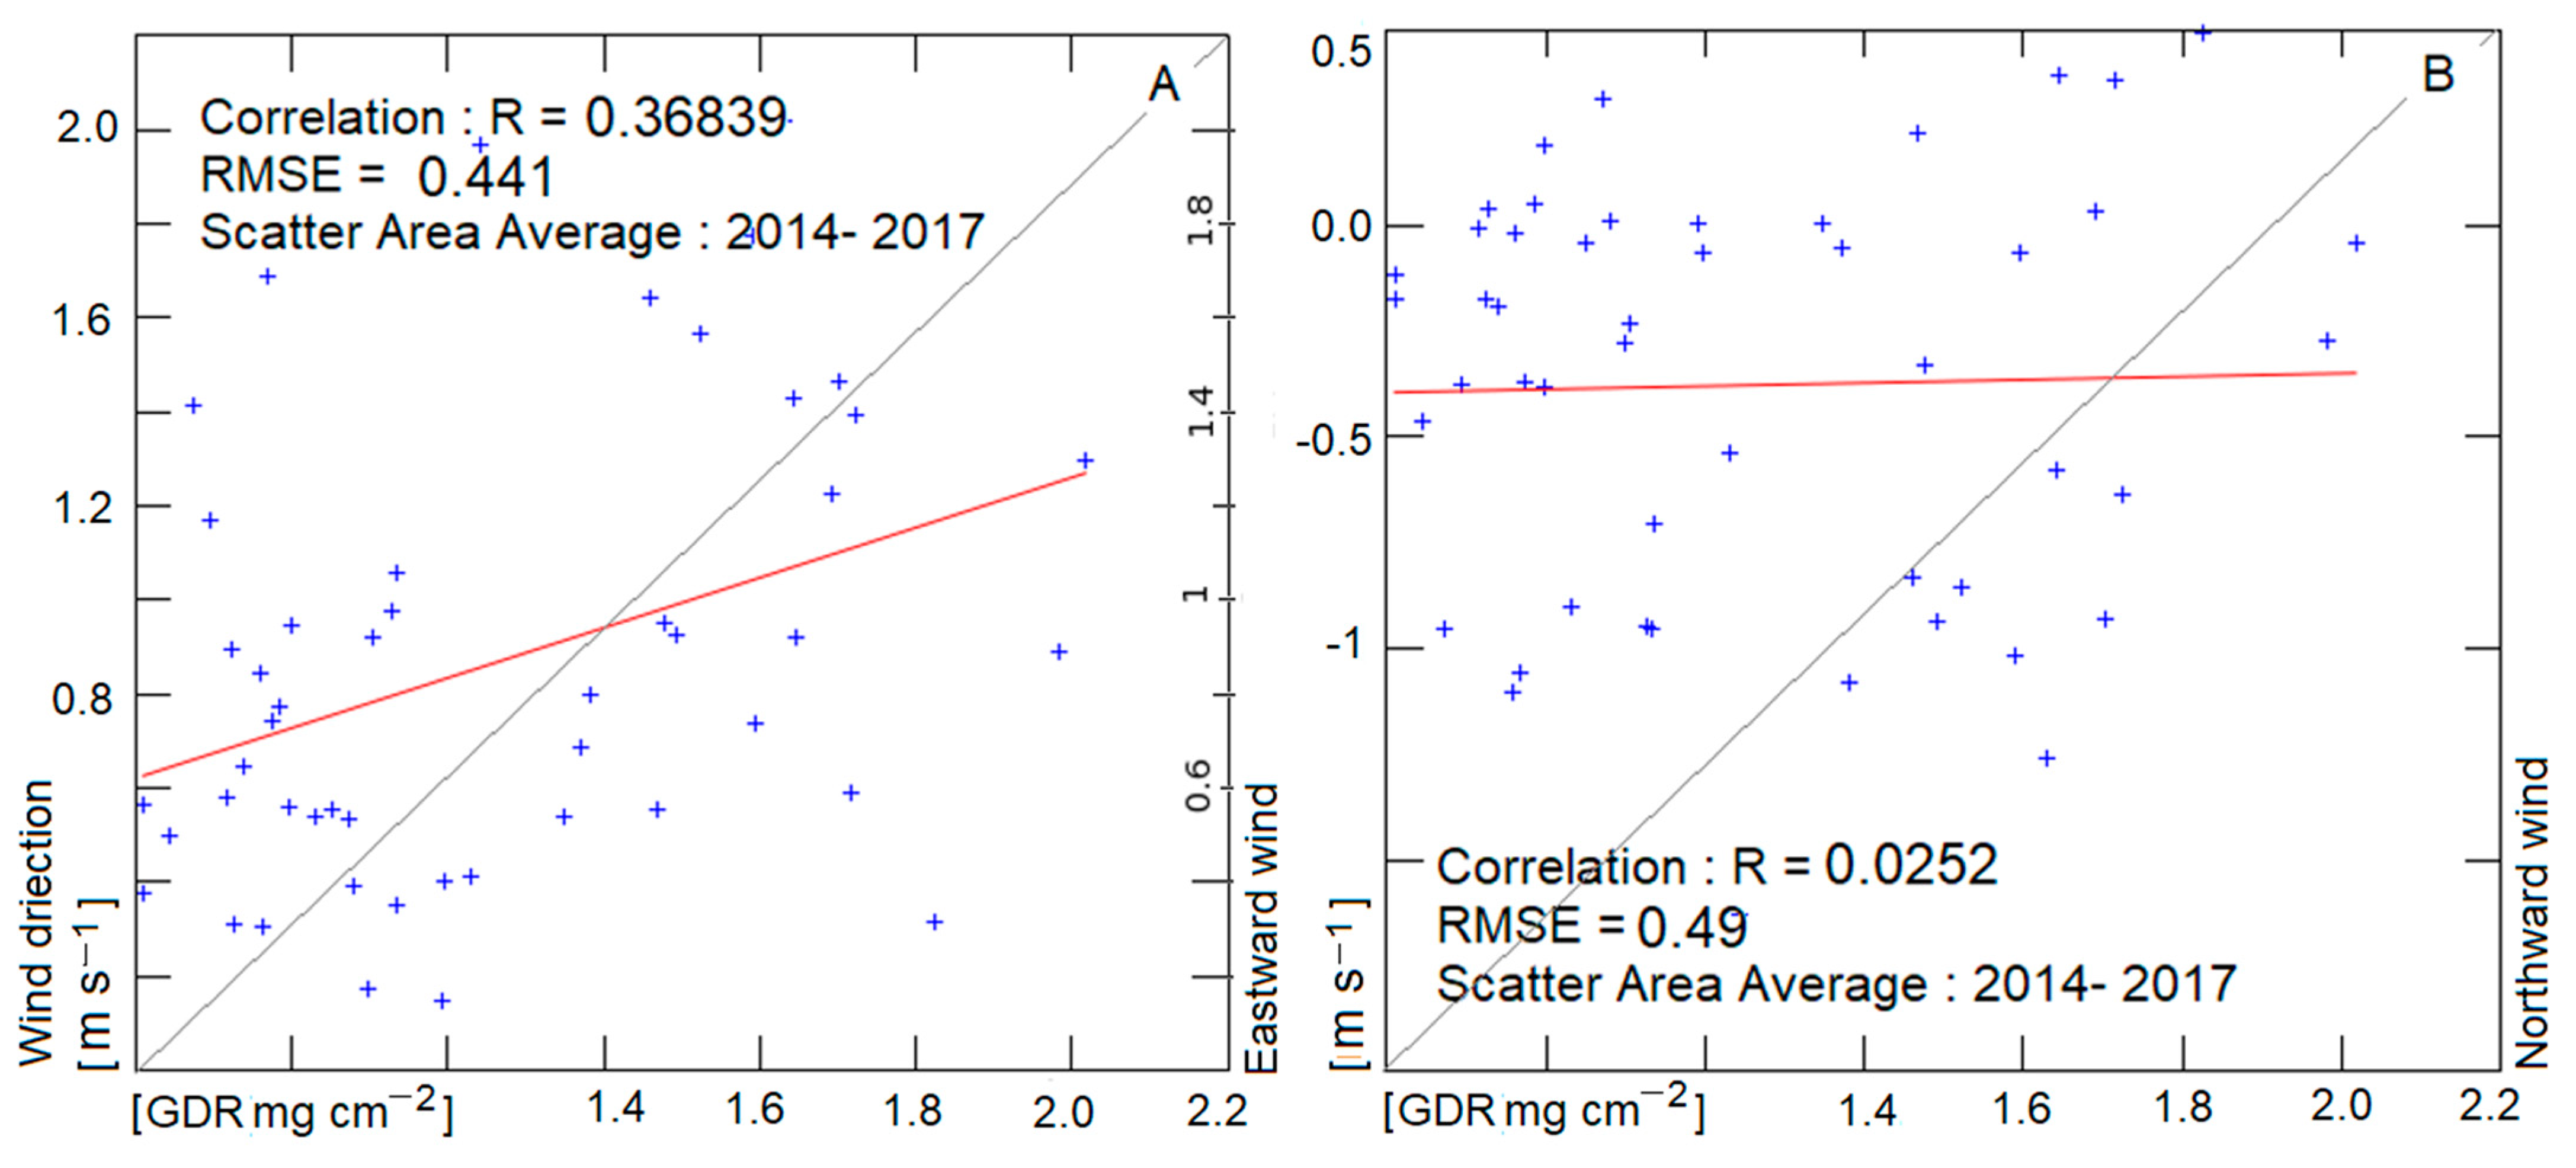
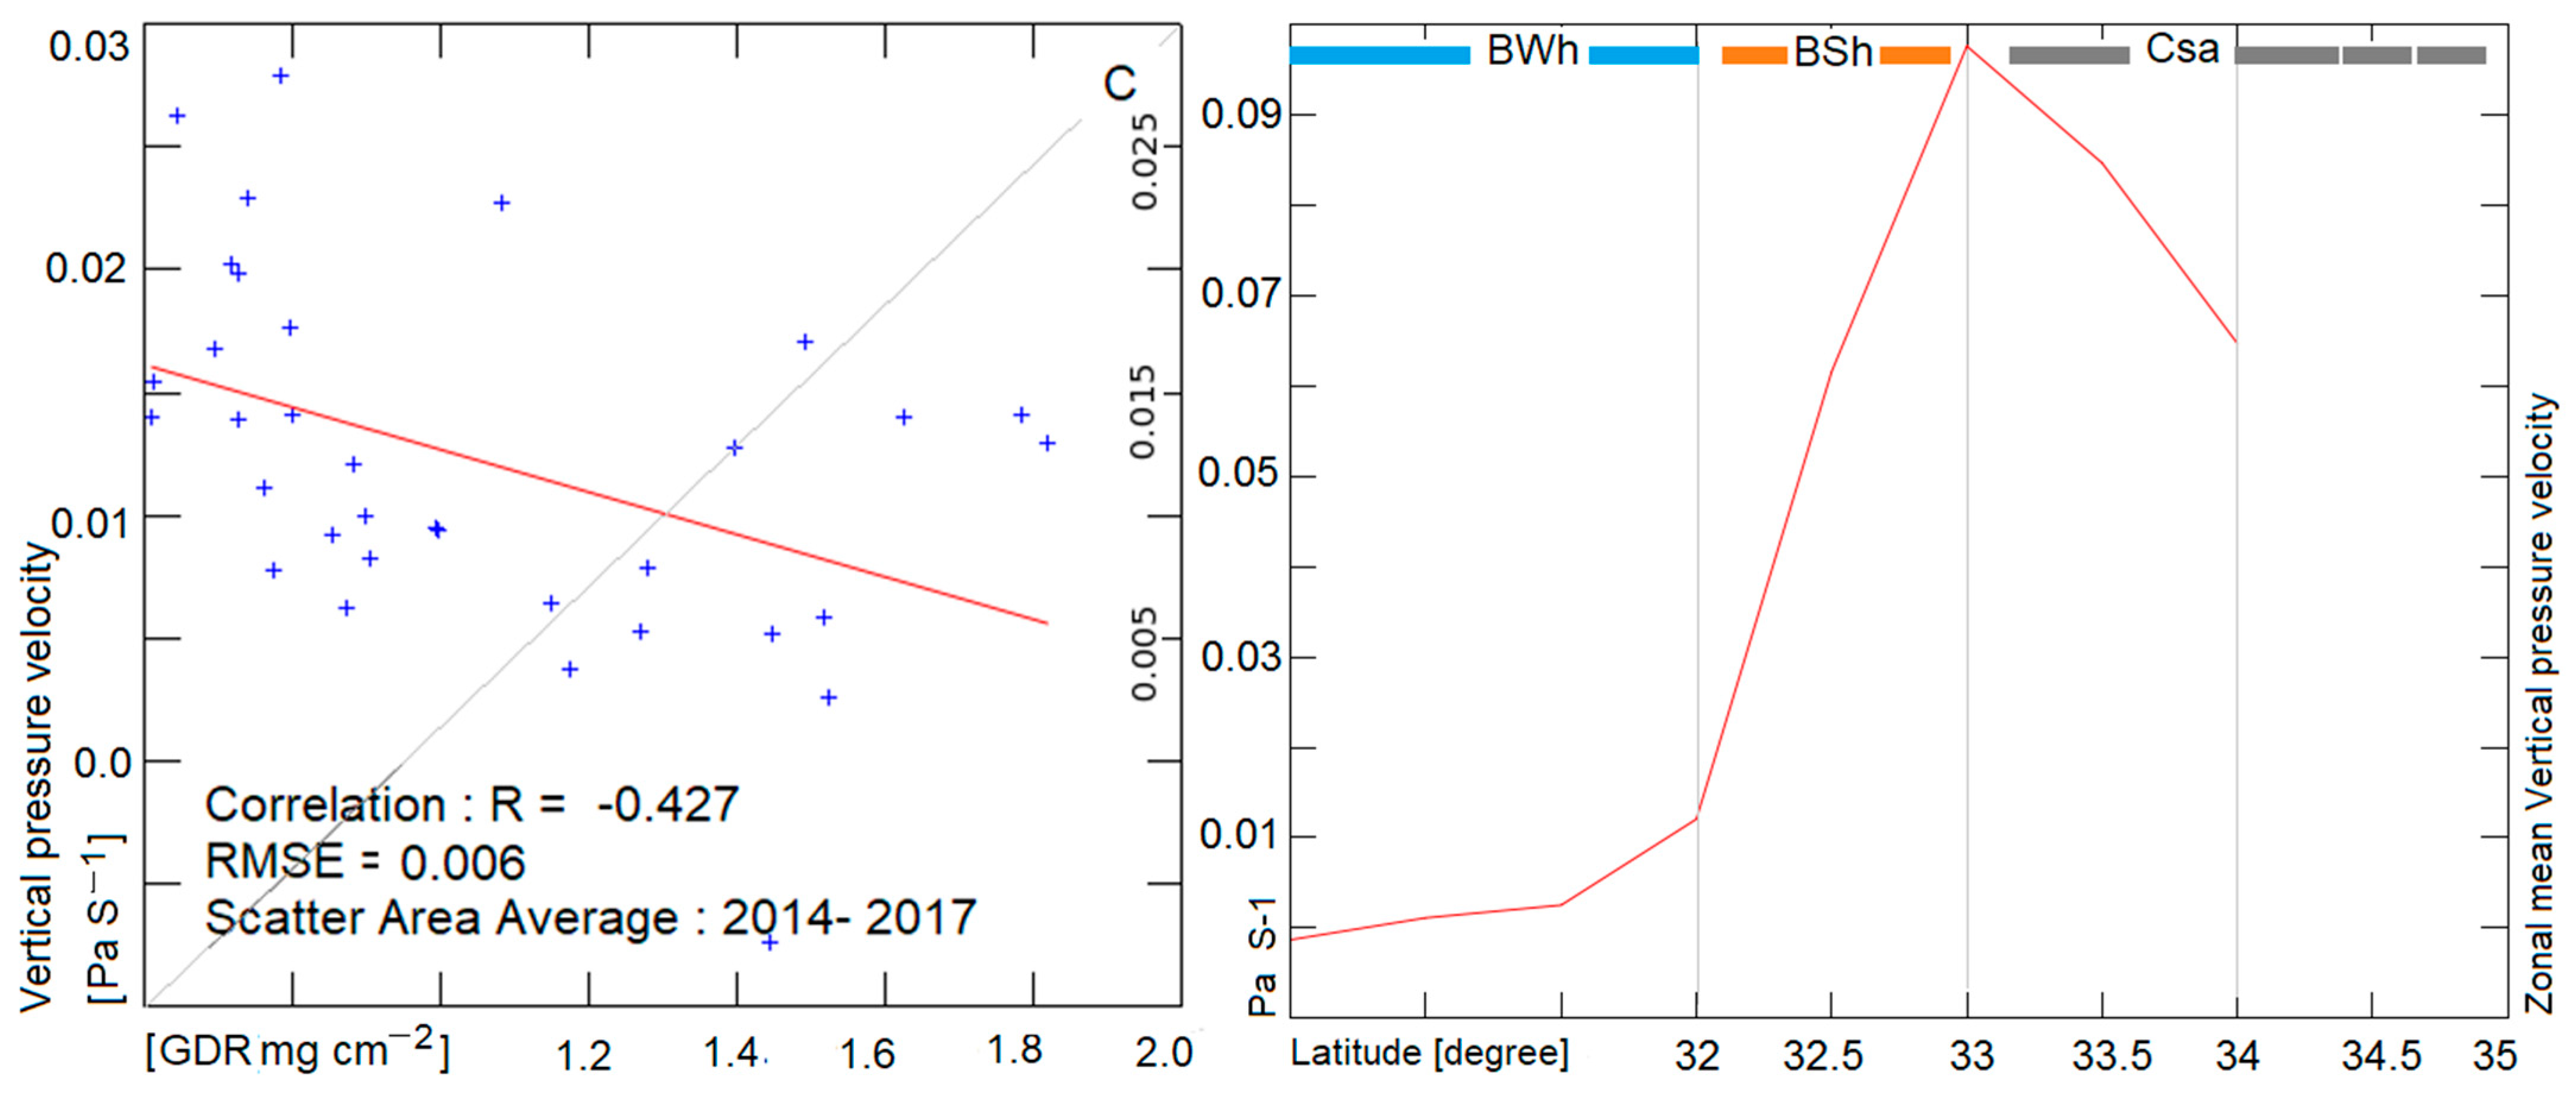
4.2. Typical Climate Terms Versus GDR

During the smpling period, the correlation coefficients obtained between the meteorological parameters, such as wind direction, precipitation, and relative temperature, and the GDRs were determined to be the main issues affecting the GDR, as shown in Figure 11, Figure 12, Figure 13 and Figure 14. Because climates are formed during long-term weather parameters, the influence of these meteorological parameters on the GDR during the study periodwas considered. Ultimately, the correlation values of 62%, −28%, and 36% were provide findings of [71], who showed the major effects of decreasing rainfall on dust deposition rates.
The correlation plot (Figure 11) shows that positive and statistically significant correlations were detected between deposition rate and temperature. The discrimination of the relative variation in the GDR of eolian dust was further evident in the observed trends of the maximum and minimum temperatures and precipitation over the zonal surface. The correlation coefficient and relative Root Mean Square Error (RMSE) between the dust deposition and maximum temperatures were 62% and 9.48, respectively. Despite the variation in regional temperature, statistically significant positive trends were identified. Similar results were published by [6], who found that the dust deposition rate was considerably correlated (53%) with the average monthly air temperature. Furthermore, the results presented herein are in accordance with the results of [72], who found that a rise in the study area temperature region is associated with decreasing precipitation. This observation was expected, as the BWh and Csa regions have less evaporative cooling because of their lengthy sunshine duration. As illustrated in Figure 12, a statistically significant negative correlation exists between the monthly deposition rate and monthly precipitation (R = −0.28%, p < 0.01), which occurred because the dry deposition rate was minimized during the same period as precipitation [73]. This phenomenon may relate to the dry and wet deposition rates when returning to the surface via rain or gravity.
The correlation analysis suggests that a strong negative correlation exists between the deposition rate and precipitation over the climate zones, with a correlation coefficient of −0.28 and an RMSE of 10.58. In general, higher precipitation is correlated with lower deposition values, and vice versa. Thus, this relationship is logical as the BWh region is associated with less precipitation than the Csa and BSh regions. The mean annual precipitation varied by more than 420 mm in high-altitude (45.90° E 33.00° N) regions to less than 120 mm in arid regions (47.60° E 29.97° N). These results show that the lowest dust deposition rates occurred during the fall and winter, while the highest occurred in the spring and summer. This is consistent with the recent contribution of [74], who stated that precipitation could extract particles from the air. These findings are also consistent with previous studies by [73] and [75], which discuss dry deposition.
Table 4 illustrates the average seasonal deposition rate in the three climate regions as related to the wind velocity. The results can be interpreted as follows: 1. BWh corresponds to eastward wind speeds (≤3.0 m s−1), with maximum deposition rates of 34.5 t km−2 and 6.2 t km−2, as determined by the GDR and model output, respectively. 2. The BSh zone is related to westward wind speeds of ≤2.5 m s−1, and has average deposition rates of 24.9 t km−2 and 3.3 t km−2, as observed via GDR and the model output, respectively. 3. Finally, the Csa climate zone corresponds to eastward and westward wind speeds of ≤3.4 m s−1, which are characterized by a lower dust portion than that of the BWh and BSh winds. Thus, the wind velocity correlated well with the observed seasonal deposition rates. Although wind speed and direction may play important roles in replenishing dust particles and positively influencing atmospheric concentration, settling dust particles by gravity do not require wind.
The soil entrainment thresholds for different soil texture classifications have been determined [76,77], and reviewed by [78]. However, [76] classified wind velocities to determine the terms in which the particles would be set in motion. Conversely, [78] evaluated the threshold wind velocity dynamics to identify the characteristics of threshold dynamics relative to sediment transportation. Thus, the threshold velocity can vary widely, both spatially and temporally, because the soil and aerodynamic properties of the surface vary [79].
Previously, dust intensity has been calculated using a combination of visibility and wind speed [80]. Ref. [67] suggested that the total suspended particles (TSP) concentration increased with increasing wind speed. Meanwhile, a study on Northeast Asian Dust found that wind velocities of 5 m s−1 to 10 m s−1 impacted the TSP (<500 µg m−3) and decreased visibility to 2000 m [81].
The results presented herein are consistent with those of [80], revealing that significant deposition occurs as a result of gravity when the wind speed is weak (Figure 13).
In addition to the horizontal components of the local vector wind velocities, the vertical wind and pressure velocities were measured and compared [82]. Moving from the earth’s surface produced a vertical velocity with units of length/s that was near positive. In this scenario, the wind velocity variation significantly affects the dust transport process by lifting the particles [83,84] and degrading the air quality [22]. Moreover, the vertical velocity considerably affected the lifting force, which is primarily related to the differential velocities between particles and vertical flow [85].
Thus, as expected, negative and statistically significant correlations were found between the deposition rate and vertical wind pressure velocity (−42%, p < 0.01). Lower values of vertical velocity pressure led to increased particle deposition (Figure 14). In accordance with the correlation plot, the dust-in-suspension and deposition rate events do not require any wind speed. In the BWh region, the vertical pressure velocity was relatively weak, reaching less than 0.01 Pa s−1. Moreover, under the minimum vertical velocity, dust-in-suspension occurs, which is in accordance with previous research findings [86,87].
In this study, the typical weather patterns for each study area relative to the deposition rate were also examined, as summarized in Table 5, wherein the minimum, maximum, average, and standard values of temperature, precipitation, and GDR in the BWh, BSh, and Csa regions are listed for 2014–2017.
Specifically, the correlation between weather patterns and the main climate zone parameter [88] indicated that high temperatures, precipitation, and wind direction are the most influential factors in the classification zone. In the BWh zone, the high dust deposition rates in the spring range from 16 t km−2 to 21 t km−2 with a mean value of 8.4 t km−2 month−1. Meanwhile, the mean deposition rate of the BSh zone was 6.6 t km−2, which is also considerably high. The lowest amount of dust deposition occurred in the Csa zone, at a value of 3.5 t km−2.
Moreover, the climate pattern contributions and the classification of the three zones based on temperature and precipitation were evaluated. On average, the annual minimum precipitation and maximum temperature in the BWh region occurred at latitudes between 30 N and 32 N. Meanwhile, the same average temperature value (55 °C) was observed for the BSh zone, with a monthly precipitation value between 32 N and 33 N of 33.30 mm. In addition, the Csa climate boundary from 33 N to 34.5 N revealed a maximum monthly precipitation of 42 mm and an average temperature of 18.2 °C. These results could be considered to be positive consequences of high deposition rates, as higher quantities were deposited in arid and desert zones [89]. In accordance with [90] and [91], increasing air temperature led to increased evaporation and decreased precipitation, thus drying the surface. Higher temperatures also led to droughts in the subtropical dry zones of warmer climates, e.g., [72,92].

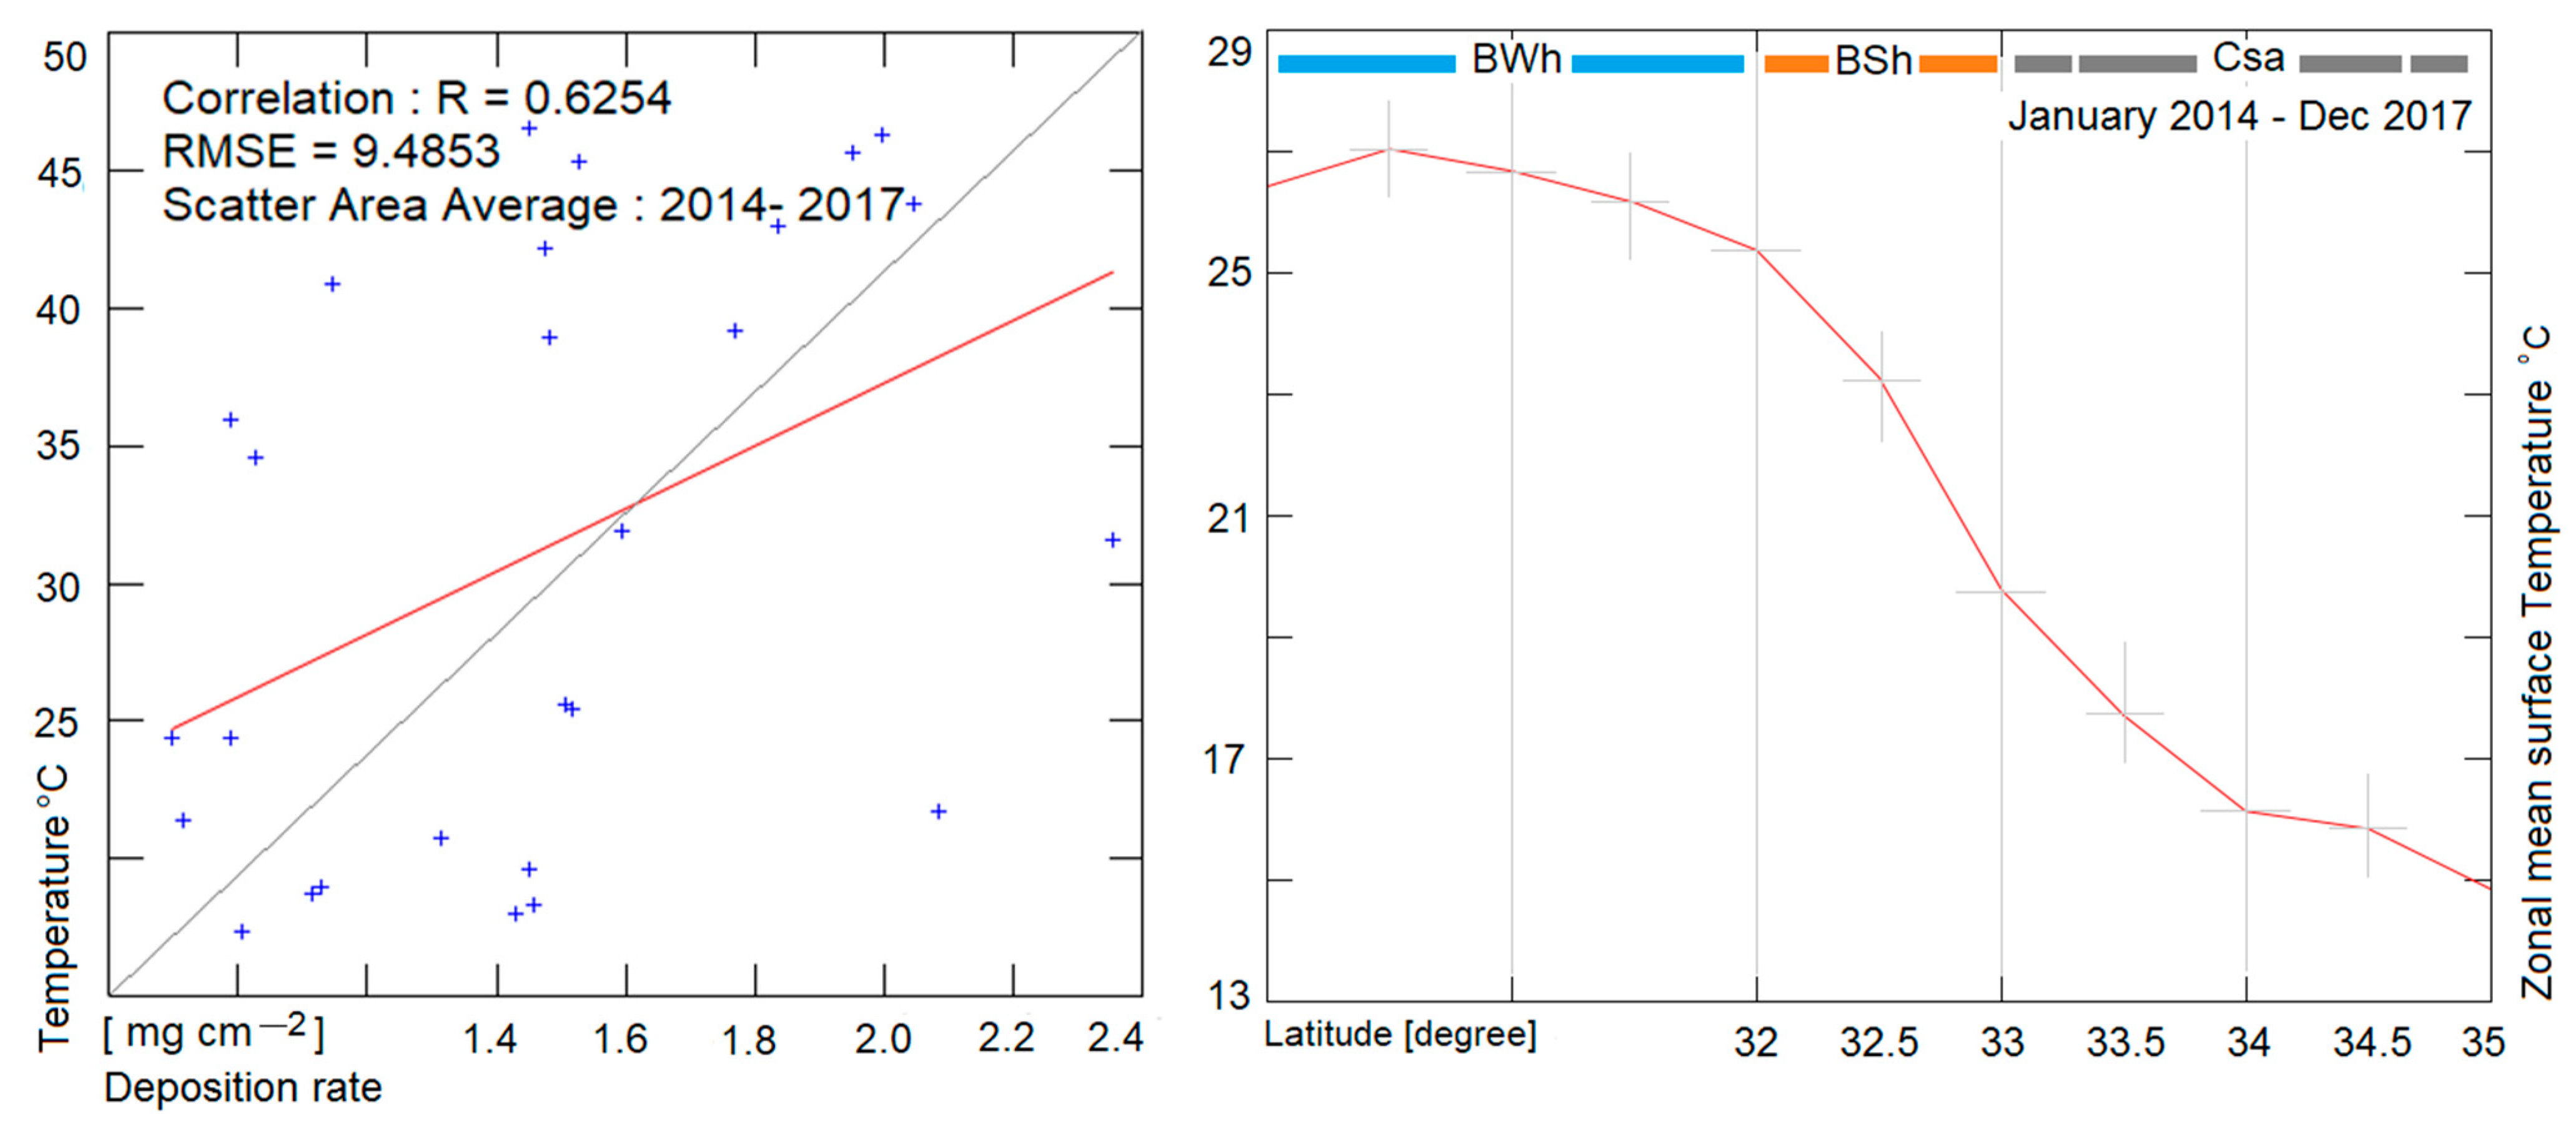
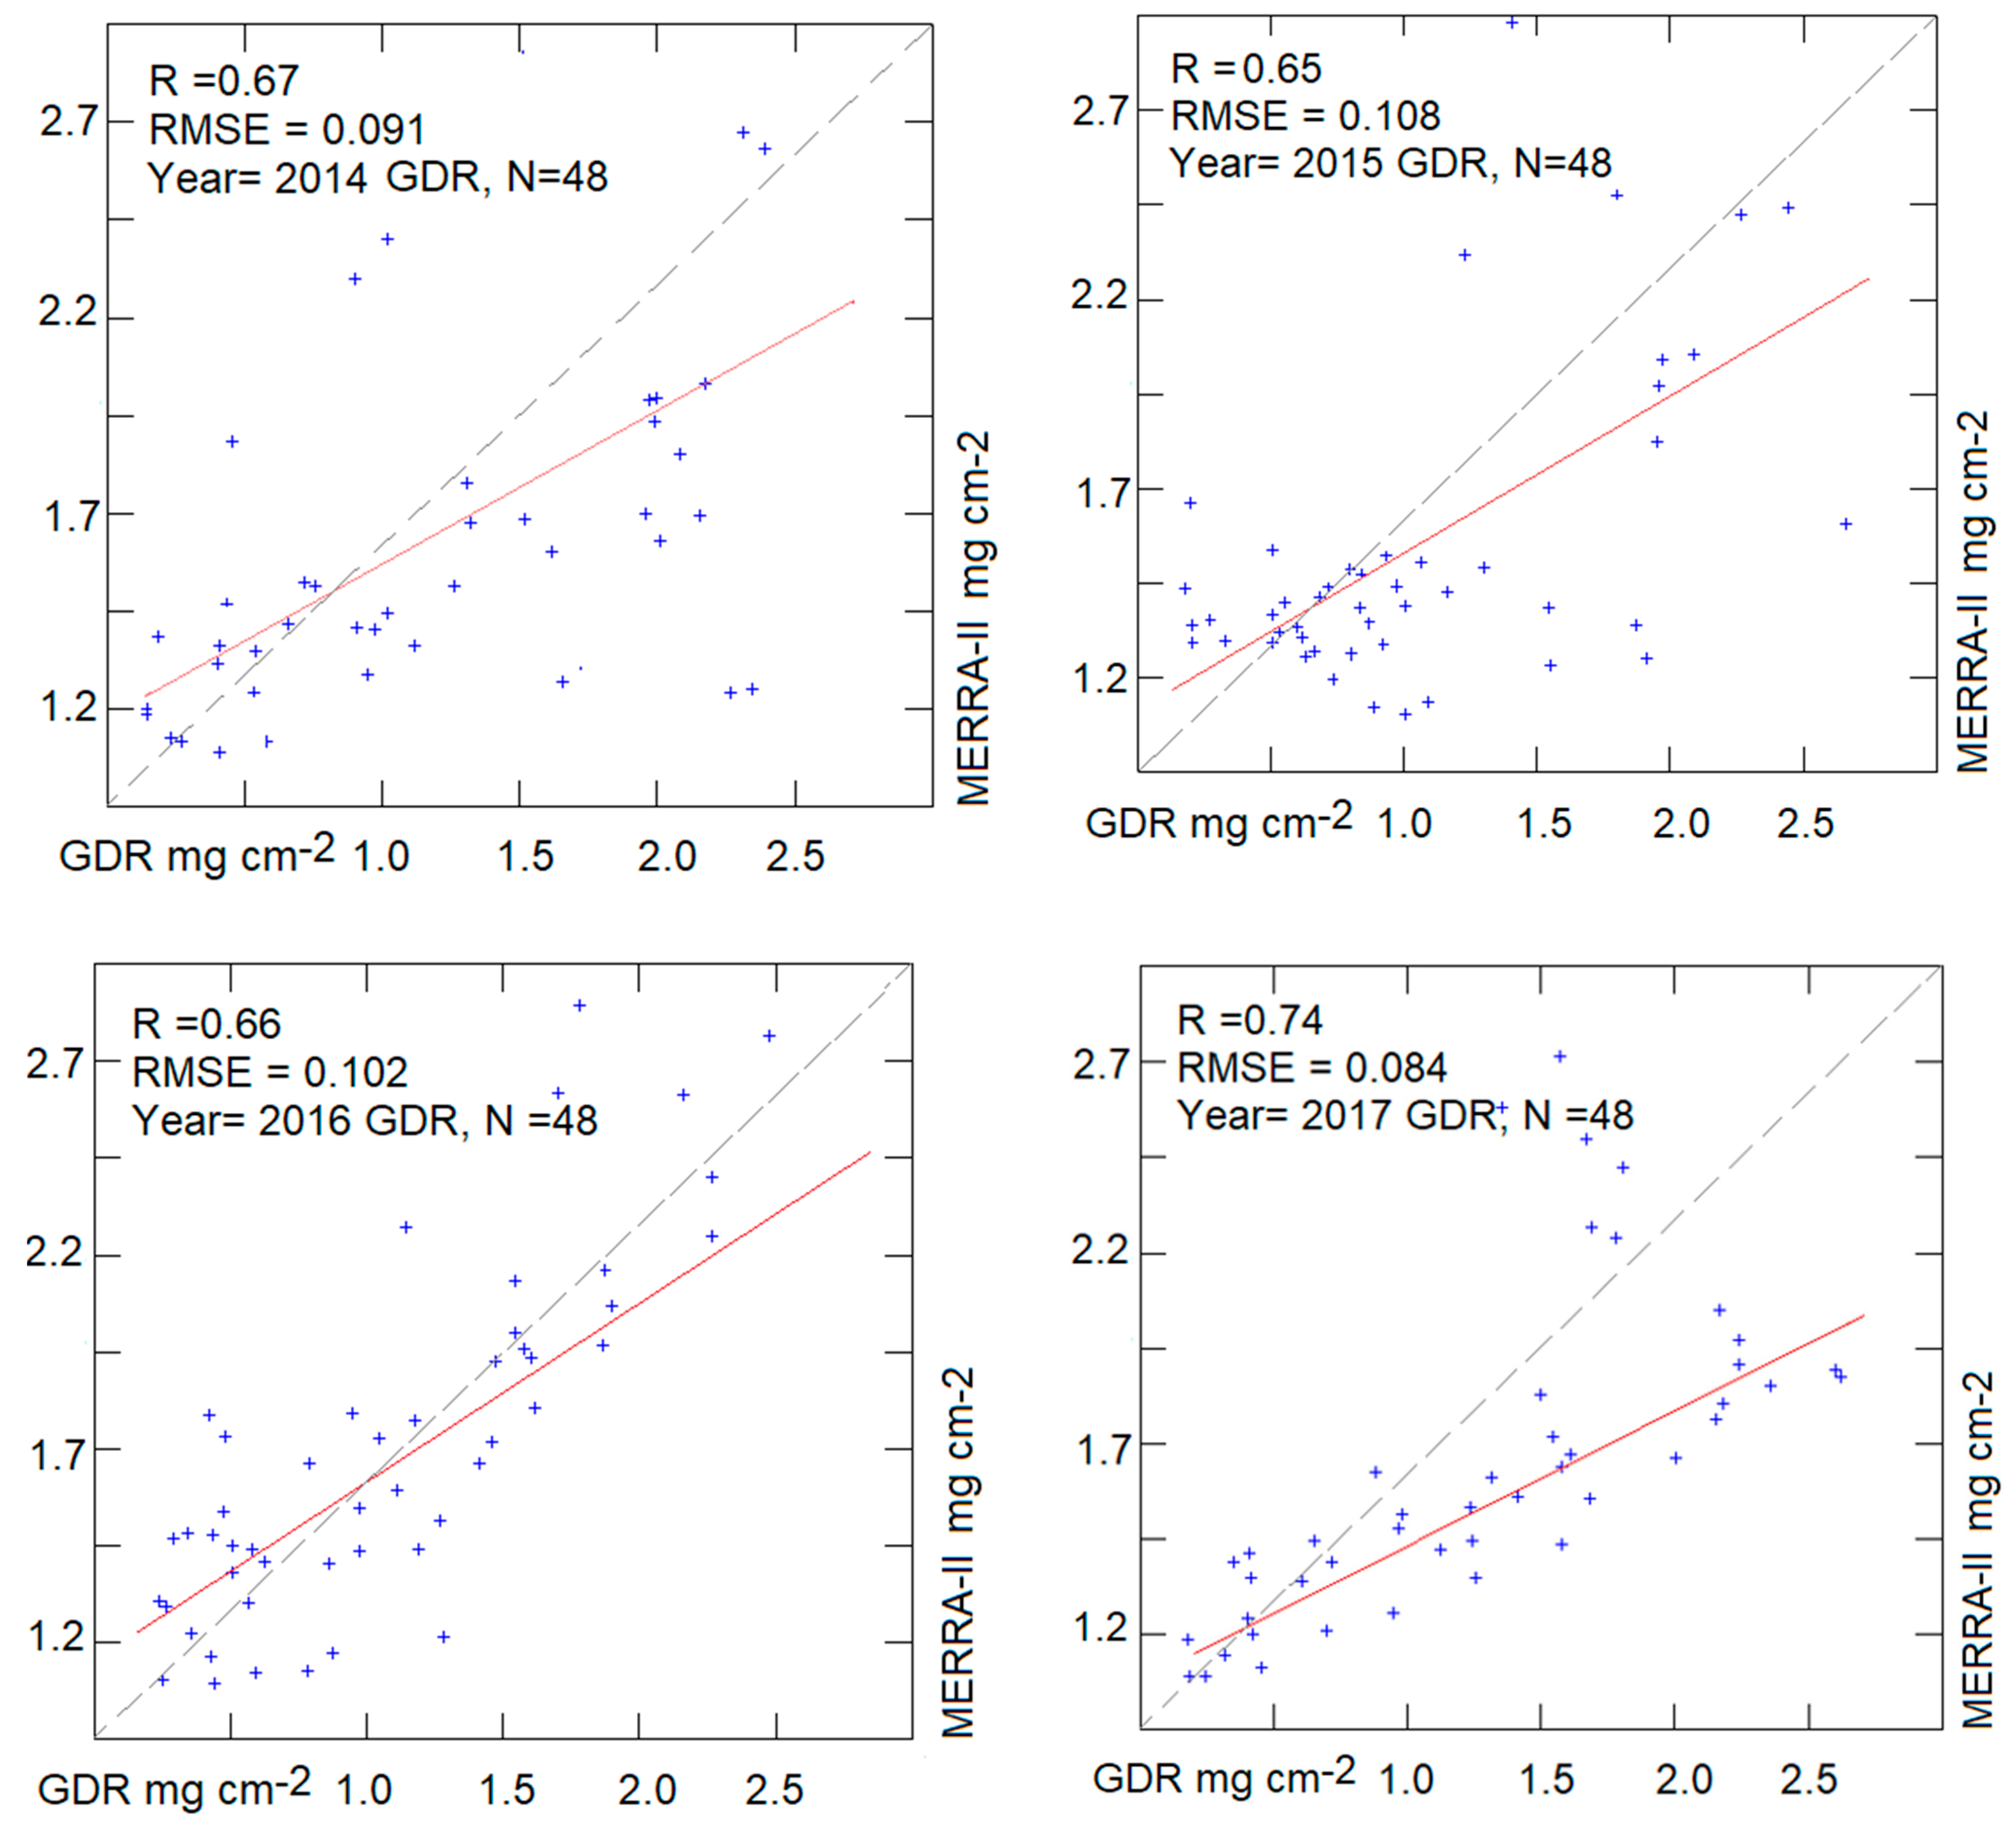
4.3. Significance of Relationship between MERRA-II and GDR

To evaluate the GDR results, a comparison between the MERRA-II and GDR over the research area during a period of high seasonal dust deposition rates was conducted. Although these physical air-to-surface processes are complex and depend on the dust concentration, some results show that the higher the dust concentration, the higher the dust deposition [87,93]. However, small changes in the statistical factors can cause changes in the deposition rates, as evidenced by the observed deposition rate trends found in the ground observations of the climate zonal surfaces. Thus, the eolian gradient between the MERRA-II and GDR results was considered (Figure 15). In 2014, this gradient revealed a positive and statistically significant correlation with a relatively low RMSE (r = 67%, RMSE = 0.091) at the p < 0.01 probability level. In 2015, there was also a significant correlation (r = 65%), and a low RMSE (0.01) at the p < 0.01 probability level. Although a similar significance correlation (r = 66%, RMSE = 0.102) was obtained for 2016, different positive and statistically significant correlations were detected in 2017 from the MERRA-II and GDR data (r = 74%, RMSE = 0.08) at the p < 0.05 probability level.
A comparison of the deposition rates in the study area climate zones indicated that dust concentrations in the atmosphere represent the dust deposition rate factors [73,87]. In accordance with [75], the deposition rate is affected by climate factors. For example, the high eolian deposition rate is caused by the influencing factors of subtropical dry zones. The significance of the varying deposition rates among the climate zones can be evaluated in the context of climate regions. The results presented herein show that deposition rates vary significantly and are closely related to climate variability, which is consistent with the findings of [7,23,75], confirming that the BWh region had the highest deposition rate at 8.4 t km2 month−1. Meanwhile, the BSh and Csa regions had lower deposition rates of 6.60 t km−2 month−1 and 3.30 t km−2 month−1, respectively. In addition to these findings, the highest dust deposition rates followed the order of BWh > BSh > Csa during the research period.

5. Conclusions and Remarks

This study focused on the enhancement of the dust deposition rates of three climate zones, BWh, BSh, and Csa, in southwestern Iran. To better understand the role of eolian dust deposition rates relationship with the climatic region and its impact on air quality, significant efforts were made to increase both space- and ground-based observations. Herein, the GDRs and dust event frequencies, including the mass and weight compositions, were measured. Experiments on the links between dust deposition and climate patterns were quantitatively assessed for the GDR and MERRA-II model. By comparing these results, a high correlation coefficient was revealed for deposition rates during the research period. This strong correlation was calculated to be 0.67, 0.65, 0.66, 0.74 at a p < 0.01 significance level from 2014 to 2017, respectively. Then, the effect of the climate on the deposition rate is quantified, revealing the annual mean deposition rates to be 100.80 t km−2 year−1, 79.27, and 39.60, for the BWh, BSh, and Csa zones, respectively. The seasonal variability of the deposition rates revealed that the highest rates occurred in the warm season and the lowest occurred in the cold season. The total annual dust deposition rates, however, were negatively related to the total annual precipitation, while they had a positive correlation with the annual temperature. Therefore, the atmospheric particle lifetime is controlled by precipitation and temperature, two of the main factors that characterize climate zones, which had a major influence on the dust deposition rates in the study area.
Thus, the results herein regarding the processes responsible for the dust deposition rates, and the climate pattern feedback provide insights concerning new sources, deposition rates, and their associated climate effects. Developing new sources are formed when a high volume of atmospheric particles is deposited by gravity over a land surface with no obstacles.
Although short-term changes in atmospheric conditions may influence the deposition rate (especially during simultaneous dust events), long-term atmospheric behavior corresponds to a large deposition rate. As eolian deposition rates are sensitive to climate zones, additional GDR observations on climate regimes should be performed to obtain precise information on dust plumes. Analyzing the seasonal and spatial variability of the dust activity in different climate zones is important not only for managing the impact of eolian dust but also for developing proper LULC strategies that can mitigate future dust impacts. This study might also contribute to the estimation of future dust deposition, as long as the GDR continues to be the main factor representing deposition trends. In the future, studies on the prediction of climate change and dust deposition rates should be combined.

Author Contributions

Conceptualization, M.A.F.; Data curation, M.G.; Funding acquisition, M.A.F.; Investigation, M.A.F.; Methodology, M.A.F., C.O. and M.G.; Supervision, C.O. and M.G.; Writing—original draft, M.A.F. All authors have read and agreed to the published version of the manuscript.

Funding

This research received no external funding.

Institutional Review Board Statement

Not applicable.

Informed Consent Statement

Not applicable.

Data Availability Statement

Not applicable.

Conflicts of Interest

The authors declare no conflict of interest.

References

  1. Swap, R.; Garstang, M.; Greco, S.; Talbot, R.; Kållberg, P. Saharan dust in the Amazon Basin. Tellus B 1992, 44, 133–149. [Google Scholar] [CrossRef] [Green Version]
  2. Falkowski, P.G.; Barber, R.T.; Smetacek, V. Biogeochemical Controls and Feedbacks on Ocean Primary Production. Science 1998, 281, 200–206. [Google Scholar] [CrossRef] [PubMed] [Green Version]
  3. Jickells, T.D.; Anderson, K.; Andersen, K.K.; Baker, A.R.; Bergametti, G.; Brooks, N.; Cao, J.J.; Boyd, P.W.; Duce, R.A.; Hunter, K.A.; et al. Global Iron Connections Between Desert Dust, Ocean Biogeochemistry, and Climate. Science 2005, 308, 67–71. [Google Scholar] [CrossRef] [PubMed] [Green Version]
  4. Stone, R. ARAL SEA:Coming to Grips With the Aral Sea’s Grim Legacy. Science 1999, 284, 30–33. [Google Scholar] [CrossRef]
  5. Wiggs, G.F.S.; O’Hara, S.L.; Wegerdt, J.; Van Der Meer, J.; Small, I.; Hubbard, R.B. The dynamics and characteristics of aeolian dust in dryland Central Asia: Possible impacts on human exposure and respiratory health in the Aral Sea basin. Geogr. J. 2003, 169, 142–157. [Google Scholar] [CrossRef]
  6. Groll, M.; Opp, C.; Aslanov, I. Spatial and temporal distribution of the dust deposition in Central Asia—results from a long term monitoring program. Aeolian Res. 2013, 9, 49–62. [Google Scholar] [CrossRef]
  7. Opp, C.; Groll, M.; Aslanov, I.; Lotz, T.; Vereshagina, N. Aeolian dust deposition in the southern Aral Sea region (Uzbekistan): Ground-based monitoring results from the LUCA project. Quat. Int. 2017, 429, 86–99. [Google Scholar] [CrossRef]
  8. Goudie, A. Dust storms: Recent developments. J. Environ. Manag. 2009, 90, 89–94. [Google Scholar] [CrossRef]
  9. Huang, X.; Oberhänsli, H.; Von Suchodoletz, H.; Sorrel, P. Dust deposition in the Aral Sea: Implications for changes in atmospheric circulation in central Asia during the past 2000 years. Quat. Sci. Rev. 2011, 30, 3661–3674. [Google Scholar] [CrossRef]
  10. Dawson, J.P.; Bloomer, B.J.; Winner, D.A.; Weaver, C.P. Understanding the Meteorological Drivers of U.S. Particulate Matter Concentrations in a Changing Climate. Bull. Am. Meteorol. Soc. 2014, 95, 521–532. [Google Scholar] [CrossRef]
  11. Feng, J.; Liao, H.; Li, J. The impact of monthly variation of the Pacific–North America (PNA) teleconnection pattern on wintertime surface-layer aerosol concentrations in the United States. Atmos. Chem. Phys. Discuss. 2016, 16, 4927–4943. [Google Scholar] [CrossRef] [Green Version]
  12. Wei, L.; Feng, Q.; Tao, W.; Yanwu, Z.; Jianhua, S. Physicochemistry and mineralogy of storm dust and dust sediment in northern China. Adv. Atmospheric Sci. 2004, 21, 775–783. [Google Scholar] [CrossRef]
  13. Peng, J.; Hu, M.; Guo, S.; Du, Z.; Zheng, J.; Shang, D.; Zamora, M.L.; Zeng, L.; Shao, M.; Wu, Y.-S.; et al. Markedly enhanced absorption and direct radiative forcing of black carbon under polluted urban environments. Proc. Natl. Acad. Sci. USA 2016, 113, 4266–4271. [Google Scholar] [CrossRef] [PubMed] [Green Version]
  14. Haywood, J.; Allan, R.P.; Culverwell, I.; Slingo, T.; Milton, S.; Edwards, J.; Clerbaux, N. Can desert dust explain the outgoing longwave radiation anomaly over the Sahara during July 2003? J. Geophys. Res. Space Phys. 2005, 110. [Google Scholar] [CrossRef]
  15. Fiedler, S.; Kaplan, M.L.; Knippertz, P. The importance of Harmattan surges for the emission of North African dust aerosol. Geophys. Res. Lett. 2015, 42, 9495–9504. [Google Scholar] [CrossRef] [Green Version]
  16. Prospero, J.; Uematsu, M.; Savoie, D. Mineral aerosol transport to the Pacific Ocean, Chemical Oceanography. Chem. Oceanogr. 1989, 10, 188–218. [Google Scholar]
  17. Goudie, A.; Middleton, N. Saharan dust storms: Nature and consequences. Earth-Sci. Rev. 2001, 56, 179–204. [Google Scholar] [CrossRef]
  18. Shinn, E.A.; Griffin, D.W.; Seba, D.B. Atmospheric transport of mold spores in clouds of desert dust. Arch. Environ. Health Int. J. 2003, 58, 498–504. [Google Scholar]
  19. Allen, R.J.; Landuyt, W.; Rumbold, S.T. An increase in aerosol burden and radiative effects in a warmer world. Nat. Clim. Chang. 2016, 6, 269–274. [Google Scholar] [CrossRef]
  20. Tegen, I.; Fung, I. Modeling of mineral dust in the atmosphere: Sources, transport, and surface modification. J. Geophys. Res. 1994, 99, 22897–22914. [Google Scholar] [CrossRef]
  21. Griffin, D.W.; Kubilay, N.; Kocak, M.; Gray, M.A.; Borden, T.C.; Shinn, E.A. Airborne desert dust and aeromicrobiology over the Turkish Mediterranean coastline. Atmos. Environ. 2007, 41, 4050–4062. [Google Scholar] [CrossRef]
  22. Nicoll, K.; Hahnenberger, M.; Goldstein, H.L. ‘Dust in the wind’ from source-to-sink: Analysis of the 14–15 April 2015 storm in Utah. Aeolian Res. 2020, 46, 100532. [Google Scholar] [CrossRef]
  23. Rezazadeh, M.; Irannejad, P.; Shao, Y. Climatology of the Middle East dust events. Aeolian Res. 2013, 10, 103–109. [Google Scholar] [CrossRef]
  24. Shao, Y.; Dong, C. A review on East Asian dust storm climate, modelling and monitoring. Glob. Planet. Chang. 2006, 52, 1–22. [Google Scholar] [CrossRef]
  25. Maleki, H.; Sorooshian, A.; Goudarzi, G.; Nikfal, A.; Baneshi, M.M. Temporal profile of PM 10 and associated health effects in one of the most polluted cities of the world (Ahvaz, Iran) between 2009 and 2014. Aeolian Res. 2016, 22, 135–140. [Google Scholar] [CrossRef] [Green Version]
  26. Goudie, A.S. Desert dust and human health disorders. Environ. Int. 2014, 63, 101–113. [Google Scholar] [CrossRef]
  27. Lin, Y.-C.; Feng, J.-L. Aeolian dust contribution to the formation of alpine soils at Amdo (Northern Tibetan Plateau). Geoderma 2015, 259, 104–115. [Google Scholar] [CrossRef]
  28. Varga, G.; Cserháti, C.; Kovács, J.; Szalai, Z. Saharan dust deposition in the Carpathian Basin and its possible effects on interglacial soil formation. Aeolian Res. 2016, 22, 1–12. [Google Scholar] [CrossRef] [Green Version]
  29. Yaalon, D.; Ganor, E. Rates of aeolian dust accretion in the Mediterranean and desert fringe environments of Israel. In Proceedings of the 9th International Sedimentological Congress, Nice, France, 1 January–30 November 1974; Volume 2, pp. 169–174. [Google Scholar]
  30. Khalaf, F.; Al-Hashash, M. Aeolian sedimentation in the north-western part of the Arabian Gulf. J. Arid. Environ. 1983, 6, 319–332. [Google Scholar] [CrossRef]
  31. Modaihsh, A. Characteristics and composition of the falling dust sediments on Riyadh city, Saudi Arabia. J. Arid. Environ. 1997, 36, 211–223. [Google Scholar] [CrossRef]
  32. Derbyshire, E.; Meng, X.; Kemp, R.A. Provenance, transport and characteristics of modern aeolian dust in western Gansu Province, China, and interpretation of the Quaternary loess record. J. Arid. Environ. 1998, 39, 497–516. [Google Scholar] [CrossRef]
  33. Zhang, X.; Shi, P.; Lianyou, L.; Tang, Y.; Cao, H.; Hu, X.; Guo, L.L.; Lue, Y.; Qu, Z. Ambient TSP concentration and dustfall in major cities of China: Spatial distribution and temporal variability. Atmos. Environ. 2010, 44, 1641–1648. [Google Scholar] [CrossRef]
  34. Hojati, S.; Khademi, H.; Cano, A.F.; Landi, A. Characteristics of dust deposited along a transect between central Iran and the Zagros Mountains. Catena 2012, 88, 27–36. [Google Scholar] [CrossRef]
  35. Shao, Y.; Wyrwoll, K.-H.; Chappell, A.; Huang, J.; Lin, Z.; McTainsh, G.H.; Mikami, M.; Tanaka, T.Y.; Wang, X.; Yoon, S. Dust cycle: An emerging core theme in Earth system science. Aeolian Res. 2011, 2, 181–204. [Google Scholar] [CrossRef]
  36. Wu, J.; Xu, Y.; Fu, C.; Zhang, R.; Dai, M.; Zhu, Y. Comparison of simulating mineral dust aerosols in east asia by two emission schemes. China Particuology 2006, 4, 293–299. [Google Scholar] [CrossRef]
  37. Stefanski, R.; Sivakumar, M.V.K. Impacts of sand and dust storms on agriculture and potential agricultural applications of a SDSWS. IOP Conf. Ser. Earth Environ. Sci. 2009, 7, 012016. [Google Scholar] [CrossRef]
  38. Kazem, A.A.; Chaichan, M.T.; Kazem, H.A. Dust effect on photovoltaic utilization in Iraq: Review article. Renew. Sustain. Energy Rev. 2014, 37, 734–749. [Google Scholar] [CrossRef]
  39. Foroushani, M.A.; Opp, C.; Groll, M. Chemical Characterization of Aeolian Dust Deposition in Southern and Western Iran. Asian J. Geogr. Res. 2019, 1–22. [Google Scholar] [CrossRef] [Green Version]
  40. Holleman, H. De-naturalizing ecological disaster: Colonialism, racism and the global Dust Bowl of the 1930s. J. Peasant. Stud. 2016, 44, 234–260. [Google Scholar] [CrossRef]
  41. Miri, A.; Ahmadi, H.; Ekhtesasi, M.R.; Panjehkeh, N.; Ghanbari, A. Environmental and socio-economic impacts of dust storms in Sistan Region, Iran. Int. J. Environ. Stud. 2009, 66, 343–355. [Google Scholar] [CrossRef]
  42. Norouzi, S.; Khademi, H.; Ayoubi, S.; Cano, A.F.; Acosta, J.A. Seasonal and spatial variations in dust deposition rate and concentrations of dust-borne heavy metals, a case study from Isfahan, central Iran. Atmospheric Pollut. Res. 2017, 8, 686–699. [Google Scholar] [CrossRef]
  43. Dadashi-Roudbari, A.; Ahmadi, M.; Shakiba, A. Seasonal Study of Dust Deposition and Fine Particles (PM 2.5) in Iran Using MERRA-2 Data. Iran. J. Geophys. 2020, 13, 43–59. [Google Scholar]
  44. Statoids. Administrative Divisions of Countries. Montly Clearing House, Sep. 2016. Available online: http://www.statoids.com/uir.html (accessed on 4 February 2021).
  45. Kriticos, D.J.; Webber, B.L.; Leriche, A.; Ota, N.; Macadam, I.; Bathols, J.; Scott, J.K. CliMond: Global high-resolution historical and future scenario climate surfaces for bioclimatic modelling. Methods Ecol. Evol. 2011, 3, 53–64. [Google Scholar] [CrossRef]
  46. Shen, H.; Abuduwaili, J.; Samat, A.; Ma, L. A review on the research of modern aeolian dust in Central Asia. Arab. J. Geosci. 2016, 9. [Google Scholar] [CrossRef]
  47. Taghavi, F.; Owlad, E.; A Ackerman, S. Enhancement and identification of dust events in the south-west region of Iran using satellite observations. J. Earth Syst. Sci. 2017, 126, 28. [Google Scholar] [CrossRef]
  48. Foroushani, M.A.; Opp, C.; Groll, M. Spatial and temporal gradients in the rate of dust deposition and aerosol optical thickness in southwestern Iran. J. Arid. Land 2021, 13, 1–22. [Google Scholar] [CrossRef]
  49. Peel, M.C.; Finlayson, B.L.; McMahon, T.A. Updated world map of the Köppen-Geiger climate classification. Hydrol. Earth Syst. Sci. Discuss. 2007, 4, 439–473. [Google Scholar]
  50. Tachikawa, T.; Kaku, M.; Iwasaki, A.; Gesch, D.B.; Oimoen, M.J.; Zhang, Z.; Danielson, J.J.; Krieger, T.; Curtis, B.; Haase, J.; et al. ASTER Global Digital Elevation Model Version 2—Summary of Validation Results. Report. 2011. Available online: http://pubs.er.usgs.gov/publication/70005960 (accessed on 4 February 2021).
  51. Buchard, V.; Randles, C.A.; Da Silva, A.M.; Darmenov, A.; Colarco, P.R.; Govindaraju, R.; Ferrare, R.; Hair, J.; Beyersdorf, A.J.; Ziemba, L.D.; et al. The MERRA-2 Aerosol Reanalysis, 1980 Onward. Part II: Evaluation and Case Studies. J. Clim. 2017, 30, 6851–6872. [Google Scholar] [CrossRef]
  52. Foroushani, M.A.; Opp, C.; Groll, M.; Nikfal, A. Evaluation of WRF-Chem Predictions for Dust Deposition in Southwestern Iran. Atmosphere 2020, 11, 757. [Google Scholar] [CrossRef]
  53. IHS under License with ASTM: Standard Terminology Relating to Sampling and Analysis of Atmospheres. IHS under License with ASTM. 2010. Available online: https://astm.biz/SNEWS/APRIL_2004/ashhar_apr04.html (accessed on 4 February 2021).
  54. Rienecker, M.M.; Suarez, M.J.; Gelaro, R.; Todling, R.; Bacmeister, J.; Liu, E.; Bosilovich, M.G.; Schubert, S.D.; Takacs, L.; Kim, G.-K.; et al. MERRA: NASA’s Modern-Era Retrospective Analysis for Research and Applications. J. Clim. 2011, 24, 3624–3648. [Google Scholar] [CrossRef]
  55. Koster, R.D.; McCarty, W.; Coy, L.; Gelaro, R.; Huang, A.; Merkova, D.; Smith, E.B.; Sienkiewicz, M.; Wargan, K. MERRA-2 Input Observations: Summary and Assessment; Goddard Space Flight Center: Greenbelt, MD, USA, 2016. [Google Scholar]
  56. Gao, W.; Wesely, M.L.; Cook, D.R.; Hart, R.L. Air-surface exchange of H2O, CO2, and O3 at a tallgrass prairie in relation to remotely sensed vegetation indices. J. Geophys. Res. Space Phys. 1992, 97, 18663. [Google Scholar] [CrossRef]
  57. Pease, P.P.; Tchakerian, V.P.; Tindale, N.W. Aerosols over the Arabian Sea: Geochemistry and source areas for aeolian desert dust. J. Arid. Environ. 1998, 39, 477–496. [Google Scholar] [CrossRef]
  58. Acker, J.G.; Leptoukh, G. Online Analysis Enhances Use of NASA Earth Science Data. Earth Data. Available online: https://giovanni.gsfc.nasa.gov/giovanni/ (accessed on 4 February 2021).
  59. Lenssen, N.J.L.; Schmidt, G.A.; Hansen, J.E.; Menne, M.J.; Persin, A.; Ruedy, R.; Zyss, D. Improvements in the GISTEMP Uncertainty Model. J. Geophys. Res. Atmos. 2019, 124, 6307–6326. [Google Scholar] [CrossRef]
  60. Lee, D.; Min, S.-K.; Fischer, E.M.; Shiogama, H.; Bethke, I.; Lierhammer, L.; Scinocca, J.F. Impacts of half a degree additional warming on the Asian summer monsoon rainfall characteristics. Environ. Res. Lett. 2018, 13, 044033. [Google Scholar] [CrossRef] [Green Version]
  61. Orth, R.; Zscheischler, J.; Seneviratne, S.I. Record dry summer in 2015 challenges precipitation projections in Central Europe. Sci. Rep. 2016, 6, 28334. [Google Scholar] [CrossRef] [PubMed]
  62. World Meteorological Organization. The Global Climate in 2015–2019. 2019. Available online: https://library.wmo.int/doc_num.php?explnum_id=9936 (accessed on 3 February 2021).
  63. Jouzel, J.; Waelbroeck, C.; Malaizé, B.; Bender, M.; Petit, J.R.; Stievenard, M.; Barkov, N.I.; Barnola, J.M.; King, T.; Kotlyakov, V.M.; et al. Climatic interpretation of the recently extended Vostok ice records. Clim. Dyn. 1996, 12, 513–521. [Google Scholar] [CrossRef]
  64. Rashki, A.; Arjmand, M.; Kaskaoutis, D. Assessment of dust activity and dust-plume pathways over Jazmurian Basin, southeast Iran. Aeolian Res. 2017, 24, 145–160. [Google Scholar] [CrossRef]
  65. Abbasi, H.; Opp, C.; Groll, M.; Rohipour, H.; Khosroshahi, M.; Khaksarian, F.; Gohardoust, A. Spatial and temporal variation of the aeolian sediment transport in the ephemeral Baringak Lake (Sistan Plain, Iran) using field measurements and geostatistical analyses. Z. Geomorphol. 2018, 61, 315–326. [Google Scholar] [CrossRef]
  66. Choobari, O.A.; Zawar-Reza, P.; Sturman, A. Low level jet intensification by mineral dust aerosols. Ann. Geophys. 2013, 31, 625–632. [Google Scholar] [CrossRef]
  67. Ta, W.; Xiao, H.; Qu, J.; Xiao, Z.; Yang, G.; Wang, T.; Zhang, X. Measurements of dust deposition in Gansu Province, China, 1986–2000. Geomorphology 2004, 57, 41–51. [Google Scholar] [CrossRef]
  68. Alharbi, M. Characteristics and composition of the falling dust in urban environment. Int. J. Environ. Sci. Technol. 2013, 12, 641–652. [Google Scholar] [CrossRef] [Green Version]
  69. Lin, C.-Y.; Lee, Y.-H.; Kuo, C.-Y.; Chen, W.-C.; Sheng, Y.-F.; Su, C.-J. Impact of river-dust events on air quality of western Taiwan during winter monsoon: Observed evidence and model simulation. Atmos. Environ. 2018, 192, 160–172. [Google Scholar] [CrossRef]
  70. Oduber, F.; Calvo, A.; Blanco-Alegre, C.; Castro, A.; Nunes, T.; Alves, C.; Sorribas, M.; Fernández-González, D.; Vega-Maray, A.; Valencia-Barrera, R.; et al. Unusual winter Saharan dust intrusions at Northwest Spain: Air quality, radiative and health impacts. Sci. Total Environ. 2019, 669, 213–228. [Google Scholar] [CrossRef] [PubMed]
  71. Reheis, M.C.; Kihl, R. Dust deposition in southern Nevada and California, 1984–1989: Relations to climate, source area, and source lithology. J. Geophys. Res. Space Phys. 1995, 100, 8893–8918. [Google Scholar] [CrossRef]
  72. Alizadeh-Choobari, O.; Najafi, M. Extreme weather events in Iran under a changing climate. Clim. Dyn. 2018, 50, 249–260. [Google Scholar] [CrossRef]
  73. Shao, Y.; Lu, H. A simple expression for wind erosion threshold friction velocity. J. Geophys. Res. Space Phys. 2000, 105, 22437–22443. [Google Scholar] [CrossRef]
  74. Lucke, B.; Roskin, J.; Vanselow, K.A.; Bruins, H.J.; Abu-Jaber, N.; Deckers, K.; Lindauer, S.; Porat, N.; Reimer, P.J.; Bäumler, R.; et al. Character, Rates, and Environmental Significance of Holocene Dust Accumulation in Archaeological Hilltop Ruins in the Southern Levant. Geosciences 2019, 9, 190. [Google Scholar] [CrossRef] [Green Version]
  75. Shao, Y.; Wang, J. A climatology of Northeast Asian dust events. Meteorol. Z. 2003, 12, 187–196. [Google Scholar] [CrossRef] [Green Version]
  76. Gillette, D.A. Threshold friction velocities for dust production for agricultural soils. J. Geophys. Res. Atmos. 1988, 93, 12645–12662. [Google Scholar] [CrossRef] [Green Version]
  77. Belnap, J.; Phillips, S.L.; Herrick, J.E.; Johansen, J.R. Wind erodibility of soils at Fort Irwin, California (Mojave Desert), USA, before and after trampling disturbance: Implications for land management. Earth Surf. Process. Landf. J. Br. Geomorphol. Res. Group 2006, 32, 75–84. [Google Scholar] [CrossRef]
  78. Webb, N.P.; Galloza, M.S.; Zobeck, T.M.; Herrick, J.E. Threshold wind velocity dynamics as a driver of aeolian sediment mass flux. Aeolian Res. 2016, 20, 45–58. [Google Scholar] [CrossRef]
  79. Gillette, D.A.; Adams, J.; Endo, A.; Smith, D.; Kihl, R. Threshold velocities for input of soil particles into the air by desert soils. J. Geophys. Res. Oceans 1980, 85, 5621–5630. [Google Scholar] [CrossRef]
  80. Hoffmann, C.; Funk, R.; Wieland, R.; Li, Y.; Sommer, M. Effects of grazing and topography on dust flux and deposition in the Xilingele grassland, Inner Mongolia. J. Arid. Environ. 2008, 72, 792–807. [Google Scholar] [CrossRef]
  81. Song, Z.; Wang, J.; Wang, S. Quantitative classification of northeast Asian dust events. J. Geophys. Res. Space Phys. 2007, 112. [Google Scholar] [CrossRef]
  82. Hartmann, D. Chapter 6-atmospheric general circulation and climate. In Global Physical Climatology, 2nd ed.; Elsevier: Amsterdam, The Netherlands, 2016; pp. 159–193. [Google Scholar]
  83. Lancaster, N. Geomorphology of Desert Dunes; Psychology Press: East Sussex, UK, 1995. [Google Scholar]
  84. Hahnenberger, M.; Nicoll, K. Geomorphic and land cover identification of dust sources in the eastern Great Basin of Utah, U.S.A. Geomorphol. 2014, 204, 657–672. [Google Scholar] [CrossRef]
  85. Qian, G.; Dong, Z.; Luo, W.; Wang, H. Variations of horizontal and vertical velocities over two-dimensional transverse dunes: A wind tunnel simulation of the effect of windward slope. J. Arid. Environ. 2009, 73, 1109–1116. [Google Scholar] [CrossRef]
  86. Trenberth, K.E.; Jones, P.D.; Ambenje, P.; Bojariu, R.; Easterling, D.; Klein Tank, A.; Parker, D.; Rahimzadeh, F.; Renwick, J.A.; Rusticucci, M.; et al. Observations: Surface and Atmospheric Climate Change; 2007; Chapter 3; pp. 235–336. Available online: https://www.osti.gov/etdeweb/biblio/20962165 (accessed on 4 February 2021).
  87. Zhang, J.; Shao, Y.; Huang, N. Measurements of dust deposition velocity in a wind-tunnel experiment. Atmos. Chem. Phys. Discuss. 2014, 14, 8869–8882. [Google Scholar] [CrossRef] [Green Version]
  88. Geiger, A.; Cooper, J. Overview of Airborne Metals Regulations, Exposure Limits, Health Effects, and Contemporary Research; US Environmental Protection Agency: Washington, DC, USA, 2010; Volume 25, p. 2015.
  89. Al-Dousari, A.M.; Al-Awadhi, J. Dust fallout in northern Kuwait, major sources and characteristics. Kuwait J. Sci. Eng. 2012, 39, 171–187. [Google Scholar]
  90. Trenberth, K. Changes in precipitation with climate change. Clim. Res. 2011, 47, 123–138. [Google Scholar] [CrossRef] [Green Version]
  91. Tao, W.-K.; Chen, J.-P.; Li, Z.; Wang, C.; Zhang, C. Impact of aerosols on convective clouds and precipitation. Rev. Geophys. 2012, 50. [Google Scholar] [CrossRef] [Green Version]
  92. Previdi, M.; Liepert, B.G. Annular modes and Hadley cell expansion under global warming. Geophys. Res. Lett. 2007, 34. [Google Scholar] [CrossRef]
  93. Wesely, M. A review of the current status of knowledge on dry deposition. Atmos. Environ. 2000, 34, 2261–2282. [Google Scholar] [CrossRef]
Figure 1. Study area with the locations of the ground dust collectors [39]. Top; climate map customized for study area reproduced courtesy of [49]. G01 to G10 shows the distribution of dust collectors. Down: Map of the study area, including latitude, longitude, elevation, and the main tectonic elements of the region. Reproduced courtesy of the U.S. Geological Survey data explorer [50].
Atmosphere 12 00229 g001
Figure 2. Construction and collection of samples from sampling stations. Sampling process is represented in (ad) respectively. Sampling begins by removing the sample plate [A and B] followed by replacing the filter, and packing samples with caution [C and D] according to [48].
Atmosphere 12 00229 g002
Figure 3. Time series interannual temperature data obtained from the study area. Standard deviation (Std) is a measure variation or dispersion of the temperature. According to the legend solid lines, dashed, and dash-dotted lines represent interannual time series of temperature in BWh (blue), BSh (brown), and Csa (gray) respectively. Left axis indicates standard deviation of annual temperatures around average temperature which is scaled on the right axis.
Atmosphere 12 00229 g003
Figure 4. Interannual average temperatures (reddish trend lines) and monthly precipitation (bluish bar chart) of three climate zones (BWh, BSh, and Csa). Axis on the left side represents precipitation value (in mm) and axis on the right side represents temperature (in Celsius).
Atmosphere 12 00229 g004
Figure 5. Histogram of wind speed (m s−1) monthly averages for 2014–2017. From left to right: Vertical axis shows event frequencies and horizontal axis represents wind speed in BWh, Csa, and BSh.
Atmosphere 12 00229 g005
Figure 6. Interannual time series of predominate wind speeds in eastward and northward directions. Eastward wind and southward wind direction are pronounced on the left (reddish trend) and right (bluish trends) vertical axis. Solid lines, big and small dashed lines represent interannual time series of windspeed in BWh, BSh, and Csa climate zone respectively.
Atmosphere 12 00229 g006
Figure 7. Seasonal wind-roses for BWh, Csa, and BSh climate zones, illustrating the percentage of time that winds blow from a particular direction at a certain speed. The wind rose maps contain centroid circles, wherein the small circle in the center is the calm value in percent of total wind speed, which occurs when speeds are less than 2.0 m s−1. The centroid circles (track) relative to the eight wind sectors represent wind severity and directions. Different color arrows signify different wind speeds, as shown in the legend.
Atmosphere 12 00229 g007aAtmosphere 12 00229 g007b
Figure 8. Time series of ground deposition rates (GDRs, mg cm−2). From top to bottom, the GDRs (vertical axis) plot against seasonal pattern (horizontal axis) for sites G08, G09, and G10 from BWh, G01, G02, and G07 from BSh, G03, G04, G05, and G06 from Csa. The GDRs are weighted monthly in mg cm−2 from data collected onto a plate with a diameter of 20 cm. Dotted lines show average deposition rates (black dotted line) and standard deviation (brown dotted line). Diagonal lines is created for each climate region (BWh, BSh, and CSa) by a linear trend line revealing the overall direction of std and average deposition rates in blue and yellow respectively.
Atmosphere 12 00229 g008
Figure 9. Monthly average deposition rates as determined by second modern-era retrospective analysis for research and applications (MERRA-II) model (M2TMNXAD4-V5.12.4). Solid lines in red, brown and gray are pronounced dry deposition rates in the different climate of BWh, BSh, and Csa respectively.
Atmosphere 12 00229 g009
Figure 10. Overall seasonal deposition rates (mg cm−2) in the study area.
Atmosphere 12 00229 g010
Figure 11. Correlation of surface temperature (°C) with eolian deposition rate (mg cm−2). Left: correlation for temperature versus ground deposition rate (GDR) and Root Mean Square Error (RMSE), from 2014–2017. Right: Zonal means of surface temperature (°C) versus climate zones, as represented in narrow band at the top, wherein blue, orange, and gray represent BWh, BSh, and Csa, respectively).
Atmosphere 12 00229 g011
Figure 12. Correlation of the average monthly precipitation versus eolian deposition rate. Left: Correlation of precipitable 1. versus ground deposition rate (GDR) and Root Mean Square Error (RMSE) during the period 2014–2017. Right: Zonal means of total precipitation (mm month−1) versus climate zones, which are represented in narrow bands at the top, wherein blue, orange, and gray denote BWh, BSh, and Csa, respectively).
Atmosphere 12 00229 g012
Figure 13. Correlation of wind velocity versus the eolian deposition rate. (A) Eastward; (B) Northward. Left: Correlation plots for eastward wind speeds (m s−1) versus ground deposition rate (GDR) and Root Mean Square Error (RMSE) during the period 2014–2017. Right: Correlation plots for northward wind speeds (m s−1) versus GDR during the period 2014–2017.
Atmosphere 12 00229 g013
Figure 14. Correlation between vertical pressure velocity and eolian deposition rate. Left: Correlation of vertical pressure velocity (Pa s−1) versus ground deposition rate (GDR) and Root Mean Square Error (RMSE) during the period 2014–2017. Right: Zonal means of vertical pressure velocity plots versus climate zones, which are represented in narrow bands at the top, wherein blue, orange, and gray denote BWh, BSh, and Csa, respectively).
Atmosphere 12 00229 g014
Figure 15. Relationship between MERRA-II and GDR. Plotting data correlation and Root Mean Square Error (RMSE) between annual deposition rates derived from the second modern-era retrospective analysis for research and applications (MERRA-II) and group deposition rate (GDR) data during the period 2014–2017.
Atmosphere 12 00229 g015
Table 1. Observation of dust deposition.
LocationPeriodDeposition Rate (t km −2 Year−1)References
Israel1968–197357–217[29]
Kuwait19822600[30]
Saudi Arabia1991–19924704[31]
Lanzhou, China1988–1991108[32]
Urumqi, China1981–2004284.5[33]
Iran2008–200972–120[34]
Uzbekistan2003–20108365[6]
The contribution of deposition was measured directly at only a few sites. Therefore, there is a lack of reliable dust deposition data worldwide, e.g., [33,35].
Table 2. Climate classification scheme of study area.
TypeDescriptionCriterion
BArid climatePann < 10 × Pth
BSArid steppe climatePann > 05 × Pth
BWArid desert climatePann ≤ 05 × Pth
CWarm temperate climate−3 C < Tmin< +18 C
CsWarm temperate climate, with dry summerPsmin < Pwmin, Pwmax > 2 Psmin and Psmin < 40 mm
CwWarm temperate climate, with dry winterPwmin < Psmin and Psmax > 10 Pwmin
CfWarm temperate climate, fully humidNeither Cs nor Cw
DSnow climateTmin ≤ −3 C
DsSnow climate, with dry summer Psmin < Pwmin.Pwmax > 3Psmin and Psmin < 40 mm
DwSnow climate, with dry winterPwmin < Psmin and Psmax > 10 Pwmin
DfSnow climate, with fully humidNeither Ds nor Dw
Climate of study area was classified as hot desert climate (BWh), hot semi-arid climate (BSh), and temperate hot and dry summer climate (Csa) using the Köppen climate classification scheme [45], wherein each letter represents one of five main climate group at a 1 km resolution. Note that “T” is temperature, “P” is precipitation, and “C” denotes Celsius. P is paired with subscripts of “ann” annually, “th” threshold, “wmin, wmax” winter minimum and maximum, respectively, and “smin, smax” summer minimum and maximum, respectively.
Table 3. Location of dust samplers in the study area. Updated from [39].
Classification Geo-Coordinates Distance
NoCodeLatitudeLongitudeClimate RangeAltitude
(m a.s.l.)
Total
km
1G0134.00055345.497595Hot semi-arid climate[BSh]1440
2G0234.00718245.499075Hot semi-arid climate[BSh]1841
3G0334.39358445.648174---[Csa]-[BSh]39452
4G0434.42302845.993753Temperate Hot Summer[Csa]910113
5G0534.35336547.101335Temperate Hot Summer[Csa]1304245
6G0633.02497647.759393----[BSh]-[Csa]581632
7G0732.38003848.282664Hot semi-arid climate[BSh]109733
8G0831.44519448.632398Hot desert climate[BWh]25860
9G0930.58465149.163632Hot desert climate[BWh]6991
10G1030.35241148.292293Hot desert climate[BWh]21091
Dust samples are labeled from G01 to G10. The climate ranges are classified according to Köppen (1936) [49].
Table 4. Classification of the average seasonal deposition rates on the basis of wind patterns.
CriteriaSeasonal Deposition RatesWind Velocity
ClimateSeasonsGDR
t km−2
Model Output t km−2Wind Less than 2 m s−1Wind Speed m s−1Wind Direction
BWhWinter18.94.825.8%2.3WNW
Spring28.56.215.5%2.9WNW
Summer34.56.110.7%3.0WNW
Fall18425.4%2.0SE-NW
BShWinter15.62.418.5%2.3SE
Spring24.94.716.0%2.5ESE
Summer22.23.39.7%2.5ESE
Fall16.23.331.8%1.8SE
CsaWinter9.31.227.2%2.0SE-E
Spring12.33.226.4%2.3W-E
Summer12.33.610.0%3.4WNW
Fall6.62.428.9%1.9SE
A comparison between the model output and ground deposition rate (GDR) was conducted for a given time and the corresponding wind velocity near the surface. These data indicate an agreement between the model output and GDR ranges. A consistency index of wind speed (2.0 m s−1 < v < 3.5 m s−1) was observed in the westward wind direction, and a minimum peak percentage of calm events was found for each climate zone.
Table 5. Typical climate patterns relative to the deposition rate.
Classification BWh (G10, G09, G08)BSh (G07, G01, G02)Csa (G06, G05, G04, G03)
Lat and Long47.60 E 29.97 N46.97 E 31.99 N45.90 E 33.00 N
Climate PatternTemp
°C
Rain
mm
GDR
t km−2
Temp
°C
Rain
Mm
GDR
t km−2
Temp
°C
Rain
mm
GDR
t km−2
Means29.614.18.424.540.206.618.642.003.5
Std11.6013.03.612.2033.303.413.8034.002.3
Max55432155116265210710
Min5null-3Null-−6null-
Monthly statistics of temperature, precipitation, and the ground deposition rate (GDR) in the BWh, BSh, and Csa regions from 2014 to 2017.
Publisher’s Note: MDPI stays neutral with regard to jurisdictional claims in published maps and institutional affiliations.

