Article

Has COVID-19 Lockdown Affected on Air Quality?—Different Time Scale Case Study in Wrocław, Poland

Department of Applied Mathematics, Wrocław University of Environmental and Life Sciences, Grunwaldzka Str. 53, 50-357 Wrocław, Poland
*
Author to whom correspondence should be addressed.
Atmosphere 2021, 12(12), 1549; https://doi.org/10.3390/atmos12121549
Submission received: 4 November 2021 / Revised: 20 November 2021 / Accepted: 22 November 2021 / Published: 24 November 2021

Abstract

:
Due to the COVID-19 pandemic, there are series of negative economic consequences, however, in limiting mobility and reducing the number of vehicles, positive effects can also be observed, i.e., improvement of air quality. The paper presents an analysis of air quality measured by concentrations of NO2, NOx and PM2.5 during the most restrictive lockdown from 10 March to 31 May 2020 on the case of Wrocław. The results were compared with the reference period—2016–2019. A significant reduction in traffic volume was identified, on average by 26.3%. The greatest reduction in the concentration of NO2 and NOx was recorded at the station farthest from the city center, characterized by the lowest concentrations: 20.1% and 22.4%. Lower reduction in the average concentrations of NO2 and NOx was recorded at the municipal station (7.9% and 7.7%) and the communication station (6.7% and 10.2%). Concentrations of PMs in 2020 were on average 15% and 13.4% lower than in the reference period for the traffic station and the background station. The long-term impact of the lockdown on air quality was also examined. The analysis of the concentrations of the pollutants throughout 2020, and in the analyzed period of 2021, indicated that the reduction of concentrations and the improvement in air quality caused by the restrictions should be considered as a temporary anomaly, without affecting long-term changes and trends.

1. Introduction

Lockdown caused by the COVID-19 pandemic outbreak caused a series of negative economic and social consequences. Restrictions in movement, reduction in the number of active vehicles and the general population fluctuations resulted in many changes—including environmental ones [1,2,3]. In limiting people’s mobility and reducing the number of vehicles in motion, positive effects can also be seen. One of them is improvement of air quality. The situation of the global pandemic in 2020 and resulting lockdowns have created a unique opportunity to test this hypothesis on the real data.
The literature broadly describes the impact of traffic on the concentration of the pollutants in the air [4,5,6,7,8,9,10]. Therefore, it is expected that reducing the traffic volume would improve air quality. Worldwide considerations conducted by Liu et al. [11] led to the conclusion that in the period from 1 January 2020 to 5 June 2020 (restrictions on people’s movement were introduced at different periods in different countries) the NO2 individual AQI fell the most (23–37%), PM10 (14–20%), SO2 (2–20%), PM2.5 (7–16%) and CO (7–11%) relative to the threshold. In contrast, the ozone individual AQI increased by 10–27%. Gao [12] concluded that private vehicle COVID-19 restriction policies reduce the degree of air pollution to a certain extent. Detailed studies were also carried out in individual countries, regions and cities, determining changes in average pollutant concentrations compared to the same period in previous years.
Most often, comparative analyses of air quality stated in 2020 are made in relation to the previous year—2019. Analyses based on the daily air pollution and intracity migration index from Baidu (1 January–21 March 2020) for 44 cities in northern China indicate that reduction of human movement reached 69.85% along with the air quality index decreasing by 7.80%. Particularly, PM2.5 decreased by 5.93%, NO2 by 24.67% and CO by 4.58% [13]. Ding et al. [14], in studies conducted for the period 23 January–15 March 2020 in North China, showed a reduction of pollutants by 22.7% for NO2 and 17.7% for PM2.5. Rudke [15], in the metropolitan area of São Paulo in the period 1 January–30 June, reached an average decrease of 29% in CO, 28% in NOx, 40% in NO, 19% in SO2, 15% in PM2.5 and 8% in PM10 concentrations during the mobility restrictions period compared to the same period in 2019. The only pollutant that showed an increase in concentration was ozone, with a 20% increment. Brown et al. [16] indicated a significant reduction of mean NO2 concentrations, 35% at background sites and 41% at traffic sites, during the first month in the UK. Gao et al. [17], in the megacities of Wuhan, Beijing, Shanghai and Guangzhou for the period January–May between 2016 and 2020, noted a reduction of passenger volume of public transportation from 25.1 to 65.4%, and a reduction of passenger volume of taxis by 47.0–67.6% (compared to the same period in 2019), which reduced PM2.5 by 49.9% to 78.2%, NO2 by 21.1% to 11.9% and SO2 by 55.4% to 32.3%. Islam et al. [18], for the period March–June in Bangladesh, determined the concentration reduction of PM2.5 by 17.31%, NO2 by 10.33, SO2 by 47.92 and CO by 6.07%. Khan [19], for Pakistan, identified significant decrease in the levels of PM2.5 ranging from 15 to 35% for satellite observations, while 27 to 61% for ground-based observations.
Some authors compare the concentration of pollutants over a period of several years. Wu et al. [20] indicated a reduction of NO2 concentration by 32%, PM2.5 by 31% for non-roadside and 34% for roadside monitoring stations in the period 23 January–12 April 2020 compared to the same period in 2018–2019. The authors also studied PM10 (reduction by 32–37%), SO2 (reduction by 31–39%), CO (reduction by 16–29%) and O3 (increase by 6–30%). Berman and Ebisu [21], in United States, comparing NO2 concentrations in the periods: pre-COVID-19 (8 January–12 March 2020) and during the COVID-19 (13 March–21 April 2020) with historical data from 2017–2019, indicate statistically significant NO2 declines with 25.5% reduction (absolute decrease of 4.8 ppb). Al-Abadleh et al. [22] determined statistically significant decreases in NO2 levels (April and May) and ranged from 18 to 42% compared to the 2017–2019 reference years. Gamma et al. [23] analyzed the indirect effect produced by this pandemic on air pollution in Portugal, by comparison of data from a period of movement restriction in period from March to May 2020 with data from baseline conditions (the same period from 2015 to 2019). Based on NO2 and PM10 hourly concentration—from more than 20 monitoring stations spread over mainland Portugal—showed average reduction in pollutant concentrations equal to 41% for NO2 and 18% for PM10. In contrast to the comparative analyses of the concentration values alone, Mishra et al. [24] determined the pollution level of particulate matters using fitted gamma distribution function indicators in different countries, showed a reduction of 32.36% for China, 17.27% for France, 29.33% for the USA, 5.03% for Brazil and 53.67% for India during their respective lockdown periods.
A review of publications dealing with the impact of reduced mobility of citizens on air quality can be found in the work of Marinello et al. [25]. However, it did not mention the research conducted in Poland, which differs from other European countries in terms of vehicle structure and domestic heating methods. In Poland only 30% of cars are less than 10 years old [26]. The issue of the impact of restrictions on the movement of people in Poland on air quality has so far been raised by Rogulski and Badyda [27] and Filonchyk et al. [28]. The first publication contains a comparative analysis of concentrations based on hourly data for the five largest cities in Poland for the period April 2020 in relation to April 2019. A significant reduction in NO2 concentration by an average of 6–11% and PM2.5 by 2–11% was indicated. The second paper, based on ground-based and satellite data, compares the concentrations of NO2, PM2.5, PM10 and SO2 for the three months: March–May in the 2018–2020 and also 2019–2020 periods in five cities (four of them are the same) in Poland. The analysis of the daily values divided into 4 periods related to changing restrictions showed a significant reduction in the concentration of dust pollutants from 9 to 34% and NO2 from 10 to 19%.
The research area of scientists also includes the analysis of the influence of weather conditions, air pollution and the air quality index (AQI) on COVID-19 cases (daily number of cases). Research based on data from the Bangkok Metropolitan Region (BMR) was presented by Sangkham et al. [29]. Amnuaylojaroen and Parasin [30] present a more comprehensive review of the literature in the field of research on the relationship between air pollution and climate change.
The aim of this study is a comprehensive, general analysis of the impact of reduced mobility of habitants, measured by vehicle traffic, caused by the COVID-19 pandemic, on air quality in Wrocław—a large city in Poland—in different time scales. We analyzed air quality in the years before COVID (2016–2019), during the first wave (2020) and in the following year (2021). As comparative data, the hourly average values of both meteorological factors and concentrations of air pollutants from 2016 to 2019 (reference period) at the same research stations (one traffic station and two background stations) were used, from which the data for 2020 and 2021 come from. Metrological conditions along with concentrations of pollutants, which are most strongly associated with the living activity of people (PM2.5, NO2, NOx), were compared in two periods–aforementioned reference period and research period which covered data from 10 March to 30 May 2020, when Poland held the most restrictive restrictions. The choice of such a set of pollutants is due to the fact that these substances have an adverse effect on different aspects of modern societies and the environment. Nitrogen oxides are one of the main components of such phenomena related to environmental degradation, such as acid rain, ozone hole or photochemical smog [31]. Traffic related air pollution is also a significant problem that directly affects the life expectancy and health of the inhabitants. Urban air pollution is estimated to be responsible for 1.2% of global mortality [32]. Nitrogen dioxide (NO2) pollution is responsible for several respiratory diseases including the increase in asthma cases among children [33]. In order to assess the long-term impact of the reduction in traffic flow in the period from 10 March to 30 May, the pollutant concentrations were compared to this from the same period in 2021. Pollutant concentrations were analyzed along with changes in traffic intensity and meteorological conditions during the research period.

2. Materials and Methods

2.1. Study Area

Wrocław is the fourth largest city in terms of population, 634.5 thousand inhabitants, and the fifth largest city, 293 km2, located in the south-western part of Poland, dating back to the 10th century A.D. (Figure 1). Despite the rapid economic development, many residential premises in Wrocław are still heated with solid fuel, and low emissions (mainly domestic heating) are the main source of dust pollution: 81% of PM2.5, 54% of CO and 9% of NO2 emissions in Wrocław originate from the domestic sector. Over the centuries, the road infrastructure of Wrocław has been modified and adapted to the dynamic development of means of transport. Adapting the road network to the conditions of modern road traffic is even more difficult as 5 rivers and many canals flow through Wrocław. There are 12 islands and 112 bridges and footbridges in the city. Along the course of the Wrocław motorway bypass there is the largest reinforced concrete bridge in the world (70,000 m2) with the highest pylon in Poland (122 m)—Rędziński Bridge [34]. The city’s water conditions make it impossible to build an underground communication network. Accordingly, all traffic takes place on the surface. The constantly developed rail communication network must also deal with the problems of crossing rivers and watercourses and the coexistence with roadways. Many residents of the city and neighboring towns choose individual transport. The Comprehensive Traffic Survey in Wrocław and the agglomeration analyses commissioned by the Wrocław City Hall in 2018 [35] indicated that 41% of Wrocław’s inhabitants travel around the city by car, 28% by public transport, 6% by bicycle and 24% on foot. Wrocław, as a large economic and academic center, is a place of work and study for many inhabitants of neighboring towns. Among people commuting to the city from up to 20 km, 66% use individual car transport, only 14% use public transport. All the above factors make car traffic in the city very high.
Chalfen and Kamińska [36] estimated that the number of vehicles currently making journeys in the city is around 15,000 from early morning to late afternoon and falls to below 1000 at night. During one hour in peak hour, approximately 40,000 vehicles make journeys in the city. It is estimated that 56% of NO2, 44% of CO and 16% of PM2.5 emissions in Wrocław are emitted from road transportation exhaust gases [37]. At the end of 2019, 119,000 vehicles (passenger cars, trucks and buses, excluding special vehicles) were registered in the city of Wrocław. A further 536.7 thousand vehicles were registered in the Wrocław poviat (nearby towns). Most vehicles run on petrol (47%). In the city, 34%, in the poviat, 41%, of vehicles are powered by a diesel engine. Furthermore, 6.5% and 9.3% of vehicles are fueled with LPG, respectively. The inhabitants of the city of Wrocław (12% of all vehicles) are eight times more likely to use electric or hybrid vehicles than the inhabitants of neighboring towns (2.5%) [38]. The road network of Wrocław consists of 1156.5 km of hard surface roads (852 km of municipal and regional roads and 304.5 km of provincial roads). The road network length index per 1000 inhabitants is 1.82 (km/1000 habitants). There is no heavy industry in Wrocław. The main sources of air pollutant emissions, apart from road transport and domestic heating, are the municipal heat and power plant.
Wrocław is situated in the temperate climatic zone of the northern hemisphere, with a transitional climate type subject to both continental and oceanic influences. Wrocław is one of the warmest cities in Poland with average annual temperature of 10.97 °C (in 2016–2020). Minimum observed temperature was −15.6 °C noted for 2016 winter. Maximum was 36.8 °C in 2019 summer. Prevailing winds are westerly and south-westerly with speed not exceeding 12 m/s.

2.2. COVID-19 in Poland

In Poland, the first confirmed case of COVID-19 infection was recorded on 4 March 2020. On March 10th, the first restrictions were introduced, involving the cancellation of mass events. The number of COVID-19 cases recorded in Poland is presented in Table S1. On March 12th, classes in schools at all levels of education, as well as kindergartens and nurseries, were suspended. Cultural institutions, restaurants, bars, shopping malls and many other activities were closed. An epidemic emergency was declared on March 14th, while epidemic state was introduced on 20 March 2020 [39]. From April 20th, further restrictions were loosened, increasing the limits of people allowed to stay in shops and places of religious worship. The possibility of practicing sports in the open air has been restored. On May 4th, new trade sectors (with a limited number of people) and indoor sports halls were opened. On May 6th, stationary classes in nurseries and kindergartens resumed. On May 18th, beauty salons and restaurants were reopened (‘keeping a distance’ rule was still in force). On May 25th, children from the youngest grades (7–9 years old) returned to full-time education at schools—the remaining pupils and students were educated remotely until the end of the school year. On May 30th, most restrictions were lifted, along with the obligation to cover the mouth and nose in public.

2.3. Data and Methods

These analyses were based on hourly data. The period from 10 March to 30 May equals 1967 h. Due to the significant amount of data, missing records were removed. For the analyzed period from 2020, 96 cases (5.2%) were removed. For the reference period 2016–2019, of 7868 cases (4 y × 1967 h), 355 cases of missing data were removed from at least one variable (4.5%). Extreme values have not been identified.

2.3.1. Traffic

The traffic data are provided by the Traffic and Public Transport Management Department of the Roads and City Maintenance Board in Wrocław. Cameras are used to monitor city traffic in an intelligent transport system (ITS). One of the pieces of information obtained is the number of vehicles passing through the measurement plane on given traffic lanes. This count includes all vehicles passing through that plane (cars, goods vehicles, public transport vehicles). A network of sensors is set up to monitor vehicular traffic at the main intersections of the city road network. In the analyses, the traffic volume was equated with the values measured at the intersection of Hallera St. and Powstańców Śląskich St. (red triangle on Figure 1). The analysis was based on detailed data on the traffic intensity from one intersection, but it is one of the main intersections in the city and changes in the traffic intensity at this intersection are representative for the changes in the intensity throughout the city [36].
Traffic intensity in Wrocław in the following hours of the day shows a classic bimodal distribution with a morning peak at 7–8 a.m. and a more flattened and stretched afternoon peak at 3–5 p.m. In the reference period (2016–2019), the median traffic volume during the day fluctuates around 4500 vehicles, decreasing during the night hours to several hundred (Figure S1). Outliers at 5 am come from different days and years, so there was no reason to consider them as invalid or corrupted in any way. They result from increased morning traffic a few minutes before 6 p.m. Outliers with a low value come from non-working days [40]. In the period from 10 March to 30 May 2020, vehicle traffic in the city was significantly reduced. The average traffic volume, measured by both the median and the average, decreased by 39.5% and 26.3%, respectively (Table 1). The descriptive statistics for each reference year separately are presented in Table S2. The number of vehicles crossing the intersection in question both during the day and at night has decreased. In the hours 7–19, the reduction of the average hourly traffic volume exceeded 1000 vehicles, reaching 1620 vehicles at 9 am. This means a reduction in the number of vehicles by 22% to 37% depending on the hour. At night, the average reduction of vehicle traffic depending on the hour ranged from 6 (5 a.m.) to 934 vehicles (8 p.m.), which means a reduction of 52% for 3 a.m. The characteristics of diurnal variability during the lockdown period were maintained.
As it was mentioned in Section 1, the confirmed fact is that there is a relationship between the traffic volume and the concentration of pollutants in the areas where pollutants are spread from exhaust gases. Therefore, the correlations between the traffic flow and pollution concentrations were examined separately for the reference period (2016–2019) and the analyzed period (2020) (Figure 2). For each type of pollution, in 2020 the negative relationship (negative correlation coefficient values) intensified, but in most cases it was not statistically significant. This means that the impact of traffic flow on the tested air quality has decreased as a result of reducing this traffic flow. For particulate matter, the negative relationship turned out to be statistically significant (increasing traffic flow causes a decrease in PM2.5 concentration). However, it should be remembered at this point that road traffic is not the main source of dust. Along with the decrease in the number of vehicles emitting nitrogen oxides, the positive correlation between the concentration values at traffic stations (W) and background stations (K, B) has increased. This is due to the lower variation of concentrations between stations associated with lower emissions in the vicinity of the traffic measuring station.

2.3.2. Meteorological Data

Meteorological data are provided by the Institute of Meteorology and Water Management (IMGW) at only one station, located on the outskirts of the city (9 km from the city center). The meteorological dataset contains hourly air temperature, wind speed, wind direction, relative humidity and atmospheric pressure. The continental-oceanic nature of Wrocław’s climate is manifested, inter alia, by the typical daily variability of air temperature with a maximum around 1–2 p.m. and a minimum during the morning hours (Figure S2). The analyzed period of 2020 was cooler, characterized by higher air pressure and lower relative humidity than the reference period (2016–2019). The average air temperature in the analyzed period (A) was lower by 1.3 °C (median lower by 0.9 °C) and a maximum equal to 24.1 °C with the maximum on 30 May 2017 equal to 31 °C (Table 2). The wind conditions in both periods were similar with slightly weaker winds in 2020. It can therefore be concluded that weather in the examined period of 2020 was characterized by high weather fronts. Rank-sum Wilcoxon test showed statistically significant differences between the values of the considered meteorological factors in the period from March 10th to May 30th, 2016–2019, and the same period in 2020 (Table 2). All pairs differed statistically significantly at the level of α = 0.05. The meteorological factors descriptive statistics for each reference year separately are presented in Table S3.

2.3.3. Pollution

Pollution data are collected by the Provincial Environment Protection Inspectorate, which operates five measurement stations measuring the concentrations of different pollutants. In this study we focused on NO2, NOx and PM2.5, which are measured at hourly intervals. In the period analyzed, nitrogen oxides measurements were made at three stations (W, K, B), and PM2.5 measurements at two stations (W, K). This selection of data made it possible to compare the concentrations for the traffic measuring station (W) and background measuring stations (K, B) (Figure 1). A detailed analysis of air pollution variability is presented in the next section.

2.3.4. Statistical Methods

Basic descriptive statistics were used for data analysis. Correlations were measured by the Spearman correlation coefficient. It is a non-parametric measure of the monotonic dependency between variables and is not limited to a linear relationship. Equality of medians was tested with the non-parametric Mann–Whitney test also known as Wilcoxon signed rank test recommended in a situation where the data are not normally distributed.

3. Results and Discussions

3.1. Comparing the Air Quality between Roadside and Background Stations before COVID-19 Pandemic

Traffic station W is located right next to the intersection of two main arteries of the city (about 30 m from the center of the intersection). The 2016–2019 annual average daily traffic (AADT) is equal to 66,825 vehicles. Background station K (area type-urban, GPS coordinates: 17.029250 E, 51.129378 N) is located 60 m from the Stara Odra River in the immediate vicinity of urban greenery (within a radius of 60 m) and family housing. Background station B (area type: suburban, GPS coordinates: 17.141125 E, 51.115933 N) is located on the city border, surrounded by fields and standalone single-family housing. The concentration of nitrogen oxides is automatically measured at all three stations. Dust concentrations are measured only at two stations, W and K. There are no production plants emitting significant amounts of pollutants into the air in the vicinity of the measurement stations.
The concentrations of nitrogen oxides are greater the closer the station is to the emission source, which in our case is the city center with complex road network where heavy traffic takes place. The lowest values were recorded at the background station B with the average values of 14.4 and 20.1 μgm−3 for NO2 and NOx, respectively (medians 11.4 and 14.9 1 μgm−3, respectively). At the K city station, the mean values were on average 40% and 33% higher, amounting to 20.2 and 27.11 μgm−3 for NO2 and NOx, respectively (medians 15.1 and 17.8 1 μgm−3, respectively). The highest concentrations were recorded at traffic station W with average values of 48 and 116.2 μgm−3 for NO2 and NOx, respectively (medians 44.3 and 94.6 μgm−3, respectively). During the analyzed period, the permissible NO2 concentration level of 200 μgm−3 was not exceeded. The maximum values of NO2 were 91.5, 114.9 and 159.1 μgm−3 for background B and K and traffic W stations, respectively. At all stations, and therefore for each type of area, there is a clear daily variation in the concentrations of nitrogen oxides (NO2 and NOx). Bimodality is similar to the traffic flow; however, the peaks are more flattened and slightly shifted in time (Figure 3 and Figure 4). The morning peak, as for traffic flow, occurs at 7 a.m., however, the afternoon rush is delayed by about 4 h for the traffic station (19–21), by 5 h for the background station K and 6 h (21–23) for the background station B. The delay of the afternoon peaks is related to the accumulation (station W) and the time of transport of pollutants from the source—the city center to the further areas (stations K and B).
Although road transport is not considered the main source of dust pollution in the study area, the daily variability of PM2.5 concentrations is visible, even more, for traffic station W (Figure 5). The morning dust concentration peak is higher than the afternoon peak (unlike NO2 and NOx). The lowest values and the smallest variability occur in the middle of the day (11–18 h). As mentioned in Section 2.1, in Wrocław, many houses are still heated with solid fuels. The examined period from March to May is still so cold that it requires heating living quarters, especially in the evening and at night, when the air temperature is the lowest. When the residents are away from home, at work, the emissions from domestic heating are low, as opposed to evening hours, at night and in the morning, when the heating must be on to maintain the temperature in the apartment/house. At the K station, this phenomenon is slightly less noticeable for two reasons: the nearby river is an effective ventilation duct, there are no single-family houses in the immediate vicinity and the multi-family building is supplied by the municipal heat sources enterprise.

3.2. Comparing the Air Quality between Roadside and Non-Roadside Stations in First COVID-19 Pandemic Wave

The first wave of the COVID-19 pandemic in Poland fell on 10 March–30 May 2020. Numerous restrictions on commercial, educational, cultural and business activities and the transition of many industries to remote work resulted in many residents remaining at home. This resulted in a reduction in the volume of vehicle traffic (Figure 2) and increased emissions from domestic heating. Despite the reduction in traffic flow on average for the period from 10 March to 30 May by 26%, the daily variability of NO2 and NOx at the roadside station W was maintained with an average reduction of only 6.7 and 10.2%, respectively. Similar to the reference period, the lowest concentrations of nitrogen oxides were recorded at suburban station B (Figure 6).
The daily variability of PM2.5 concentration during the lockdown period is analogous to that for the reference period (Figure 7). Despite the significant shift of work to the home-office mode, lower values of dust concentrations in the middle of the day are still visible (11–18). It has to do with the climate of Wrocław: warmer days but still cold nights in the spring.

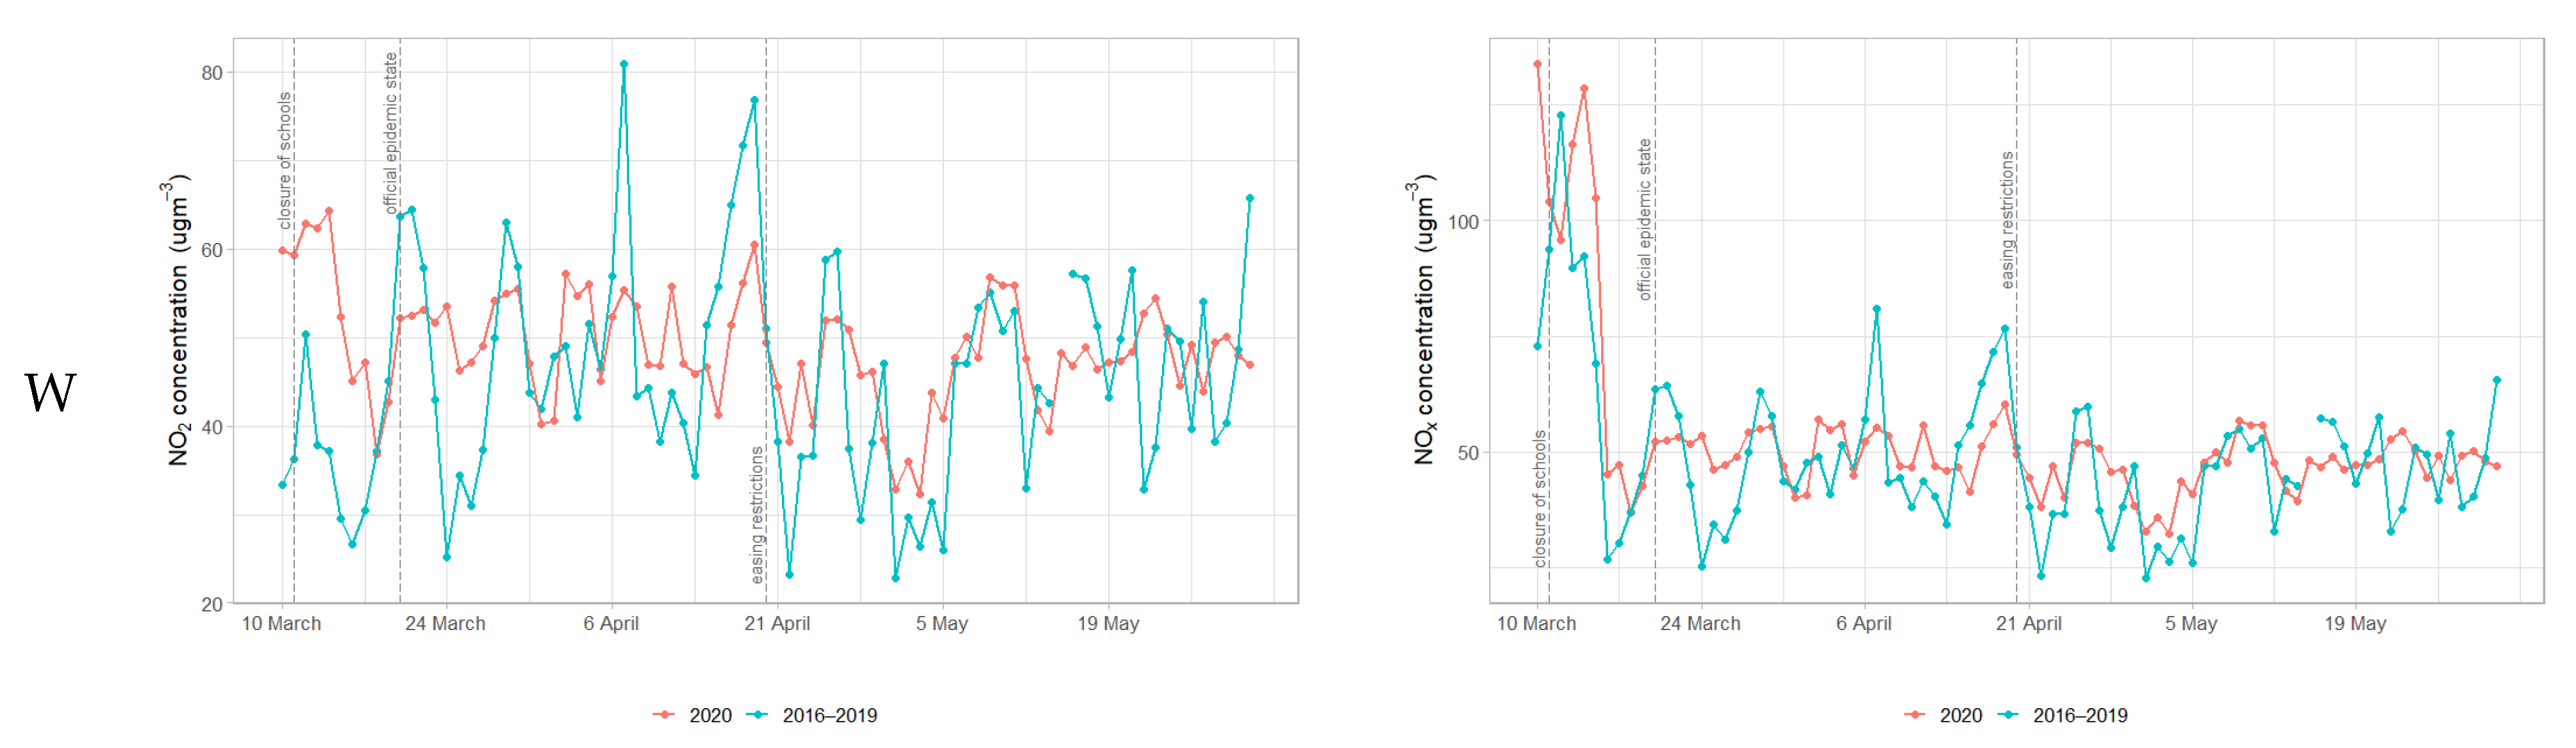
3.3. Air Quality during COVID-19 Pandemic First Wave against the Background of the Period 2016–2019

The comparison of air quality in the period from 10 March to 30 May 2016–2019 and 2020 was made based on average daily values of NO2, NOx and PM2.5 pollutants concentration. Due to the strong relationship between the traffic volume and the concentrations of the analyzed pollutants, the diagrams of the average daily traffic flow values were also presented (Figure 8). There is clearly a period of increasing restrictions and a reduction in mobility (12 March–20 April), which resulted with a rapid reduction in traffic flow by approximately 30%. Filonchyk et al. [28] reports the reduction of motor vehicles on the roads by 25–54% in late March, as compared to the same period of 2019. Weekend days are marked in 2020, with significantly less traffic. In the reference period (2016–2019), this effect was reduced by shifting the days of the week in subsequent years. After April 20th, when the restrictions were gradually loosened, the traffic volume was slowly returning to the reference level. The days of May 1st–3rd are marked in both periods. In Poland there is a period of the so-called long weekend, when May 1st and 3rd are public holidays, and May 2nd is often chosen as a day of vacation. Residents often go on their first spring holidays then, thus traffic in the city is significantly reduced. In the last days of May 2020, the traffic volume had already reached the average values for 2016–2019.
The average daily values of pollutants concentrations at individual stations (Figure 9 and Figure 10) show a clear dependence of the values from 2020 on the day of the week. Weekend days are characterized by lower traffic intensity (Figure 10) and thus lower concentrations of NO2 and NOx. This effect is blurred for the 2016–2019 period on different days of the week that fall on the same date. At suburban station B, the average daily concentrations in 2020 were usually lower (especially at weekends) or equal to the average from the reference period, both for NO2 and NOx. At the stations located in the urban area (W and K), the concentrations of nitrogen oxides during the first wave of the pandemic many times exceeded the values from the reference period, without indicating a generally visible reduction. Mann–Whitney [41] tests of the significance of differences between the concentrations of pollutants in the studied period of 2020 compared to the reference period of 2016–2019 indicated that in each case the concentrations differed significantly at the level of α = 0.05. The highest reduction of the average concentration of NO2 and NOx was recorded at station B farthest from the city center, characterized by the lowest concentrations (Figure 11), being the least influenced by the direct impact of gases emitted by vehicles: 20.1% and 22.4%, respectively. An approximately three times smaller reduction in the average concentration of NO2 and NOx was recorded at the background municipal station K (7.9% and 7.7%, respectively) and the communication station W (6.7% and 10.2%). This means that the positive effect of reducing traffic volume had the most favorable impact on the city’s surrounding areas, and much less on the air quality in the very center of the city. A similar, though farther-reaching conclusion was made by Rudke [15], according to which for 1 January–30 June period the Mann–Whitney U test was used to assess the heterogeneity of the air quality data during and before mobility restrictions. In general, the results demonstrated no substantial improvements in air quality for most of the pollutants when comparing before and during restrictions periods. Besides, when the analyzed period of 2020 is compared with the year 2019, there is no significant air quality improvement in the state of São Paulo.
The average daily concentrations of particulate matters have a strong relationship with the meteorological conditions in Wrocław—the days are getting warmer and warmer—and thus there is a lower demand for additional heating of flats and reduction of low emissions (Figure 10). High concentrations occur mainly on non-working days, when residents spend the entire day at home and heat it more intensively. The first 9 days of the analyzed period were warm (day temperature was above 10 °C) resulting in a reduced demand for domestic heating. Higher values of average concentrations in the reference period are the result of aggregating by averaging over 4 years of data, i.e., no influence of meteorological conditions in one specific year could be seen. On 21 March 2020, the daytime temperature dropped below 5 °C and negative temperatures were recorded at night, which resulted in the intensification of heating and, as a result, an increase in PM2.5 concentration. Due to the small impact of traffic intensity on the concentration of PM2.5 in Wrocław [7], the reduction in the average values in 2020 is similar for the traffic station (W) and the urban background station (K), amounting to 15 and 13.4%, respectively. Similar PM2.5 reduction (15.8%) in Bangkok (compared to the period of 2019) was noted by Wetchayont [42].

3.4. Air Pollution after COVID-19 Pandemic First Wave (2021)

In order to assess the long-term impact of the restrictions resulting from the COVID-19 pandemic on air quality in the example of Wrocław, the concentrations of the tested pollutants in the corresponding period of 2021were considered. Concentrations of NO2 in the studied period from March 10 to 31 May in 2021 differed slightly from those in 2020. The constant reduction of the average by 1.76 μgm−3 (9.3%) was recorded at the city station K and 0.46 μgm−3 (3.9%) at suburban station B. At the traffic station, despite the lack of restrictions on movement, in 2021 the average NO2 concentration remained the same as in 2020. This phenomenon is related to the changing structure of vehicles. More and more restrictive exhaust emission standards that must be met by newly manufactured cars, along with the systematically decreasing number of old, much less environmentally friendly vehicles are resulting in air quality in Wrocław improving each year (Figure 13). The fastest reduction in annual mean concentrations is observed at traffic station W, equal to 1.77 μgm−3 per year. Furthermore, a statistically significant decrease in annual averages was recorded at the city station K of 0.6 μgm−3 per year. The situation is similar for the average annual NOx concentrations: reduction by 6.1 μgm−3 annually at the W station and 1.1 μgm−3 annually at the K station—both are statistically significant. For both pollutants, no statistically significant changes were recorded in the annual mean at suburban station B. This observation confirms the strong relationship of nitrogen oxide concentrations with the vicinity of road transport arteries.
The situation is completely different for NOx (total concentration of NO2 and NO), showing a double increase in the average concentration in the period 10 March–31 May 2021 compared to the same period in 2020 and the previous one at traffic station W (Figure 11). There was a slight reduction in NO2 concentration, which means that in the considered period of 2021, the concentration of NO drastically increased. The explanation for this phenomenon is the prevailing weather conditions in the spring of 2021. Spring 2021 was extremely cold and rainy. In the analyzed period of 2020, a total of 1992 h of solar was recorded, and in 2021, only 485 h in the same period. Sunlight (photons) plays an important role in the chemical changes between NO, NO2 and ozone [43,44,45]. The difference in air conditions is also determined by the ozone concentration in the studied periods of both years. The average concentration of O3 in the research period in 2020 was equal to 67.8 and 72.6 μgm−3 at the stations: suburban-B and urban-K, respectively. In the same period in 2021, the average O3 concentration at both stations was lower, equal to 60.8 and 62.1 μgm−3, respectively. The concentrations of the gases considered here, due to the dynamically occurring chemical reactions between them seek the photostationary state, are related to the following equation [46]:
[ N O ] · [ O 3 ] [ N O 2 ] = J k
where J is the rate of NO2 photolysis and k is the rate coefficient for the reaction of NO with O3. The value of the J/k quotient changes during the day, reaching a minimum at night and a maximum slightly before noon [46]. The J ratio depends on the angle of incidence of the sun’s rays (characteristic for a given location) and the sunshine duration with a positive correlation [47]. Coefficient k varies as an exponential function of daily mean temperature (T) of the form:
k = c o n s t · e x p ( c o n s t T )
Most of the NOx in vehicles exhaust gases is NO (up to 95%). The majority of NO2 are pollutants derived from the oxidation of NO. Due to the short sunny and cold period of 2021, chemical transformations were much less intense (compared to the period of 2020) and fewer NO particles were oxidized. This state was maintained throughout the studied period, with particular intensity from 16 to 31 March (Figure 12). As a result, drastically higher concentrations of NO were observed in the studied period of 2021 (Figure 13).
The concentrations of PM2.5 particulate matter are decreasing over the years (Figure 13). It is caused mainly due to the state and city policy aimed at reducing the heating of houses with solid fuels to zero in 2024, which are the main source of these pollutants. Each year, a further several thousand solid fuel stoves are replaced with ecological stoves or the premises are connected to the municipal heating network. Therefore, in terms of PM2.5 concentration, it is difficult to talk about the perceptible impact of reduced mobility on air quality.
Summarizing the above analysis, it can be concluded that restrictions on the movement of the population, the recorded reduction in traffic in the period from 10 March to 31 May 2020 did not significantly affect the overall air quality in Wrocław. The graphs in Figure 13 show the average annual concentrations of NO2 and NOx in the years covered by the research at the measuring stations analyzed in the paper. There are clearly decreasing trends for both NO2 and NOx at traffic station W. Average annual concentrations in 2020 do not differ significantly from the generally observed trend. Shi et al. [48] came to similar conclusions saying that true air quality improvements were notably more limited than some earlier reports or observational data suggested. It can therefore be concluded that the lockdown, which was very noticeable to citizens during the first wave of COVID-19, caused a slight fluctuation in air quality, which had no consequences both throughout 2020 and over next years. This conclusion is important for local authorities, who have the task of introducing actions to improve the quality of inhabitants’ lives [49,50] by, inter alia, improving the quality of the air inhabitants breathe. The conducted analysis shows that the actions aimed at limiting vehicle traffic must be long-term in order to be able to expect a lasting improvement in air quality.

4. Conclusions

The paper presents an analysis of air quality measured by concentrations of NO2, NOx and PM2.5 during the most restrictive lockdown on 10 March–31 May 2020 caused by the COVID-19 pandemic outbreak on the example of Wrocław (Poland, Europe). The results were compared with the reference period of 2016–2019. A significant reduction in traffic volume was identified, on average by 26.3%. Mann–Whitney’s statistical tests showed statistically significant differences between the concentrations of pollutants in the studied period of 2020 compared to the reference period of 2016–2019. The greatest reduction in the average concentrations of NO2 and NOx were recorded at the suburban station (B) farthest from the city center, characterized by the lowest concentrations: 20.1 and 22.4%, respectively. An approximately three times lower percentage reduction in the average concentration of NO2 and NOx was recorded at background municipal station K (7.9 and 7.7%, respectively) and communication station W (6.7 and 10.2%). Concentrations of particulate matters in 2020 were on average 15 and 13.4% lower than in the reference period for the traffic station and municipal background station K, respectively. PM2.5 concentrations in Wrocław ared mainly a result of the intensity of domestic heating in premises heated with solid fuel.
The long-term impact of the lockdown on air quality in Wrocław was also examined. The analysis of the concentrations of the tested pollutants throughout 2020, as well as in the analyzed period of 2021, indicated that the reduction of pollutant concentrations and the improvement in air quality caused by the restrictions related to the COVID-19 pandemic should be considered a temporary anomaly, without affecting long-term changes and trends.

Supplementary Materials

The following are available online at https://www.mdpi.com/article/10.3390/atmos12121549/s1, Figure S1: Traffic volume hourly variability in 10 March to 30 May: 2020 and 2016–2019, Figure S2: Meteorological conditions hourly variability on 10 March to 30 May: 2020 and 2016–2019. Table S1: Number of confirmed cases of infection with COVID-19 disease in Poland in the period 10 March to 30 May 2020, Table S2: Descriptive statistics for traffic flow (veh) during each year of reference period (10 March to 30 May 2016–2019), Table S3: Descriptive statistics for meteorological conditions during each year of reference period (10 March to 30 May 2016–2019).

Author Contributions

Conceptualization, J.A.K.; methodology, J.A.K.; software, J.A.K. and T.T.; validation, J.A.K.; formal analysis, J.A.K. and T.T.; investigation, J.A.K.; resources, J.A.K.; data curation, J.A.K., T.T. and E.D.; writing—original draft preparation, J.A.K. and T.T.; writing—review and editing, J.A.K. and E.D.; visualization, J.A.K. and E.D. All authors have read and agreed to the published version of the manuscript.

Funding

This research received no external funding.

Institutional Review Board Statement

Not applicable.

Conflicts of Interest

The authors declare no conflict of interest. The funders had no role in the design of the study; in the collection, analyses, or interpretation of data; in the writing of the manuscript, or in the decision to publish the results.

References

  1. Soga, M.; Evans, M.J.; Cox, D.T.C.; Gaston, K.J. Impacts of the COVID-19 pandemic on human–nature interactions: Pathways, evidence and implications. People Nat. 2021, 3, 518–527. [Google Scholar] [CrossRef]
  2. McNeely, J.A. Nature and COVID-19: The pandemic, the environment, and the way ahead. Ambio 2021, 50, 767–781. [Google Scholar] [CrossRef] [PubMed]
  3. Budiman, I.; Kusumaratna, R.K. Human-nature interactions through the lens of global pandemics: A review. Ekol. Cheloveka (Hum. Ecol.) 2021, 4, 15–24. [Google Scholar] [CrossRef]
  4. Aldrin, M.; Haff, I.H. Generalized additive modelling of air pollution, traffic volume and meteorology. Atm. Environ. 2005, 39, 2145–2155. [Google Scholar] [CrossRef]
  5. Bertaccini, P.; Dukic, V.; Ignaccolo, R. Modeling the Short-Term Effect of Traffic and Meteorology on Air Pollution in Turin with Generalized Additive Models. Adv. Meteorol. 2012, 2012, 609328. [Google Scholar] [CrossRef]
  6. Catalano, M.; Galatioto, F.; Bell, M.; Namdeo, A.; Bergantino, A.S. Improving the prediction of air pollution peak episodes generated by urban transport networks. Environ. Sci. Policy 2016, 60, 69–83. [Google Scholar] [CrossRef] [Green Version]
  7. Kamińska, J.A. The use of random forests in modelling short-term air pollution effects based on traffic and meteorological conditions: A case study in Wrocław. J. Environ. Manag. 2018, 217C, 164–174. [Google Scholar] [CrossRef]
  8. Laña, I.; Del Ser, J.; Pedró, A.; Vélez, M.; Casanova-Mateo, C. The role of local urban traffic and meteorological conditions in air pollution: A data-based study in Madrid, Spain. Atmos Environ. 2016, 145, 424–438. [Google Scholar] [CrossRef]
  9. Sayegh, A.; Tate, J.A.; Ropkins, K. Understanding how roadside concentrations of NOx are influenced by the background levels, traffic density, and meteorological conditions using Boosted Regression Trees. Atmos. Environ. 2016, 127, 163–175. [Google Scholar] [CrossRef]
  10. Kamińska, J.A.; Turek, T. Explicit and implicit description of the factors impact on the NO2 concentration in the traffic corridor. Archiv. Environ. Prot. 2020, 46, 93–99. [Google Scholar] [CrossRef]
  11. Liu, F.; Wang, M.; Zheng, M. Effects of COVID-19 lockdown on global air quality and health. Sci. Total Environ. 2021, 755 Pt 1, 142533. [Google Scholar] [CrossRef] [PubMed]
  12. Gao, C.; Li, S.; Liu, M.; Zhang, F.; Achal, V.; Tu, Y.; Zhang, S.; Cai, C.; Chen, Z.; Hao, X.; et al. Have traffic restrictions improved air quality? A shock from COVID-19. J. Clean. Prod. 2021, 279, 123622. [Google Scholar] [CrossRef]
  13. Bao, R.; Zhang, A. Does lockdown reduce air pollution? Evidence from 44 cities in Northern China. Sci. Total Environ. 2020, 731, 139052. [Google Scholar] [CrossRef] [PubMed]
  14. Ding, J.; Dai, Q.; Li, Y.; Han, S.; Zhang, Y.; Feng, Y. Impact of meteorological condition changes on air quality and particulate chemical composition during the COVID-19 lockdown. J. Environ. Sci. 2021, 109, 45–56. [Google Scholar] [CrossRef]
  15. Rudke, A.P.; Martins, J.A.; de Almeida, D.S.; Martins, L.D.; Beal, A.; Hallak, R.; Freitas, E.D.; Andrade, M.F.; Foroutan, H.; de Baek, B.H.A.; et al. How mobility restrictions policy and atmospheric conditions impacted air quality in the State of São Paulo during the COVID-19 outbreak. Environ. Res. 2021, 198, 111255. [Google Scholar] [CrossRef] [PubMed]
  16. Brown, L.; Barnes, J.; Hayes, E. Traffic-related air pollution reduction at UK schools during the COVID-19 lockdown. Sci. Total Environ. 2021, 780, 146651. [Google Scholar] [CrossRef]
  17. Gao, C.; Li, S.; Liu, M.; Zhang, F.; Achal, V.; Tu, Y.; Cai, C. Impact of the COVID-19 pandemic on air pollution in Chinese megacities from the perspective of traffic volume and meteorological factors. Sci. Total Environ. 2021, 773, 145545. [Google Scholar] [CrossRef]
  18. Islam, M.S.; Rahman, M.; Tusher, T.R.; Roy, S.; Razi, M.A. Assessing the Relationship between COVID-19, Air Quality, and Meteorological Variables: A Case Study of Dhaka City in Bangladesh. Aerosol Air Qual. Res. 2021, 21, 200609. [Google Scholar] [CrossRef]
  19. Khan, Y.A. The COVID-19 pandemic and its impact on environment: The case of the major cities in Pakistan. Environ. Sci. Pollut. Res. Int. 2021, 28, 54728–54743. [Google Scholar] [CrossRef]
  20. Wu, C.; Wang, H.; Cai, W.; He, H.; Ni, A.; Peng, Z. Impact of the COVID-19 lockdown on roadside traffic-related air pollution in Shanghai, China. Build. Environ. 2021, 194, 107718. [Google Scholar] [CrossRef]
  21. Berman, J.D.; Ebisu, K. Changes in U.S. air pollution during the COVID-19 pandemic. Sci. Total Environ. 2020, 739, 139864. [Google Scholar] [CrossRef]
  22. Al-Abadleh, H.A.; Lysy, M.; Neil, L.; Patel, P.; Mohammed, W.; Khalaf, Y. Rigorous quantification of statistical significance of the COVID-19 lockdown effect on air quality: The case from ground-based measurements in Ontario, Canada. J. Hazard. Mater. 2021, 413, 125445. [Google Scholar] [CrossRef]
  23. Gamma, C.; Relvas, H.; Lopes, M.; Monteiro, A. The impact of COVID-19 on air quality levels in Portugal: A way to assess traffic contribution. Environ. Res. 2021, 193, 110515. [Google Scholar] [CrossRef]
  24. Mishra, G.; Ghosh, K.; Dwivedi, A.K.; Kumar, M.; Kumar, S.; Chintalapati, S.; Tripathi, S.N. An application of probability density function for the analysis of PM2.5 concentration during the COVID-19 lockdown period. Sci. Total Environ. 2021, 782, 146681. [Google Scholar] [CrossRef]
  25. Marinello, S.; Butturi, M.A.; Gamberini, R. How changes in human activities during the lockdown impacted air quality parameters: A review. Environ. Prog. Sust. Energy 2021, 40, e13672. [Google Scholar] [CrossRef]
  26. [Age Structure of the Vehicle Park in Poland]. Available online: https://www.auto-swiat.pl/wiadomosci/aktualnosci/sredni-wiek-samochodow-w-europie-polska-jak-zwykle-na-szarym-koncu/b5e8msq (accessed on 12 August 2021).
  27. Rogulski, M.; Badyda, A. Air Pollution Observations in Selected Locations in Poland during the Lockdown Related to COVID-19. Atmosphere 2021, 12, 806. [Google Scholar] [CrossRef]
  28. Filonchyk, M.; Hurynovich, V.; Yan, H. Impact of COVID-19 Pandemic on Air Pollution in Poland Based on Surface Measurements and Satellite Data. Aerosol Air Qual. Res. 2021, 21, 200472. [Google Scholar] [CrossRef]
  29. Sangkham, S.; Thongtip, S.; Vongruang, P. Influence of air pollution and meteorological factors on the spread of COVID-19 in the Bangkok Metropolitan Region and air quality during the outbreak. Environ. Res. 2021, 197, 111104. [Google Scholar] [CrossRef] [PubMed]
  30. Amnuaylojaroen, T.; Parasin, N. The Association between COVID-19, Air Pollution, and Climate Change. Front. Public Health 2021, 9, 662499. [Google Scholar] [CrossRef] [PubMed]
  31. Chen, R.; Zhang, T.; Guo, Y.; Wang, J.; Wei, J.; Yu, Q. Recent advances in simultaneous removal of SO2 and NOx from exhaust gases: Removal process, mechanism and kinetics. Chem. Eng. J. 2021, 420, 127588. [Google Scholar] [CrossRef]
  32. Tzanis, C.G.; Alimissis, A.; Philippopoulos, K.; Deligiorgi, D. Applying linear and nonlinear models for the estimation of particulate matter variability. Environ. Pollut. 2019, 246, 89–98. [Google Scholar] [CrossRef]
  33. Cabaneros, S.M.L.S.; Calautit, J.K.S.; Hughes, B.R. Hybrid Artificial Neural Network Models for Effective Prediction and Mitigation of Urban Roadside NO2. Energy Procedia 2017, 142, 3524–3530. [Google Scholar] [CrossRef]
  34. Książek, S.; Suszczewicz, M. City profile: Wrocław. Cities 2017, 65, 51–65. [Google Scholar] [CrossRef]
  35. [Comprehensive Traffic Survey]. Available online: https://www.wroclaw.pl/srodowisko/wyniki-kompleksowego-badania-ruchu-we-wroclawiu-i-aglomeracji-2018 (accessed on 12 August 2021).
  36. Chalfen, M.; Kamińska, J.A. Identification of parameters and verification of an urban traffic flow model. A case study in Wrocław. XLVIII Seminar of Applied Mathematics. ITM Web Conf. 2018, 23, 00005. [Google Scholar] [CrossRef]
  37. Information on Air Quality in Wrocław 2016. Provincial Environment Protection Inspectorate, Wrocław. Available online: https://www.wroclaw.pios.gov.pl/pliki/powietrze/powietrze_wroclaw_2015_wios.pdf (accessed on 10 September 2021).
  38. [Statistics Poland]. Available online: https://bdl.stat.gov.pl/BDL/dane/podgrup/tablica (accessed on 12 August 2021).
  39. Kazak, J.K.; Szewranski, S.; Pilawka, T.; Tokarczyk-Dorociak, K.; Janiak, K.; Swiader, M. Changes in water demand patterns in a European city due to restrictions caused by the COVID-19 pandemic. Desalination Water Treat. 2021, 222, 1–15. [Google Scholar] [CrossRef]
  40. Kamińska, J.A. A random forest partition model for predicting NO2 concentrations from traffic flow and meteorological conditions. Sci. Total Environ. 2019, 651, 475–483. [Google Scholar] [CrossRef]
  41. Mann, H.B.; Whitney, D.R. On a Test of Whether one of Two Random Variables is Stochastically Larger than the Other. Ann. Math. Stat. 1947, 18, 50–60. [Google Scholar] [CrossRef]
  42. Wetchayont, P. Investigation on the impacts of COVID-19 lockdown and influencing factors on air quality in greater Bangkok, Thailand. Adv. Meteorol. 2021, 6697707. [Google Scholar] [CrossRef]
  43. Kimbrough, S.; Owen, R.C.; Snyder, M.; Richmond-Bryant, J. NO to NO2 Conversion Rate Analysis and Implications for Dispersion Model Chemistry Methods using Las Vegas, Nevada Near-Road Field Measurements. Atmos. Environ. 2017, 165, 23–24. [Google Scholar] [CrossRef] [PubMed]
  44. Sillman, S.; He, D. Some theoretical results concerning O3-NOx-VOC chemistry and NOx-VOC indicators. J. Geophys. Res. 2002, 107, 4659. [Google Scholar] [CrossRef] [Green Version]
  45. Khalil, M.A.K. Steady states and transport processes in urban ozone balances. Clim. Atmos. Sci. 2018, 1, 22. [Google Scholar] [CrossRef] [Green Version]
  46. Han, S.Q.; Bian, H.; Feng, Y.C.; Liu, A.X.; Li., X.J.; Zeng, F.; Zhang, X.L. Analysis of the relationship between O3, NO and NO2 in Tianjin, China. Aerosol Air Qual. Res. 2011, 11, 128–139. [Google Scholar] [CrossRef] [Green Version]
  47. Trebs, I.; Bohn, B.; Ammann, C.; Rummel, U.; Blumthaler, M.; Königstedt, R.; Meixner, F.X.; Fan, S.; Andreae, M.O. Relationship between the NO2 photolysis frequency and the solar global irradiance. Atmos. Meas. Tech. 2009, 2, 725–739. [Google Scholar] [CrossRef] [Green Version]
  48. Shi, Z.; Song, C.; Liu, B.; Lu, G.; Xu, J.; Van Vu, T.; Elliott, R.J.R.; Li, W.; Bloss, W.J.; Harrison, R.M. Abrupt but smaller than expected changes in surface air quality attributable to COVID-19 lockdowns. Sci. Adv. 2021, 7, eabd6696. [Google Scholar] [CrossRef]
  49. Kazak, J.; Chalfen, M.; Kamińska, J.; Szewrański, S.; Świąder, M. Geo-Dynamic Decision Support System for Urban Traffic Management. In Dynamics in GIscience. GIS Ostrava 2017; Ivan, I., Horak, J., Inspektor, T., Eds.; Lecture Notes in Geoinformation and Cartpgraphy; Springer: Cham, Switzerland, 2018; pp. 195–207. ISBN 978-3-319-61296-6. [Google Scholar] [CrossRef]
  50. Leśniewski, M.; Świąder, M.; Kaczmarek, I.; Castro, D.G.; Kamińska, J.A.; Pilawka, T.; Kazak, J.K. Towards Transit–Oriented Development for Sustainable Urban Mobility: Insights from a Central European City. Geomat. Environ. Eng. 2021, 15, 39–53. [Google Scholar] [CrossRef]
Figure 1. Wrocław city and its location on Poland map. Red triangle—traffic station, blue dots—air pollution measuring stations.
Atmosphere 12 01549 g001
Figure 2. Spearman correlation coefficients between pollution concentrations and traffic flow for reference period 2016–2019 (left side) and analyzed period 2020 (right side); B, K—background stations, W—traffic station.
Atmosphere 12 01549 g002
Figure 3. Nitrogen dioxide hourly variability from 10 March to 30 May 2016–2019.
Atmosphere 12 01549 g003
Figure 4. Nitrogen oxide hourly variability from 10 March to 30 May 2016–2019.
Atmosphere 12 01549 g004
Figure 5. Particulate matter hourly variability from 10 March to 30 May 2016–2019.
Atmosphere 12 01549 g005
Figure 6. Nitrogen dioxide hourly variability from 10 March to 30 May 2020: NO2 on the left and NOx on the right side.
Atmosphere 12 01549 g006
Figure 7. PM2.5 hourly variability from 10 March to 30 May 2020.
Atmosphere 12 01549 g007
Figure 8. Average daily values of traffic flow.
Atmosphere 12 01549 g008
Figure 9. Average daily values of NO2 and NOx concentrations at three research stations—B and K background and W traffic.
Atmosphere 12 01549 g009aAtmosphere 12 01549 g009b
Figure 10. Average daily values of PM2.5 concentrations at two research stations—K background (left) and W traffic (right).
Atmosphere 12 01549 g010
Figure 11. Average values of concentrations of air pollutants in the period 10 March–31 May 31 with standard deviation.
Atmosphere 12 01549 g011
Figure 12. Average daily values of NOx concentrations in the period 10 March–31 May.
Atmosphere 12 01549 g012
Figure 13. Annual average NO2 and NOx concentrations with trend lines, 2020 marked by red frame.
Atmosphere 12 01549 g013
Table 1. Descriptive statistics for traffic flow during reference period R (10 March–30 May 2016–2019) and analyzed period A (10 March–30 May 2020).
VariableMinMedianAverageMaxp-Value
RARARARA
Traffic flow (veh)056321919472786
(1810)
2053
(1463)
580948490.000000
In brackets (standard deviation).
Table 2. Descriptive statistics for meteorological conditions during reference period R (10 March–30 May 2016–2019) and analyzed period A (10 March–30 May 2020).
VariableMinMedianAverageMaxp-Value
RARARARA
Air temperature (°C)−7.9−6.211.110.211.1
(3.39)
9.8
(5.99)
31.024.10.000000
Wind speed (m/s)003.03.03.21
(1.99)
2.92
(1.69)
12100.000000
Wind direction (deg)00220246193
(107)
199
(115)
3603600.049400
Relative humidity (%)2217705768.0
(20.30)
58.0
(18.36)
99970.000000
Water vapor pressure (hPa)1.92.096.89.24
(3.23)
7.17
(2.85)
2216.80.000000
Air pressure (hPa)983.9987.81000.51006.71001.1
(7.44)
1005.7
(8.11)
1020.31024.40.000000
In brackets (standard deviation).
Publisher’s Note: MDPI stays neutral with regard to jurisdictional claims in published maps and institutional affiliations.

