
Turbulence in Large-Scale Two-Dimensional Balanced Hard Sphere Gas Flow


Department of Mathematics, Statistics and Computer Science, University of Illinois at Chicago, 851 S. Morgan St., Chicago, IL 60607, USA
Atmosphere 2021, 12(11), 1520; https://doi.org/10.3390/atmos12111520
Submission received: 20 October 2021
/
Revised: 12 November 2021
/
Accepted: 15 November 2021
/
Published: 18 November 2021
(This article belongs to the Special Issue Structure of Atmospheric Turbulence)
Abstract
:In recent works, we developed a model of balanced gas flow, where the momentum equation possesses an additional mean field forcing term, which originates from the hard sphere interaction potential between the gas particles. We demonstrated that, in our model, a turbulent gas flow with a Kolmogorov kinetic energy spectrum develops from an otherwise laminar initial jet. In the current work, we investigate the possibility of a similar turbulent flow developing in a large-scale two-dimensional setting, where a strong external acceleration compresses the gas into a relatively thin slab along the third dimension. The main motivation behind the current work is the following. According to observations, horizontal turbulent motions in the Earth atmosphere manifest in a wide range of spatial scales, from hundreds of meters to thousands of kilometers. However, the air density rapidly decays with altitude, roughly by an order of magnitude each 15–20 km. This naturally raises the question as to whether or not there exists a dynamical mechanism which can produce large-scale turbulence within a purely two-dimensional gas flow. To our surprise, we discover that our model indeed produces turbulent flows and the corresponding Kolmogorov energy spectra in such a two-dimensional setting.
1. Introduction
In his famous work, Reynolds [1] demonstrated that an initially laminar flow of a liquid consistently develops turbulent motions whenever the high Reynolds number condition is satisfied. Later, Kolmogorov [2,3,4] and Obukhov [5,6,7] observed that the time-averaged Fourier spectra of the kinetic energy of an atmospheric flow possess a universal decay structure, corresponding to the inverse five-thirds power of the Fourier wavenumber. With the help of detailed measurements from the Global Atmospheric Sampling Program, Nastrom and Gage [8] estimated the energy spectra of meridional and zonal atmospheric winds, and found that the spectra exhibited the inverse cubic power scaling at large scales, and the inverse five-thirds power scaling at moderate and small scales. As of yet, the physics of turbulence formation in a laminar flow, as well as the origin of power scaling of turbulent kinetic energy spectra, remain unknown.
In our recent work [9], we considered a system of many particles, each of mass m, interacting solely via a repelling short-range potential , with the convention that as . In the limit of infinitely many such particles, we obtained, via the standard Bogoliubov–Born–Green–Kirkwood–Yvon (BBGKY) formalism [10,11,12], the following Vlasov-type equation [13] for the mass-weighted distribution density of a single particle :
Above, the mean field potential is given via
The quantities , p and are the mass density, pressure and kinetic temperature of f, respectively, given, together with the mean velocity , via
Further, computing the usual hierarchy of the transport equations for the velocity moments of f, and closing it under the infinite Reynolds number assumption, in [9], we arrived at the following equations for a balanced compressible gas flow:
The difference between the equations above and the conventional compressible Euler equations [14,15] is that the former preserve the pressure p along the stream lines (balanced flow), and have the mean field forcing in the momentum equation.
In [9], we numerically simulated the equations in (4) for a gas of hard spheres with the mass and diameter corresponding to those of argon, flowing through a straight three-dimensional pipe. For the initial condition of this simulation, we selected a straight laminar Bernoulli jet, which is a steady state in the conventional Euler equations. We observed, however, that in our model (4), such a jet quickly develops into a fully turbulent flow. We also examined the Fourier spectrum of the kinetic energy of the simulated flow, and found that its time average decayed with the rate of inverse five-third power of the wavenumber, which corresponded to the famous Kolmogorov spectrum.
The main goal of the current work is to develop and test a similar framework for a gas flow under a strong gravity acceleration, which, on a large scale, is effectively two-dimensional, and, therefore, it may be impractical to introduce the vertical direction from the computational perspective. While it is obvious that such a two-dimensional flow, by its simplified nature, lacks many features of a full three-dimensional flow (even with the latter confined to a relatively thin slab), our goal here is to examine whether or not turbulent features could manifest in such a simplified two-dimensional model, which is severely restricted in other physical aspects by its own low dimensionality. This is important, in particular, for long-range climate prediction models, where the restricted dimension may be necessitated by the requirement of a long-range simulation.
The work is organized as follows. In Section 2, we derive the Vlasov equation, which incorporates an external acceleration in a potential form. In Section 3, we assume that the strong constant external acceleration is applied in the vertical direction, and further arrive at the system of equations for a balanced flow, confined to a horizontal plane. In Section 4, we show the results of numerical simulations of a large-scale flow in two scenarios—one is an inertial jet, and another is a cyclostrophic vortex. We observe that turbulent motions with Kolmogorov spectra manifest in both scenarios from laminar initial conditions. Section 5 summarizes the results of the work.
2. The Vlasov-Type Equation with External Acceleration
Here, we repeat the derivation of the Vlasov-type equation in (1) for the motion of particles under an external acceleration. In the presence of an external acceleration, the equations of motion for N particles interacting via a potential are given via
where is the external acceleration that acts on any particle at the location , and depends only on the coordinates of that particle. Further, we will assume that is a potential acceleration; that is, there exists a potential function such that . As in our previous works [9,16], we concatenate
Additionally, due to the presence of the external acceleration, here, we concatenate
In the new notations, the Liouville equation for the density of states is given via
Due to the presence of the external acceleration, the total momentum of the system is no longer a first integral. However, due to the fact that is a potential acceleration, the total energy E of the system remains an invariant of motion:
Therefore, similarly to [9,16], any suitable function of the form
is automatically a steady state of the Liouville equation in (8). Among those functions, the canonical Gibbs equilibrium state is given via
where is the equilibrium kinetic temperature of the system. For the purpose of the work, below, we will assume that the gas is dilute (that is, the mean free path of a particle is much larger than the range of the potential interaction), and thus the contribution of to the integral for is negligible:
The latter leads to the following form of the canonical Gibbs state for a dilute gas:
2.1. Preservation of the Rényi Divergences
Despite the presence of the external acceleration, it can be easily shown that the Liouville equation in (8) still preserves the family of general Rényi divergences [17], as long as the integration by parts is not affected by the boundary conditions. Indeed, for two differentiable functions and , we have
Choosing , for some parameter leads to the preservation of the Rényi divergence :
The Kullback–Leibler divergence [18] is a special case of the Rényi divergence with . As we noted in [9,16], the preservation of the Rényi divergences plays a similar role to Boltzmann’s H-theorem—that is, if the initial state of F is close to in the sense of any Rényi metric, then the solution will also remain a nearby state.
2.2. Joint Two-Particle Marginal Distribution of the Gibbs State
In what follows, it is important to note the structure of the joint two-particle marginal distribution of the Gibbs state for a dilute gas in (13). Integrating in (13) over all particles but the first two, and taking advantage of the dilute gas assumption, one easily obtains
where is the Gibbs state for a single particle. Here, note that, even at a thermodynamic equilibrium, the particles in a pair cannot be regarded as being independent, since there is a spatial correlation term through the interaction potential .
2.3. Transport Equation for a Single Particle
We denote the marginal distribution for the first particle via f, that is,
where, for convenience, we drop the subscripts from and . We then integrate the Liouville equation in (8) over :
where is the joint distribution of the first and i-th particles, that is,
and , serve as dummy variables of integration for the coordinate and velocity, respectively, of the i-th particle. Observe that there cannot be any boundary effects in the velocity integration, because, realistically, F and its derivatives must vanish at infinite velocities. However, there could still be boundary effects in the spatial integration, since the spatial domain is generally bounded, and the presence of the external acceleration introduces spatial anisotropy. Thus, we retain the terms with spatial derivatives of the joint two-particle distribution in the equation for now.
2.4. A Closure for the Single Particle Transport Equation
To obtain the transport equation for f alone, we need to express via f. For this, a standard assumption is that all pairs of particles are identically distributed [9,19], so that the transport equation becomes
Following our recent work [9], we assume that has the same form as its corresponding equilibrium Gibbs distribution, that is
Here, the kinetic temperature can no longer be regarded as being at equilibrium, and, instead, we take it at the midpoint between the two particles, for symmetry.
Next, we renormalize f so that it becomes the mass density—that is, . This leads, as , to
where we integrated the product over and obtained , according to (3). Via the divergence theorem, the volume integral in the right-hand side can be expressed as the surface integral over the domain boundary S,
where is the net inward momentum flux through the boundary. Above, we note that is located inside the domain, while is on the boundary, which allows us to set the exponential to 1 as long as the range of potential is sufficiently short. This leads to
In a practical scenario, we can assume that the net momentum flux through the boundary is zero; indeed, if we have a horizontal slab domain with strong gravity and impenetrable bottom, the momentum fluxes through the top and bottom are zero (the former due to exponentially vanishing density, the latter due to impenetrability), and we can additionally assume that the net momentum flux through the sides is also zero if the total amount of the gas particles inside our domain remains fixed. This further leads to the following Vlasov-type equation for f with an external acceleration:
3. The Two-Dimensional Moment Equations in the Presence of Gravity
Here, we are going to assume that the vector of external acceleration is constant, and that the reference frame is chosen so that points in the opposite direction of the z-axis (that is, , and, as a consequence, ). In this situation, it is convenient to separate the variables into the horizontal and vertical ones; from now on, and will denote the horizontal coordinate and velocity vectors, respectively, while z and w will refer to the vertical coordinate and velocity, respectively. Accordingly, will refer to the horizontal spatial differentiation. In the new notations, the gravity-forced Vlasov-type equation in (25) becomes
We now assume that the horizontal dimensions of the domain are much larger than the characteristic scale of the exponential decay of f in the vertical dimension. As a result, it can be assumed that, on the horizontal scale, the dynamics are largely two-dimensional, with the vertical dimension supplying certain parameterized effects. To describe this, we now integrate f over :
which results in the advection term of the form
as f vanishes exponentially with altitude. This leads to the following Vlasov-type equation for :
3.1. The Velocity Moment Equations
For the zero-order moment, we integrate the Vlasov-type equation for in (29) over , with the notations
This results in the following equation for the density :
where the latter identity is in effect since the bottom of the domain is impenetrable and thus . Observe that there is no advective coupling to , and only the horizontal momentum is present in the advection term of (31). Thus, it suffices to include only the horizontal momentum at the next level of the moment hierarchy. To obtain the transport equation for the horizontal momentum, we integrate (29) over :
where the horizontal pressure tensor is given via
The bottom boundary term in (32) can be expressed via
where we use the fact that . Here, denotes the vector of the surface shear stress:
To obtain the transport equation for the horizontal pressure tensor , we integrate (29) over , which leads to the energy equation:
In order to isolate the equation for the horizontal pressure tensor alone, we observe that, from the horizontal momentum equation (32),
Substituting the expression for the time derivative and noting that
we arrive at the horizontal pressure tensor equation of the form
The bottom boundary term in the above equation can be expressed as
where is the surface skewness matrix, given via
At this point, we define the pressure in a standard way—that is, as a normalized trace of —and denote the corresponding horizontal shear stress deviator via :
Next, we obtain the equation for by taking the normalized trace of the equation for in (39):
Above, and are the horizontal and surface heat fluxes, respectively:
The equation for the horizontal shear stress is obtained by subtracting the pressure equation from (39):
Following [9], we split the horizontal skewness tensor into the appropriate combination of the horizontal heat fluxes and the traceless deviator :
In the same fashion as in our recent work [9], here, we assume that both horizontal and surface shear stresses are negligible in comparison with the rest of the terms, which indicates a high Reynolds number flow. For the horizontal shear stress to remain small, we, first, impose the balance of external forces and boundary effects in its equation (45), that is,
where the latter equation is the trace of the former. Second, we also impose the balance between the pressure–velocity terms and the heat fluxes in the equation (45) for the horizontal shear stress,
where, again, the latter equation is the trace of the former. Substituting the above relations into the pressure equation, we arrive at
that is, in the same manner as in [9], the pressure is preserved along the stream lines (balanced flow). For the vanishing shear stress, the momentum equation in (32) becomes
The density equation in (31), together with the pressure equation (49) and the momentum equation (50), constitute the two-dimensional balanced flow equations in the presence of the gravitational acceleration.
3.2. Approximation for the Vertically Integrated Mean Field Potential
To estimate the effect of the potential forcing in the momentum equation (50), we assume that the gas particles interact via the hard sphere mean field potential—that is, is zero when r is greater than the diameter of the protection sphere [20] (that is, the sphere of minimal distance between the centers of the colliding hard spheres), and becomes infinite for r less than that. In such a case, the spatial integral in (2) equals the volume of this protection sphere regardless of the value of the kinetic temperature:
Above, and denote the volumes of the protection and hard spheres, respectively, with the latter being eight times smaller than the former, because the size of the protection sphere is twice that of any of the two colliding hard spheres. Substituting into (2) and denoting the density of the hard sphere via , we arrive at a rather simple expression for the hard sphere mean field potential :
Note that the hard sphere mean field potential in (53) introduces the same correction into the momentum equation in (4) as does the Enskog correction in the Enskog–Euler equations (see Abramov [19] for details).
Next, we assume that, in the vertical direction, the hydrostatic balance is achieved:
We now express from the hydrostatic balance relation and write
For the integral of in the vertical direction, we thus have
Above, the variable is given via
and we assume that remains bounded above and below with altitude (which is indeed the case in the troposphere and stratosphere). For the vertical integral of the hard sphere mean field potential , we thus have
What remains to be done is to evaluate the surface pressure . For this, we recall that the surface pressure equals the total mass of the air column above the surface per unit area, multiplied by the gravity acceleration, which yields
and, subsequently,
As a result, the horizontal momentum equation for the hard sphere gas becomes
4. Numerical Simulations
Here, we present the results of numerical simulations of a balanced two-dimensional large-scale gas flow for two scenarios—an inertial jet, and a cyclostrophic vortex. In both scenarios, we recreate (rather crudely) the main parameters of the Earth’s atmosphere. In particular, the acceleration constant in (61) is set to m/s, which corresponds to Earth’s gravity, while the vertically integrated density and temperature of the gas are chosen to correspond to those typically observed in large-scale atmospheric flows.
4.1. Density of the Air-Like Hard Sphere Gas
The Earth’s atmosphere consists of air, which is a mixture of various gases—primarily diatomic, such as the molecular nitrogen N and molecular oxygen O, but with a small amount of polyatomic gases, such as water HO and carbon dioxide CO. Our theory is, however, developed for a monatomic hard sphere gas. Thus, in order to numerically simulate the behavior of the Earth’s atmosphere using our model, we need to “create” a hypothetical hard sphere gas with a density that matches the known physical properties of air. Here, we choose the two properties of our hard sphere gas to match with the air—the molar mass and the viscosity.
As follows from our gas model above, the equations in (31), (49), (51) and (61) are derived from the assumption that the molecules interact in a fully time-reversible fashion. On the contrary, in the standard kinetic theory, the viscosity properties of a hard sphere gas are obtained directly from the time-irreversible Boltzmann collision integral [21,22,23,24]. This is not necessarily a contradiction—clearly, in a real gas, both types of interactions are present (for example, while potential interactions are time-reversible, the quantum-mechanical Pauli repulsion is inherently stochastic), and can apparently manifest at different spatial scales. In particular, turbulence is not observed in flows with a high Knudsen number (such as thin channels and capillaries), where the gas motion is dominated by viscous effects, whereas the situation reverses itself at low Knudsen numbers. Thus, the same gas can be treated in the context of the time-reversible model at large scales, and as a time-irreversible process at viscous scales.
Treating the collisions as time-irreversible at viscous scales, we recall the well-known formula for the dynamic viscosity of the hard sphere gas [21,22,24]:
where is the diameter of the hard sphere, mol is the Avogadro number, and M is the molar mass of the gas. In order to relate the expression above to the density of the hard sphere , we observe that
where kg m/K mol s is the universal gas constant, and T is the usual temperature in K. Expressing via from the latter equation, and substituting the expression for , we obtain the formula for via the viscosity and temperature T:
4.2. Two Simulated Scenarios of a Balanced Flow
Below, we study the following two special cases of a balanced flow:
- Inertial jet. In an inertial jet, the pressure is constant throughout the domain. Observe that, in our equations, the Coriolis acceleration of Earth’s rotation is not present, which corresponds roughly to the equatorial region. Thus, such inertial flow describes a special case of geostrophic flow near the equator.
- Cyclostrophic vortex. In a cyclostrophic vortex, the centripetal force, acting on a rapidly rotating gas, is balanced by the pressure gradient, and the velocity is orthogonal to both. Again, given the absence of the Coriolis acceleration, this scenario corresponds to a large-scale, rapidly rotating flow, where the Coriolis acceleration is negligible in comparison with the centripetal acceleration—that is, a fully developed tropical cyclone.
4.3. Computation of Initial and Boundary Conditions
Below, we describe how the initial and boundary values of the velocity, temperature and pressure are specified in each simulated scenario.
- First, we specify the velocity of the flow in the domain, and on those boundaries where the Dirichlet boundary condition is specified. The way in which we specify the velocity is entirely scenario-dependent; in the inertial jet scenario, the initial velocity field forms a jet stream, while, in the cyclostrophic vortex scenario, the initial velocity field forms a rotating flow with an appropriate radial profile.
- Once is defined, we compute the kinetic temperature of the flow using the Bernoulli law for a compressible gas:where the background temperature of the gas is set to K—that is, the approximate vertically averaged temperature of air throughout the troposphere. Observe, however, that in the present setting, the gas is two-dimensional, and, therefore, the effective adiabatic exponent .
- Once and are defined, we specify the pressure (which automatically yields the density via ). Below, we study two scenarios: an inertial jet, and a cyclostrophic vortex. In the inertial jet scenario, we set the pressure to a constant value ,where kg/m, which constitutes the approximate mass of the air column per unit area of the Earth’s surface. In the cyclostrophic vortex scenario, the pressure gradient is balanced by the centripetal force:where is the coordinate of the point relative to the center of rotation, is the angular velocity of rotation, and the latter identity is valid for a planar rotation (that is, when ). Here, the velocity is orthogonal to both and , that is,Upon substitution, this leads toAssuming, in turn, that , and do not depend on the angle, and only depend on , we denote , , and arrive at the following explicit formula for :Above, in the integration formula, we assume that vanishes sufficiently far away from the center of rotation. Moreover, in practice, one can simplify the integration by presuming that varies weakly in comparison to under the integral, and factor the kinetic temperature out of the integration (as we do further below).
4.4. Numerical Methods and Software
In the current work, we use the same software as in our previous work [9]—namely, we use OpenFOAM [26] to perform all numerical simulations. Noting that equations (31), (51) and (61), for the density, inverse temperature and momentum, respectively, comprise a system of nonlinear conservation laws, we simulate them with the help of an appropriately modified rhoCentralFoam solver [27], which uses the central scheme of Kurganov and Tadmor [28] for the numerical finite volume discretization, with the flux limiter due to van Leer [29]. The time-stepping of the method is adaptive, based on 20% of the maximal Courant number.
4.5. Numerical Simulation of an Inertial Jet
In the inertial jet scenario, we simulate a large-scale jet stream in a channel-like domain. The spatial domain is 2500 km in length and 500 km in width. The spatial discretization is uniform in both directions, with a step of 2.5 km, which constitutes 1000 cells in the zonal direction and 200 cells in the meridional direction. The domain has a 100-km-wide inlet in the middle of the western wall, while the outlet is the whole 500-km-wide eastern boundary. The initial velocity field is given via the shear jet
where the vertical coordinate y is given relative to the central axis of the channel, km, and m/s. As we can see, the speed of the flow is 35 m/s in the middle of the channel, and smoothly decays to zero at the distance of 50 km both to the north and south (which also corresponds to the boundaries of the inlet). The weak asymmetry parameter is introduced in the same manner as by McCalpin and Haidvogel [30], to break up possible mirror symmetry effects of the flow in the two-dimensional domain. Observe that the typical kinematic viscosity of air at normal conditions is ∼ m/s, the characteristic size of our flow is no less than m (the width of the jet), and the reference velocity is no less than 10 m/s, which yields the value of the Reynolds number . Therefore, the assumptions made in the course of the derivation of our model are clearly valid for this set-up.
The boundary conditions are specified as follows. At the inlet, the velocity is set to (71) at all times, with the rest of the variables following the procedure set forth in Section 4.3. At the outlet, all variables are set to the free outflow conditions (that is, zero normal gradient). At the walls, which comprise the remainder of the domain boundary, the velocity is set to the no-slip condition, while the rest of the variables are set to the zero normal gradient condition (which corresponds to zero momentum flux for the pressure, and zero heat flux for the temperature).
We emphasize that these initial and boundary conditions correspond to a steady state for the conventional Euler equations, and even for our balanced flow equations taken without the mean field forcing in the momentum equation (50) (or its special case (61) for a hard sphere gas). Thus, any observed non-steady effects originate from the presence of the mean field forcing due to the molecular interaction potential.
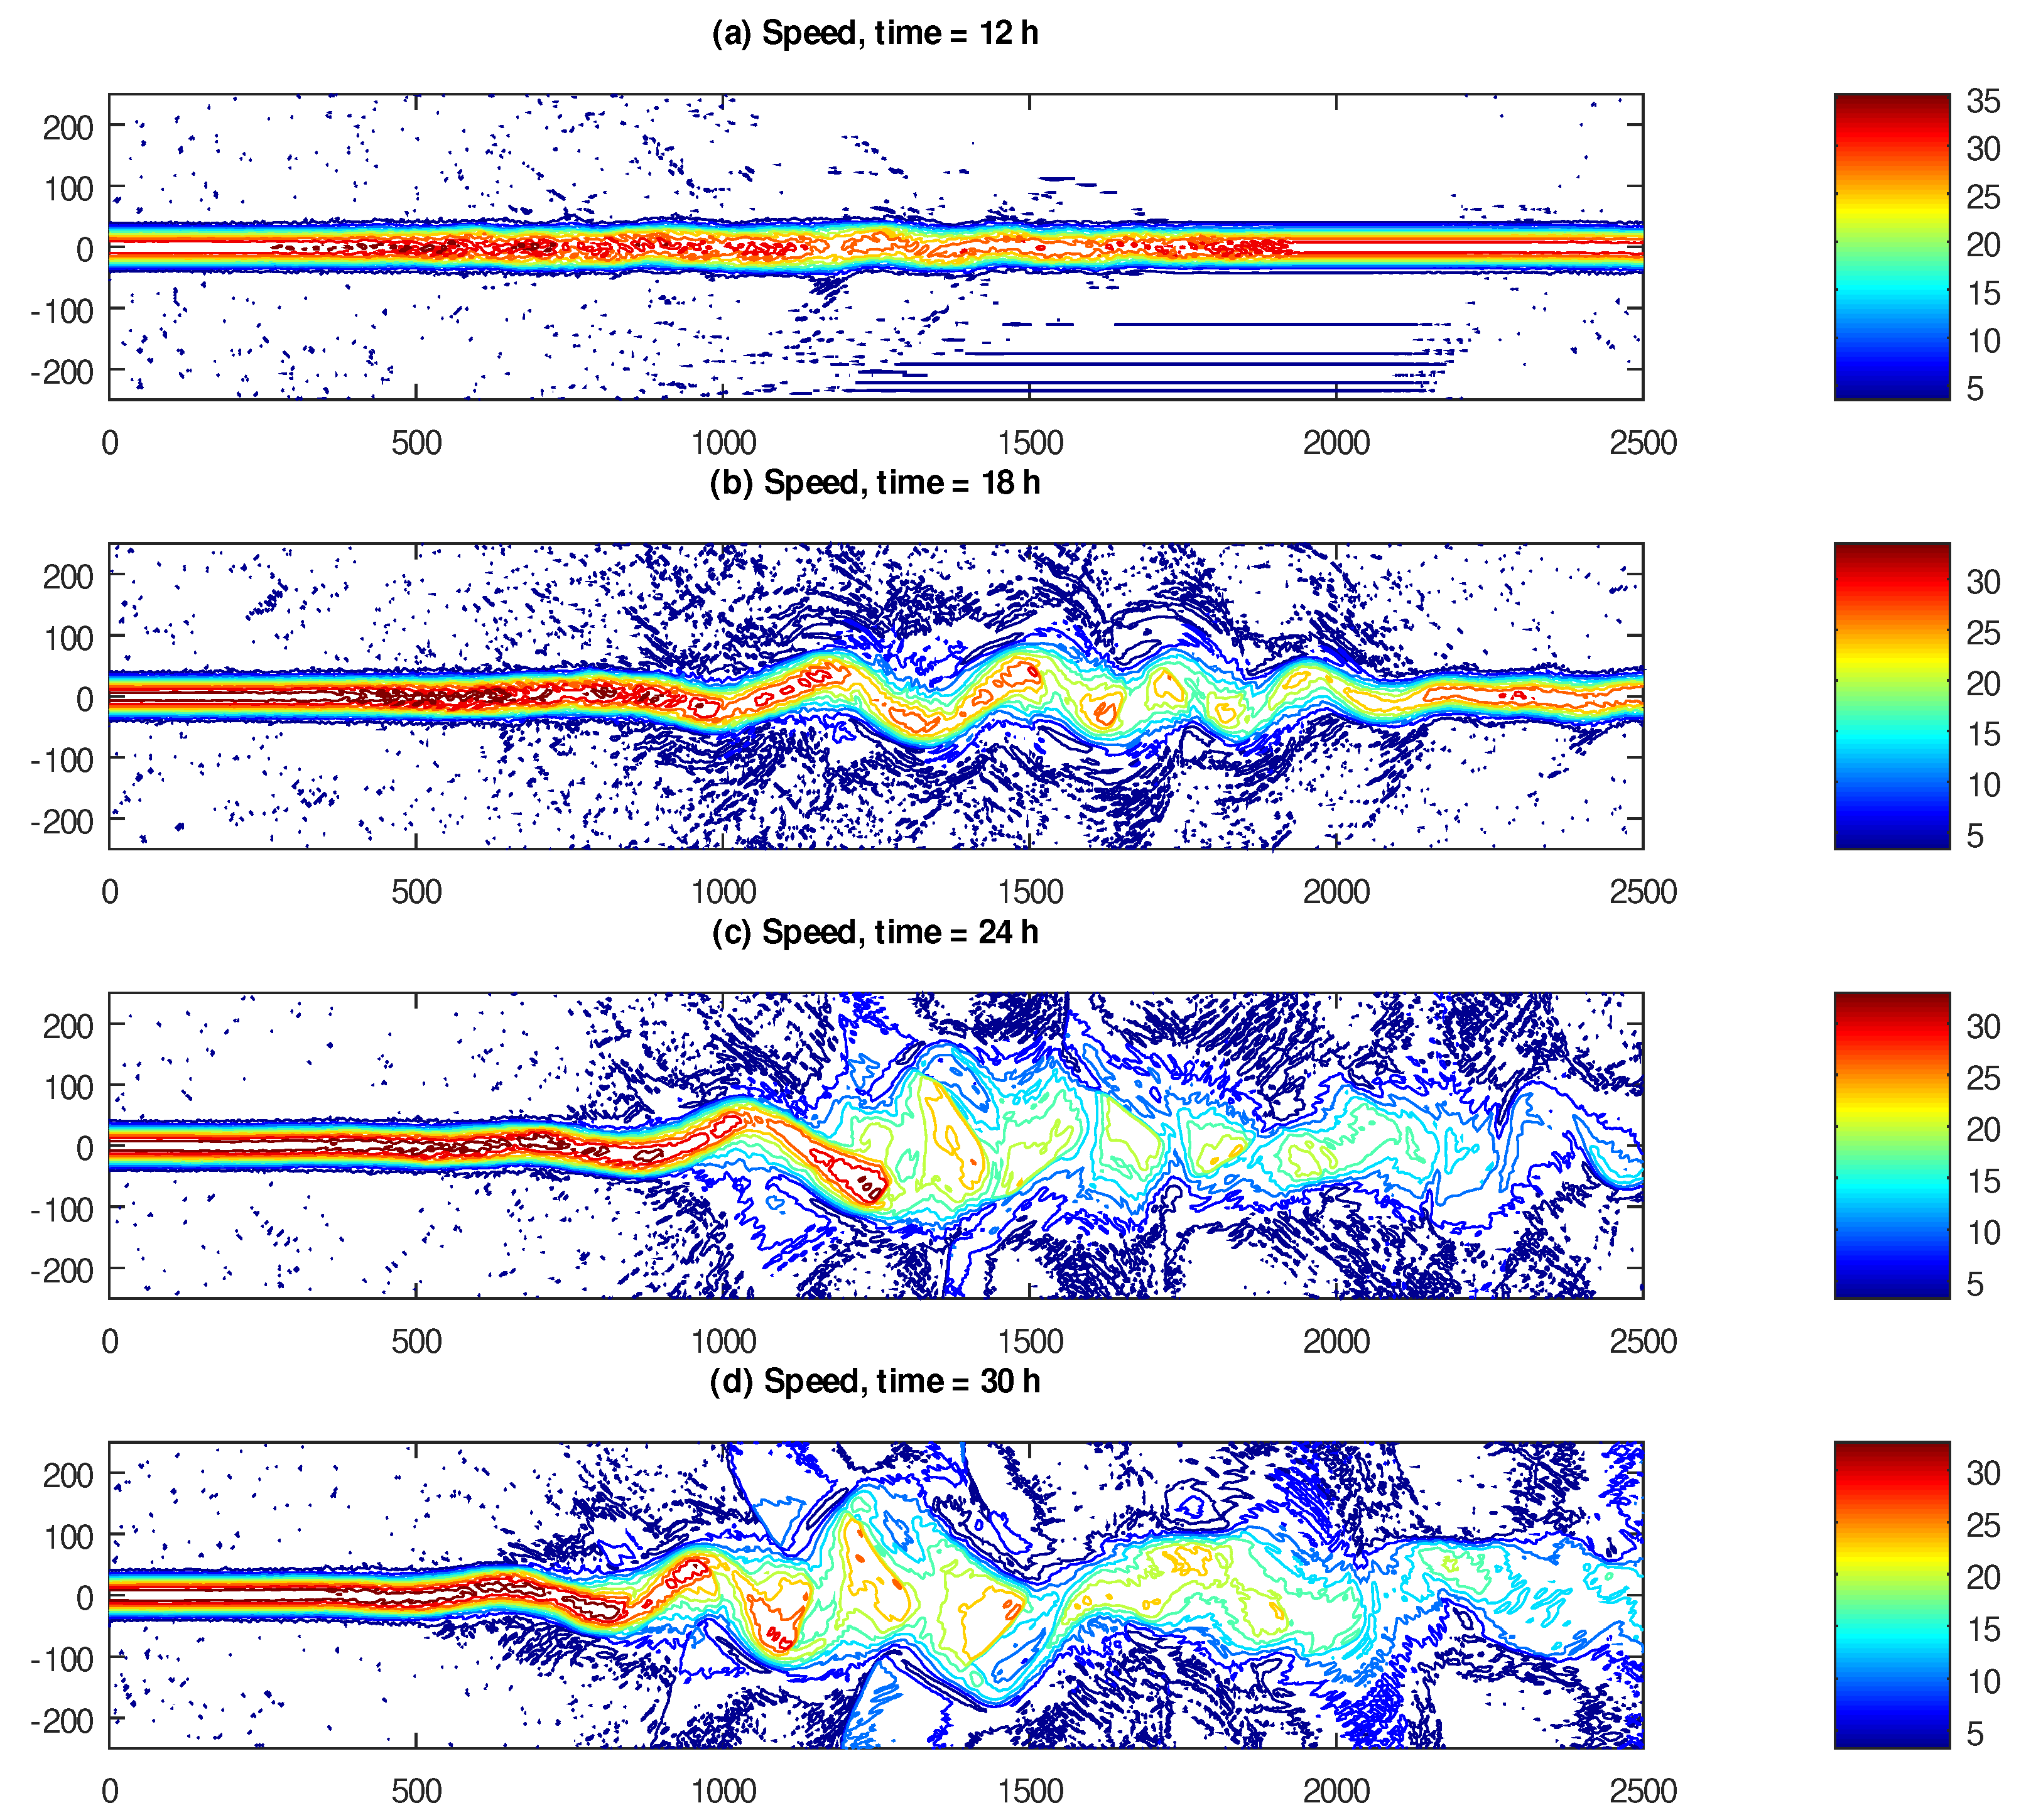
Starting from the initial conditions described above, we integrate the system of equations in (31), (51) and (61) forward for 72 h in model time. The time step, chosen from the CFL criterion, varied between 12 and 16 s. In Figure 1, we show the speed of the flow, captured at 12, 18, 24 and 30 h elapsed model time, on contour plots. Here, we can see that small fluctuations in the jet manifest at 12 h. At 18 h, the jet visibly meanders roughly between 1000 and 2000 km. At 24 and 30 h, the jet is completely broken up in the second half of the domain. In fact, visually, the snapshots of the flow speed at 24 and 30 h resemble the famous Reynolds experiment [31]. After 30 h, the general configuration of the flow does not seem to visibly change any further, and thus we do not show the snapshots past this time.
The vorticity is given via the curl of velocity :
Since is confined to the -plane, is orthogonal to this plane, and only has the z-component, given via
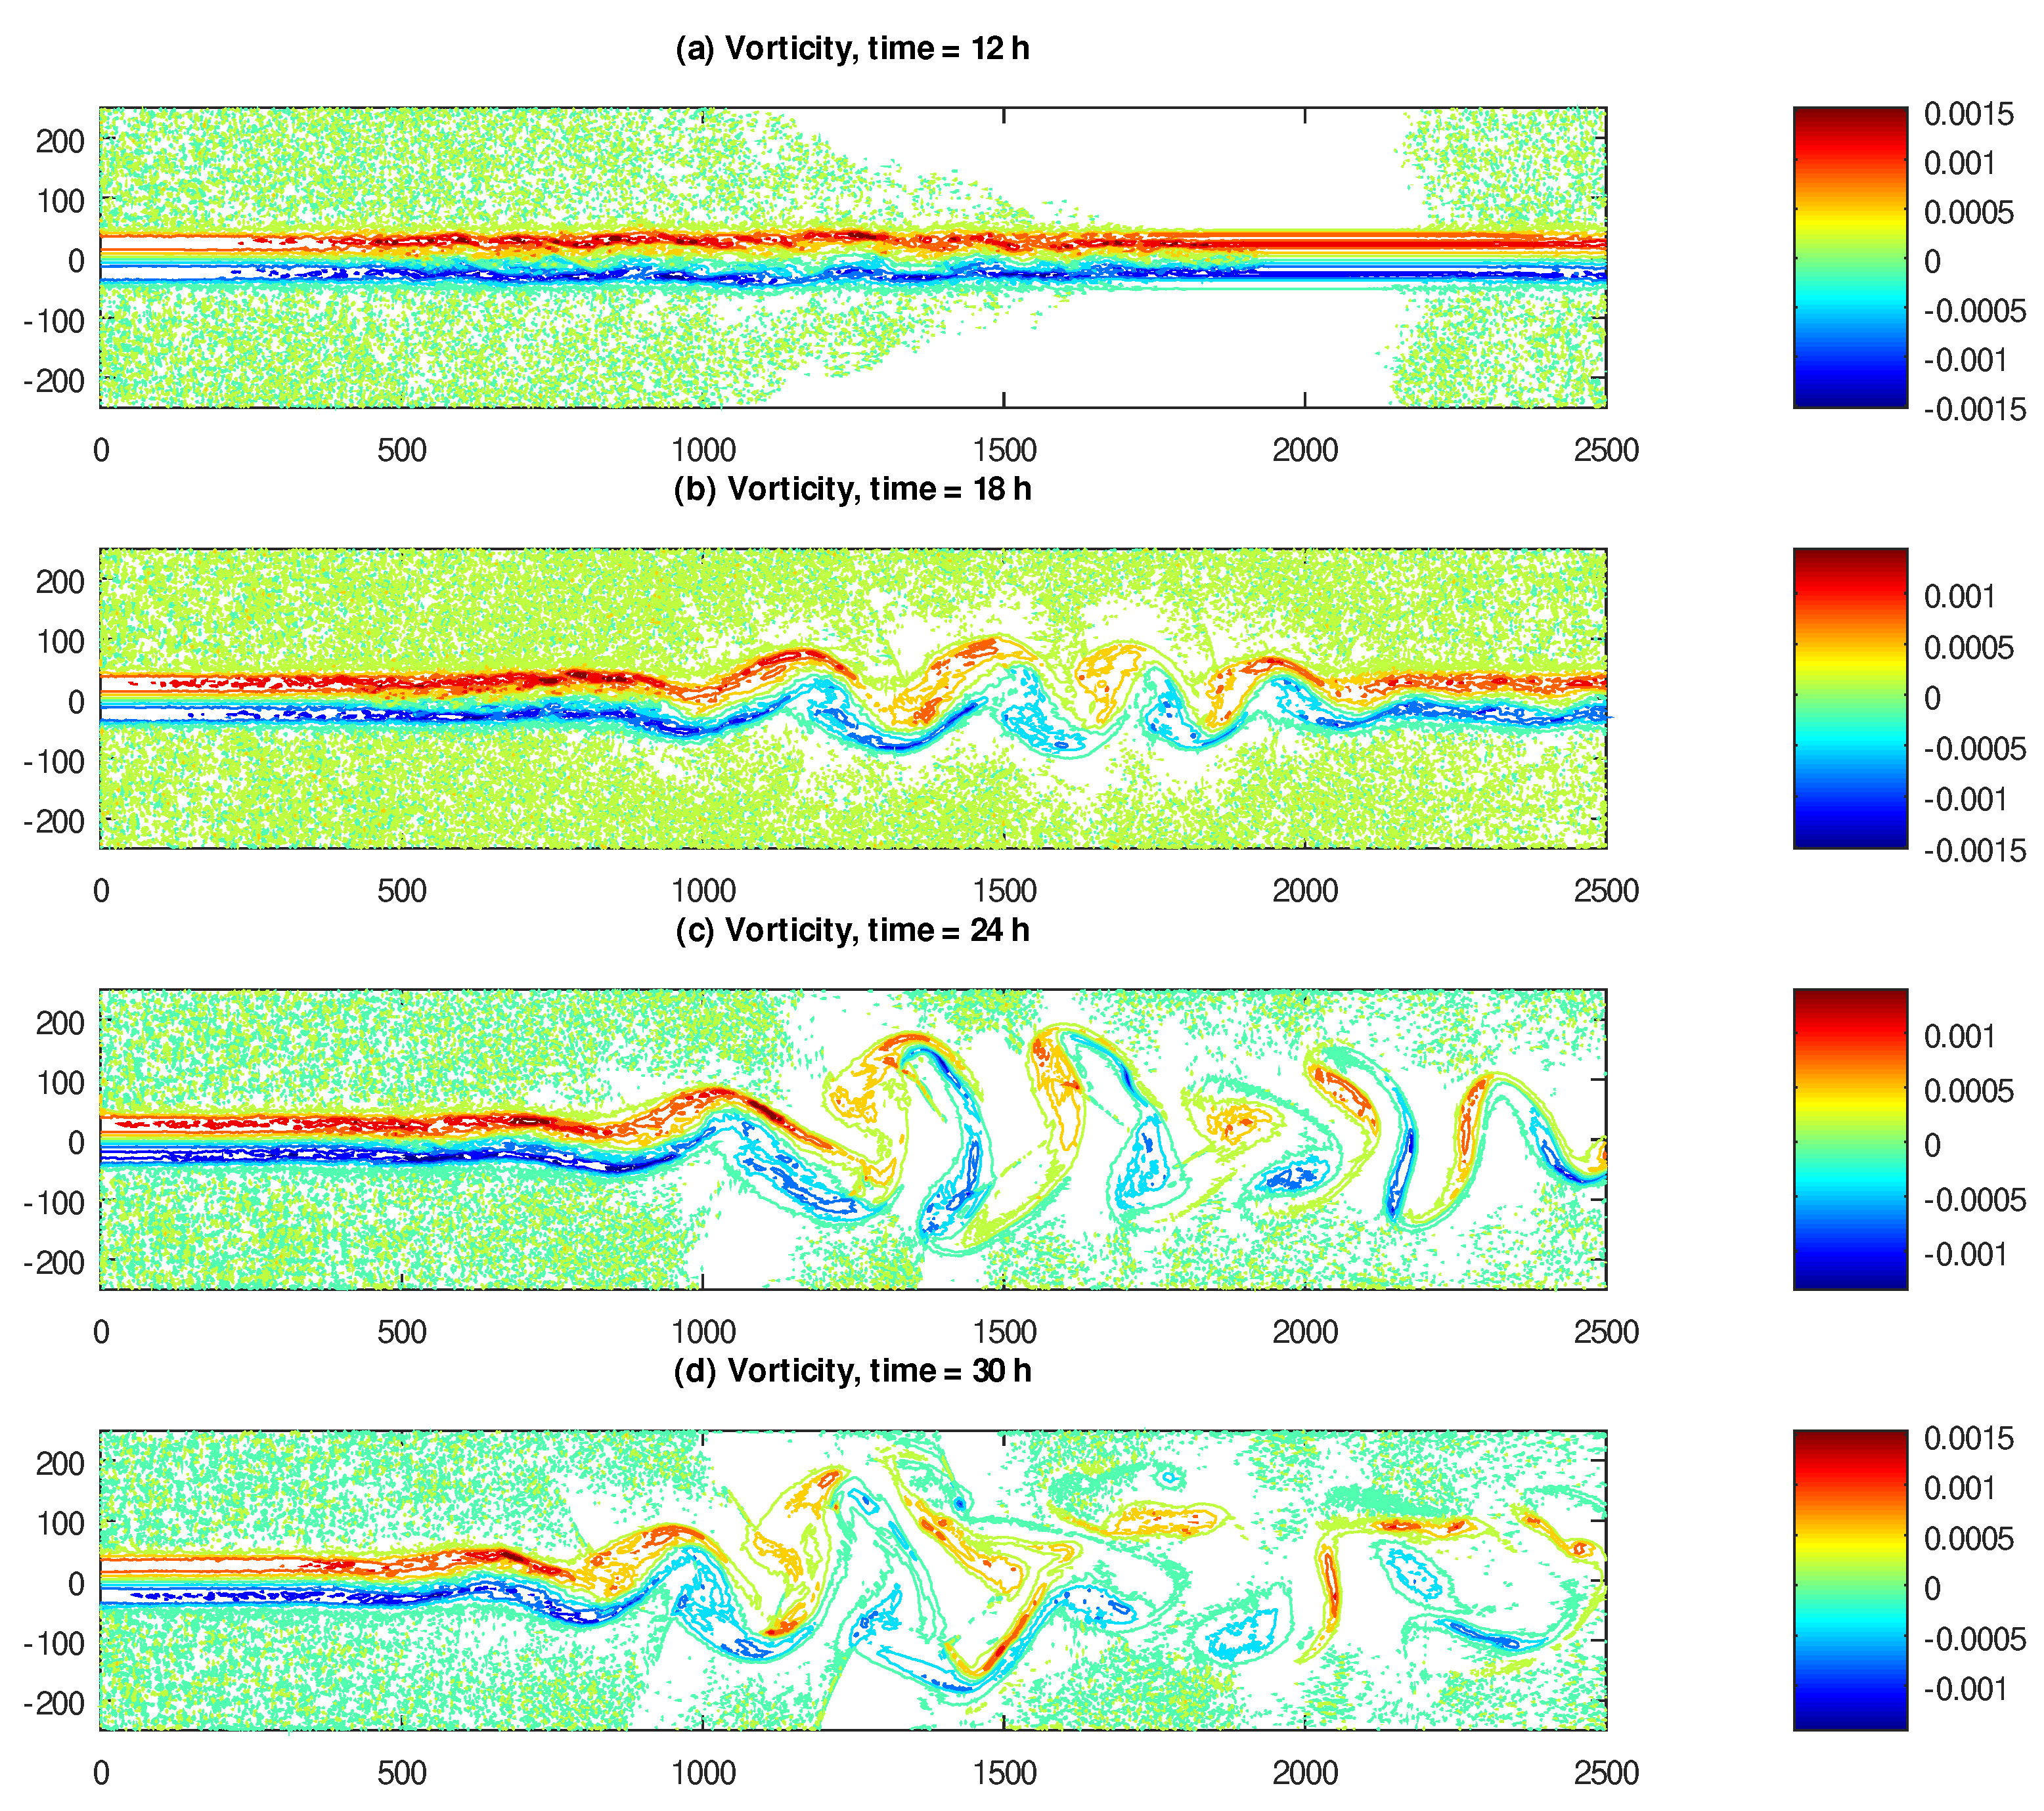
In Figure 2, we show the contour plots of for the inertial flow, also captured at 12, 18, 24 and 30 h elapsed model time. The situation here is similar to what was observed in Figure 1 for the speed of the inertial flow; namely, small vorticity fluctuations are observed at 12 h, and visible meandering manifests at 18 h. At 24 h, the structure of vorticity resembles a Kármán vortex trail [32]; at 30 h, the structure of the vorticity is completely lost in the second half of the channel, and the motion appears to be fully chaotic.
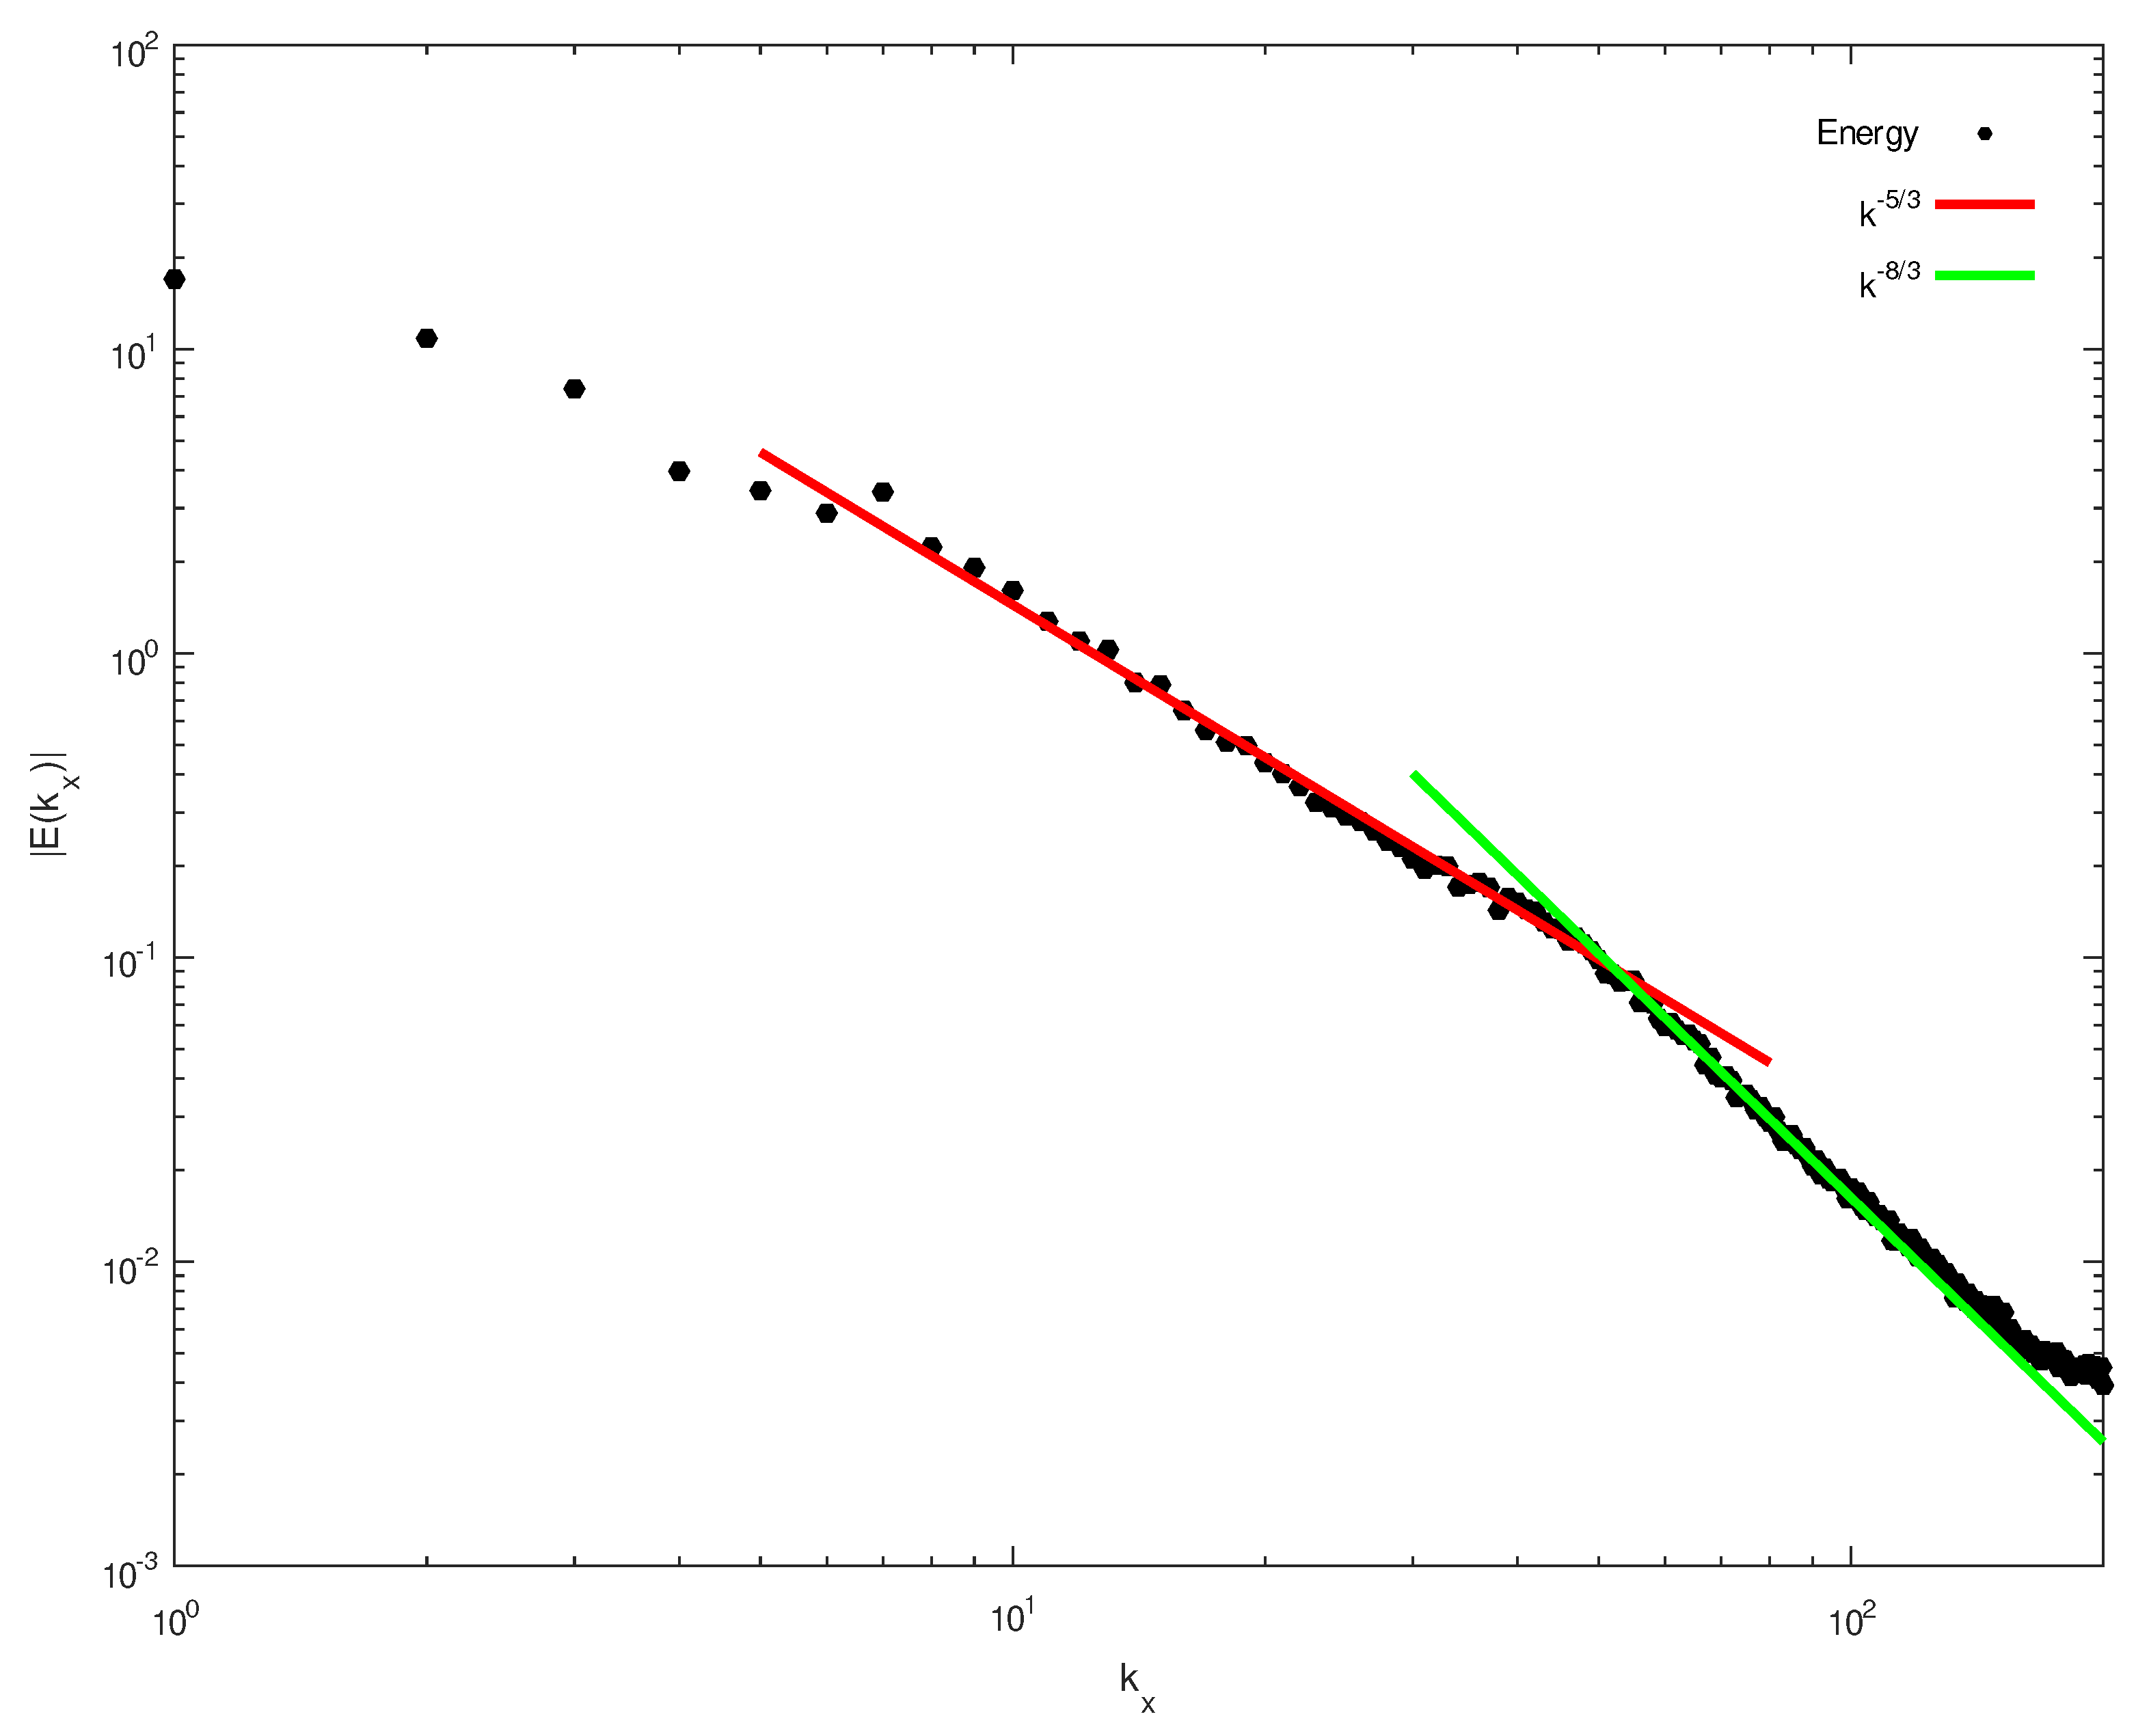
In Figure 3, we show the time-averaged kinetic energy spectrum of the flow, computed in the rectangular sub-region of the domain, which extends from 1500 to 2500 km zonally, and from to km meridionally. This spectrum was computed as in [9]: first, the kinetic energy was averaged across the channel (thus becoming the function of the x-coordinate only). Then, the linear trend was subtracted from the result in the same manner as was done by Nastrom and Gage [8], to ensure that there was no sharp discontinuity between the energy values at the western and eastern boundaries of the region. Finally, the one-dimensional discrete Fourier transformation was applied to the result. The subsequent time-averaging of the modulus of the Fourier transform was computed between and h. As we can see in Figure 3, Kolmogorov’s famous -decay of the kinetic energy spectrum occurs roughly between the wavenumbers 8 and 50; for smaller scales, the -decay is observed. Similar spectra, with two different powers of decay at different ranges of wavenumbers, have been registered in the Jovian atmosphere [33,34].
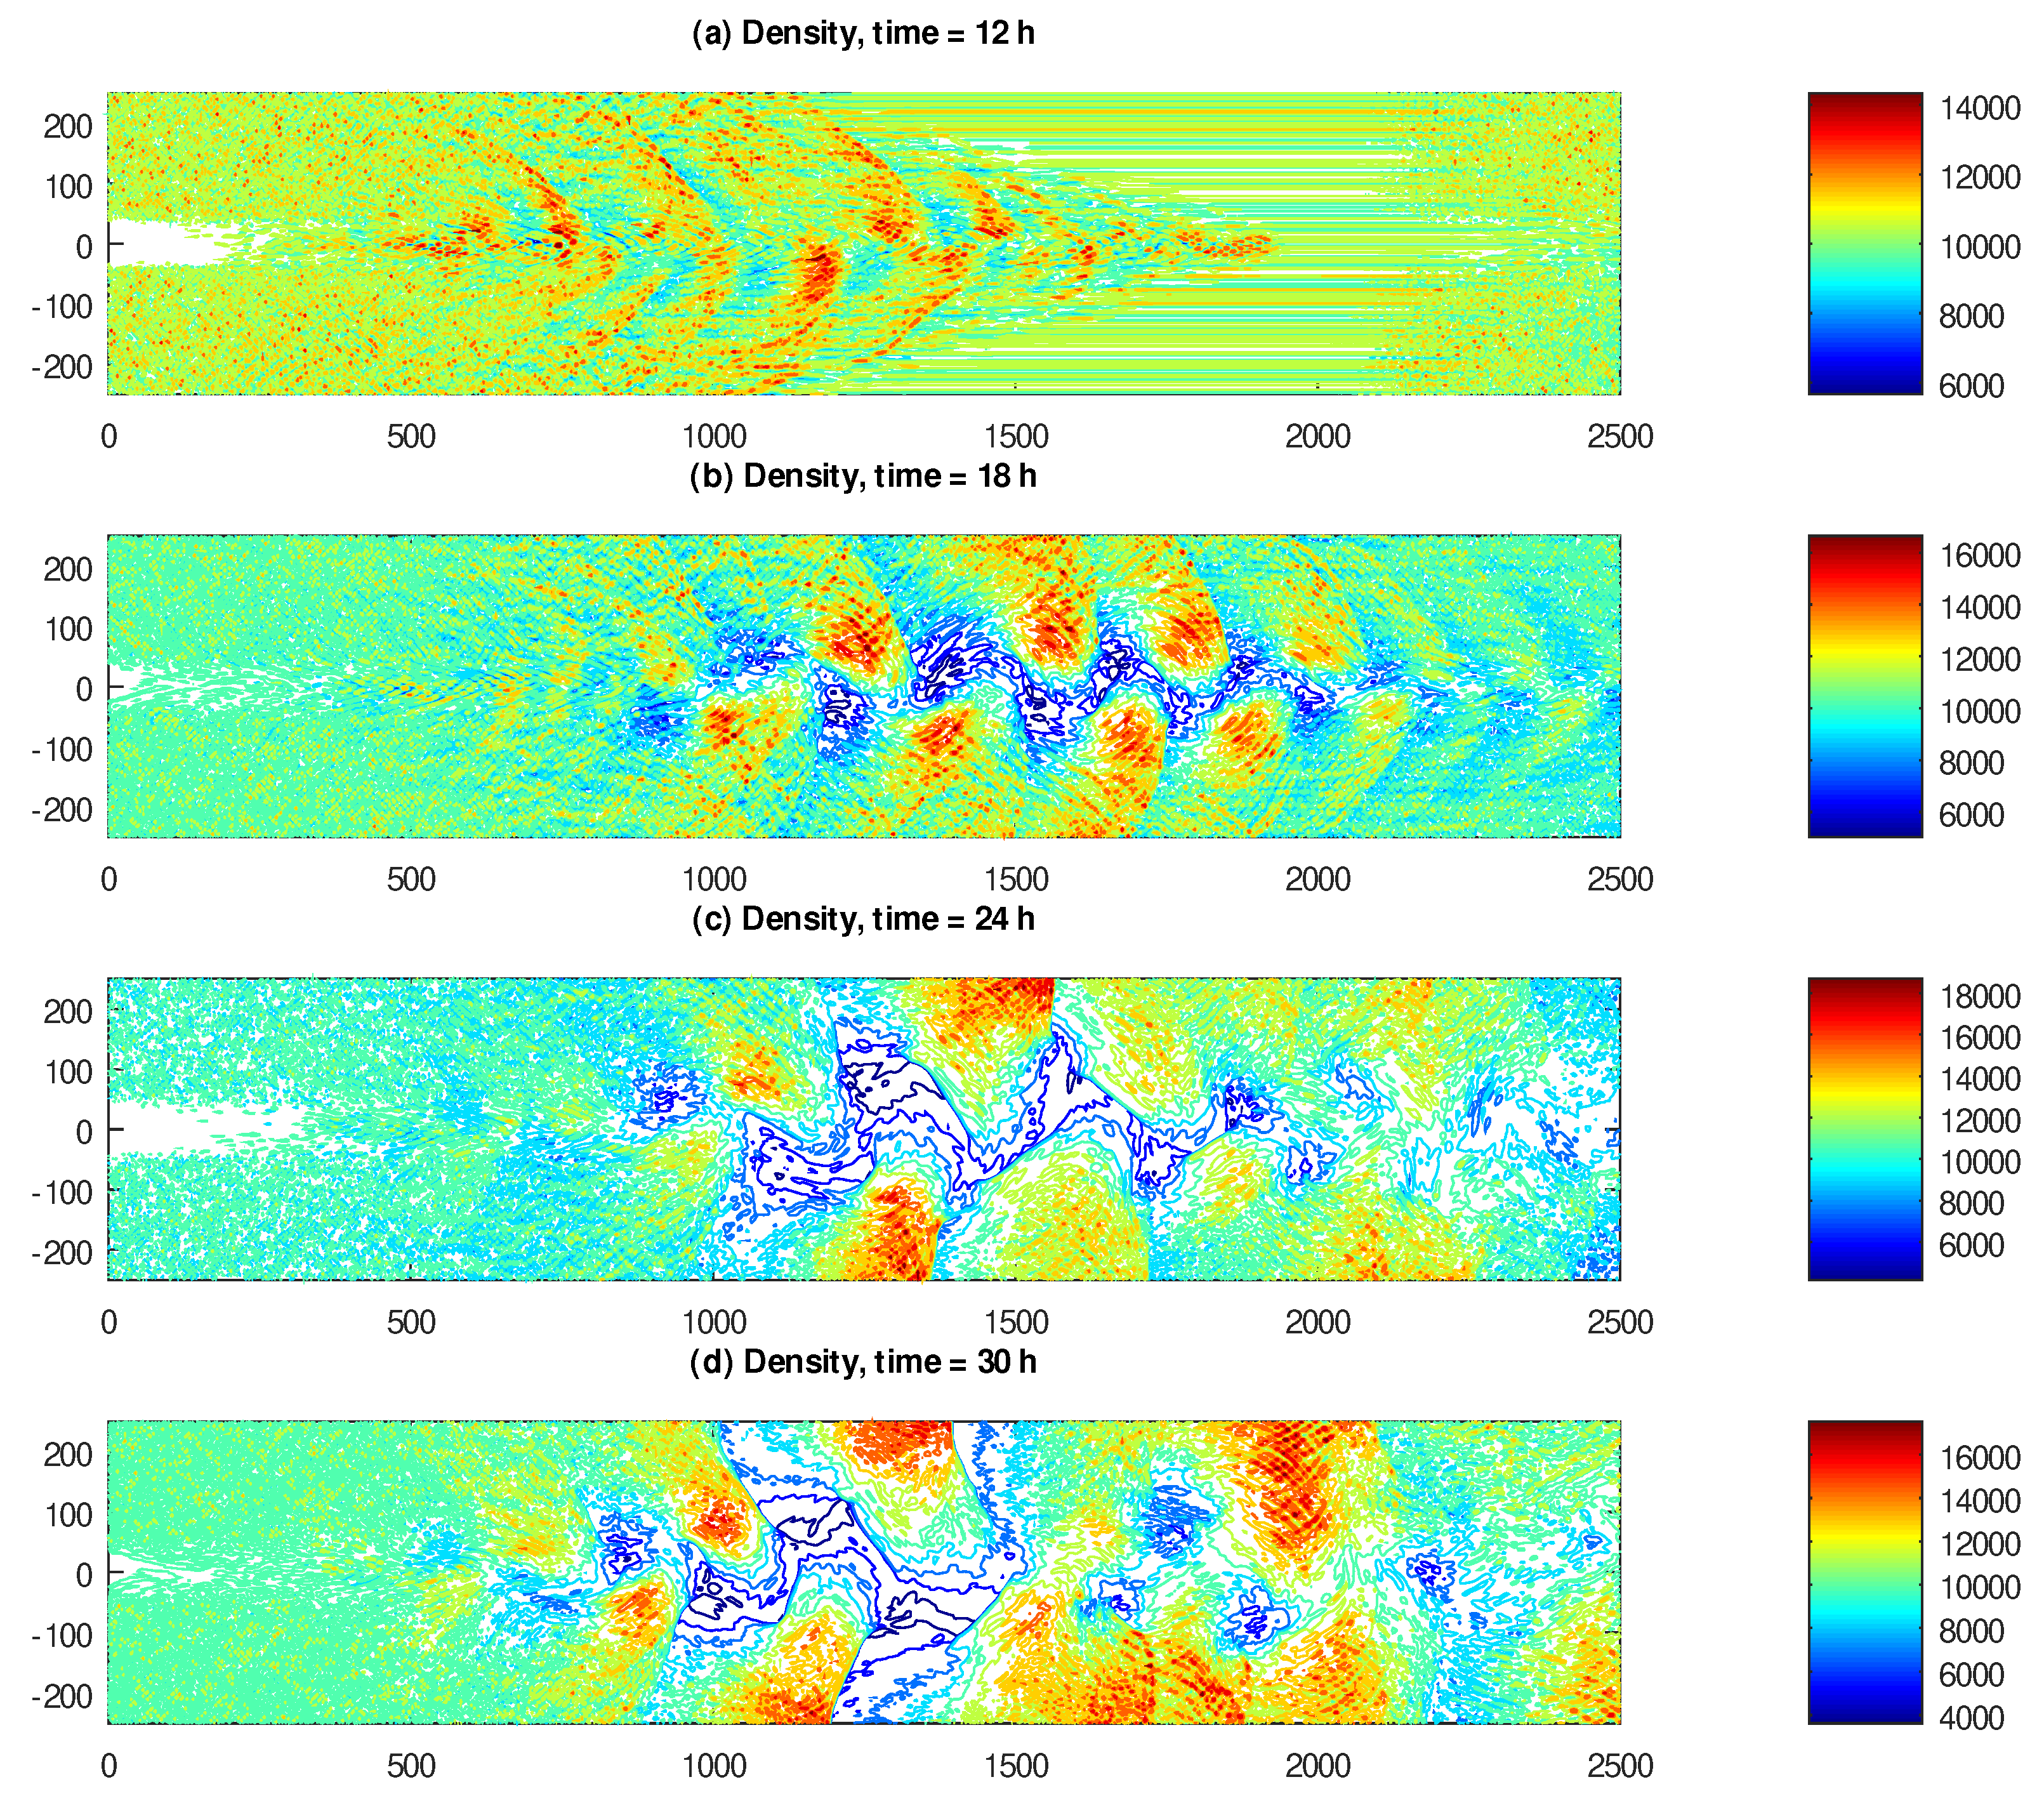
Despite promising results in simulating turbulent motions of the velocity, our model also has its limitations. In particular, for a fully developed turbulent flow, we found that the density may attain unrealistic values. In Figure 4, we show the contour plots of the density for the same times as the velocity and vorticity above, namely at 12, 18, 24 and 30 h. Observe that, in a fully developed chaotic flow, the density varies between and kg/m (with the background value kg/m), which, of course, does not happen in the Earth’s atmosphere.
The likely reason for this behavior is that our model is derived under the assumption that the flow remains balanced unconditionally, while, in reality, balanced flows manifest largely in the presence of relatively small density gradients. Should a large density gradient develop locally, the flow is likely to become isentropic in this region, and the usual compressible Euler equations would apply instead. Thus, in order to correct such behavior of our model, one likely needs to introduce an appropriate mechanism of controlled switching to the compressible Euler equations locally, should the density gradient become “too large”. In the present work, however, we report the results of our simulation without any corrections.
4.6. Numerical Simulation of a Cyclostrophic Vortex
In the scenario with a cyclostrophic vortex, we simulate a large-scale, rapidly rotating flow, resembling a tropical cyclone, in a square domain of size 1000 × 1000 km. The spatial discretization step is set to 2 km, which constitutes 500 cells in both horizontal directions. The boundary of the domain is impenetrable with appropriate boundary conditions, and the counter-clockwise vortex is confined entirely within it. Naturally, the direction of the velocity at each point is orthogonal to the direction towards the center of the vortex, and the speed of the flow is a function of the distance to the center, but not the angle. As a function of the distance to the center r, we set the speed of the flow to
Here, the maximum speed m/s is achieved at the geometric mean distance , where and are the inner and outer radii of the vortex, respectively. For the simulation, we set km (and thus, km). The reason that is chosen in this manner, is that it is, effectively, a function of , which synergizes well with the computation of the integral in the cyclostrophic pressure profile formula (70). The Reynolds number of this scenario is similar to that of the inertial flow examined above.
Upon integrating this initial set-up forward in time, we observed the following behavior. The time step, chosen from the CFL criterion, varied between 5 and 6 s. The flow remained largely laminar for the initial 150 min of the elapsed model time, after which turbulent motions rapidly developed around the region of the maximal flow speed. Shortly after 200 min of the elapsed model time, a numerical instability occurred in the solution, and a floating point exception was generated by the software. Thus, turbulent flow was observed between 150 and 200 min of the elapsed time.
A possible reason for the manifestation of the numerical instability is the apparent lack of any damping effects in the model, similarly to what we observed in our recent work [16]. In the inertial jet scenario above, the developing regions with large density gradients left the domain through the outlet before causing further problems (in a way, damping was created by the boundary conditions); here, however, the rotating flow is contained entirely within the domain, thus allowing instabilities to develop without restrictions.
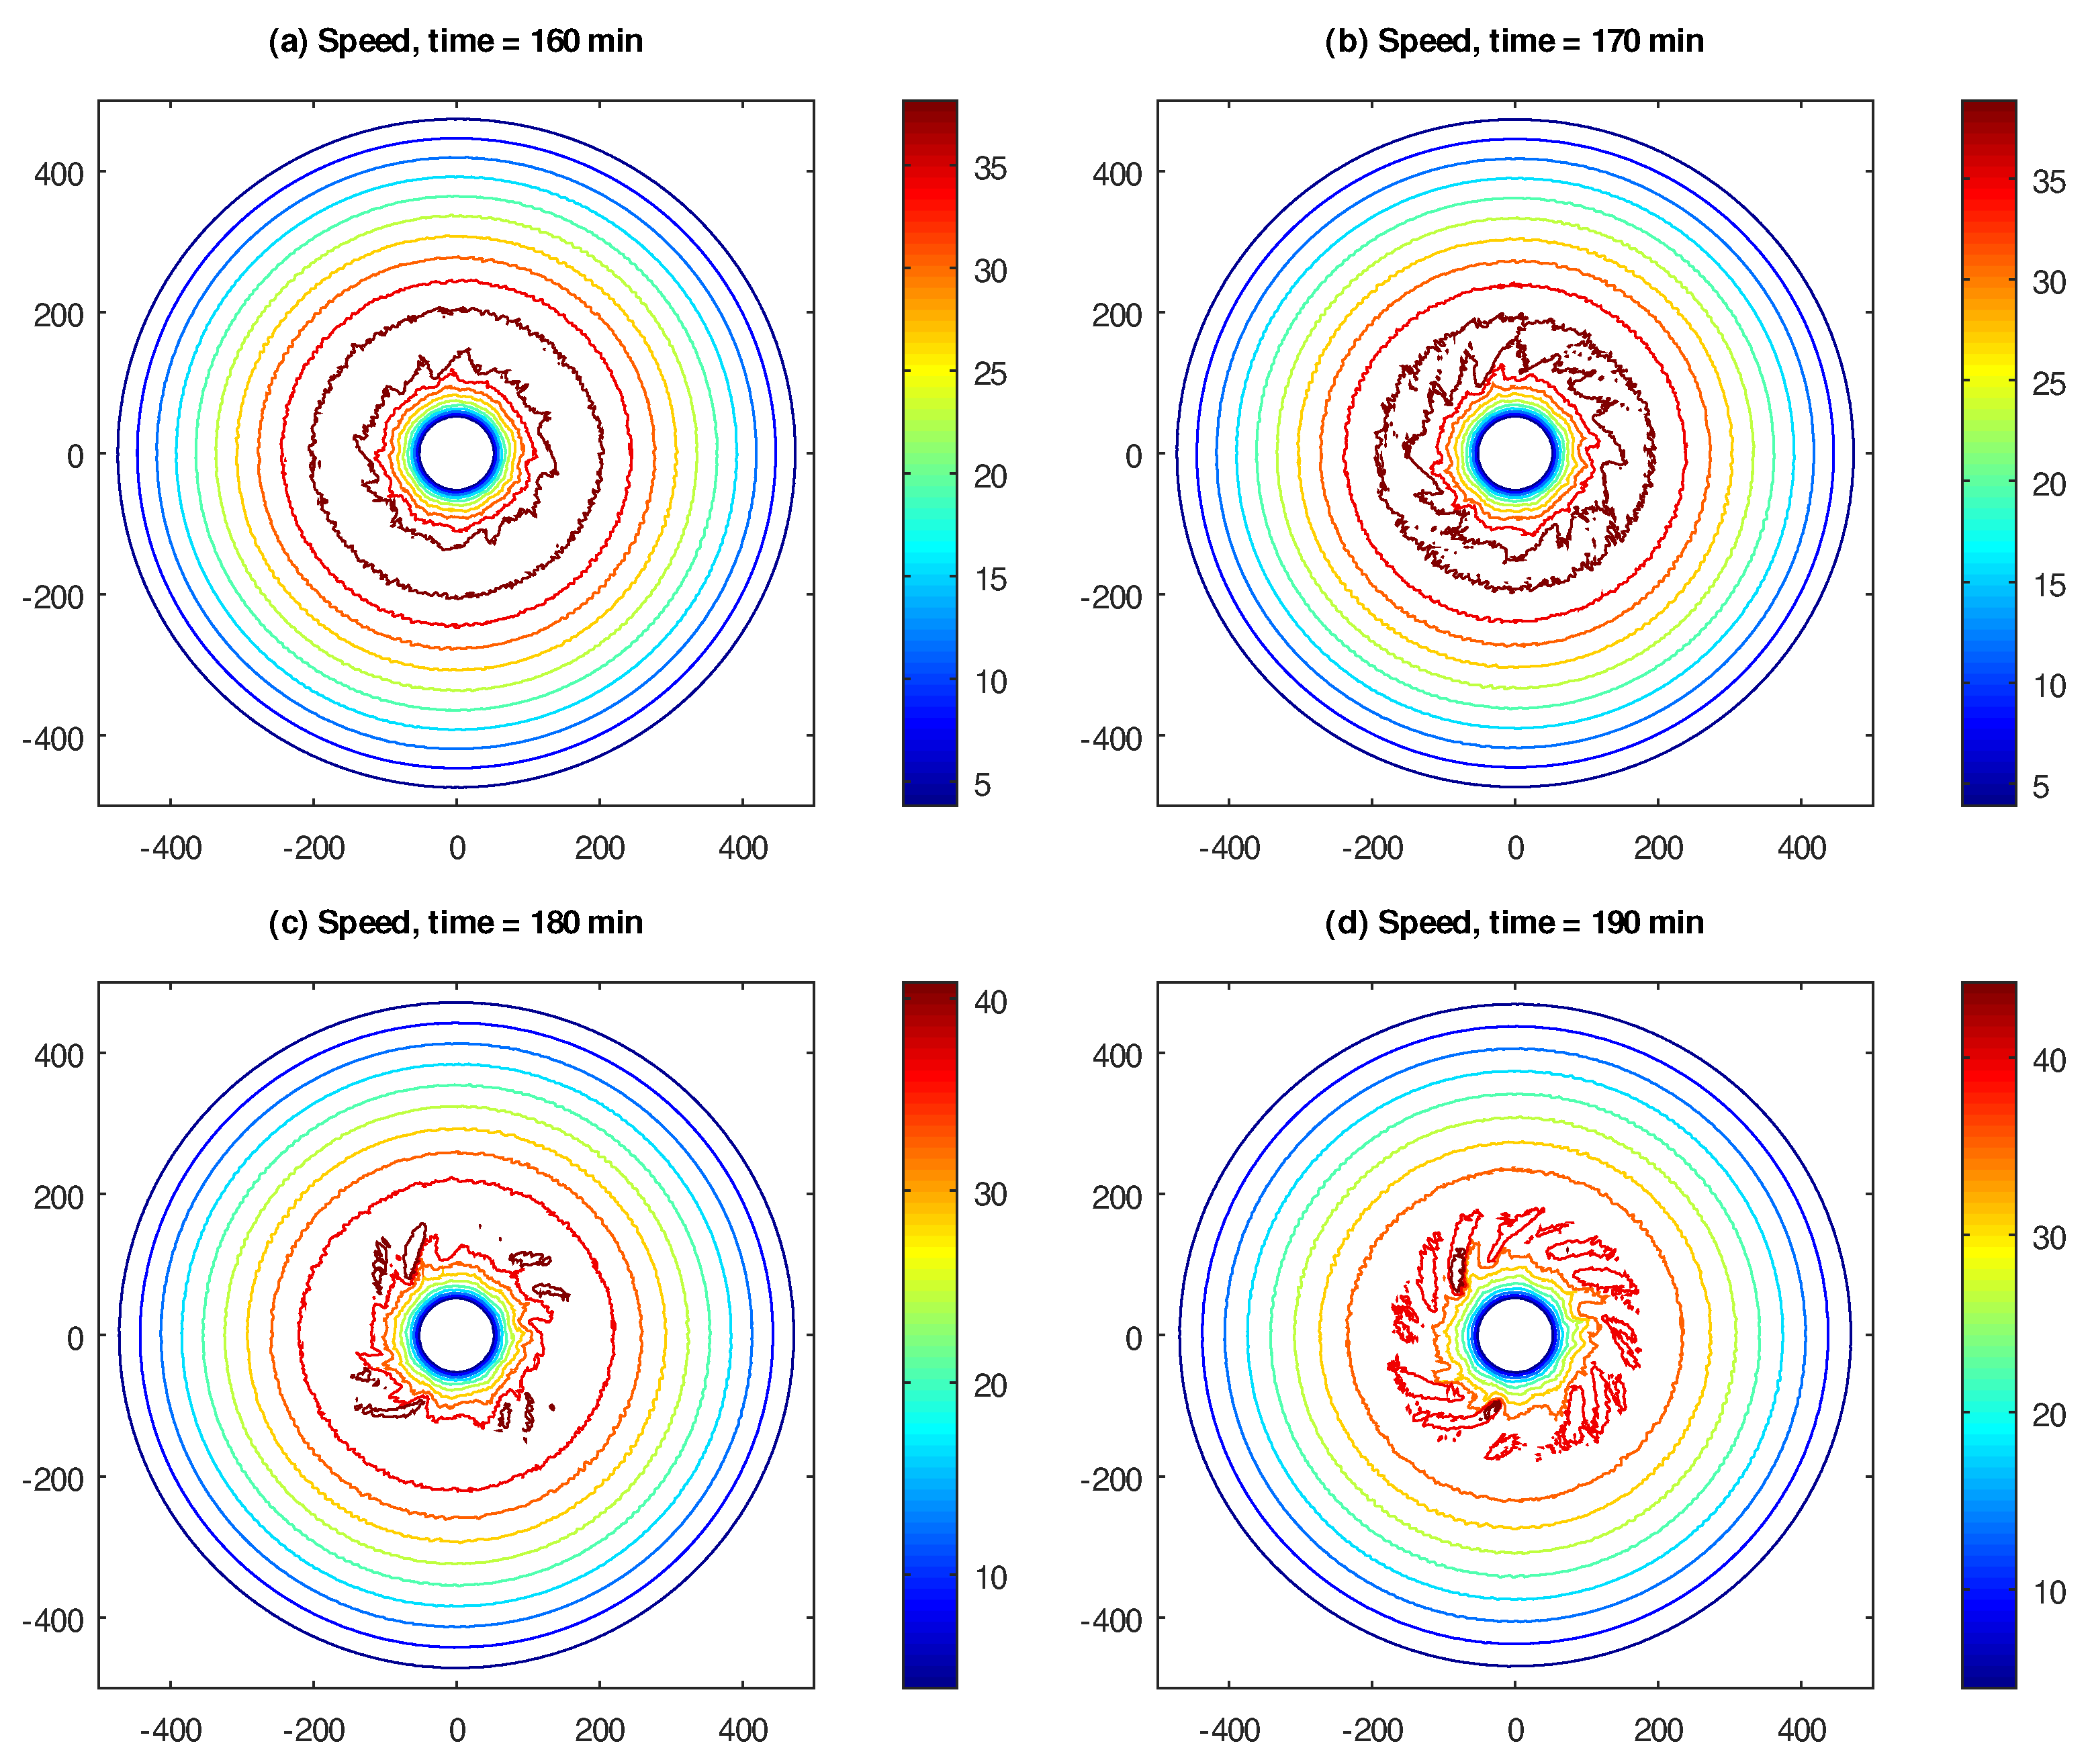
In Figure 5, we show the speed of the flow, captured at 160, 170, 180 and 190 min of the elapsed model time, on contour plots. Here, we can see that small speed fluctuations manifest at 160 min, and become progressively larger at 170, 180 and 190 min. These fluctuations are, however, mainly confined to the region of maximal velocity of the vortex, with the flow at the “outskirts” remaining laminar.
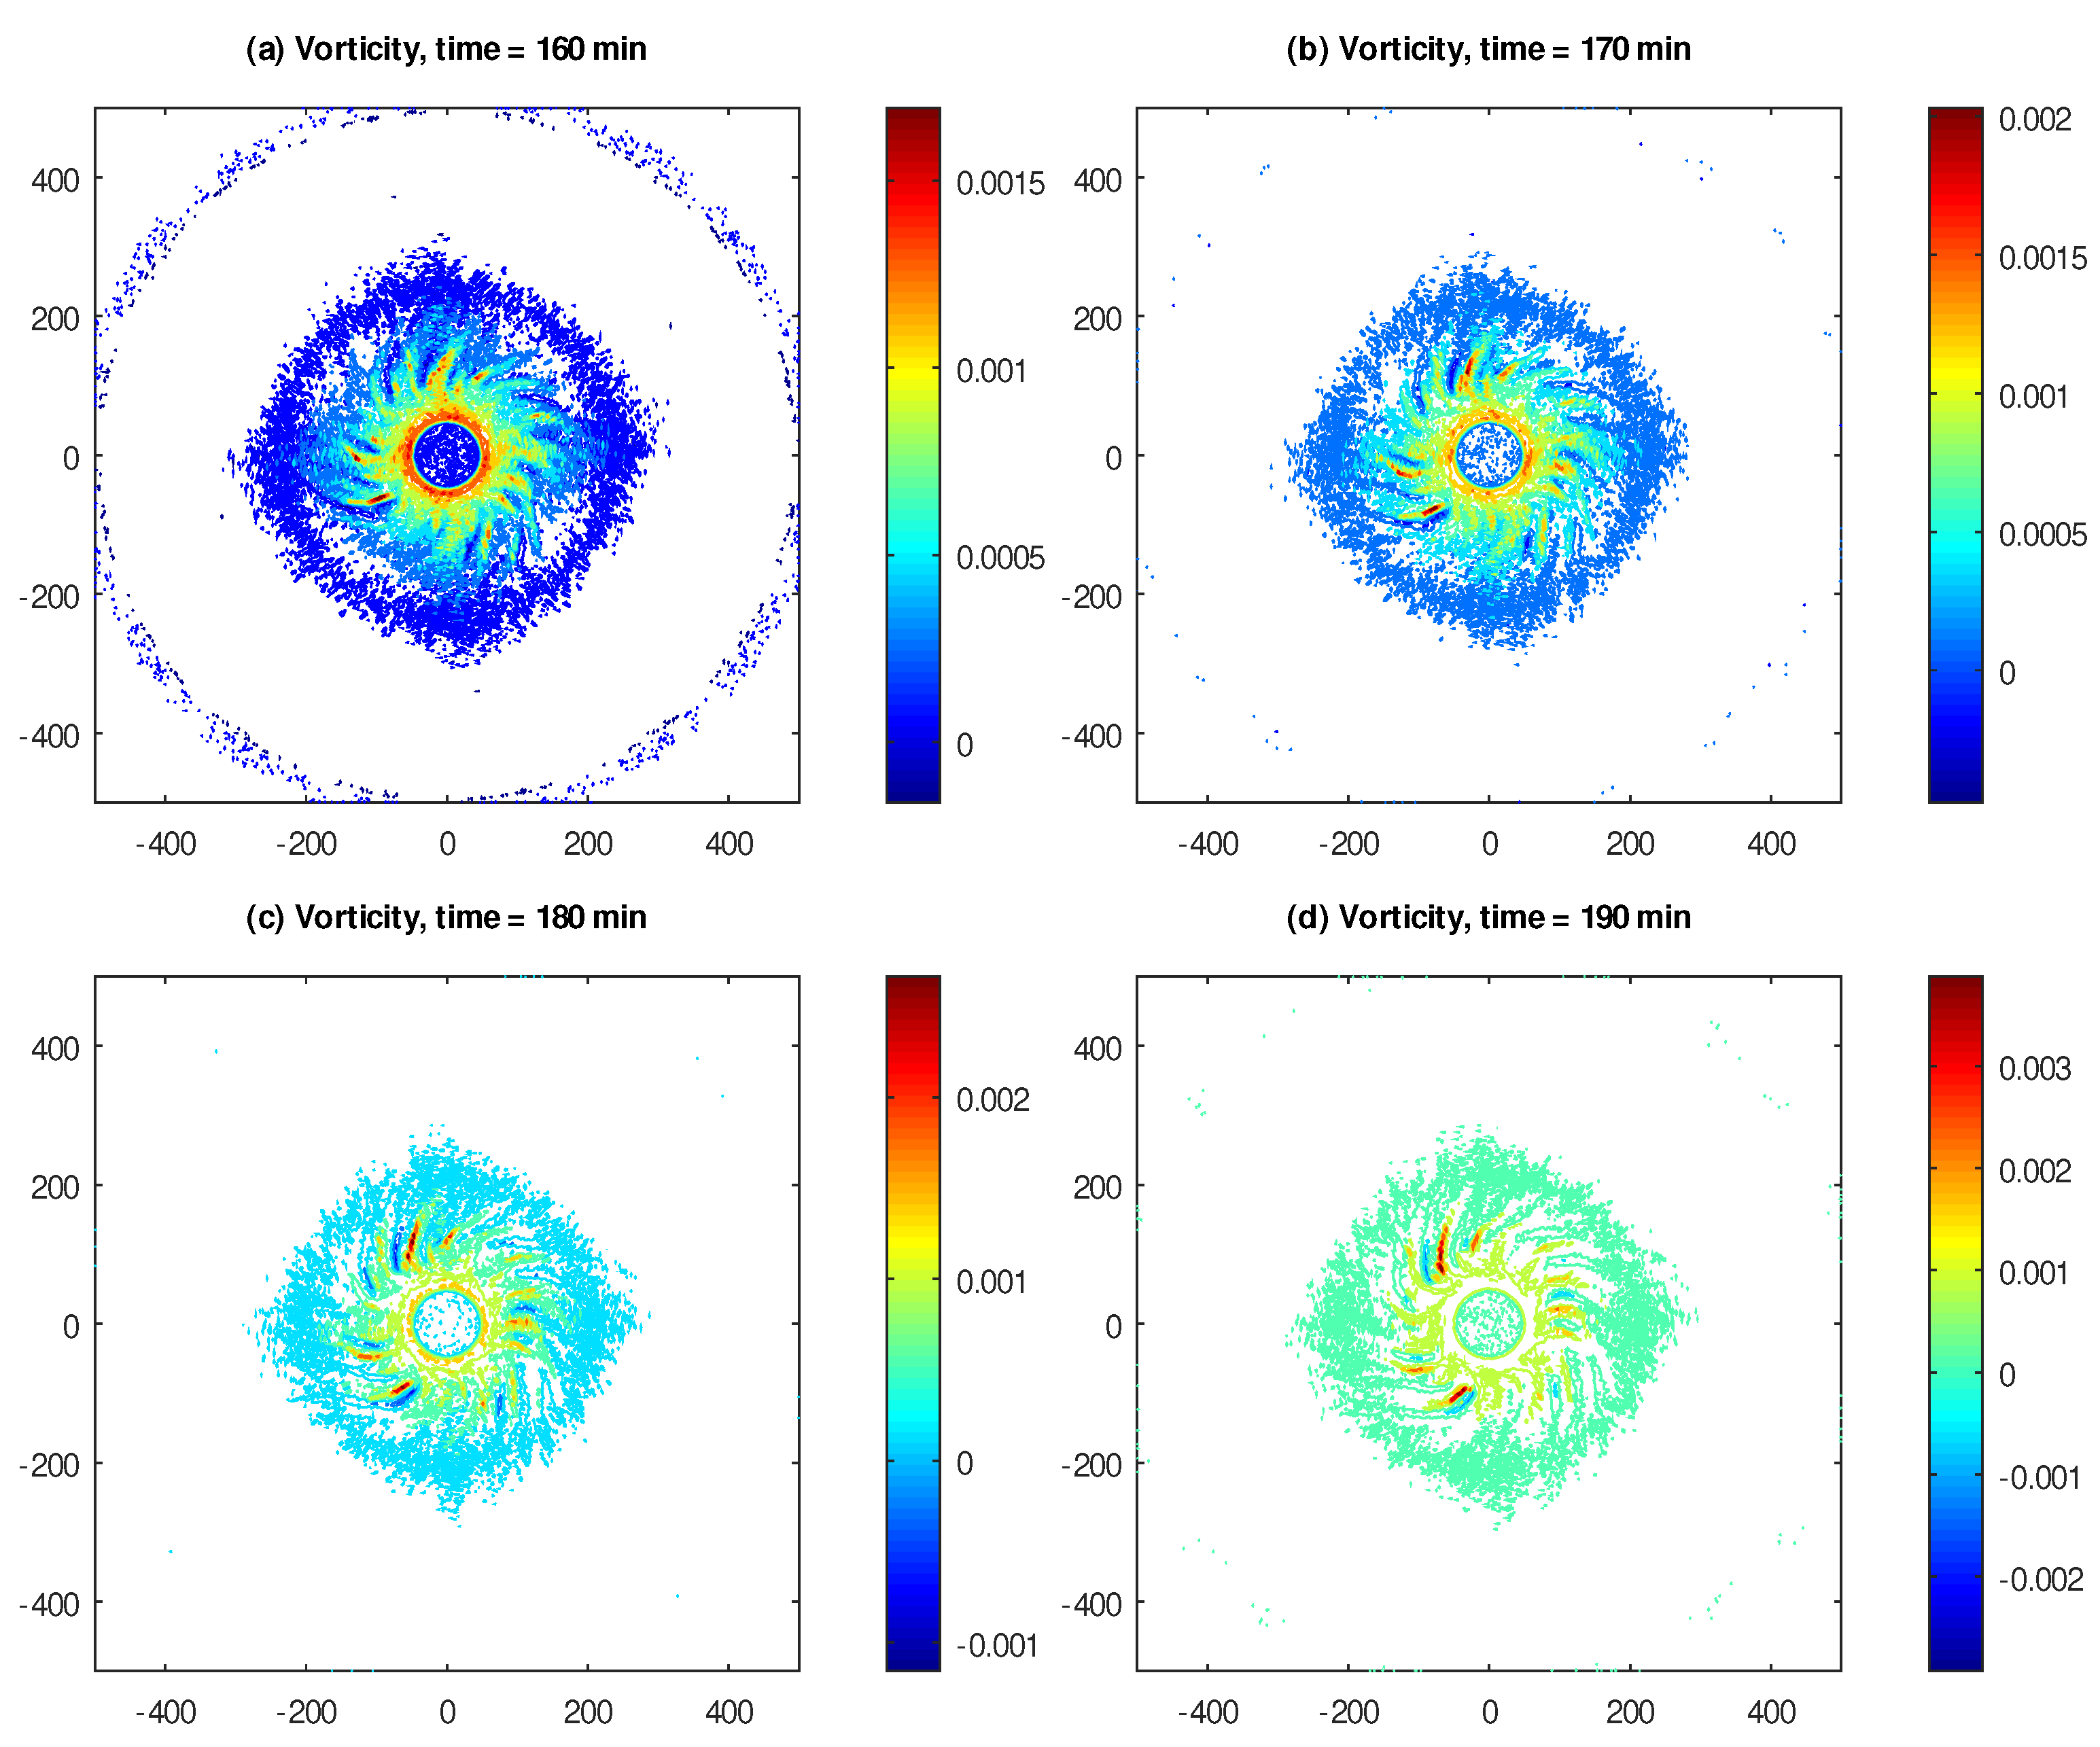
In Figure 6, we show the vertical vorticity component of the flow, captured at 160, 170, 180 and 190 min of the elapsed model time, on contour plots. Likewise, one can observe that the vorticity is largely confined to the region with maximal flow speed, and its fluctuations become progressively larger with elapsed time.
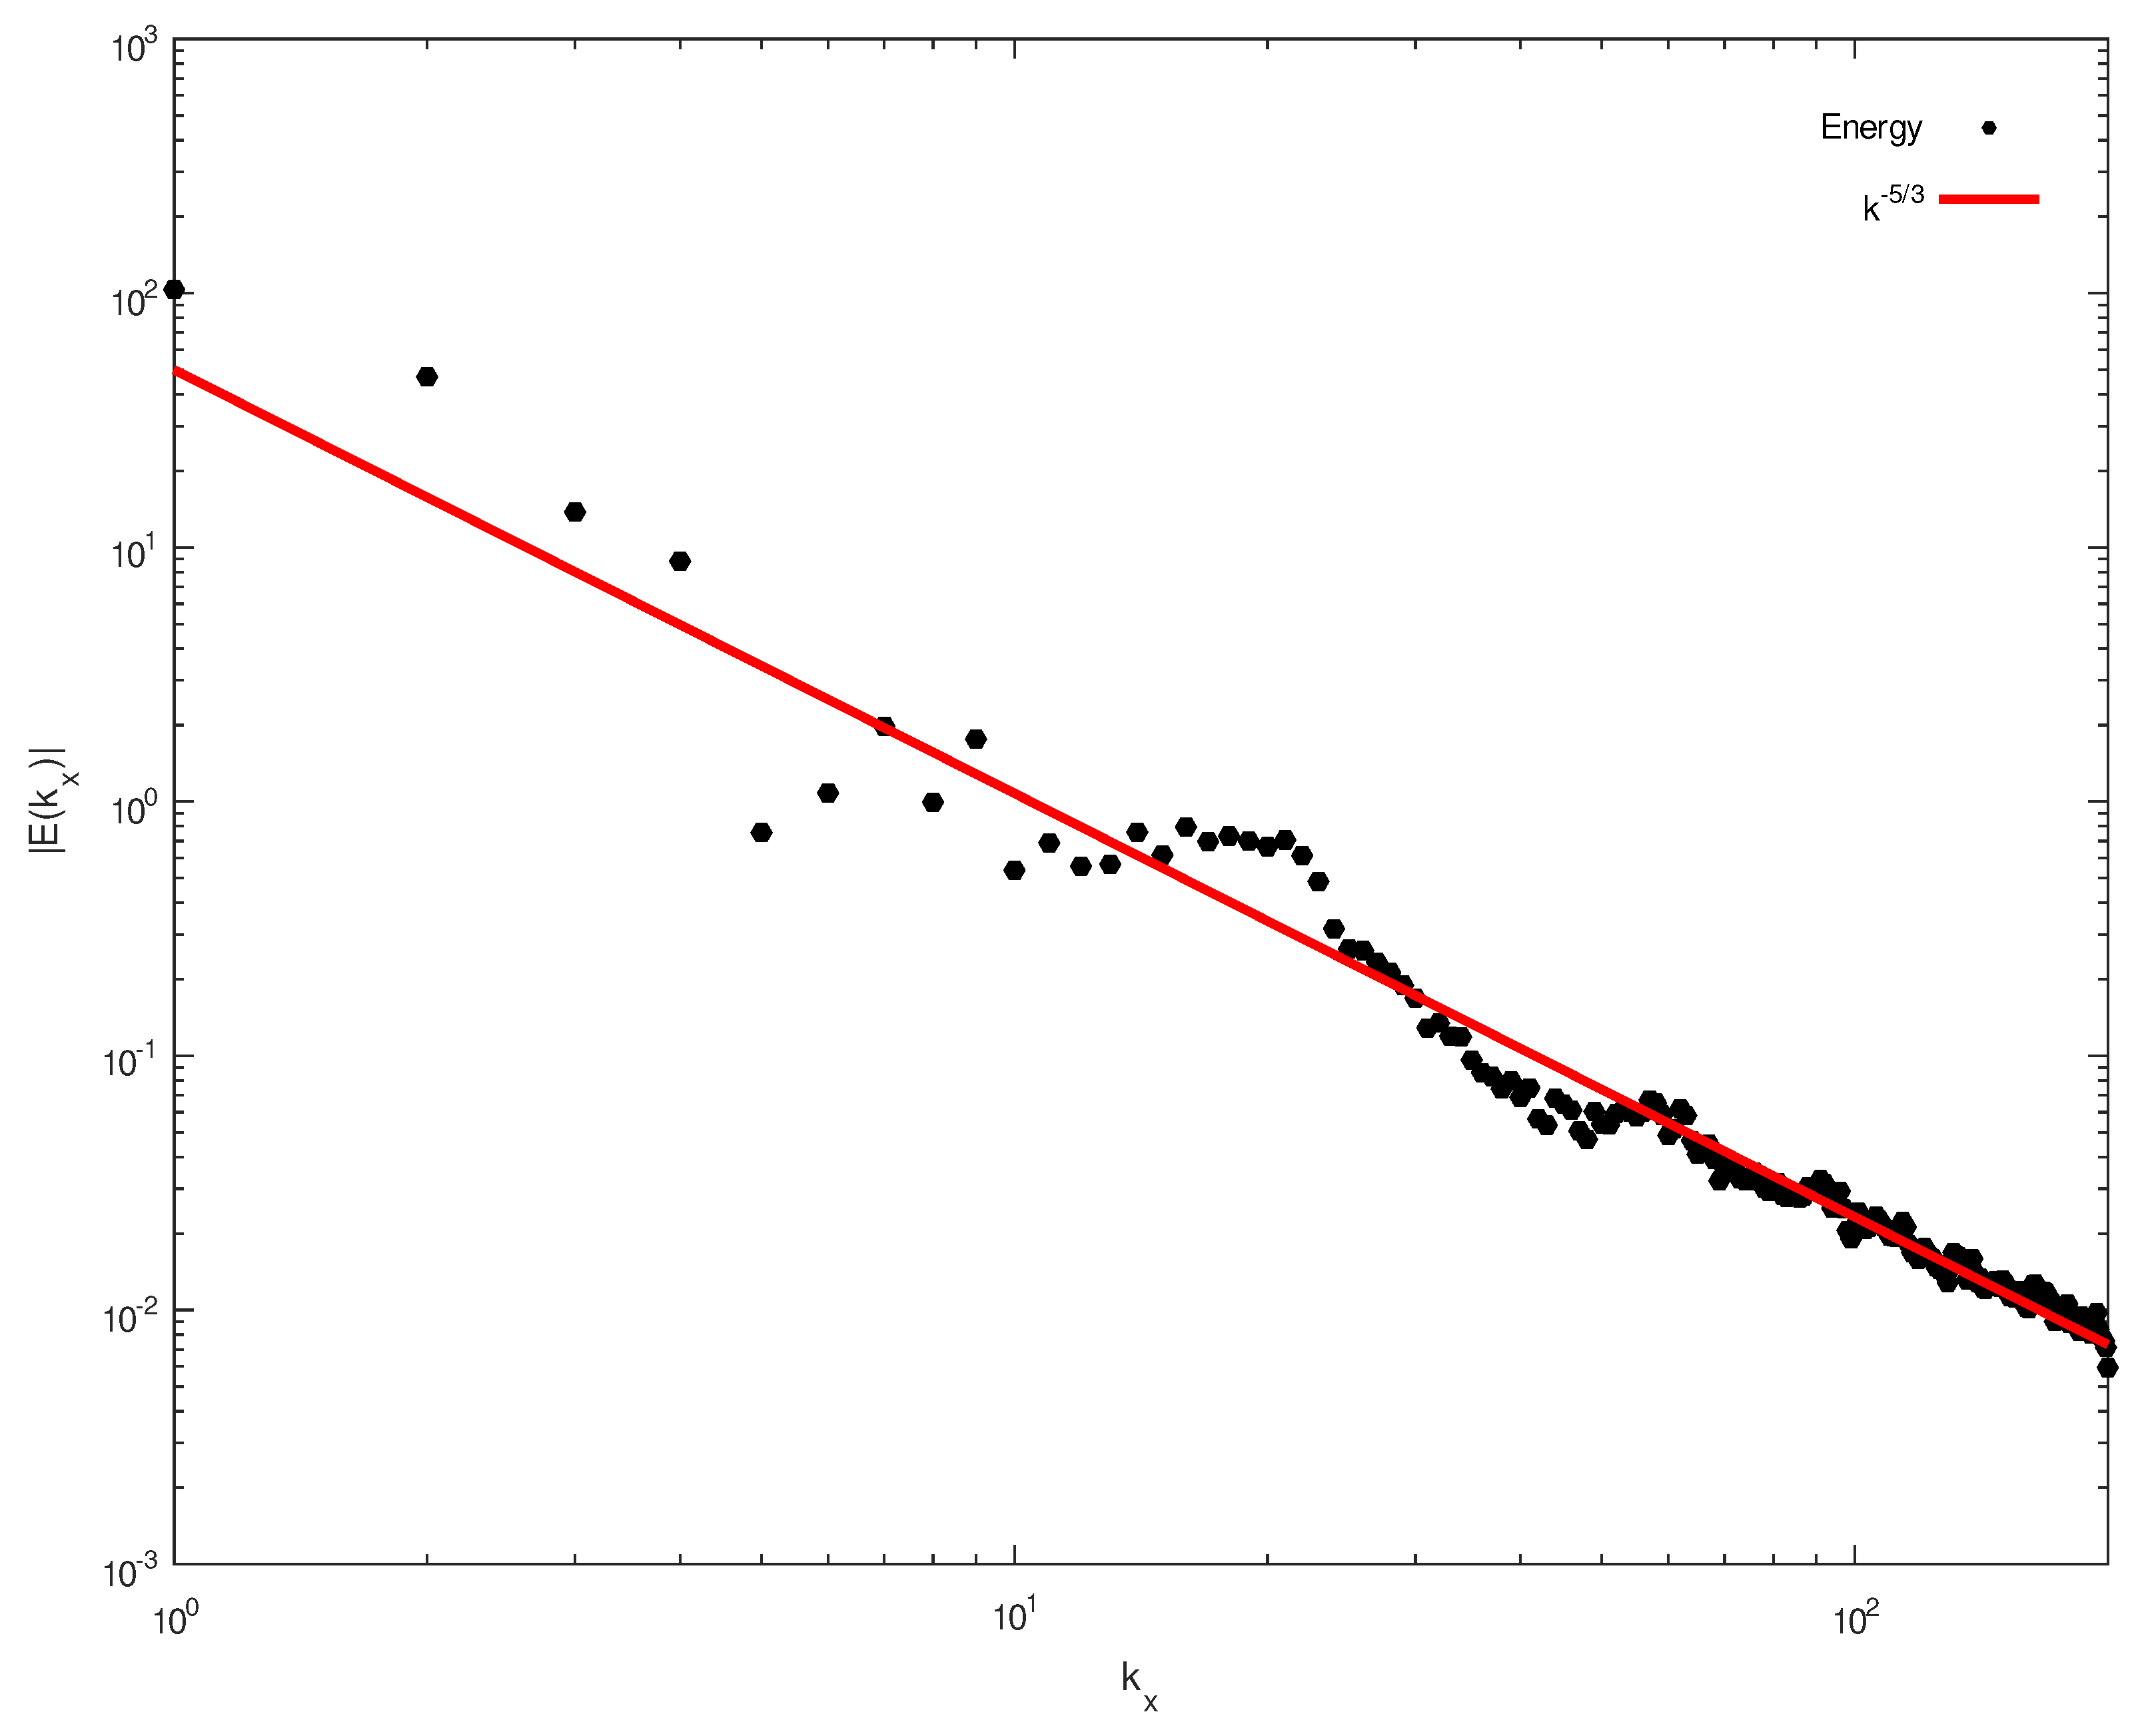
In Figure 7, we show the time-averaged kinetic energy spectrum of the flow. This spectrum was computed in the square sub-region of the domain, which extends from to km both meridionally and zonally, to reduce the effects of relatively “calm” corners of the domain. This computation was done in the same manner as above for the inertial flow, except that, due to isotropy of the flow, here, we computed the spectrum both in the zonal and meridional directions, and then took the average. The time averaging was done over the interval between 180 and 200 min of the elapsed model time, during which the most turbulent flow was observed. As we can see in Figure 7, the kinetic energy spectrum largely matches Kolmogorov’s -decay throughout the whole range of the wavenumbers. A similar decay of the kinetic energy spectrum at moderate and small scales has been observed in the Earth’s atmosphere [8].
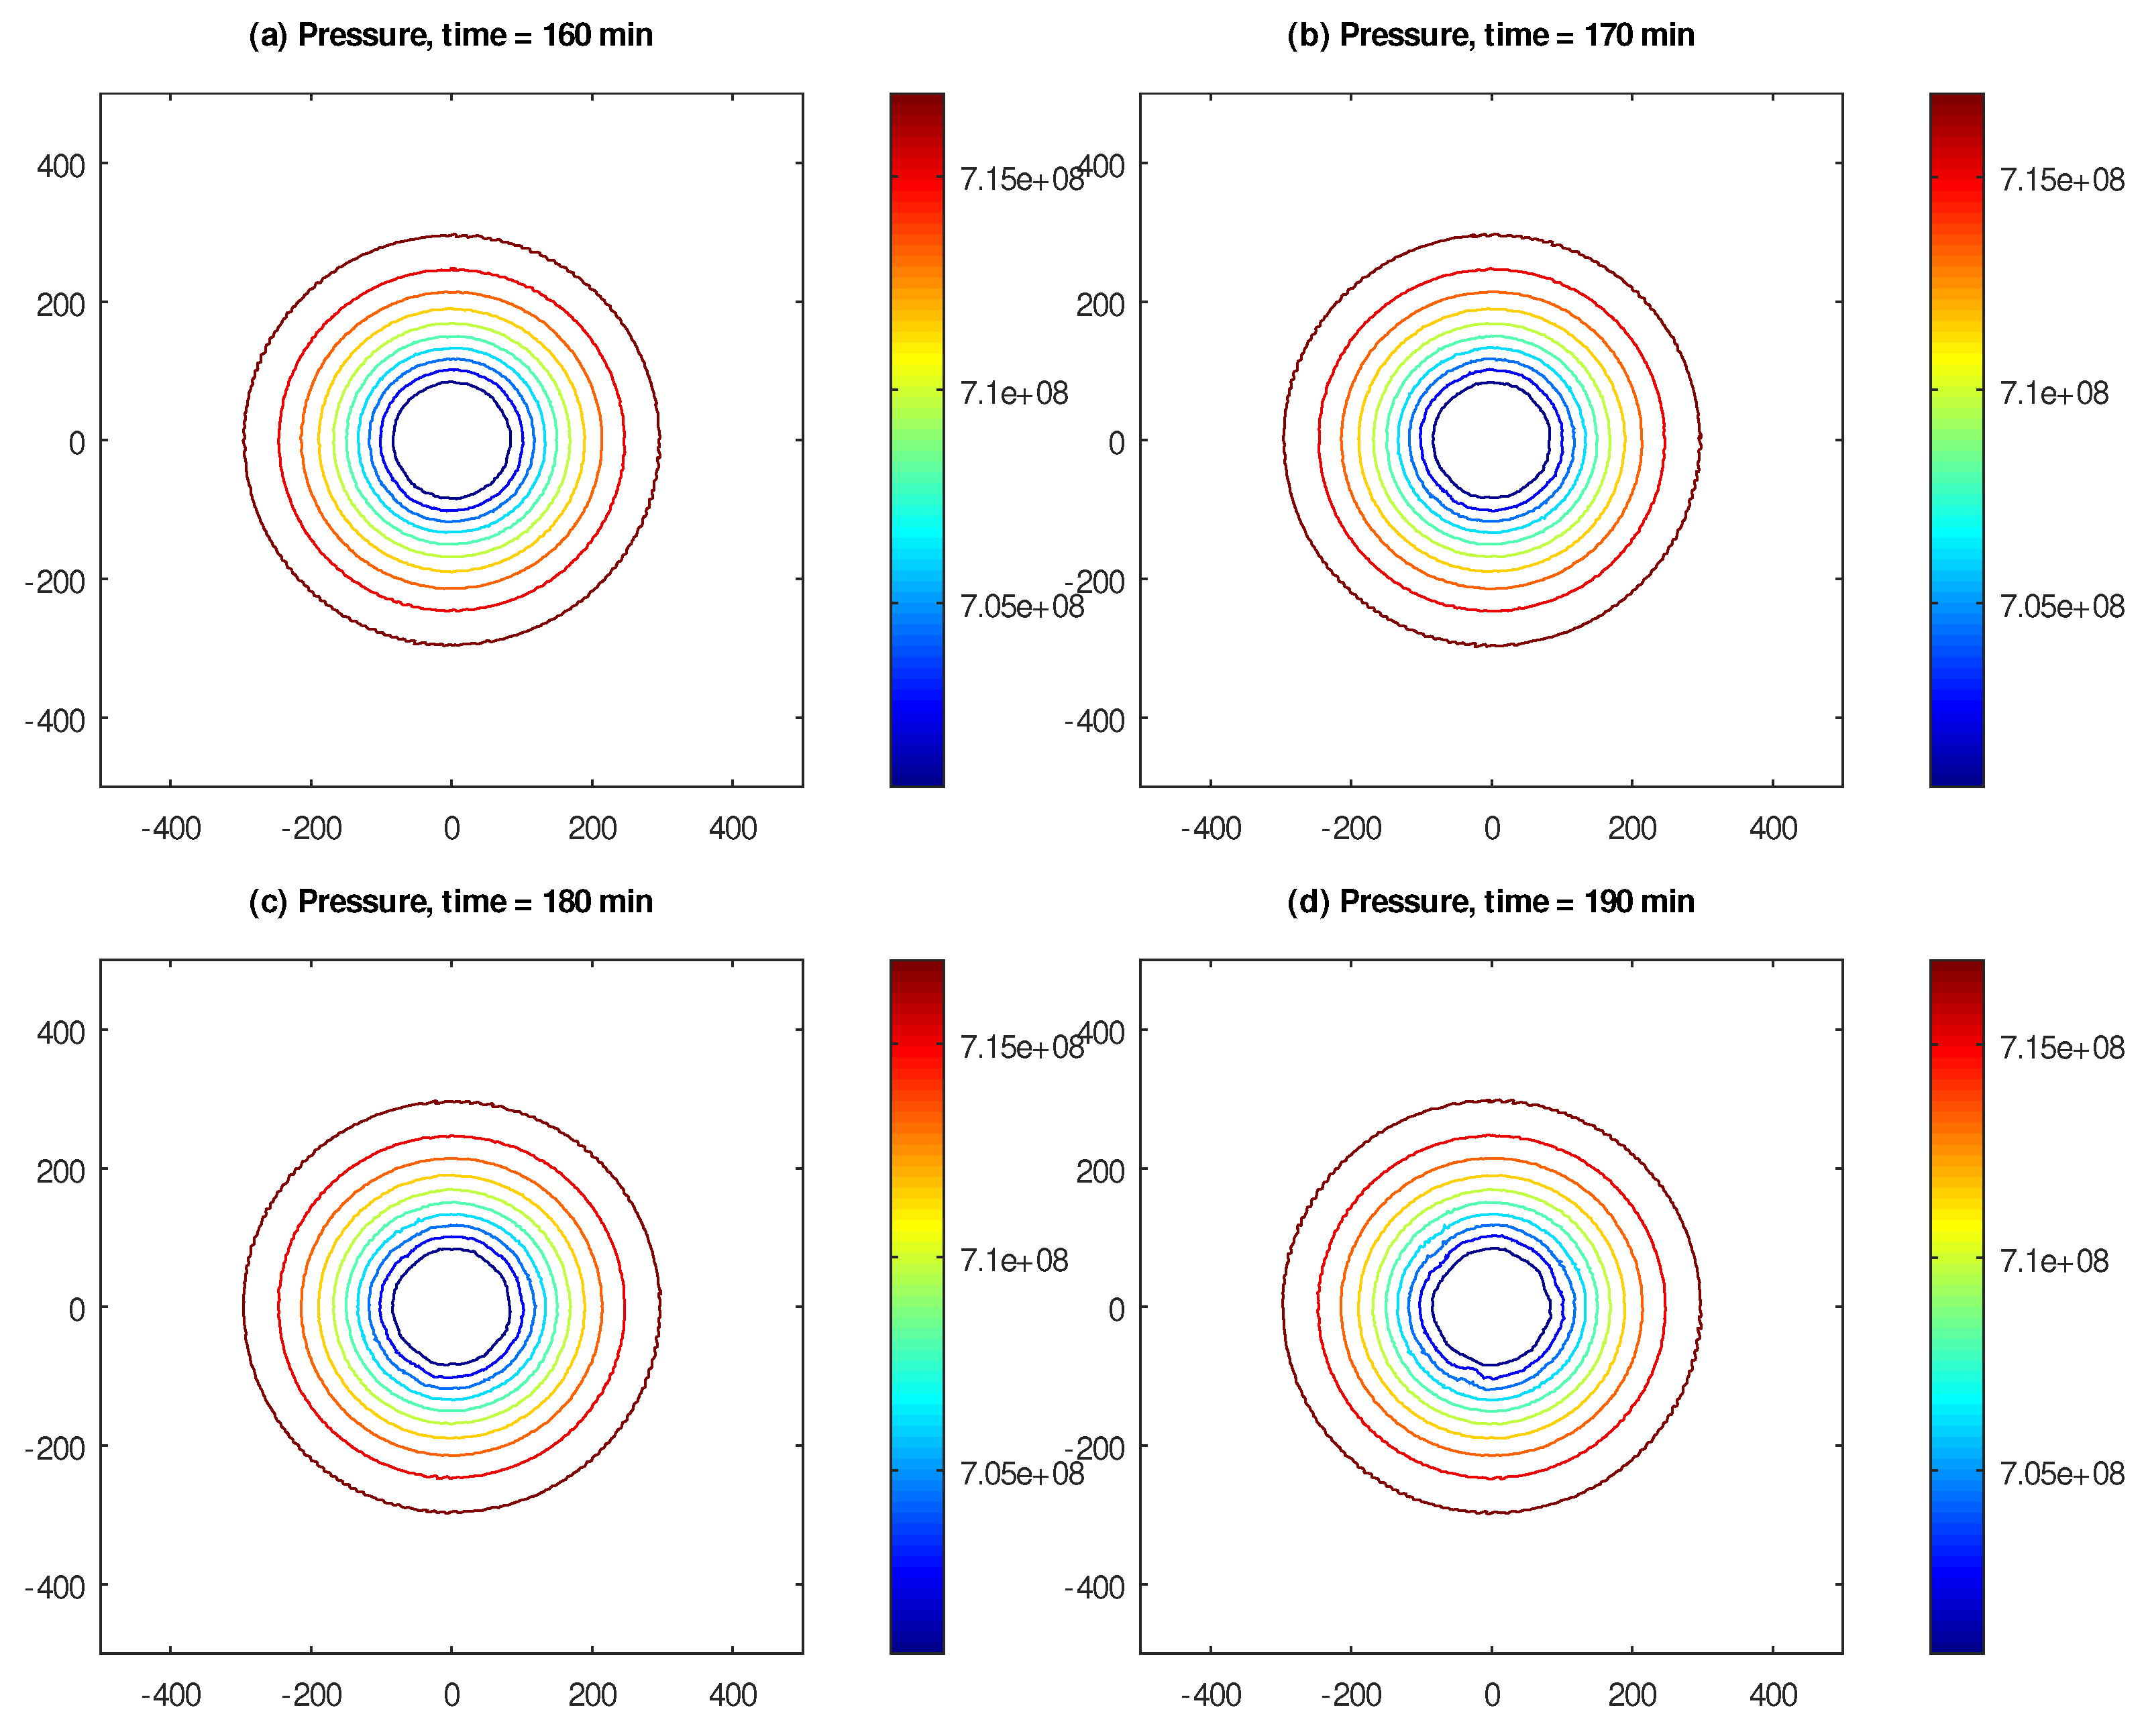
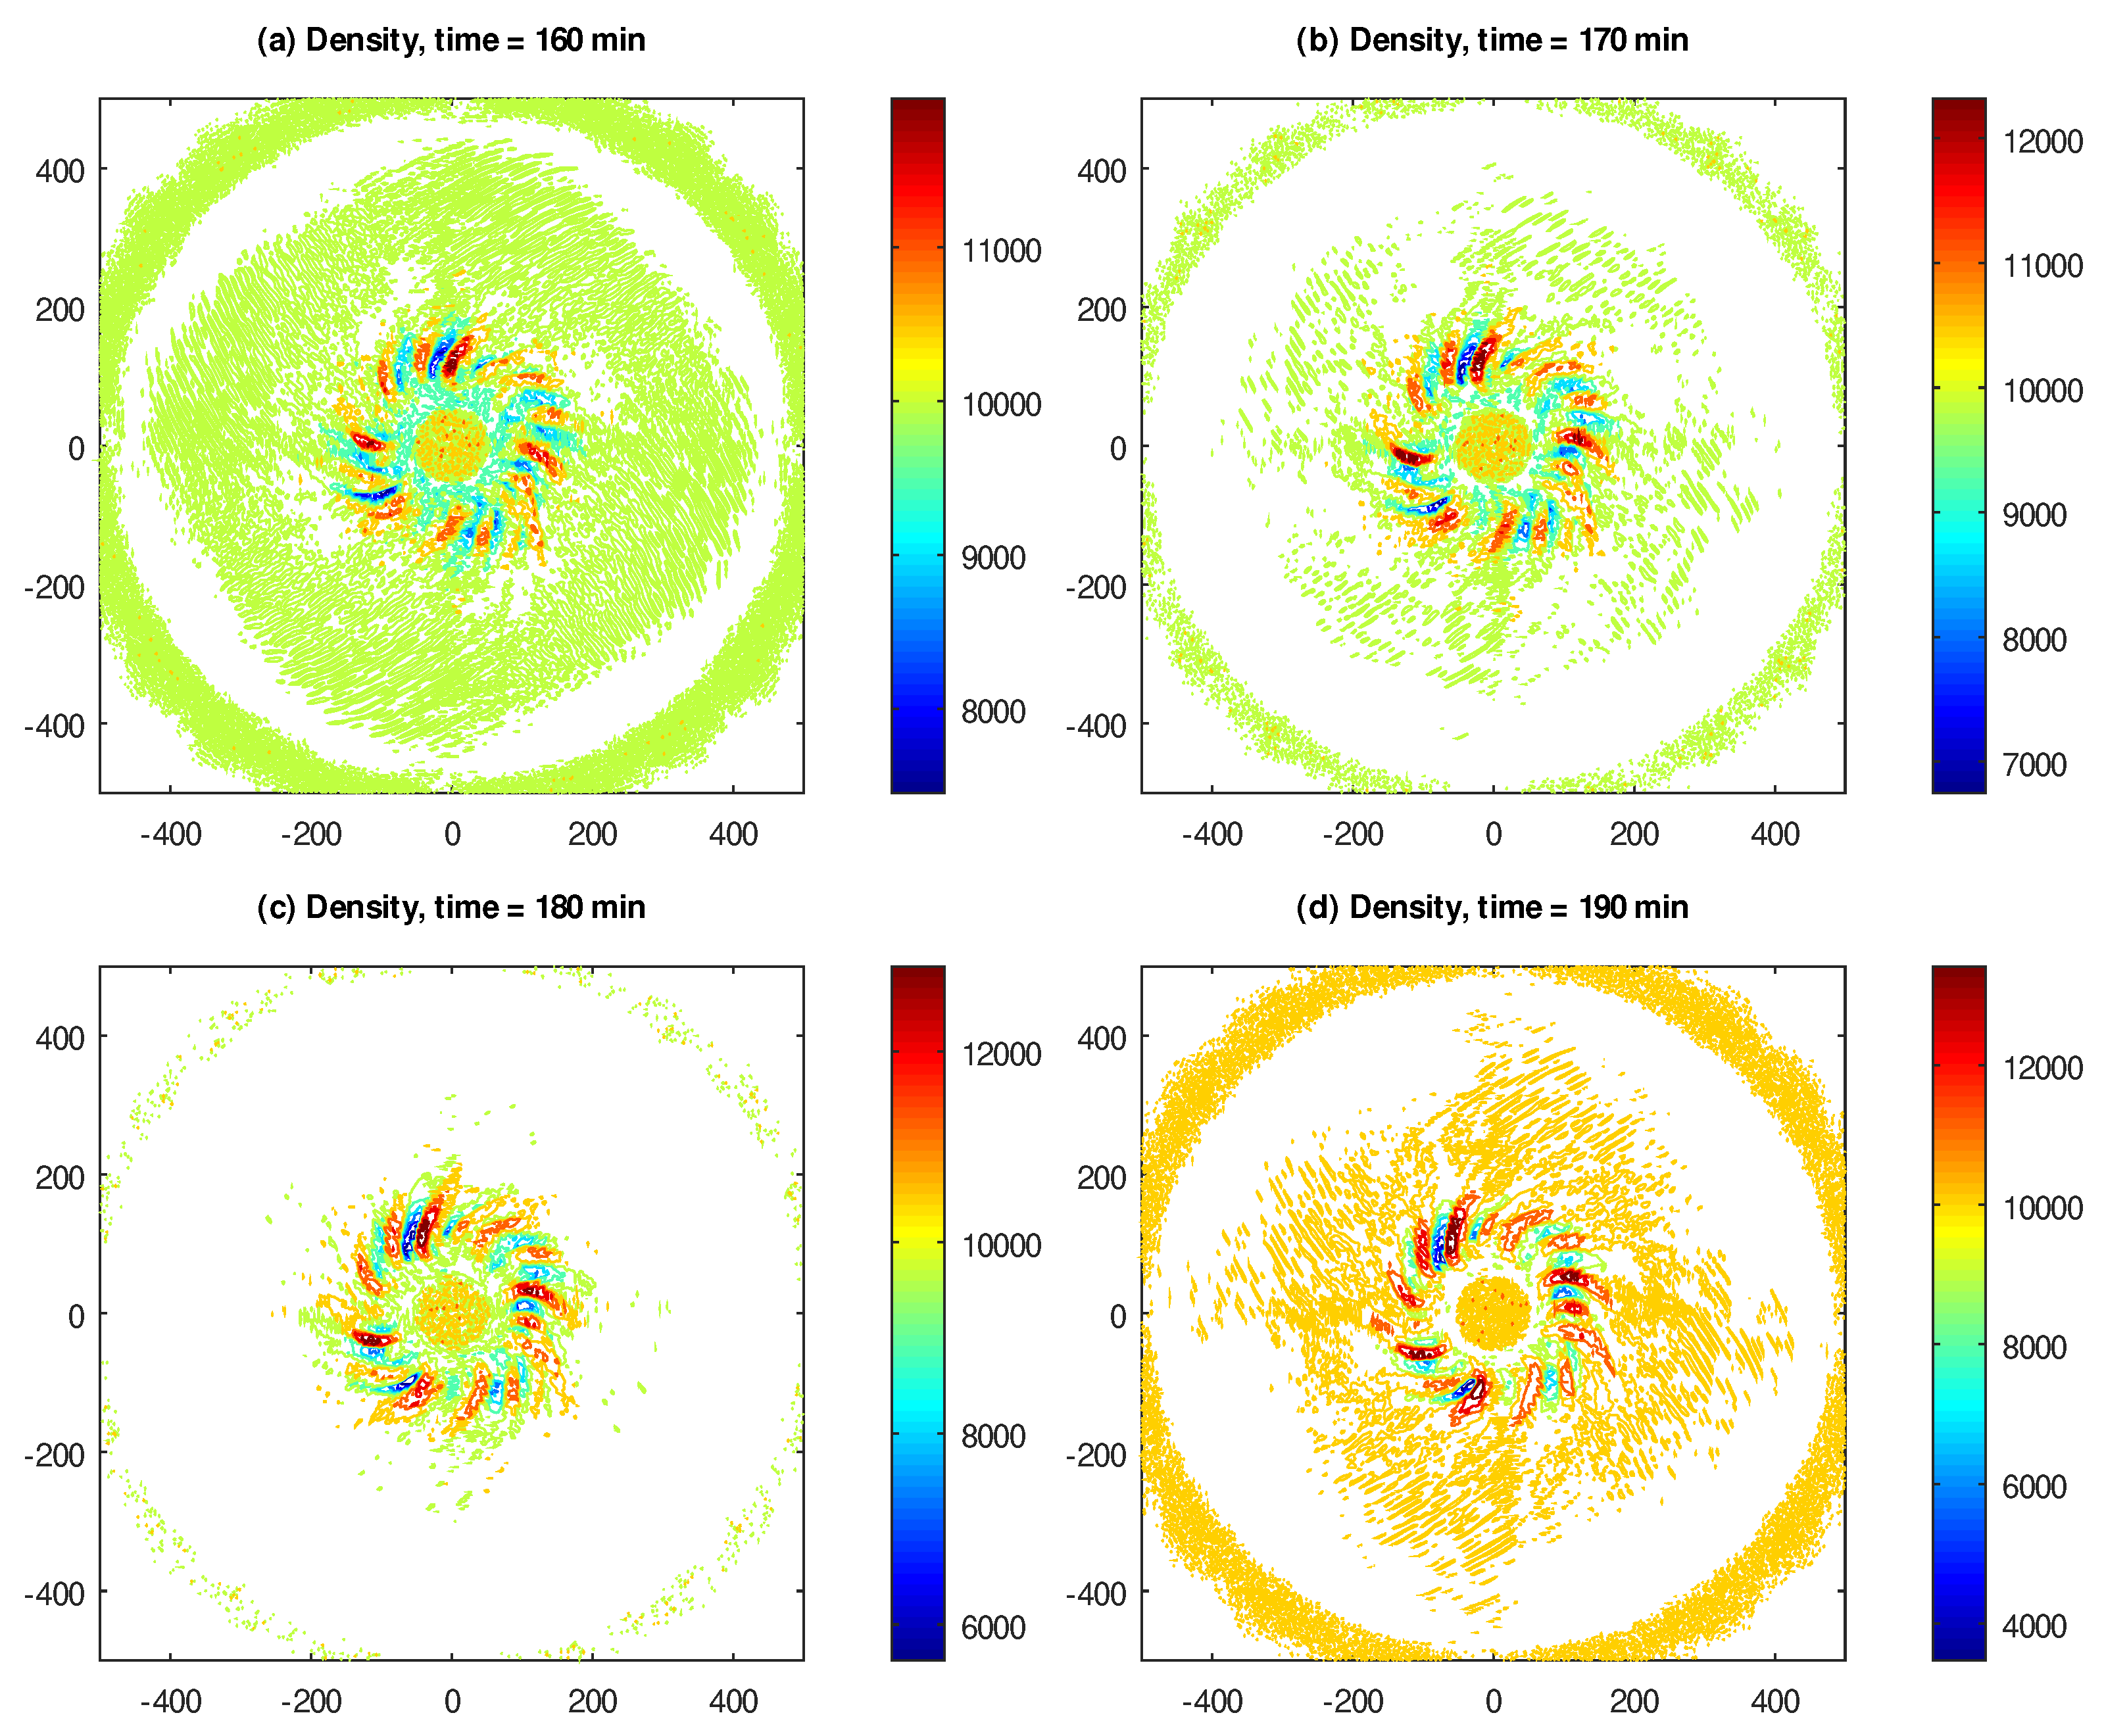
In Figure 8 and Figure 9, we show the contour plots of the pressure and density , respectively, of the cyclostrophic vortex, captured at 160, 170, 180 and 190 min of the elapsed model time. Note that, while the pressure assumes the form of a “basin” with closed level curves (which is what naturally occurs in cyclones), the density exhibits the same unrealistic variations as above in Figure 4 for the inertial flow.
5. Summary
In the current work, we investigate the ability of our model of a balanced compressible hard sphere gas flow [9] to produce turbulent motions from a laminar initial condition in a purely two-dimensional setting, which corresponds to the large-scale dynamics of the Earth’s atmosphere. The equations for such a flow are derived in the same manner as in our previous work, with the additional condition that a strong external acceleration in the downward direction, together with an impenetrable bottom boundary of the domain, compresses the gas into a relatively thin horizontal slab.
We simulate two prototype scenarios of large-scale atmospheric dynamics—an inertial jet, and a cyclostrophic vortex. In the inertial jet scenario, we observe that an initially laminar straight jet flow develops turbulent motions, bearing a close resemblance to Reynolds’ famous experiment [31]. Moreover, the Fourier spectrum of the kinetic energy of the turbulent part of the inertial flow shows the Kolmogorov -decay at moderate scales, and the -decay at small scales. In the cyclostrophic vortex scenario, turbulent motions develop in the region of the maximal flow speed, whereas the Kolmogorov -decay of the kinetic energy spectrum is observed throughout the whole range of the Fourier wavenumbers.
The main result of the current work is the surprising discovery that, in our model of a balanced compressible hard sphere gas flow, turbulent motions with Kolmogorov kinetic energy spectra develop not only in a fully three-dimensional flow [9], but also in a restricted, two-dimensional setting. If our balanced gas flow equations indeed constitute a faithful model of the actual phenomenon of turbulence in gases, this result suggests that it should be possible to capture large-scale turbulent atmospheric features even in simplified, lower-dimensional settings, such as those which are typically used in long-range climate change predictions.
Funding
This work was supported by the Simons Foundation, grant #636144.
Data Availability Statement
The data that support the findings of this study are available from the author upon reasonable request.
Conflicts of Interest
The author declares no conflict of interest.
References
- Reynolds, O. An Experimental Investigation of the Circumstances which Determine whether the Motion of Water shall be Direct or Sinuous, and of the Law of Resistance in Parallel Channels. Philos. Trans. R. Soc. Lond. 1883, 35, 84–99. [Google Scholar]
- Kolmogorov, A. Local Structure of Turbulence in an Incompressible Fluid at Very High Reynolds Numbers. Dokl. Akad. Nauk SSSR 1941, 30, 299–303. [Google Scholar] [CrossRef]
- Kolmogorov, A. Decay of Isotropic Turbulence in an Incompressible Viscous Fluid. Dokl. Akad. Nauk SSSR 1941, 31, 538–541. [Google Scholar]
- Kolmogorov, A. Energy Dissipation in Locally Isotropic Turbulence. Dokl. Akad. Nauk SSSR 1941, 32, 19–21. [Google Scholar]
- Obukhov, A. On the Distribution of Energy in the Spectrum of a Turbulent Flow. Izv. Akad. Nauk. SSSR Seriya Geogr. Geofiz. 1941, 5, 453–466. [Google Scholar]
- Obukhov, A. Structure of the Temperature Field in Turbulent Flow. Izv. Akad. Nauk. SSSR Seriya Geogr. Geofiz. 1949, 13, 58–69. [Google Scholar]
- Obukhov, A. Some Specific Features of Atmospheric Turbulence. J. Geophys. Res. 1962, 67, 3011–3014. [Google Scholar] [CrossRef]
- Nastrom, G.; Gage, K. A Climatology of Atmospheric Wavenumber Spectra of Wind and Temperature Observed by Commercial Aircraft. J. Atmos. Sci. 1985, 42, 950–960. [Google Scholar] [CrossRef] [Green Version]
- Abramov, R. Macroscopic Turbulent Flow via Hard Sphere Potential. AIP Adv. 2021, 11, 085210. [Google Scholar] [CrossRef]
- Bogoliubov, N. Kinetic Equations. J. Exp. Theor. Phys. 1946, 16, 691–702. [Google Scholar]
- Born, M.; Green, H. A General Kinetic Theory of Liquids I: The Molecular Distribution Functions. Proc. R. Soc. Lond. Ser. A Math. Phys. Sci. 1946, 188, 10–18. [Google Scholar]
- Kirkwood, J. The Statistical Mechanical Theory of Transport Processes I: General Theory. J. Chem. Phys. 1946, 14, 180–201. [Google Scholar] [CrossRef]
- Vlasov, A. On Vibration Properties of Electron Gas. J. Exp. Theor. Phys. 1938, 8, 291. [Google Scholar]
- Batchelor, G. An Introduction to Fluid Dynamics; Cambridge University Press: New York, NY, USA, 2000. [Google Scholar]
- Golse, F. The Boltzmann Equation and Its Hydrodynamic Limits. In Handbook of Differential Equations: Evolutionary Equations; Elsevier: Amsterdam, The Netherlands, 2005; Volume 2, Chapter 3; pp. 159–301. [Google Scholar]
- Abramov, R. Formation of Turbulence via an Interaction Potential. arXiv 2021, arXiv:2011.10042. [Google Scholar]
- Rényi, A. On Measures of Entropy and Information. In Proceedings of the Fourth Berkeley Symposium on Mathematical Statistics and Probability, Volume 1: Contributions to the Theory of Statistics; University of California Press: Berkeley, CA, USA, 1961; pp. 547–561. [Google Scholar]
- Kullback, S.; Leibler, R. On Information and Sufficiency. Ann. Math. Stat. 1951, 22, 79–86. [Google Scholar] [CrossRef]
- Abramov, R. The Random Gas of Hard Spheres. J 2019, 2, 162–205. [Google Scholar] [CrossRef] [Green Version]
- Cercignani, C. The Boltzmann Equation and Its Applications. In Applied Mathematical Sciences; Springer: New York, NY, USA, 1988; Volume 67. [Google Scholar]
- Chapman, S.; Cowling, T. The Mathematical Theory of Non-Uniform Gases, 3rd ed.; Cambridge Mathematical Library, Cambridge University Press: New York, NY, USA, 1991. [Google Scholar]
- Grad, H. On the Kinetic Theory of Rarefied Gases. Commun. Pure Appl. Math. 1949, 2, 331–407. [Google Scholar] [CrossRef]
- Cercignani, C. Theory and Application of the Boltzmann Equation; Elsevier Science: New York, NY, USA, 1975. [Google Scholar]
- Hirschfelder, J.; Curtiss, C.; Bird, R. The Molecular Theory of Gases and Liquids; Wiley: Hoboken, NJ, USA, 1964. [Google Scholar]
- Jones, F. Interpolation Formulas for Viscosity of Six Gases: Air, Nitrogen, Carbon Dioxide, Helium, Argon and Oxygen; NBS Technical Note 1186; National Bureau of Standards: Washington, DC, USA, 1984. [Google Scholar]
- Weller, H.; Tabor, G.; Jasak, H.; Fureby, C. A Tensorial Approach to Computational Continuum Mechanics Using Object-Oriented Techniques. Comput. Phys. 1998, 12, 620–631. [Google Scholar] [CrossRef]
- Greenshields, C.; Weller, H.; Gasparini, L.; Reese, J. Implementation of Semi-Discrete, Non-Staggered Central Schemes in a Colocated, Polyhedral, Finite Volume Framework, for High-Speed Viscous Flows. Int. J. Numer. Methods Fluids 2010, 63, 1–21. [Google Scholar] [CrossRef] [Green Version]
- Kurganov, A.; Tadmor, E. New High-Resolution Central Schemes for Nonlinear Conservation Laws and Convection–Diffusion Equations. J. Comput. Phys. 2001, 160, 241–282. [Google Scholar] [CrossRef] [Green Version]
- Van Leer, B. Towards the Ultimate Conservative Difference Scheme, II: Monotonicity and Conservation Combined in a Second Order Scheme. J. Comput. Phys. 1974, 17, 361–370. [Google Scholar] [CrossRef]
- McCalpin, J.; Haidvogel, D. Phenomenology of the Low-Frequency Variability in a Reduced-Gravity, Quasigeostrophic Double-Gyre Model. J. Phys. Oceanogr. 1996, 26, 739–752. [Google Scholar] [CrossRef] [Green Version]
- Reynolds, O. On the Dynamical Theory of Incompressible Viscous Fluids and the Determination of the Criterion. Philos. Trans. R. Soc. A 1895, 186, 123–164. [Google Scholar]
- Von Kármán, T. Aerodynamics; McGraw-Hill: New York, NY, USA, 1963. [Google Scholar]
- Choi, D.; Showman, A. Power Spectral Analysis of Jupiter’s Clouds and Kinetic Energy from Cassini. Icarus 2011, 216, 597–609. [Google Scholar] [CrossRef] [Green Version]
- Moriconi, M.; Migliorini, A.; Altieri, F.; Adriani, A.; Mura, A.; Orton, G.; Lunine, J.; Grassi, D.; Atreya, S.; Ingersoll, A.; et al. Turbulence Power Spectra in Regions Surrounding Jupiter’s South Polar Cyclones from Juno/JIRAM. J. Geophys. Res. Planets 2020, 125, e2019JE006096. [Google Scholar] [CrossRef]
Figure 1.
Speed of the inertial flow, expressed in m/s, and captured at (a) 12, (b) 18, (c) 24 and (d) 30 h of elapsed model time. The domain size is 2500 × 500 km.
Figure 1.
Speed of the inertial flow, expressed in m/s, and captured at (a) 12, (b) 18, (c) 24 and (d) 30 h of elapsed model time. The domain size is 2500 × 500 km.

Figure 2.
Vorticity of the inertial flow, expressed in s, and captured at (a) 12, (b) 18, (c) 24 and (d) 30 h of elapsed model time. The domain size is 2500 × 500 km.
Figure 2.
Vorticity of the inertial flow, expressed in s, and captured at (a) 12, (b) 18, (c) 24 and (d) 30 h of elapsed model time. The domain size is 2500 × 500 km.

Figure 3.
Time-averaged kinetic energy spectrum of the inertial flow. The straight lines, corresponding to and slopes, are provided for reference.
Figure 3.
Time-averaged kinetic energy spectrum of the inertial flow. The straight lines, corresponding to and slopes, are provided for reference.

Figure 4.
Density of the inertial flow, expressed in kg/m, and captured at (a) 12, (b) 18, (c) 24 and (d) 30 h of elapsed model time. The domain size is 2500 × 500 km.
Figure 4.
Density of the inertial flow, expressed in kg/m, and captured at (a) 12, (b) 18, (c) 24 and (d) 30 h of elapsed model time. The domain size is 2500 × 500 km.

Figure 5.
Speed of the cyclostrophic flow, expressed in m/s, and captured at (a) 160, (b) 170, (c) 180 and (d) 190 min of elapsed model time. The domain size is 1000 × 1000 km.
Figure 5.
Speed of the cyclostrophic flow, expressed in m/s, and captured at (a) 160, (b) 170, (c) 180 and (d) 190 min of elapsed model time. The domain size is 1000 × 1000 km.

Figure 6.
Vorticity of the cyclostrophic flow, expressed in s, and captured at (a) 160, (b) 170, (c) 180 and (d) 190 min of elapsed model time. The domain size is 1000 × 1000 km.
Figure 6.
Vorticity of the cyclostrophic flow, expressed in s, and captured at (a) 160, (b) 170, (c) 180 and (d) 190 min of elapsed model time. The domain size is 1000 × 1000 km.

Figure 7.
The kinetic energy spectrum of the cyclostrophic flow. The straight line, corresponding to slope, is provided for reference.
Figure 7.
The kinetic energy spectrum of the cyclostrophic flow. The straight line, corresponding to slope, is provided for reference.

Figure 8.
Pressure of the cyclostrophic flow, expressed in kg/s, and captured at (a) 160, (b) 170, (c) 180 and (d) 190 min of elapsed model time. The domain size is 1000 × 1000 km.
Figure 8.
Pressure of the cyclostrophic flow, expressed in kg/s, and captured at (a) 160, (b) 170, (c) 180 and (d) 190 min of elapsed model time. The domain size is 1000 × 1000 km.

Figure 9.
Density of the cyclostrophic flow, expressed in kg/m, and captured at (a) 160, (b) 170, (c) 180 and (d) 190 min of elapsed model time. The domain size is 1000 × 1000 km.
Figure 9.
Density of the cyclostrophic flow, expressed in kg/m, and captured at (a) 160, (b) 170, (c) 180 and (d) 190 min of elapsed model time. The domain size is 1000 × 1000 km.

Publisher’s Note: MDPI stays neutral with regard to jurisdictional claims in published maps and institutional affiliations. |
© 2021 by the author. Licensee MDPI, Basel, Switzerland. This article is an open access article distributed under the terms and conditions of the Creative Commons Attribution (CC BY) license (https://creativecommons.org/licenses/by/4.0/).
Share and Cite
MDPI and ACS Style
Abramov, R.V. Turbulence in Large-Scale Two-Dimensional Balanced Hard Sphere Gas Flow. Atmosphere 2021, 12, 1520. https://doi.org/10.3390/atmos12111520
AMA Style
Abramov RV. Turbulence in Large-Scale Two-Dimensional Balanced Hard Sphere Gas Flow. Atmosphere. 2021; 12(11):1520. https://doi.org/10.3390/atmos12111520
Chicago/Turabian StyleAbramov, Rafail V. 2021. "Turbulence in Large-Scale Two-Dimensional Balanced Hard Sphere Gas Flow" Atmosphere 12, no. 11: 1520. https://doi.org/10.3390/atmos12111520
Note that from the first issue of 2016, this journal uses article numbers instead of page numbers. See further details here.