
Five Years (2014–2018) of Beta Activity Concentration and the Impact of Synoptic and Local Meteorological Conditions in Bilbao (Northern Spain)

 , , , and
Abstract
:1. Introduction
2. Materials and Methods
2.1. Study Area
2.2. Beta Activity Concentrations
2.3. Meteorological Parameters and Backward Trajectories
3. Results and Discussion
3.1. Beta Activity Concentrations
3.2. Meteorological Impact of Beta Activity Concentrations
3.3. Case Studies
- (a)
- Autumn 2015
- (b)
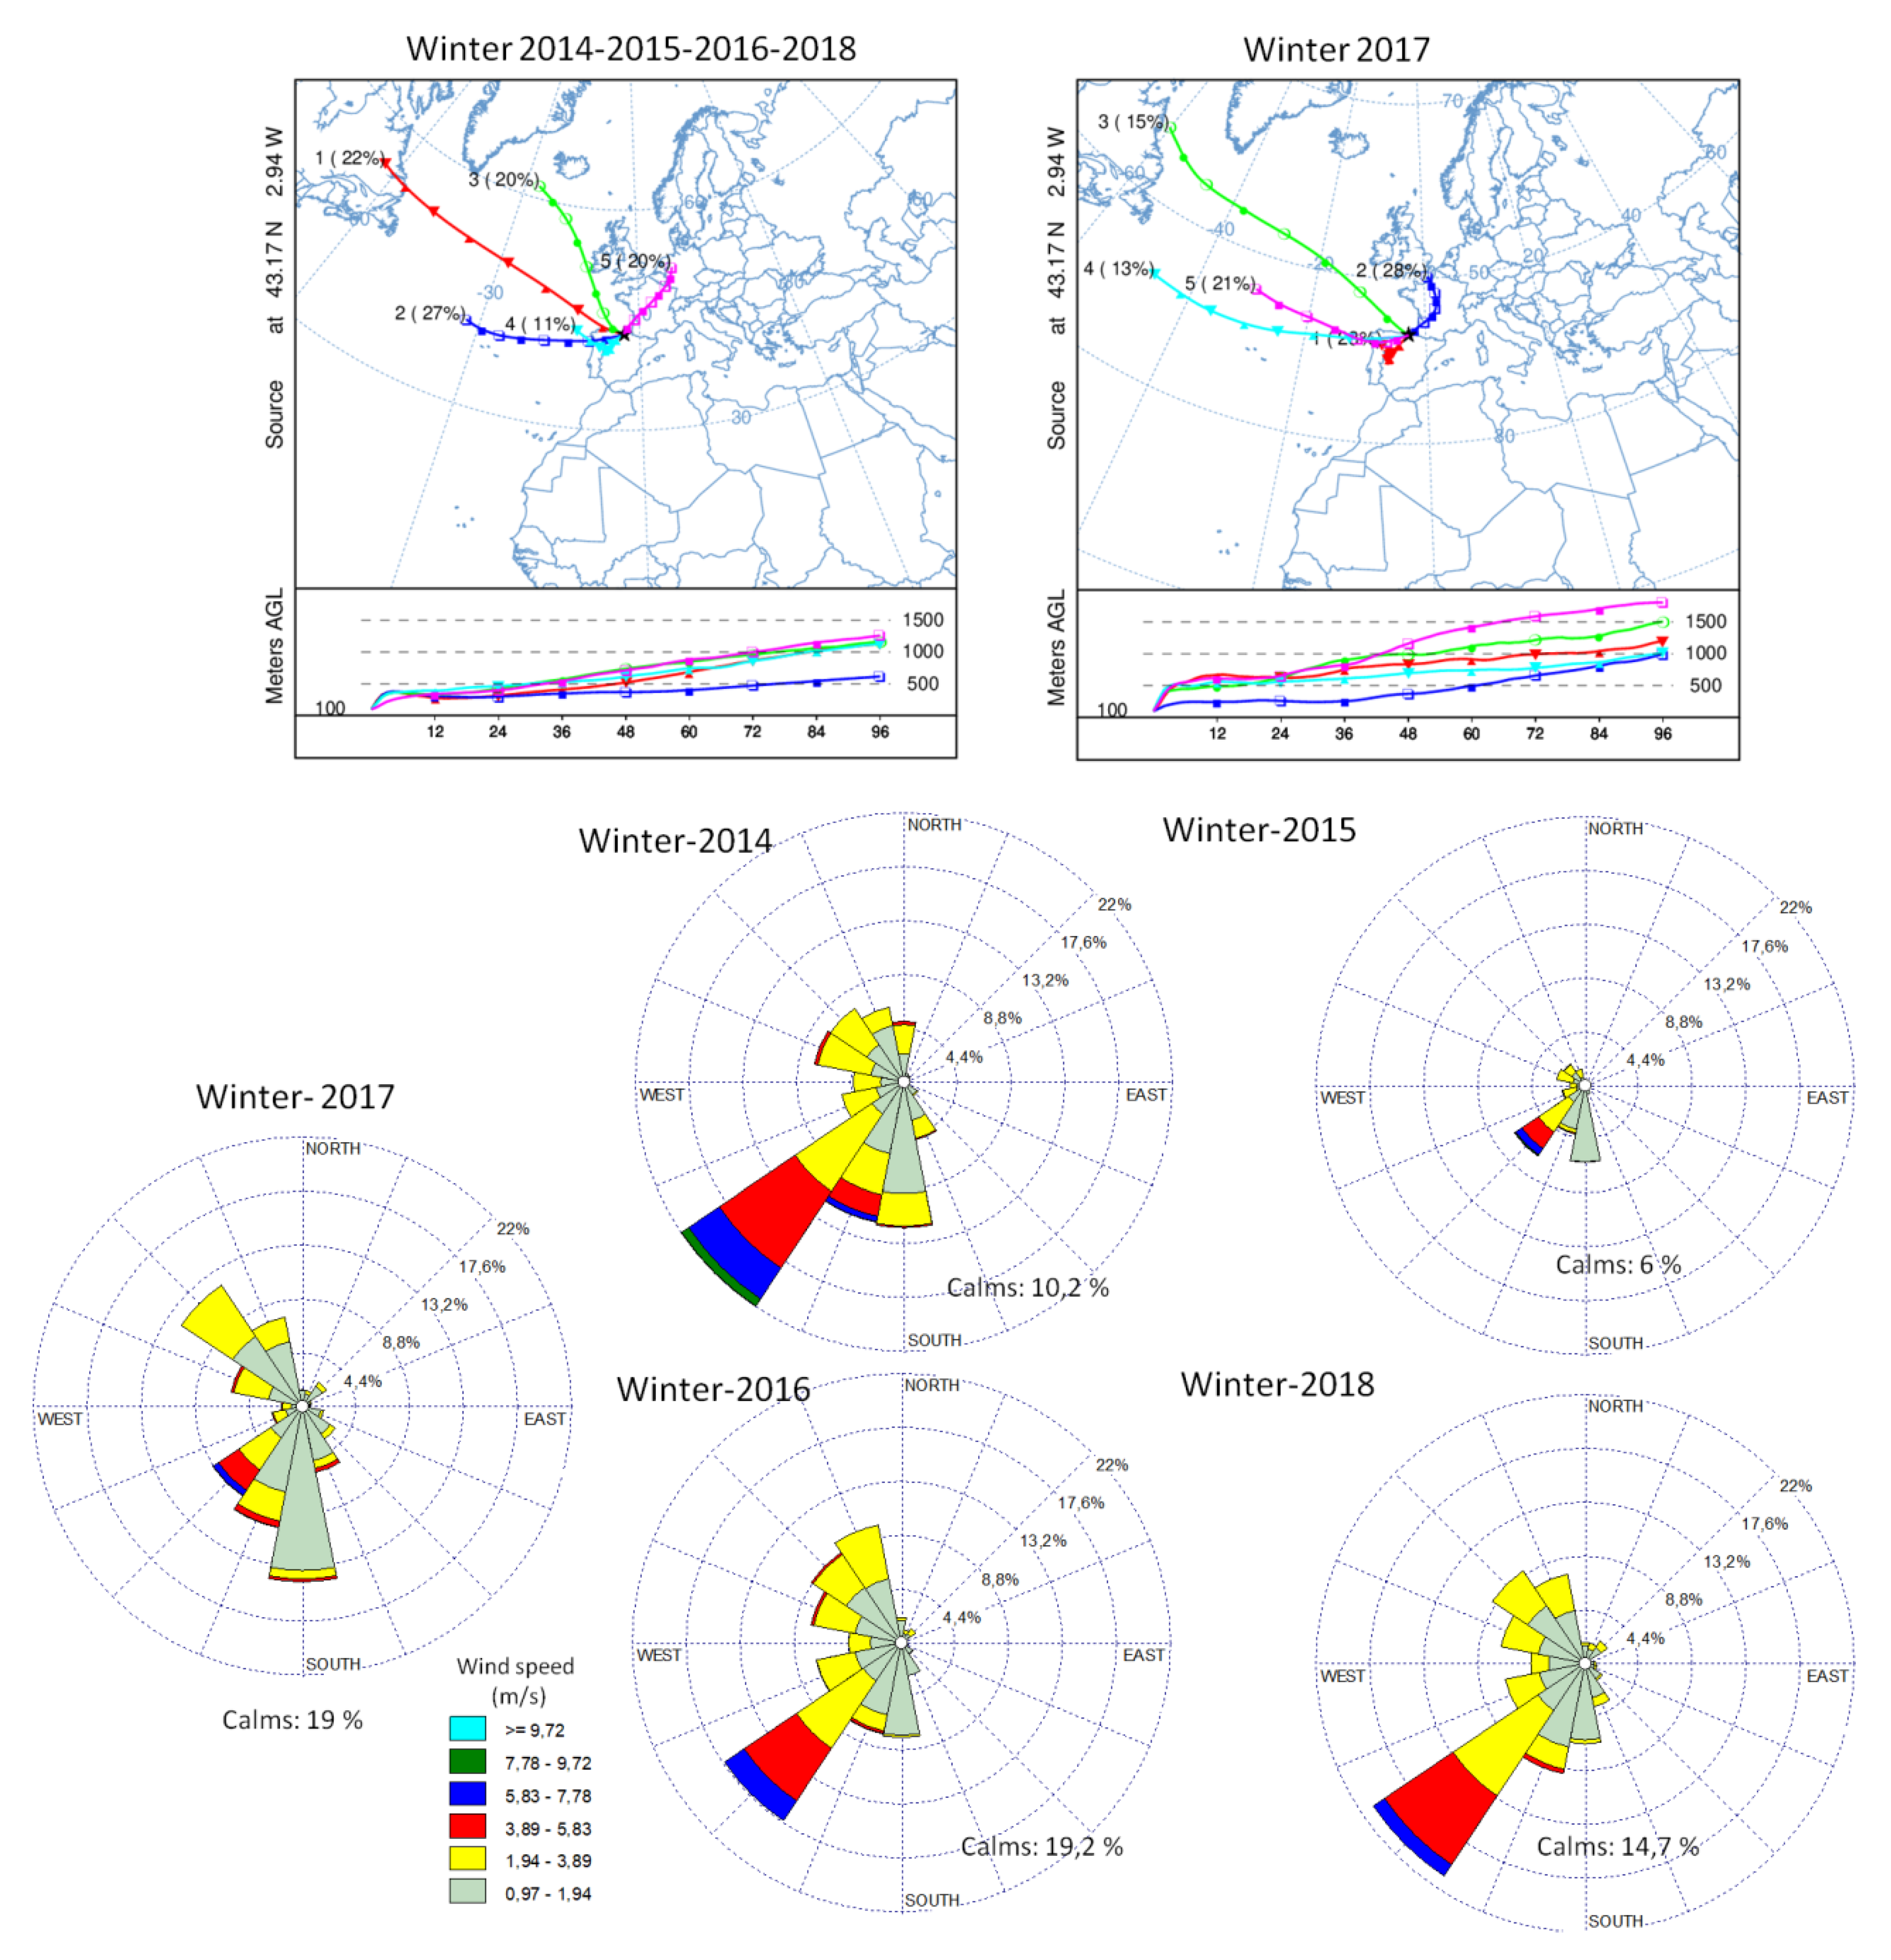
- Winter 2017
4. Conclusions
Author Contributions
Funding
Institutional Review Board Statement
Informed Consent Statement
Acknowledgments
Conflicts of Interest
References
- Papastefanou, C. Radioactive aerosols. Radioact. Environ. 2008, 12, 11–58. [Google Scholar]
- Huang, Y.-J.; Tao, Y.-L.; Lin, J.; Shang-Guan, Z.-H. Annual cycle of gross β activities in aerosol around Daya Bay area, China. Chemosphere 2009, 75, 929–933. [Google Scholar] [CrossRef] [PubMed]
- United Nations Scientific Committee on the Effects of Atomic Radiation (UNSCEAR). Report 2000: Sources and Effects of Ionizing Radiation; UNSCEAR: New York, NY, USA, 2000. [Google Scholar]
- Beer, J.; McCracken, K.; von Steiger, R. Cosmogenic Radionuclides; Springer: Berlin/Heidelberg, Germany, 2012. [Google Scholar] [CrossRef]
- IAEA. Radioactive Particles in the Environment: Sources, Particle Characterization and Analytical Techniques; IAEA-TECDOC No. 1663; IAEA: Vienna, Austria, 2011; ISBN 978-92-0-119010-9. ISSN 1011-4289. [Google Scholar]
- Mathieu, A.; Kajino, M.; Korsakissok, I.; Périllat, R.; Quélo, D.; Quérel, A.; Saunier, O.; Sekiyama, T.T.; Igarashi, Y.; Didier, D. Fukushima Daiichi–derived radionuclides in the atmosphere, transport and deposition in Japan: A review. Appl. Geochem. 2018, 91, 122–139. [Google Scholar] [CrossRef]
- Pham, M.; Chamizo, E.; Lopéz-Lora, M.; Martín, J.; Osvath, I.; Povinec, P. Impact of Saharan dust events on radionuclides in the atmosphere, seawater, and sediments of the northwest Mediterranean Sea. J. Environ. Radioact. 2020, 214–215, 106157. [Google Scholar] [CrossRef] [PubMed]
- Sáez-Muñoz, M.; Bas, M.D.C.; Ortiz, J.; Martorell, S. Analysis of the evolution of gross alpha and gross beta activities in airborne samples in Valencia (Spain). J. Environ. Radioact. 2018, 183, 94–101. [Google Scholar] [CrossRef] [PubMed]
- Dueñas, C.; Fernández, M.; Liger, E.; Carretero, J. Gross alpha, gross beta activities and 7Be concentrations in surface air: Analysis of their variations and prediction model. Atmos. Environ. 1999, 33, 3705–3715. [Google Scholar] [CrossRef]
- Cabello, M.; Dueñas, C.; Liger, E.; Gordo, E.; Cañete, S. Variables influencing the gross alpha and gross beta activities in airborne particulate samples in Málaga, Spain. J. Radioanal. Nucl. Chem. 2018, 315, 299–307. [Google Scholar] [CrossRef]
- García-Talavera, M.; Quintana, B.; García-Díez, E.; Fernández, F. Studies on radioactivity in aerosols as a function of meteorological variables in Salamanca (Spain). Atmos. Environ. 2001, 35, 221–229. [Google Scholar] [CrossRef]
- Ceballos, M.R.; Borràs, A.; Gomila, E.; Estela, J.M.; Cerdà, V.; Ferrer, L. Monitoring of 7Be and gross beta in particulate matter of surface air from Mallorca Island, Spain. Chemosphere 2016, 152, 481–489. [Google Scholar] [CrossRef] [PubMed]
- Hernández, F.; Hernández-Armas, J.; Catalán, A.; Fernández-Aldecoa, J.; Karlsson, L. Gross alpha, gross beta activities and gamma emitting radionuclides composition of airborne particulate samples in an oceanic island. Atmos. Environ. 2005, 39, 4057–4066. [Google Scholar] [CrossRef]
- Available online: https://www.enterat.com/_documentos/mapa-fisico-europa-mudo.pdf (accessed on 24 September 2021).
- Available online: http://geografos.ftp.catedu.es/index.php%3Foption=com_content&view=article&id=233:bilbao-plano-y-a-metropolitana&catid=72:material-de-aula&Itemid=92.html (accessed on 24 September 2021).
- Hernández-Ceballos, M.Á.; Legarda, F.; Alegría, A.N. Analysis of Alpha Activity Levels and Dependence on Meteorological Factors over a Complex Terrain in Northern Iberian Peninsula (2014–2018). Int. J. Environ. Res. Public Health 2020, 17, 7967. [Google Scholar] [CrossRef]
- Alegría, N.; Hernández-Ceballos, M.; Herranz, M.; Idoeta, R.; Legarda, F. Meteorological Factors Controlling 7Be Activity Concentrations in the Atmospheric Surface Layer in Northern Spain. Atmosphere 2020, 11, 1340. [Google Scholar] [CrossRef]
- Alegría, N.; Herranz, M.; Idoeta, R.; Legarda, F. Study of 7Be activity concentration in the air of northern Spain. J. Radioanal. Nucl. Chem. 2010, 286, 347–351. [Google Scholar] [CrossRef]
- Available online: https://www.weblakes.com/products/wrplot/index.html (accessed on 24 September 2021).
- Stein, A.F.; Draxler, R.R.; Rolph, G.D.; Stunder, B.J.B.; Cohen, M.; Ngan, F. NOAA’s HYSPLIT Atmospheric Transport and Dispersion Modeling System. Bull. Am. Meteorol. Soc. 2015, 96, 2059–2077. [Google Scholar] [CrossRef]
- Draxler, R.R.; Stunder, B.; Rolph, G.; Stein, A.; Taylor, A. HYSPLIT4 User’s Guide; NOAA Tech. Memo. ERL ARL-230; NOAA Air Resources Laboratory: Silver Spring, MD, USA, 1999. Available online: https://www.arl.noaa.gov/data/web/models/hysplit4/win95/user_guide.pdf (accessed on 24 September 2021).
- Stunder, B.J.B. An Assessment of the Quality of Forecast Trajectories. J. Appl. Meteorol. 1996, 35, 1319–1331. [Google Scholar] [CrossRef]
- Kelly, G.; Taubman, B.; Perry, B.; Sherman, J.; Soule, P.; Sheridan, P. Aerosol-precipitation interactions in the southern Appalachian Mountains. Atmos. Chem. Phys. 2012, 12, 5487–5517. [Google Scholar] [CrossRef]
- Dueñas, C.; Fernández, M.; Carretero, J.; Liger, E.; Cañete, S. Long-term variation of the concentrations of long-lived Rn descendants and cosmogenic 7Be and determination of the MRT of aerosols. Atmos. Environ. 2004, 38, 1291–1301. [Google Scholar] [CrossRef]
- Dueñas, C.; Orza, J.; Cabello, M.; Fernández, M.; Cañete, S.; Pérez, M.; Gordo, E. Air mass origin and its influence on radionuclide activities (7Be and 210Pb) in aerosol particles at a coastal site in the western Mediterranean. Atmos. Res. 2011, 101, 205–214. [Google Scholar] [CrossRef]
- Linden, A. Re: What Should Be the Minimum Number of Observations for a Time Series Model? 2015. Available online: https://www.researchgate.net/post/What-should-be-the-minimum-number-of-observations-for-a-time-series-model/55004e9dd11b8b29418b463e/citation/download (accessed on 24 September 2021).
- Vecchi, R.; Marcazzan, G.; Valli, G. Seasonal variation of 210Pb activity concentration in outdoor air of Milan (Italy). J. Environ. Radioact. 2005, 82, 251–266. [Google Scholar] [CrossRef] [PubMed]
- Gillen, E.A. Airborne activities of gross beta, 7Be, and 131I in New York. J. Radioanal. Nucl. Chem. 2005, 264, 387–392. [Google Scholar] [CrossRef]
- Solazzo, E.; Bianconi, R.; Vautard, R.; Bessagnet, B.; Chemel, C.; Coll, I.; Ferreira, J.; Forkel, R.; Francis, X.; Grossi, P.; et al. Ensemble modelling and diagnostic model evaluation for surface-level ozone in Europe and North America. Atmos Environ. 2012, 53, 60–74. [Google Scholar] [CrossRef] [Green Version]
- Bourcier, L.; Masson, O.; Laj, P.; Pichon, J.; Paulat, P.; Freney, E.; Sellegri, K. Comparative trends and seasonal variation of 7Be, 210Pb and 137Cs at two altitude sites in the central part of France. J. Environ. Radioact. 2011, 102, 294–301. [Google Scholar] [CrossRef]
- Tositti, L.; Brattich, E.; Cinelli, G.; Baldacci, D. 12 years of 7Be and 210Pb in Mt. Cimone, and their correlation with meteorological parameters. Atmos. Environ. 2014, 87, 108–122. [Google Scholar] [CrossRef]
- Toledano, C.; Cachorro, V.E.; de Frutos, A.M.; Torres, B.; Berjón, A.; Sorribas, M.; Stone, R.S. Airmass Classification and Analysis of Aerosol Types at El Arenosillo (Spain). J. Appl. Meteorol. Clim. 2009, 48, 962–981. [Google Scholar] [CrossRef]


Publisher’s Note: MDPI stays neutral with regard to jurisdictional claims in published maps and institutional affiliations. |
© 2021 by the authors. Licensee MDPI, Basel, Switzerland. This article is an open access article distributed under the terms and conditions of the Creative Commons Attribution (CC BY) license (https://creativecommons.org/licenses/by/4.0/).
Share and Cite
Alegría, N.; Hernández-Ceballos, M.Á.; Herranz, M.; Idoeta, R.; Legarda, F. Five Years (2014–2018) of Beta Activity Concentration and the Impact of Synoptic and Local Meteorological Conditions in Bilbao (Northern Spain). Atmosphere 2021, 12, 1323. https://doi.org/10.3390/atmos12101323
Alegría N, Hernández-Ceballos MÁ, Herranz M, Idoeta R, Legarda F. Five Years (2014–2018) of Beta Activity Concentration and the Impact of Synoptic and Local Meteorological Conditions in Bilbao (Northern Spain). Atmosphere. 2021; 12(10):1323. https://doi.org/10.3390/atmos12101323
Chicago/Turabian StyleAlegría, Natalia, Miguel Ángel Hernández-Ceballos, Margarita Herranz, Raquel Idoeta, and Fernando Legarda. 2021. "Five Years (2014–2018) of Beta Activity Concentration and the Impact of Synoptic and Local Meteorological Conditions in Bilbao (Northern Spain)" Atmosphere 12, no. 10: 1323. https://doi.org/10.3390/atmos12101323