Article

Impacts of Projected Urban Expansion on Rainfall and Temperature during Rainy Season in the Middle-Eastern Region in Tanzania

1
Central Forecasting Office, Tanzania Meteorological Authority, Dar Es Salaam 3056, Tanzania
2
Department of Climate and Environment, Sejong University, Seoul 05006, Korea
*
Author to whom correspondence should be addressed.
Atmosphere 2021, 12(10), 1234; https://doi.org/10.3390/atmos12101234
Submission received: 5 August 2021 / Revised: 17 September 2021 / Accepted: 19 September 2021 / Published: 22 September 2021
(This article belongs to the Special Issue Hazards, Urbanization, and Climate Change)

Abstract

:
Future changes of land use and land cover (LULC) due to urbanization can cause variations in the frequency and severity of extreme weather events, affecting local climate and potentially worsening impact of such events. This work examines the local climatic impacts associated with projected urban expansion through simulations of rainfall and temperature over the rapidly growing city of the middle-eastern region in Tanzania. Simulations were conducted using a mesoscale Weather Research and Forecasting (WRF) model for a period of 10 days during the rainfall season in April 2018. The Global Forecasting System data of 0.25° resolution was used to simulate the WRF model in two-way nested domains at resolutions of 12 km and 4 km correspondingly. Urban and built-up areas under the current state, low urbanization (30%), and high urbanization (99%) scenarios were taken into account as LULC categories. As the urbanized area increased, daily mean, maximum and minimum air temperatures, as well as precipitation increased. Local circulation affected the spatial irregularities of air temperature and precipitation. Results imply that urbanization can amplify the impacts of future climate changes dramatically. These results can be applicable to the city planning to minimize the adverse effect of urbanization on temperature and precipitation.

1. Introduction

Worldwide in 2018, 55% of the world’s population was living in cities or urban areas, and future projection shows an increasing trend [1]. In less than 10 years there are projected to be 1 billion metropolitan inhabitants, while more than 67% of global population will be residing in urban areas in 2050 [1,2]. To a large extent, the urban growth is projected to be higher in developing countries than in developed countries [3,4]. The population density is already significantly higher in coastal areas than in non-coastal areas [5,6], and there is an ongoing trend of coastal migration, which is associated with global demographic changes [7]. Most of the world’s megacities (i.e., cities with population of over ten million) are located in low-elevation coastal zones [8,9]. In Africa, more than half of its population is living in urban areas over low-elevation coastal zones [10]. The population growth in developing countries is expected to be double between 2000 and 2030, while the urban built-up area is expected to be triple [3,4]. The expected urban growth is highly anticipated to modify the landscape, which increases the number of people vulnerable to the adverse impact of climate change [10,11,12].
Rapid and unplanned growth as well as coast-ward migration is experienced in the biggest city in Tanzania: Dar es Salaam [13]. The city has a high population density and overburdened infrastructures. It is highly vulnerable to the impacts of climate change because of its small size and recent rapid increase in population [8,13,14]. Currently, its population growth rate is one of the fastest in Africa, with an estimated annual growth rate of more than 5%. Its population is projected to be double from the current 5 million to more than 10 million in 2030s, when the city will become one of megacities in the world [1].
Currently, flooding is Dar es Salaam’s greatest environmental challenge. The city experiences floods almost every rainy season, causing significant losses and damage to properties and people’s lives [15]. Recently, an increase of poor, informal and unplanned settlements over flood prone areas in the city have been allied with urbanization. The population in those areas frequently have suffered flood events [13,14,15,16]. The informal settlements are characterized by poor drainage systems. Under extreme rainfall events, inhabitants in the vicinity of roads experience severe flash floods, which can contribute to an additional threat of epidemic disease [13,15]. The impact is worsening as climate change increases torrential rains [17,18] and as impervious road surfaces increase runoff of flood flow.
Urban growth is accompanied by land use and land cover (LULC) changes. The LULC determines key physical and biophysical properties which govern the surface radiation balance [19,20,21]. The projected increase in population in Dar es Salaam and nearby regions will result in an increase in population exposed to coastal hazards [14,22]. Various studies have been conducted over the past decades and have revealed a robust connection between LULC change due to urbanization and climate change in different parts of the world [23,24,25]. Rapid and extensive urban expansion has significant impacts on regional climate due to alteration of water and surface radiation balance [26,27,28]. LULC changes induce the changes in the surface energy balance. The energy balance includes the balance among net radiation, sensible heat flux, latent heat flux, ground heat flux, and heat storage and release at surface. Surface albedo, optical, and thermal properties of surface materials are changed. Impervious urban surfaces enhance water run-off, and decrease the latent heat flux. In general, urban material with a high heat capacity raises its temperature through the change in surface energy balance [29,30,31]. Urbanization increases the occurrence and severity of precipitation in the center and downwind regions of urban, due to the aerosol increase and enhanced confluent flow in the urban center [19,25,27,28]. The effects of urbanization and the impacts of projected urban expansion on local climate in developing countries in Africa, such as Tanzania, have not so much been analyzed using high resolution meteorological models [13,14].
LULC change affects both spatial and temporal distribution of temperature and precipitation. Some studies have employed a dynamical downscaling approach with the use of a regional numerical weather prediction (NWP) models to compensate the low resolution in Global Climate Models (GCMs) [32,33]. The NWP models can provide the surface features with finer horizontal grid resolution than GCMs do. There were some studies using the regional climate model (RCM) under CORDEX (Coordinated regional climate downscaling experiment) in Africa [18,34,35]. However, there were few studies with the use of RCM models over Sub Saharan Africa countries [36,37,38]. Yet, these did not consider the dynamic downscaling approaches. The effects of LULC change due to urbanization on local climate with the use of a dynamic downscaling approach were not investigated in Tanzania.
However, there are only a few previous studies on the effects of urbanization on the local climate in developing cities in Africa, and very few that use projected urban expansion data [36,37]. In addition to that, there are limited studies that have use Weather Research and Forecasting (WRF) model to study the impact of urbanization in developing cities particular in Tanzania. In this study, WRF model as a higher resolution regional mesoscale NWP model was used to assess the impact of future urbanization on temperature and precipitation patterns and amounts [39,40,41,42].
The principal focus of this study is to investigate the response of LULC change by urbanization to air temperature and precipitation, using a case study of 10 days during a rainy season period of April 2018. The current LULC data for urban and built-up area category was modified using the projected urban expansion data. Changes in simulated air temperature and rainfall were compared at four stations with respect to the distance from the shoreline and the ratio of urbanization.

2. Materials and Methods

2.1. Study Region

The city of Dar es Salaam is located between 6.36° S–7° S and 33.33° E–39° E, and is in the eastern part of Tanzania’s mainland, on the western coastline of Indian Ocean. It shows a typical tropical climate, with bimodal rainy seasons—the heavy or “long/Masika” rainfall between March and May, and the light or “short/Vuli” rains fall between October and December. Rainy seasons are associated with movement of the Inter-Tropical Convergence Zone. The short-period rains with little precipitation exhibit larger variability than the long-period rains with heavy precipitation [14].
During the period from 12 to 14 April 2018, the coastal region in Tanzania experienced a heavy rainfall event. The rainfall event resulted in the loss of properties, destruction of infrastructures, the closure of the schools, and the death of more than 20 people. Although, Dar es Salaam has better infrastructures than other areas in Tanzania, the public transportation, UDA rapid transit (UDART), suspended its operations for a while, and one of the public buses was inundated by water. The event triggered significant flooding in most regions, especially over low-laying area. In Dar es Salaam alone, the event caused the displacement of some 2151 households, damages of 324 houses, collapse of 42 houses as well as 21 latrines, and the death of 14 people [43]. Figure 1 shows the location of Tanzania in Africa, study area and the flood hazard zone map of Dar es Salaam city [14].

2.2. Domain Setup, Configuration and Data Description

The mesoscale meteorological model simulations were performed for 10 days (10 to 19 April) during the rainy season in 2018. The simulation period includes days with dry, moderate and extreme precipitation. WRF is a non-hydrostatic, next-generation mesoscale NWP model that can simulate the complete set of atmospheric processes with optional adjustments to physics schemes, initialized boundary conditions and data assimilation [44]. This study adopted a similar WRF domain as used in the previous studies [39,44,45,46,47]. The physical options used in this study were the same as those used by Tanzania Meteorological Authority (TMA) for operation and research purposes (Table 1). The model was configured using two-way nesting domains with 12 km resolution the outer domain and 4 km resolution for the inner domain, shown in Figure 2. Mercator map projection was used.
The Global Forecasting System (GFS) reanalysis data with horizontal resolution of 0.25° were used to provide initial and lateral boundary conditions for the WRF simulations. They were obtained from the Research Data Archive at National Centers for Atmospheric Research [55,56].
The default LULC with a 30s resolution provided by the WRF model was used to create terrain and land-use. The data were developed by National Aeronautics and Space Administration (NASA) Moderate Resolution Imaging Spectroradiometer (MODIS) land-cover classifications. They were modified using Noah land surface model developed by International Geosphere-Biosphere Programme (IGBP) [57,58]. The 2030 probabilistic urban expansion projected datasets with a resolution of 5 km were used as future projected urbanization data [4,59]. The data were obtained from Seto Laboratory at Yale University. The LULC was modified using the methodology developed by the previous studies [31,60,61]. External tool such as Geographic Information System Software (GIS) was used to extrapolate the data [62]. Due to the difference in format between Seto and MODIS, the data were manipulated using the windows PowerShell, ArcGIS and Java (see the supplement material S1). Although 10%, 30%, 50%, 70%, 90%, 95%, 99% urbanization projected data were available from Seto Laboratory, this study used only 30% as a low-urbanization scenario and 99% as a high-urbanization scenario. Projected urban and built-up LULC at a grid replaced the default LULC provided by the WRF model at the same grids. The LULCs at the remaining grids for urbanization scenarios were set to be the same as those for the default ones provided by the WRF model.
Three sets of experiments with different LULCs were carried out. The first one used the current LULC, the second one used the low-urbanization (30%) LULC, and the third one used the high-urbanization (99%) LULC.

2.3. Analysis Procedures
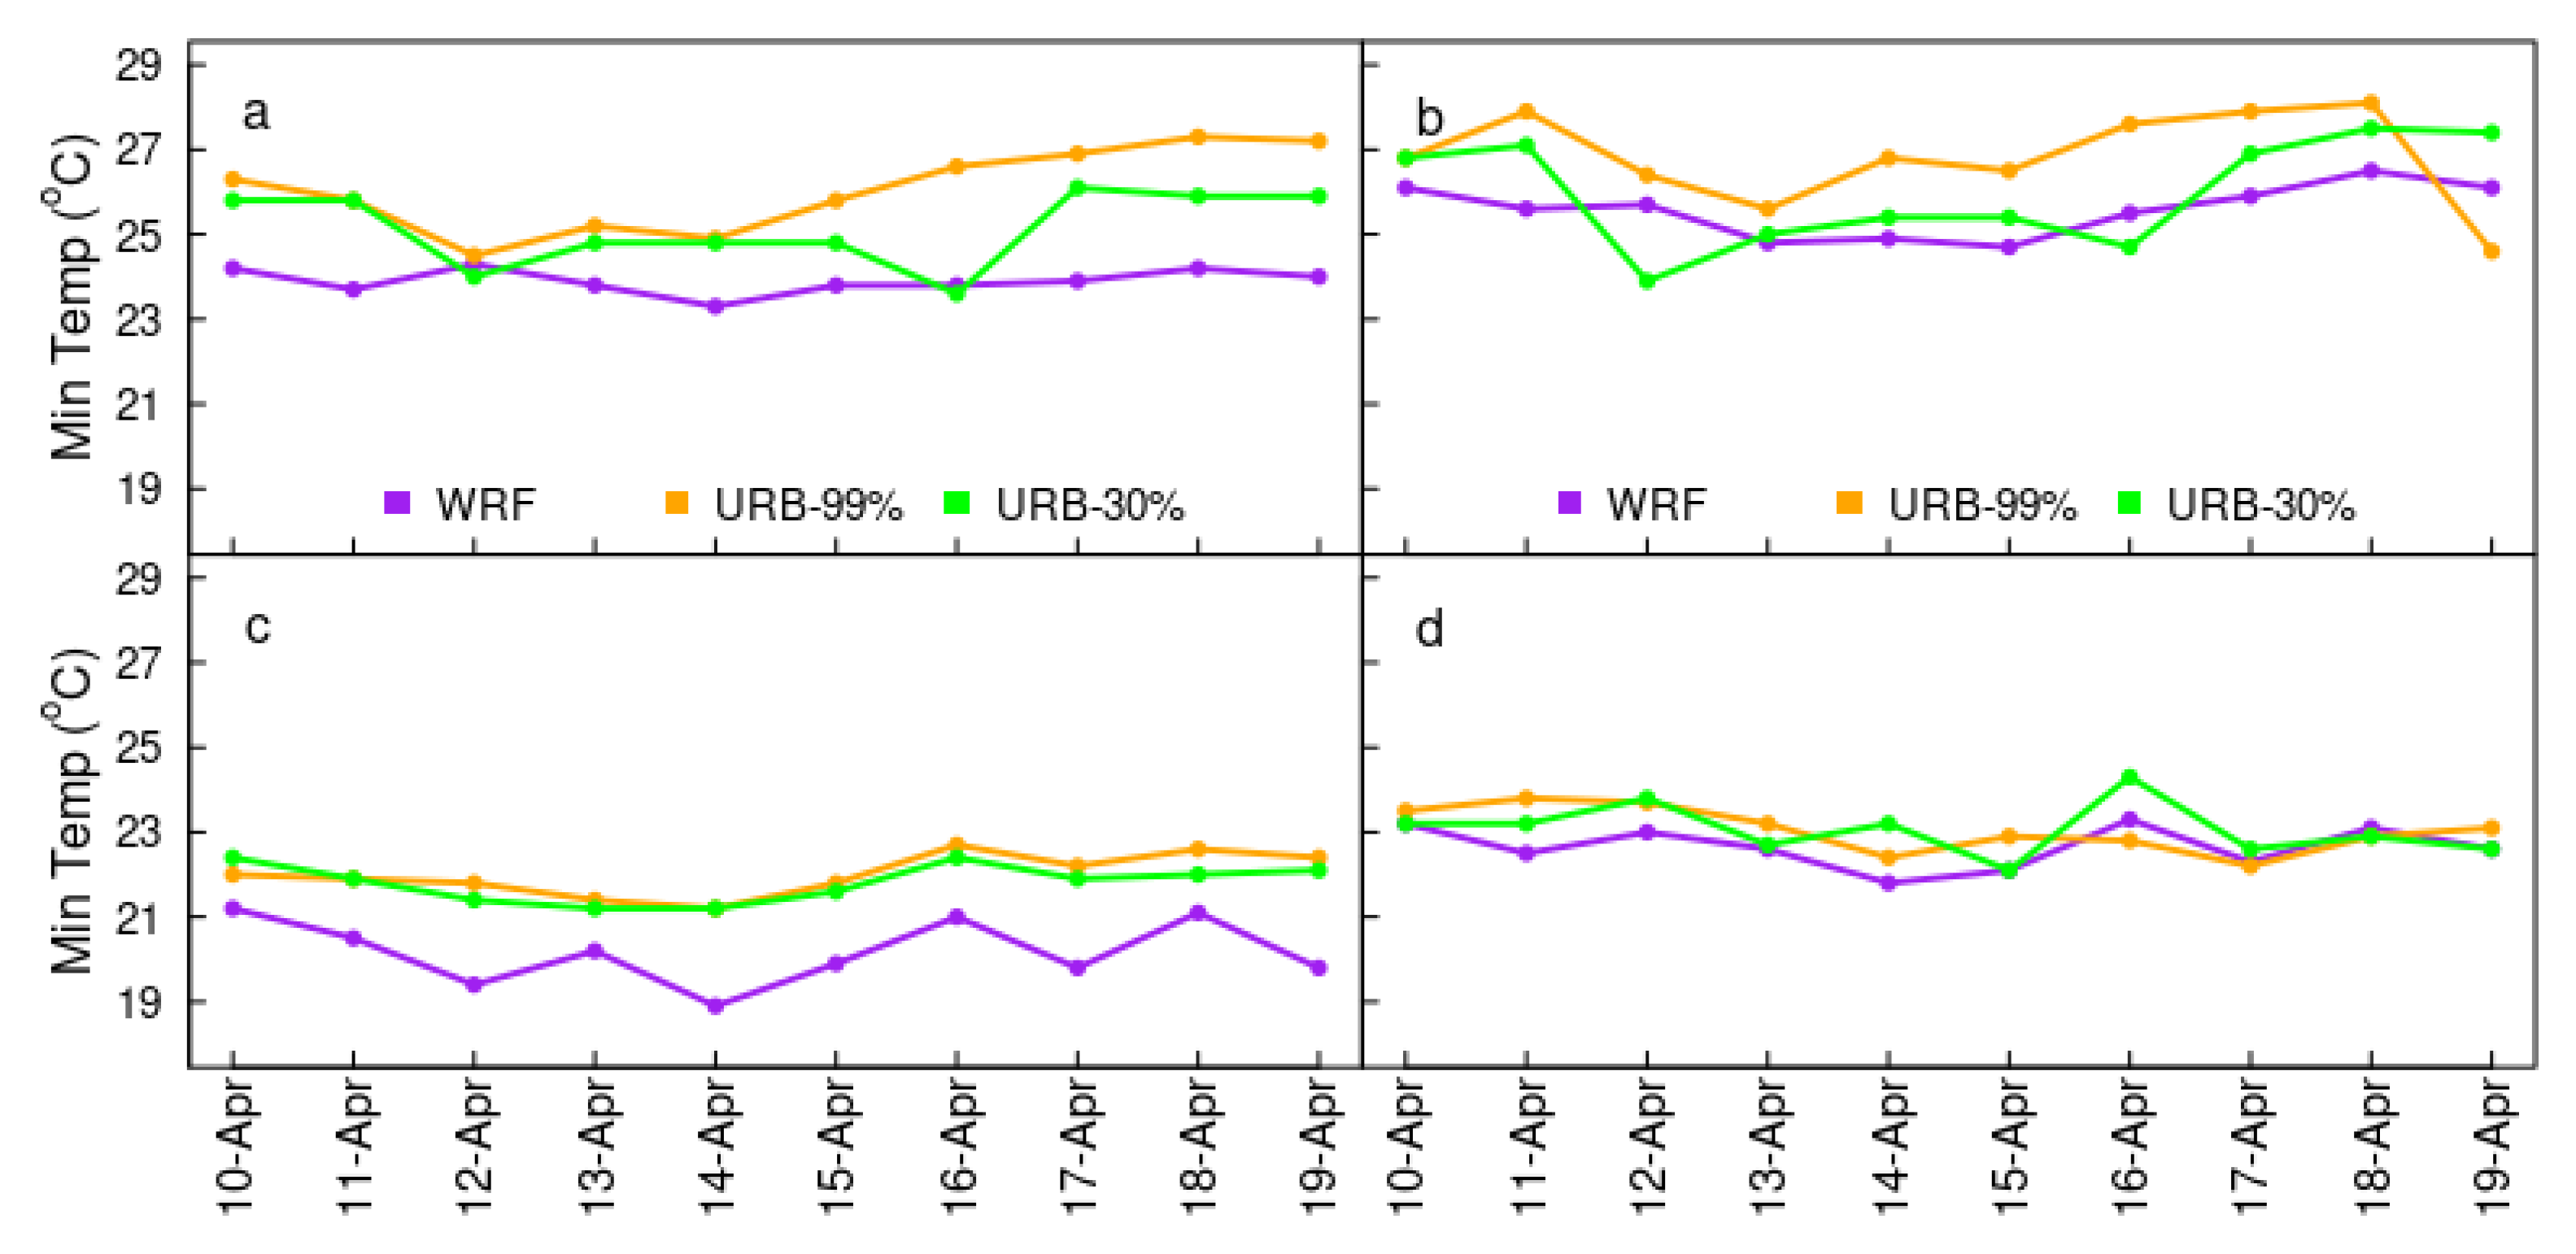
This study compared the results simulated with the current LULC, and low-urbanization and high-urbanization projected LULC. Then both spatial distribution and temporal analysis was performed. The inner domain results were used to evaluate the performance and to assess the effects of LULC changes on meteorological fields.
Two stations (DAR, Dar es Salaam Julius Nyerere International Airport; Dar-Port, Dar es Salaam port station) in Dar es Salaam and two stations (Morogoro, Kibaha) outside Dar es Salaam were used to evaluate the effect of urbanization (Figure 3; Table 2). The four stations have nearly the same latitude (Table 2).
The analyzed domain has a high mountainous region in the west, and a low coastal region in the east. Dar-port and DAR stations are over the lowest topography with elevation of 50 m to 60 m, Kibaha station is over middle topography with an elevation of 167 m, and Morogoro station is over high topography with an elevation of 526 m (Table 2; Figure 3).

3. Results

3.1. Land Use and Land Cover Scenarios

Figure 4 shows spatial distributions of LULC for the current, low-urbanization (30%), and high-urbanization (99%) scenarios. In current state, urban and built-up areas in current LULC were limited to 0.1% in the domain in Dar es Salaam and Morogoro (Figure 4a; Table 3). Most dominant LULC was savannas, occupied with a 71.3% of the domain (Table 3). In both low and high urbanized scenarios, urban and built-up areas are expanding from Dar-Port to DAR, and the area centered in Morogoro expands in size. The urban and built-up LULC expanded to 1.3% and 7.5% of the domain in low urbanized and high urbanized scenarios, respectively (Table 3). The projected urban LULC substituted the savannas, forest, and croplands near the city boundary to urban or semi-urban settlement areas. The savannas land cover was diminished from 71.3% in current state to 65.0% in high urbanized scenario. Kibaha was revealed to be not urbanized even in high urbanization scenario (Figure 4b–c).

3.2. Effects of Urbanization on Local Rainfall

Figure 5 shows the spatial distribution of precipitation for current LULC, the two urbanization projections, and the differences between projected and current LULCs. Precipitation totals for both low and high urbanization scenarios were mostly higher than the current LULC. As urbanization increased, increases or decreases in precipitation was amplified. Large precipitation increases occurred over the coastal strips, and less over the mountainous region. It is because that the enhanced updraft motion in the coastal urbanized region generates more cloud droplets than in the other regions [63]. The horizontal irregularity of precipitation over the region can be related to the influence of the local wind circulation of land and sea breezes, as well as urban heating [61,64]. Total precipitation amount during the 10 days over the urbanized region is simulated to increase by 50 mm and above, comparing to the non-urbanized region.
Figure 6 shows the time series of daily precipitation for current LULC (WRF), future high urbanized (URB-99%) and low urbanized (URB-30%) scenarios at the stations. The larger increase/decrease in rainfall amount is found on wet days (12–14 April) than on dry days (17–19 April). There were no precipitation changes at all stations on 10 April, and at Morogoro and Kibaha stations on 17 to 19 April. Dar-Port station showed an occurrence of precipitation on the dry days (17–19 April), but a decrease in precipitation on the wet days as the urbanized area increases (Figure 6b). Kibaha station, in a non-urbanized area, exhibited a decreased precipitation on the extremely wet days (13–14 April) (Figure 6d). Precipitation in the case of low-urbanization showed higher increase than that in case of high-urbanization at Dar station (Figure 6a), while the precipitation at Morogoro showed an opposite trend (Figure 6c). There was still limited precipitation during the dry days (17–19 April) at the Dar-Port, implying that local circulation there could be affected by western Indian Ocean.
Table 4 summarizes the daily precipitation difference (urbanization–current) between the urbanization scenarios and current LULC at four stations. The highest increase in precipitation was 54.9 mm, 31.4 mm, 23.0 mm, and 12.7 mm at Dar, Dar-Port, Kibaha, and Morogoro stations, respectively.

3.3. Effect of Urbanization on Local Temperature

Figure 7 shows the horizontal distribution of near-surface (2 m) air temperature for current LULC, low-urbanization and high-urbanizations scenarios. As the urbanized area increases, the air temperature increases, especially near the newly urbanized areas. The areas that depicted increase in temperature (Figure 7) are well associated with the urbanized areas (Figure 4). That means the increase in urbanization leads to increase in temperature. Maximum increases are above 1.0 °C and 2.0 °C for low urbanization (30%) and high-urbanization (99%) scenarios, respectively (Figure 7). Some parts of the region experienced slightly cooler temperatures for urbanization scenarios.
Daily mean near-surface air temperature shows a robust increase at all stations, except for Kibaha station (non-urbanized area) (Figure 8). Dar and Morogoro stations exhibited increased temperatures consistently throughout the period, implying that the increase in temperature is strongly and directly affected by urban expansion (Figure 8a,c). Kibaha station, as a non-urbanization projected area, experienced similar temperatures trends to the current LULC, slightly lower temperatures on some days and slightly higher temperatures on other days (Figure 8d). Air temperature increases at the inland urbanized (Morogoro) station were larger than those at coastal urbanized (Dar) station.
Table 5 summarizes the daily mean near-surface air temperature difference for two different urbanization scenarios and the current LULC at four stations. The difference in air temperature ranges from −0.7 to 2.5 °C, the maximum of 2.5 °C occurred at Dar station. Dar-Port exhibited a temperature decrease for 3 days for the low-urbanization scenarios. The maximum increase at Morogoro and Dar-Port stations were 2.2 °C, and 2.0 °C, respectively. Kibaha, as a non-urbanization LULC, exhibited a relatively small temperature range from −0.3 to 1.1 °C.

3.3.1. Effects of Urbanization on Daily Maximum Air Temperature

Figure 9 shows the time series of daily maximum air temperature for current LULC, high-urbanization (URB-99%), and low-urbanization (URB-30%) scenarios. The temporal variations for maximum air temperature were not as systematic as mean air temperature was (Figure 8). Maximum air temperature differences between the scenarios at the inland urbanized station (Morogoro) were smaller than that at the coastal urbanized station (Dar) (Figure 9a,c). Maximum air temperatures for urbanization scenarios tend to be higher than that for current LULC, especially at urbanized stations (Figure 9a–c).
Table 6 summarizes the daily maximum air temperature differences (urbanized–current) for urbanization scenarios from the current LULC at four stations. Maximum temperatures increased by around 1.8 °C at a coastal urbanized station (Dar-Port), 0.9 °C at an inland urbanized station, while temperatures decreased by 0.2 °C at a non-urbanized station (Kibaha). Maximum temperature increases as high as 3 °C occurred at Dar urbanized station and decreases as large as 2.7 °C at Kibaha non-urbanized station. Dar-Port station showed a slightly decrease for the low-urbanization scenario, but a large increase for high-urbanization scenario (Table 5). Kibaha station exhibited a decreased maximum temperature for both high and low urbanization scenarios.

3.3.2. Effect on Minimum Temperature

Figure 10 shows daily minimum air temperature in future LULC scenario of high urbanized (URB-99%) and low urbanized (URB-30%) with the current LULC. The daily minimum temperatures for urbanization scenarios are higher than that for current LULC at urbanization stations (Dar, Dar-Port, Morogoro). Minimum temperature increases due to urbanization are larger than maximum temperature increases at all stations. Kibaha, a non-urbanized station, also showed increased minimum temperature by 0.4 °C, which was far less than the increased value at other stations.
Table 7 summarizes the daily minimum temperature difference between the current LULC and the urbanization scenarios at four stations. As urbanization LULU increased, most minimum temperatures increased except for a few day and a few station. Maximum increases of daily minimum temperature were 3.2 °C, 2.6 °C and 2.3 °C at Dar, Morogoro, and Dar-Port stations, respectively. Maximum increase at Kibaha station reached to 1.4 °C, lower than the other stations.

3.4. Effect of Urbanization on Local Climate

As urbanization progresses, spatial distribution of precipitation and air temperature changed. Figure 11 summarizes the period mean biases of precipitation and air temperatures at 4 stations. The LULC changes due to urban expansions caused changes in spatial and temporal distribution of precipitation over Dar es Salaam region in Tanzania. Overall, urbanization tends to increase the precipitation amounts. However, spatial distribution of precipitation was highly variable, so, precipitation in some regions increased by 20 mm/day, while in other adjacent regions precipitation can decrease by 12 mm/day. Precipitation increases at Dar and Dar-Port stations for the low-urbanization scenario were much higher than that for the high-urbanization scenario (Figure 11a). Precipitation at Morogoro and Kibaha decreased for the low-urbanization scenario, but increased for the high-urbanization scenario. These results agree with the previous studies, which showed that urban land cover may have significant influence on precipitation variability due to the urban heat island effect (UHI). The UHI effect can induce a convergence zone and make favorable conditions for cloud formation [25,27,28].
As urbanization progresses, air temperatures at urbanized regions were found to increase consistently (Figure 11b–d). Temperature increases in urbanized regions (Dar, Dar-Port, and Morogoro) were much higher than that in non-urbanized region (Kibaha). This implies that urbanization can affect the air temperature directly. Also, temperature increases for a high-urbanization scenario were higher than those for a low-urbanization scenario. The minimum temperature increases were higher than the maximum temperature increases at all stations (Figure 11c–d). The effect of urbanization on temperature over the newly urbanized region (Morogoro) was much larger than over the region where the current urban area is expanding (Dar), although for low urbanization scenarios.

4. Summary and Conclusions

This study assessed the effects of urbanization on the precipitation and temperature in the middle-eastern region in Tanzania, using the mesoscale meteorological model and projected urbanization data. As an index of urbanization, current LULC, and low-urbanization (30% projected) and high-urbanization (99% projected) scenarios were adopted as a model input. The simulation period was chosen as 10–19 April 2018, including the severe flood event in Dar es Salaam, as well as dry days.
Urban expansion scenarios tell us that urban areas will expand near Dar es Salaam (coastal area) and Morogoro (mountainous area) regions in 2030. Expanded urban areas mainly substitute the previous savannas and forest areas. Four stations with similar latitudes and different longitudes were selected to analyze temporal variations of the variables. Dar and Dar-Port stations are in the coastal urbanized region, Morogoro station is in the mountainous urbanized region, and Kibaha station is in the non-urbanized region.
Horizontal distributions of 10-days total precipitation, mean air temperature, maximum and minimum air temperatures were analyzed in terms of urbanization. Overall, urbanization increased precipitation. Higher temperature in newly urbanized regions induced stronger updraft motion in the urban center. Increased precipitation in coastal urban region was mainly due to the strong updraft motion at urban centers and rich moistures near the shorelines [63]. However, there were large spatial variations in precipitation. Large increases or decreases in precipitation occurred along the shorelines. Precipitation at some areas near the coastal region increased, while at adjacent other areas precipitation decreased a little. The intensity of rainfall increased, and the occurrence of precipitation became more frequent due to urbanization. As urbanization progresses, daily mean, maximum, and minimum air temperatures at urbanized regions increased. The minimum temperature increases were higher than the maximum temperature increases.
It is well known that urban areas are hotter than the surrounding rural areas, known as urban heat islands. The temperatures increase may be due to the heat capacity increase associated with urban materials such as concrete, asphalt, and bricks [65,66,67,68,69]. Buildings and roads can absorb heat more heat than grasslands in daytime, and release heat in nighttime. Impervious surfaces in urban areas cannot hold water, hence there are insufficient for provision of latent heat flux. Decreased latent heat flux results in an increase in air temperature and sensible heat flux over urban surfaces. Relatively hotter urban areas and relatively cooler rural areas induces urban-rural circulation, where winds flow from rural to urban. Complex horizontal features of precipitation and temperature can be amplified by the urban–rural circulation, or driven by the thermal differences between the urban and rural areas. The resulting urban–rural circulation can amplify and modify the local circulation, such as sea–land breeze circulation, or mountain–valley breeze circulation [29,31]. Here, it made the horizontal distribution of precipitation and temperature more irregular in the coastal area.
There are limitations of using default WRF LULC as a current LULC. Since the data was generated from the MODIS images in 2001. Hence, the current urban and built-up area was underestimated, as Marmara region in Turkey was [70]. In particular, the underestimation of the current LULC may be very large, considering that Dar es Salaam is now one of the fastest evolving cities. For this reason, the low (30 %) urbanization may represent the present-state LULC, and high (99 %) urbanization can represent the worst scenario. Additionally, this study used the short period of 10 days and 4 km resolution. The resolution can be considered as a low one to investigate the effects of urbanization on meteorological fields. Further study can be conducted to incorporate longer period and higher horizontal resolution to overcome the limitation of this study.
The results can be applied to optimize urban planning to minimize the adverse impacts of urbanization on floods and heat waves. More detailed further studies are needed to build a climate resilient community and maintain flexibility in adaptation to future uncertainty. Additionally, more research is needed to understand the effects of urbanization on the future climate in big cities in under developing countries in Africa. This will be helpful to build sustainable cities and communities in the 2030s.

Supplementary Materials

The following are available online at https://www.mdpi.com/article/10.3390/atmos12101234/s1: Assimilation of future urban growth scenarios using Seto 2030 urban expansion projection data, Figure S1: Flow chart for modification of land use data.

Author Contributions

Conceptualization, D.M.A.; methodology, Data curation, D.M.A.; Formal analysis, D.M.A.; Funding acquisition, M.-S.P.; Supervision, M.-S.P.; Validation, M.-S.P.; Writing—original draft, D.M.A.; Writing—review and editing, D.M.A. and M.-S.P. All authors have read and agreed to the published version of the manuscript.

Funding

This research was supported by Basic Science Research Program through the National Research Foundation of Korea (NRF) funded by the Ministry of Education (Grant Number 2021R111A2052562).

Institutional Review Board Statement

Not Applicable.

Informed Consent Statement

Not applicable.

Data Availability Statement

The data presented in this study are available on request from the first author.

Acknowledgments

The authors gratefully acknowledge Kara Smith and Eric Wright through research team of Integrating Hydo-Climate Science into Policy Decisions for Climate-Resilient Infrastructure and Livelihoods in East Africa (HyCRISTAL) for their assistance and support in data acquisition and preparation of the spatial urbanization. Additionally, the authors acknowledge the Tanzania Meteorological Authority for administrative support as well as COSTECH for conducting scientific research writing training which motivated the authors in the finalization of the write up.

Conflicts of Interest

The authors declare no conflict of interest.

References

  1. United Nations Department of Economics and Social Affairs. World Urbanization Prospects 2018: Highlights, Population Division; UN: New York, NY, USA, 2019. [Google Scholar]
  2. United Nations Human Settlements Programme. Global State of Metropolis. Population Data Booklet; UNHSP: Vancouver, BC, Canada, 2020. [Google Scholar]
  3. Angel, S.; Parent, J.; Civco, D.L.; Blei, A.; Potere, D. The dimensions of global urban expansion: Estimates and projections for all countries, 2000–2050. Prog. Plan. 2011, 75, 53–107. [Google Scholar] [CrossRef]
  4. Seto, K.C.; Güneralp, B.; Hutyra, L.R. Global forecasts of urban expansion to 2030 and direct impacts on biodiversity and carbon pools. Proc. Natl. Acad. Sci. USA 2012, 109, 16083–16088. [Google Scholar] [CrossRef] [Green Version]
  5. Balk, D.; Montgomery, M.R.; McGranahan, G.; Kim, D.; Mara, V.; Todd, M.; Buettner, T.; Dorélien, A. Mapping urban settlements and the risks of climate change in Africa, Asia and South America. In Population Dynamics and Climate Change; International Institute for Environment and Development: London, UK, 2009; Volume 80, p. 103. [Google Scholar]
  6. Small, C.; Nicholls, R.J. A alobal analysis of human settlement in coastal zones. J. Coast. Res. 2003, 19, 584–599. [Google Scholar]
  7. Hugo, G. Future demographic change and its interactions with migration and climate change. Glob. Environ. Chang. 2011, 21, S21–S33. [Google Scholar] [CrossRef]
  8. Brown, S.; Nicholls, R.J.; Woodroffe, C.D.; Hanson, S.; Hinkel, J.; Kebede, A.S.; Neumann, B.; Vafeidis, A.T. Sea-level rise impacts and responses: A global perspective. In Coastal Hazards; Springer: Berlin/Heidelberg, Germany, 2013; pp. 117–149. [Google Scholar]
  9. Neumann, B.; Vafeidis, A.T.; Zimmermann, J.; Nicholls, R.J. Future coastal population growth and exposure to sea-level rise and coastal flooding-a global assessment. PLoS ONE 2015, 10, e0118571. [Google Scholar] [CrossRef] [PubMed] [Green Version]
  10. Hope, K., Sr. Climate change and poverty in Africa. Int. J. Sustain. Dev. World Ecol. 2009, 16, 451–461. [Google Scholar] [CrossRef]
  11. United Nations Human Settlements Programme. The State of African Cities 2008: A Framework for Addressing Urban Challenges in Africa; UN-HABITAT: Nairobi, Kenya, 2008. [Google Scholar]
  12. Seto, K.C.; Fragkias, M.; Güneralp, B.; Reilly, M.K. A Meta-Analysis of Global Urban Land Expansion. PLoS ONE 2011, 6, e23777. [Google Scholar] [CrossRef]
  13. Kebede, A.S.; Nicholls, R.J. Exposure and vulnerability to climate extremes: Population and asset exposure to coastal flooding in Dar es Salaam, Tanzania. Reg. Environ. Chang. 2011, 12, 81–94. [Google Scholar] [CrossRef]
  14. Anande, D.M.; Luhunga, P.M. Assessment of socio-economic impacts of the December 2011 flood event in Dar es Salaam, Tanzania. Atmos. Clim. Sci. 2019, 9, 421–437. [Google Scholar] [CrossRef] [Green Version]
  15. Ngailo, T.J.; Reuder, J.; Rutalebwa, E.; Nyimvua, S.; Mesquita, M. Modelling of Extreme maximum Rainfall using Extreme Value Theory for Tanzania. Int. J. Sci. Innov. Math. Res. 2016, 4, 34–45. [Google Scholar] [CrossRef]
  16. Dodman, D.; Brown, D.; Francis, K.; Hardoy, J.; Johnson, C.; Satterthwaite, D. Front Matter; International Institute for Environment and Development: London, UK, 2013; pp. i–iii. [Google Scholar]
  17. Chang’A, L.B.; Kijazi, A.L.; Luhunga, P.M.; Ng’Ongolo, H.K.; Mtongor, H.I. Spatial and Temporal Analysis of Rainfall and Temperature Extreme Indices in Tanzania. Atmos. Clim. Sci. 2017, 7, 525–539. [Google Scholar] [CrossRef] [Green Version]
  18. Luhunga, P.M.; Kijazi, A.L.; Chang’A, L.; Kondowe, A.; Ng’Ongolo, H.; Mtongori, H. Climate Change Projections for Tanzania Based on High-Resolution Regional Climate Models from the Coordinated Regional Climate Downscaling Experiment (CORDEX)-Africa. Front. Environ. Sci. 2018, 6, 122. [Google Scholar] [CrossRef] [Green Version]
  19. Georgescu, M.; Miguez-Macho, G.; Steyaert, L.T.; Weaver, C.P. Climatic effects of 30 years of landscape change over the Greater Phoenix, Arizona, region: 2. Dynamical and thermodynamical response. J. Geophys. Res. Space Phys. 2009, 114. [Google Scholar] [CrossRef] [Green Version]
  20. Georgescu, M.; Moustaoui, M.; Mahalov, A.; Dudhia, J. Summer-time climate impacts of projected megapolitan expansion in Arizona. Nat. Clim. Chang. 2013, 3, 37–41. [Google Scholar] [CrossRef]
  21. Seto, K.C.; Parnell, S.; Elmqvist, T. A global outlook on urbanization. In Urbanization, Biodiversity and Ecosystem Services: Challenges and Opportunities; Springer: Dordrecht, The Netherlands, 2013; pp. 1–12. [Google Scholar]
  22. Seto, K.C.; Shepherd, J.M. Global urban land-use trends and climate impacts. Curr. Opin. Environ. Sustain. 2009, 1, 89–95. [Google Scholar] [CrossRef]
  23. Foley, J.A.; DeFries, R.; Asner, G.; Barford, C.; Bonan, G.; Carpenter, S.R.; Chapin, F.S.; Coe, M.; Daily, G.C.; Gibbs, H.K.; et al. Global Consequences of Land Use. Science 2005, 309, 570–574. [Google Scholar] [CrossRef] [Green Version]
  24. Hunt, A.; Watkiss, P. Climate change impacts and adaptation in cities: A review of the literature. Clim. Chang. 2011, 104, 13–49. [Google Scholar] [CrossRef] [Green Version]
  25. Pathirana, A.; Denekew, H.B.; Veerbeek, W.; Zevenbergen, C.; Banda, A.T. Impact of urban growth-driven landuse change on microclimate and extreme precipitation—A sensitivity study. Atmos. Res. 2014, 138, 59–72. [Google Scholar] [CrossRef]
  26. Argüeso, D.; Evans, J.; Pitman, A.J.; Di Luca, A. Effects of City Expansion on Heat Stress under Climate Change Conditions. PLoS ONE 2015, 10, e0117066. [Google Scholar] [CrossRef]
  27. Shem, W.; Shepherd, M. On the impact of urbanization on summertime thunderstorms in Atlanta: Two numerical model case studies. Atmos. Res. 2009, 92, 172–189. [Google Scholar] [CrossRef]
  28. Zheng, Z.; Xu, G.; Gao, H. Characteristics of Summer hourly extreme precipitation events and its local environmental influencing factors in Beijing under urbanization background. Atmosphere 2021, 12, 632. [Google Scholar] [CrossRef]
  29. Argüeso, D.; Evans, J.; Fita, L.; Bormann, K.J. Temperature response to future urbanization and climate change. Clim. Dyn. 2013, 42, 2183–2199. [Google Scholar] [CrossRef]
  30. Georgescu, M.; Miguez-Macho, G.; Steyaert, L.; Weaver, C. Climatic effects of 30 years of landscape change over the Greater Phoenix, Arizona, region: 1. Surface energy budget changes. J. Geophys. Res.: Atmos. 2009, 114. [Google Scholar] [CrossRef] [Green Version]
  31. Kaplan, S.; Georgescu, M.; Alfasi, N.; Kloog, I. Impact of future urbanization on a hot summer: A case study of Israel. Theor. Appl. Climatol. 2017, 128, 325–341. [Google Scholar] [CrossRef]
  32. Feser, F.; Rockel, B.; von Storch, H.; Winterfeldt, J.; Zahn, M. Regional climate models add value to global model data: A review and selected examples. Bull. Am. Meteorol. Soc. 2011, 92, 1181–1192. [Google Scholar] [CrossRef] [Green Version]
  33. Pielke, R.A., Sr.; Wilby, R.L. Regional climate downscaling: What’s the point? Eos Trans. Am. Geophys. Union 2012, 93, 52–53. [Google Scholar] [CrossRef]
  34. Nikulin, G.; Jones, C.; Giorgi, F.; Asrar, G.; Büchner, M.; Cerezo-Mota, R.; Christensen, O.B.; Déqué, M.; Fernandez, J.; Hänsler, A.; et al. Precipitation climatology in an ensemble of CORDEX-Africa regional climate simulations. J. Clim. 2012, 25, 6057–6078. [Google Scholar] [CrossRef] [Green Version]
  35. Hernández-Díaz, L.; Laprise, R.; Sushama, L.; Martynov, A.; Winger, K.; Dugas, B. Climate simulation over CORDEX Africa domain using the fifth-generation Canadian Regional Climate Model (CRCM5). Clim. Dyn. 2012, 40, 1415–1433. [Google Scholar] [CrossRef] [Green Version]
  36. Forget, Y.; Shimoni, M.; Gilbert, M.; Linard, C. Mapping 20 Years of Urban Expansion in 45 Urban Areas of Sub-Saharan Africa. Remote Sens. 2021, 13, 525. [Google Scholar] [CrossRef]
  37. Serdeczny, O.; Adams, S.; Baarsch, F.; Coumou, D.; Robinson, A.; Hare, W.; Schaeffer, M.; Perrette, M.; Reinhardt, J. Climate change impacts in Sub-Saharan Africa: From physical changes to their social repercussions. Reg. Environ. Chang. 2016, 17, 1585–1600. [Google Scholar] [CrossRef]
  38. Kukkonen, M.O.; Muhammad, M.J.; Käyhkö, N.; Luoto, M. Urban expansion in Zanzibar City, Tanzania: Analyzing quantity, spatial patterns and effects of alternative planning approaches. Land Use Policy 2018, 71, 554–565. [Google Scholar] [CrossRef]
  39. Kondowe, A.; Aniskina, O. The Role of the WRF Model Parameterization Schemes on the Quakity of Meteorological Variables Forecast over Tanzania; World Science: Paris, France, 2015; p. 1. [Google Scholar]
  40. Paul, S.; Ghosh, S.; Mathew, M.; Devanand, A.; Karmakar, S.; Niyogi, D. Increased Spatial Variability and Intensification of Extreme Monsoon Rainfall due to Urbanization. Sci. Rep. 2018, 8, 1–10. [Google Scholar] [CrossRef] [PubMed]
  41. Sati, A.P.; Mohan, M. The impact of urbanization during half a century on surface meteorology based on WRF model simulations over National Capital Region, India. Theor. Appl. Clim. 2017, 134, 309–323. [Google Scholar] [CrossRef]
  42. Skamarock, W.C.; Klemp, J.B.; Dudhia, J.; Gill, D.O.; Liu, Z.; Berner, J.; Wang, W.; Powers, J.G.; Duda, M.G.; Barker, D.M.; et al. A Description of the Advanced Research WRF Version 4; No. NCAR/TN-556+STR, NCAR Technical Note; National Center for Atmospheric Research: Boulder, CO, USA, 2019; p. 145. [Google Scholar] [CrossRef]
  43. International Federation of Red Cross and Red Crescent Societies. Tanzania: Floods—Emergency Plan of Action; IFRC: Geneva, Switzerland, 30 April 2018. [Google Scholar]
  44. Kondowe, A.L. mpact of convective parameterization schemes on the quality of rainfall forecast over Tanzania using WRF-model. Nat. Sci. 2014, 6, 691. [Google Scholar] [CrossRef] [Green Version]
  45. Luhunga, P.M.; Djolov, G.; Mutayoba, E. Moist potential vorticity vector for diagnosis of heavy rainfall events in Tanzania. J. Geosci. Environ. Prot. 2016, 4, 128. [Google Scholar] [CrossRef] [Green Version]
  46. Lungo, A.; Kim, S.; Jiang, M.; Cho, G.; Kim, Y. Sensitivity Study of WRF Simulations over Tanzania for Extreme Events during Wet and Dry Seasons. Atmosphere 2020, 11, 459. [Google Scholar] [CrossRef]
  47. Ngailo, T.J.; Shaban, N.; Reuder, J.; Mesquita, M.D.S.; Rutalebwa, E.; Mugume, I.; Sangalungembe, C. Assessing Weather Research and Forecasting (WRF) Model parameterization schemes skill to simulate extreme rainfall events over Dar es Salaam on 21 December 2011. J. Geosci. Environ. Prot. 2018, 6, 36. [Google Scholar] [CrossRef] [Green Version]
  48. Dudhia, J. Numerical study of convection observed during the winter monsoon experiment using a mesoscale two-dimensional model. J. Atmos. Sci. 1989, 46, 3077–3107. [Google Scholar] [CrossRef]
  49. Mlawer, E.J.; Taubman, S.J.; Brown, P.D.; Iacono, M.J.; Clough, S.A. Radiative transfer for inhomogeneous atmospheres: RRTM, a validated correlated-k model for the longwave. J. Geophys. Res. Space Phys. 1997, 102, 16663–16682. [Google Scholar] [CrossRef] [Green Version]
  50. Chen, S.-H.; Sun, W.-Y. A one-dimensional time dependent cloud model. J. Meteorol. Soc. Jpn. 2002, 80, 99–118. [Google Scholar] [CrossRef] [Green Version]
  51. Grell, G.A.; Freitas, S.R. A scale and aerosol aware stochastic convective parameterization for weather and air quality modeling. Atmos. Chem. Phys. 2014, 14, 5233–5250. [Google Scholar] [CrossRef] [Green Version]
  52. Pleim, J.E. A Combined Local and Nonlocal Closure Model for the Atmospheric Boundary Layer. Part I: Model Description and Testing. J. Appl. Meteorol. Clim. 2007, 46, 1383–1395. [Google Scholar] [CrossRef]
  53. Jiménez, P.A.; Dudhia, J. Improving the representation of resolved and unresolved topographic effects on surface wind in the WRF model. J. Appl. Meteorol. Clim. 2012, 51, 300–316. [Google Scholar] [CrossRef] [Green Version]
  54. Chen, F.; Dudhia, J. Coupling an advanced land surface–hydrology model with the Penn State–NCAR MM5 modeling system. Part I: Model implementation and sensitivity. Mon. Weather. Rev. 2001, 129, 569–585. [Google Scholar] [CrossRef] [Green Version]
  55. Kalnay, E.; Kanamitsu, M.; Kistler, R.; Collins, W.; Deaven, D.; Gandin, L.; Iredell, M.; Saha, S.; White, G.; Woollen, J. The NCEP/NCAR 40-year reanalysis project. Bull. Am. Meteorol. Soc. 1996, 77, 437–472. [Google Scholar] [CrossRef] [Green Version]
  56. NCEP-GFS, N.G. 0.25 Degree Global Forecast Grids Historical Archive; Research Data Archive at the National Center for Atmospheric Research, Computational and Information Systems Laboratory: Boulder, CO, USA, 2015. [Google Scholar] [CrossRef]
  57. Friedl, M.; Strahler, A.; Hodges, J.; Hall, F.; Collatz, G.; Meeson, B.; Los, S.; Brown De Colstoun, E.; Landis, D. ISLSCP II MODIS (Collection 4) IGPB Land Cover, 2000–2001; ORNL DAAC: Oak Ridge, TN, USA, 2010. [Google Scholar] [CrossRef]
  58. Yan, Y.; Tang, J.; Wang, S.; Niu, X.; Wang, L. Uncertainty of land surface model and land use data on WRF model simulations over China. Clim. Dyn. 2021, 57, 1–19. [Google Scholar] [CrossRef]
  59. Güneralp, B.; Seto, K. Futures of global urban expansion: Uncertainties and implications for biodiversity conservation. Environ. Res. Lett. 2013, 8, 014025. [Google Scholar] [CrossRef]
  60. Nunalee, C.G.; Horváth, Á.; Basu, S. High-resolution numerical modeling of mesoscale island wakes and sensitivity to static topographic relief data. Geosci. Model. Dev. 2015, 8, 2645–2653. [Google Scholar] [CrossRef] [Green Version]
  61. Yeung, P.S.; Fung, J.C.-H.; Ren, C.; Xu, Y.; Huang, K.; Leng, J.; Wong, M.M.-F. Investigating future urbanization’s impact on local climate under different climate change scenarios in MEGA-urban regions: A case study of the Pearl River Delta, China. Atmosphere 2020, 11, 771. [Google Scholar] [CrossRef]
  62. Sun, W.; Liu, Z.; Zhang, Y.; Xu, W.; Lv, X.; Liu, Y.; Lyu, H.; Li, X.; Xiao, J.; Ma, F. Study on land-use changes and theirimpacts on air pollution in Chengdu. Atmosphere 2020, 11, 42. [Google Scholar] [CrossRef] [Green Version]
  63. Bornstein, R.; Lin, Q. Urban heat islands and summertime convective thunderstorms in Atlanta: Three case studies. Atmos. Environ. 2000, 34, 507–516. [Google Scholar] [CrossRef]
  64. Li, X.X.; Koh, T.Y.; Panda, J.; Norford, L.K. Impact of urbanization patterns on the local climate of a tropical city, Singapore: An ensemble study. J. Geophys. Res. Atmos. 2016, 121, 4386–4403. [Google Scholar] [CrossRef] [Green Version]
  65. Lee, Y.-H.; Park, M.-S.; Choi, Y. Planetary Boundary-Layer Structure at an Inland Urban Site under Sea Breeze Penetration. Asia-Pac. J. Atmos. Sci. 2021, 57, 701–715. [Google Scholar] [CrossRef]
  66. Li, J.Z.; Wang, Z.; Liu, X.; Fath, B.D.; Liu, X.; Xu, Y.; Hutjes, R.; Kroeze, C. Causal relationship in the interaction between land cover change and underlying surface climate in the grassland ecosystems in China. Sci. Total Environ. 2018, 647, 1080–1087. [Google Scholar] [CrossRef] [PubMed] [Green Version]
  67. Li, Z.; Xu, Y.; Sun, Y.; Wu, M.; Zhao, B. Urbanization-driven changes in land-climate dynamics: A case study of Haihe River Basin, China. Remote Sens. 2020, 12, 2701. [Google Scholar] [CrossRef]
  68. Park, M.-S.; Chae, J.-H. Features of sea–land-breeze circulation over the Seoul Metropolitan Area. Geosci. Lett. 2018, 5, 28. [Google Scholar] [CrossRef] [Green Version]
  69. Park, M.-S.; Park, S.-H.; Chae, J.-H.; Choi, M.-H.; Song, Y.; Kang, M.; Roh, J.-W. High-resolution urban observation network for user-specific meteorological information service in the Seoul Metropolitan Area, South Korea. Atmos. Meas. Tech. 2017, 10, 1575–1594. [Google Scholar] [CrossRef]
  70. Sertel, E.; Robock, A.; Ormeci, C. Impacts of land cover data quality on regional climate simulations. Int. J. Clim. 2009, 30, 1942–1953. [Google Scholar] [CrossRef]
Figure 1. (a) Location of Tanzania in Africa continent, (b) Tanzania with study area, and (c) Study area with stations used in this study. Dar es Salaam is shaded in red in Tanzania map.
Atmosphere 12 01234 g001
Figure 2. Domain for WRF model run. The resolution of outer domain is 12 km (blue), and that of inner domain is 4 km (red).
Atmosphere 12 01234 g002
Figure 3. Topography in the analyzing domain and the location of meteorological observation stations used for LULC analysis.
Atmosphere 12 01234 g003
Figure 4. Horizontal distribution of land use and land cover of (a) current (default WRF), (b) low-urbanization (30%), and (c) high-urbanization (99%) scenarios in 2030.
Atmosphere 12 01234 g004
Figure 5. Spatial distribution of period averaged total precipitation for (a) current LULC, (b) low-urbanization, (d) high-urbanization scenarios, and their differences (urbanized–current) between the current LULC and (c) low urbanized and (e) high urbanized scenarios.
Atmosphere 12 01234 g005
Figure 6. Daily precipitation for current LULC, future low-urbanization (URB-30%) and high-urbanization (URB-99%) scenarios at (a) Dar, (b) Dar-Port, (c) Morogoro, and (d) Kibaha stations.
Atmosphere 12 01234 g006
Figure 7. Spatial distribution of period averaged near surface air temperature for (a) current LULC, (b) low-urbanization, and (d) high-urbanization scenarios, and their differences (urbanized–current) between the current LULC and (c) low urbanized and (e) high urbanized scenarios.
Atmosphere 12 01234 g007
Figure 8. Daily mean near-surface (2 m) air temperature for current LULC, high-urbanization (URB_99%), and low-urbanization (URB_30%) scenarios at (a) Dar, (b) Dar-Port, (c) Morogoro, and (d) Kibaha stations.
Atmosphere 12 01234 g008
Figure 9. Daily maximum near-surface (2 m) air temperature for current LULC, high-urbanization (URB_99%), and low-urbanization (URB_30%) scenarios at (a) Dar, (b) Dar-Port, (c) Morogoro, and (d) Kibaha stations.
Atmosphere 12 01234 g009
Figure 10. Daily minimum near-surface (2m) air temperature for current LULC, high-urbanization (URB_99%), and low-urbanization (URB_30%) scenarios at (a) Dar, (b) Dar-Port, (c) Morogoro, and (d) Kibaha stations.
Atmosphere 12 01234 g010
Figure 11. Overall stations mean bias for (a) daily precipitation, (b) near-surface temperature, (c) maximum temperature, and (d) minimum temperature at future low and high scenario (URB-30% and URB-99%).
Atmosphere 12 01234 g011
Table 1. Model physics options.
Physics OptionsSpecificationsReferences
Short-wave radiationDudhia Shortwave Scheme[48]
Long-wave radiationRapid Radiative Transfer Model (RRTM) scheme[49]
MicrophysicsLin et al. scheme[50]
CumulusImproved Grell-Devenyi ensemble scheme[51]
Boundary layerAsymmetric Convective Model (ACM2)[52]
Surface layerRevised MM5 surface layer scheme[53]
Land-surfaceUnified Noah land surface model (Noah LSM)[54]
Table 2. Latitude, longitude, and elevation of the selected meteorological stations.
StationsLatitudeLongitudeElevation (m)
DAR−6.883°39.200°55.5
DAR-PORT−6.833°39.300°50
KIBAHA−6.833°38.633°167
MOROGORO−6.833°37.650°526
Table 3. Percentage of land-use/land-cover for current state, low-urbanization, and high-urbanization scenarios. Each LULC was regrouped into five categories in its similarity. Savannas includes woody savannas, and forest includes all kinds of forest.
LULCCurrentLow-UrbanizationHigh-Urbanization
Urban0.11.37.5
Water18.618.618.6
Savannas71.370.565.0
Forest7.37.06.4
Crop2.72.62.5
Table 4. Daily precipitation difference (mm d−1) between future urbanization scenarios and current LULC at four stations.
STATIONSDARDAR-PORTMOROGOROKIBAHA
future scenariosUrb-30Urb-99Urb-30Urb-99Urb-30Urb-99Urb-30Urb-99
10 April 201800000000
11 April 201854.97.331.410.50.30.4−1.7−4.3
12 April 201812.243.59.8−12.44.91.90.723
13 April 2018−13.4−18−0.6−7.7−172.3−4−3
14 April 20185.3−3.7−1.2-3012.7−12.2−11.4
15 April 201852.42.721.55.800.20.3−2.7
16 April 20188.53.58.7−1.10.40.72.40.6
17 April 2018−3.8−3.7020000
18 April 20180004.40000
19 April 201800.10.890000
Table 5. Daily mean near surface air temperature difference (°C) for urbanization scenarios from the current LULC at four stations.
STATIONSDARDAR-PORTMOROGOROKIBAHA
Future scenariosUrb-lowUrb-highUrb-lowUrb-highUrb-lowUrb-highUrb-lowUrb-high
10 April 20181.62.20.30.71.11.10.00.2
11 April 20180.31.70.01.31.10.7−0.30.2
12 April 20180.41.0−0.60.91.21.40.60.3
13 April 20181.21.70.81.30.31.11.10.8
14 April 20181.01.8−0.71.41.01.30.80.9
15 April 20180.62.50.52.01.01.2−0.2−1.0
16 April 20180.42.0−0.51.20.91.50.1−0.3
17 April 20182.22.50.81.11.82.20.0−0.2
18 April 20181.22.20.61.30.91.7−0.10.0
19 April 20181.22.10.7−0.31.31.8−0.10.3
Table 6. Daily maximum air temperature difference (°C) for urbanization scenarios from the current LULC at four stations.
STATIONSDARDAR-PORTMOROGOROKIBAHA
Future scenariosUrb-lowUrb-highUrb-lowUrb-highUrb-lowUrb-highUrb-lowUrb-high
10 April 20181.52.3−0.20.80.91.400
11 April 2018−1.51.3−1.50.30.80−1.2−0.9
12 April 201811.80.71.10.40.40.3−0.2
13 April 20181.31.91.31.8−0.40.92.10.9
14 April 20180.52−1.80.9−0.40.20.21.2
15 April 20180.230.32.10.20.5−0.4−2.7
16 April 20181.11.2−0.20.30.41.3−0.9−0.1
17 April 20182.21.90.60.21.41.9−0.3−0.3
18 April 20180.61.30.20.911.80.10.2
19 April 20180.410.10.90.20.9−0.10.2
Table 7. Daily minimum temperature difference (°C) between future urbanization scenarios and current LULC at four stations.
STATIONSDARDAR-PORTMOROGOROKIBAHA
Future scenariosUrb-lowUrb-highUrb-lowUrb-highUrb-lowUrb-highUrb-lowUrb-high
10 April 20181.62.10.70.71.20.800.3
11 April 20182.12.11.52.31.41.40.71.3
12 April 2018−0.30.2−1.80.722.40.80.7
13 April 201811.40.20.811.20.10.6
14 April 20181.51.60.51.92.32.31.40.6
15 April 2018120.71.81.71.900.8
16 April 2018−0.22.8−0.82.11.41.71−0.5
17 April 20182.23122.12.40.3−0.1
18 April 20181.73.111.60.91.5−0.2−0.2
19 April 20181.93.21.3−1.52.32.600.5
Publisher’s Note: MDPI stays neutral with regard to jurisdictional claims in published maps and institutional affiliations.

