Assessment of Children’s Potential Exposure to Bioburden in Indoor Environments

 , , , , ,
Abstract
:1. Introduction
2. Materials and Methods
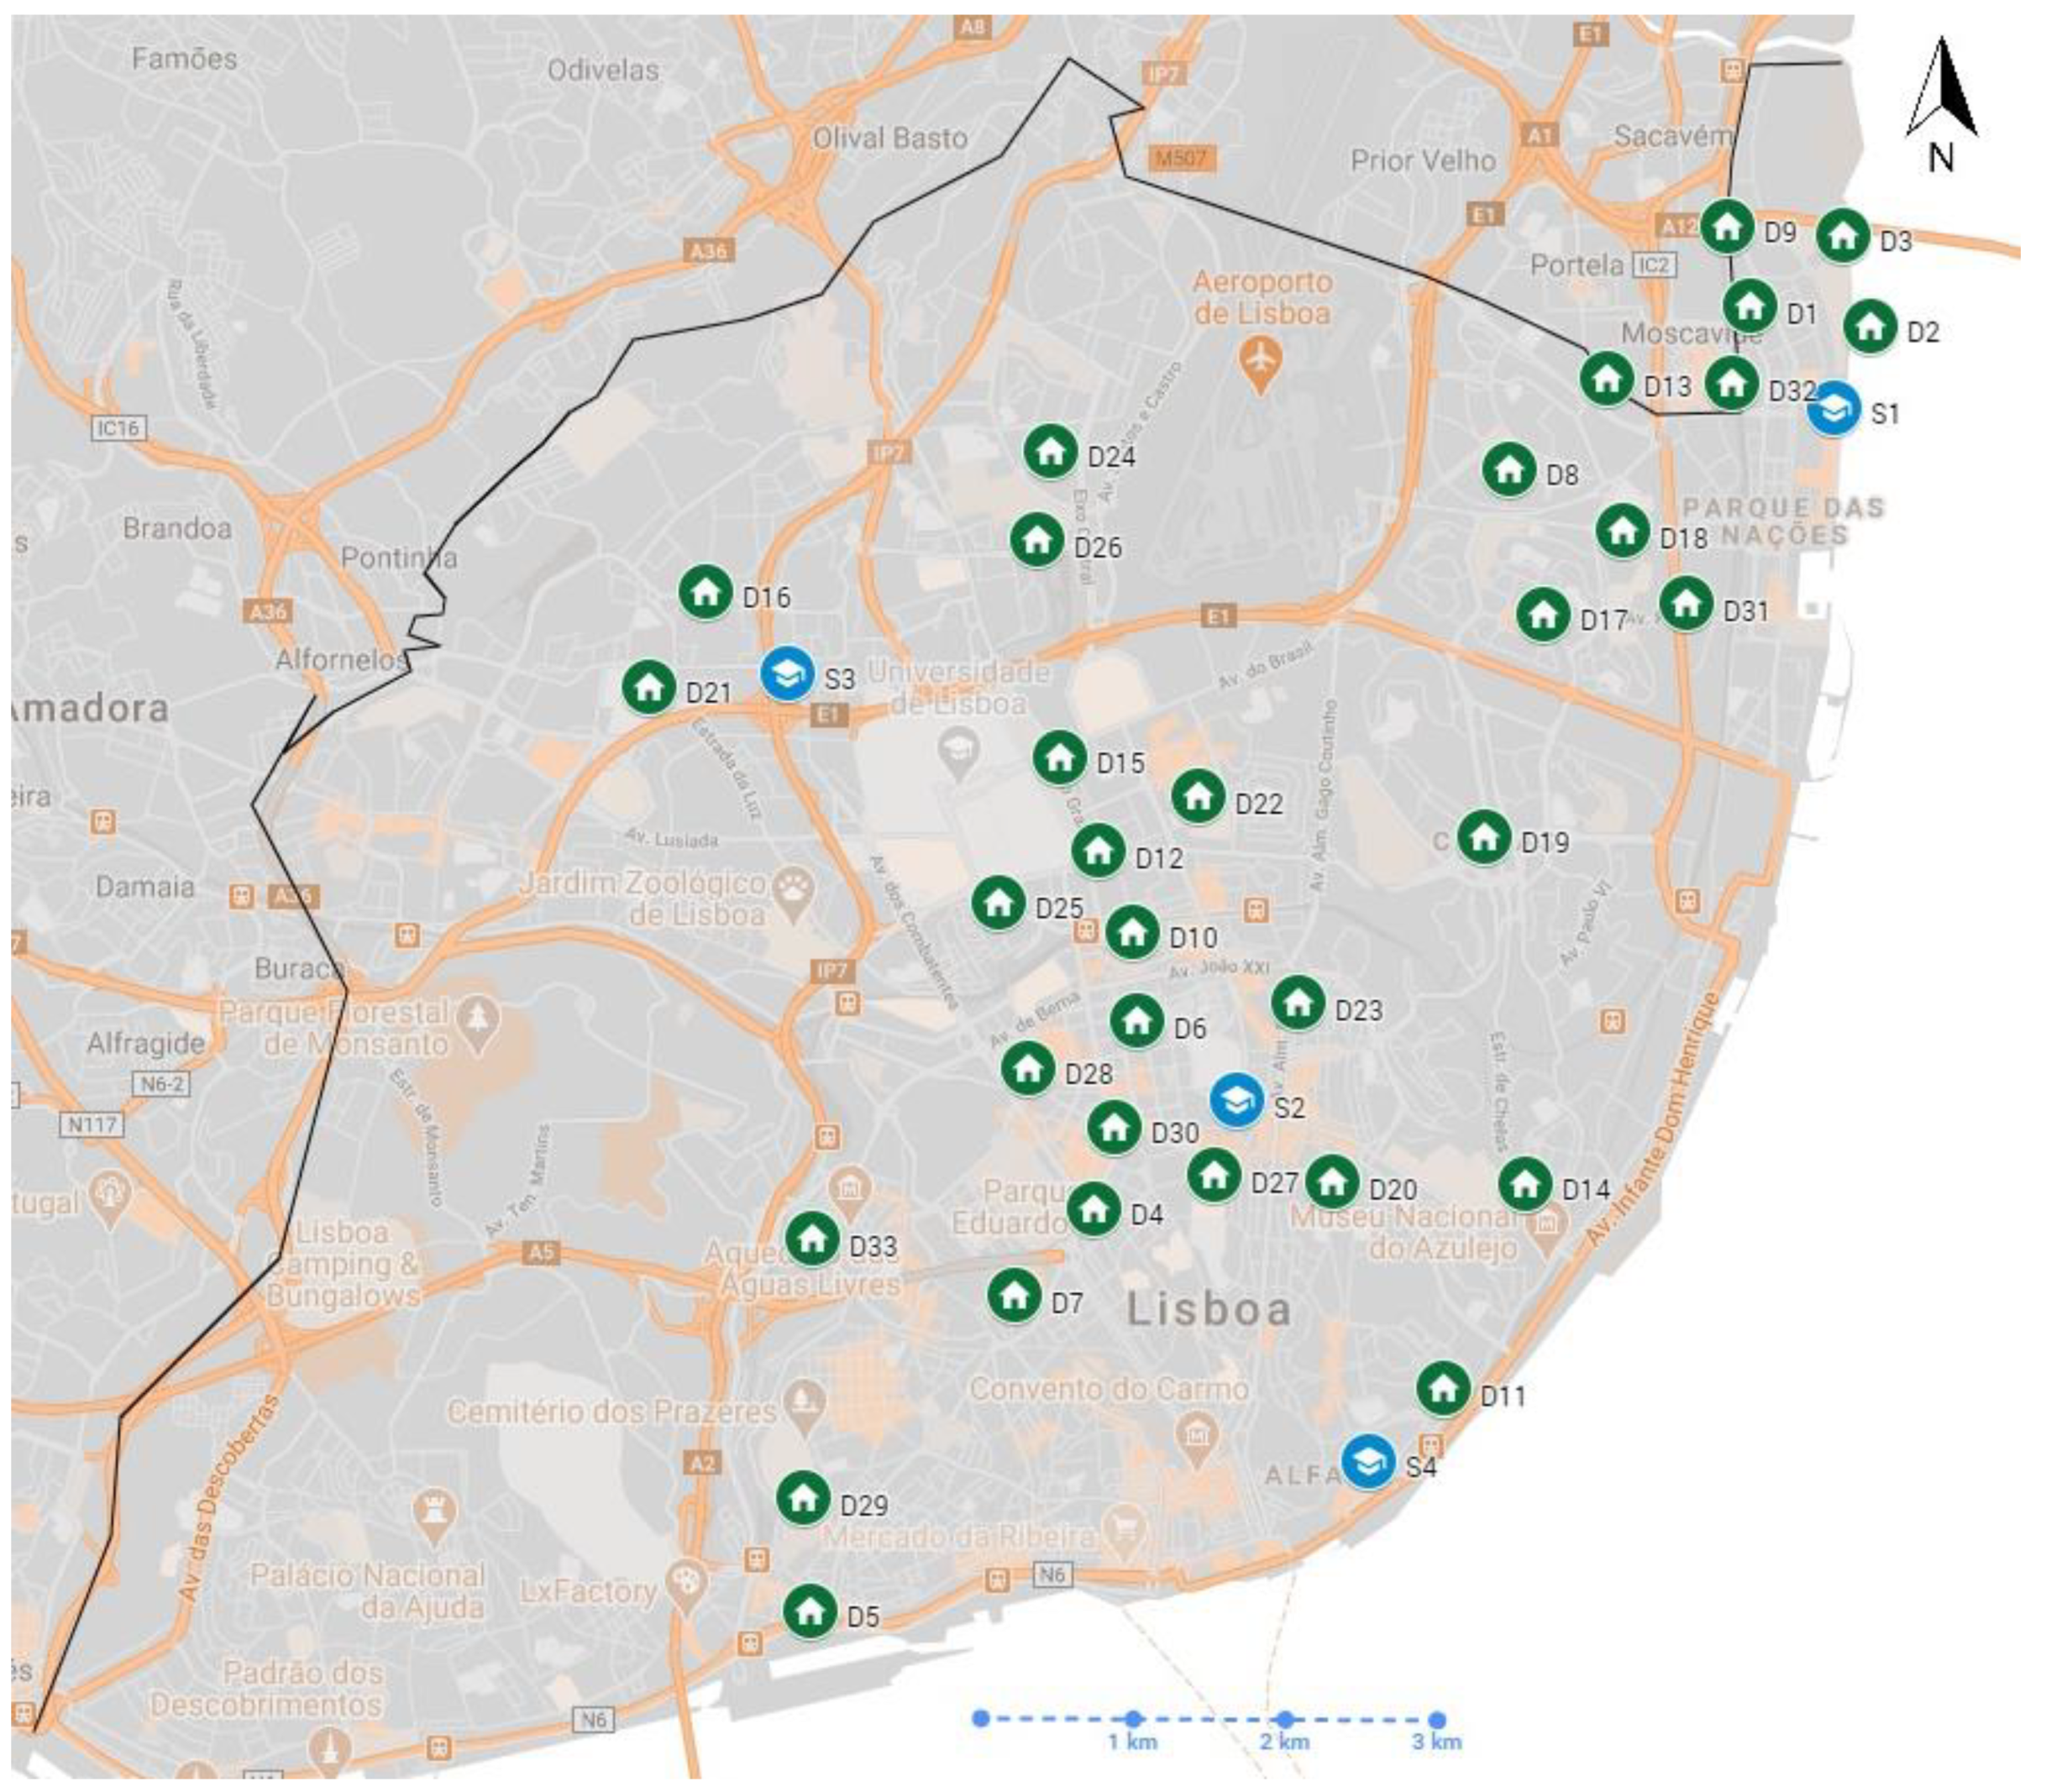
2.1. Location of the Studied Schools and Dwellings
2.2. Air Particulate Matter and Settled Dust Sampling
2.3. Electrostatic Dust Cloth Extraction and Bioburden Characterization
2.4. Statistical Analysis
3. Results
3.1. Particulate Matter Assessment
3.2. Bacterial Contamination Assessment
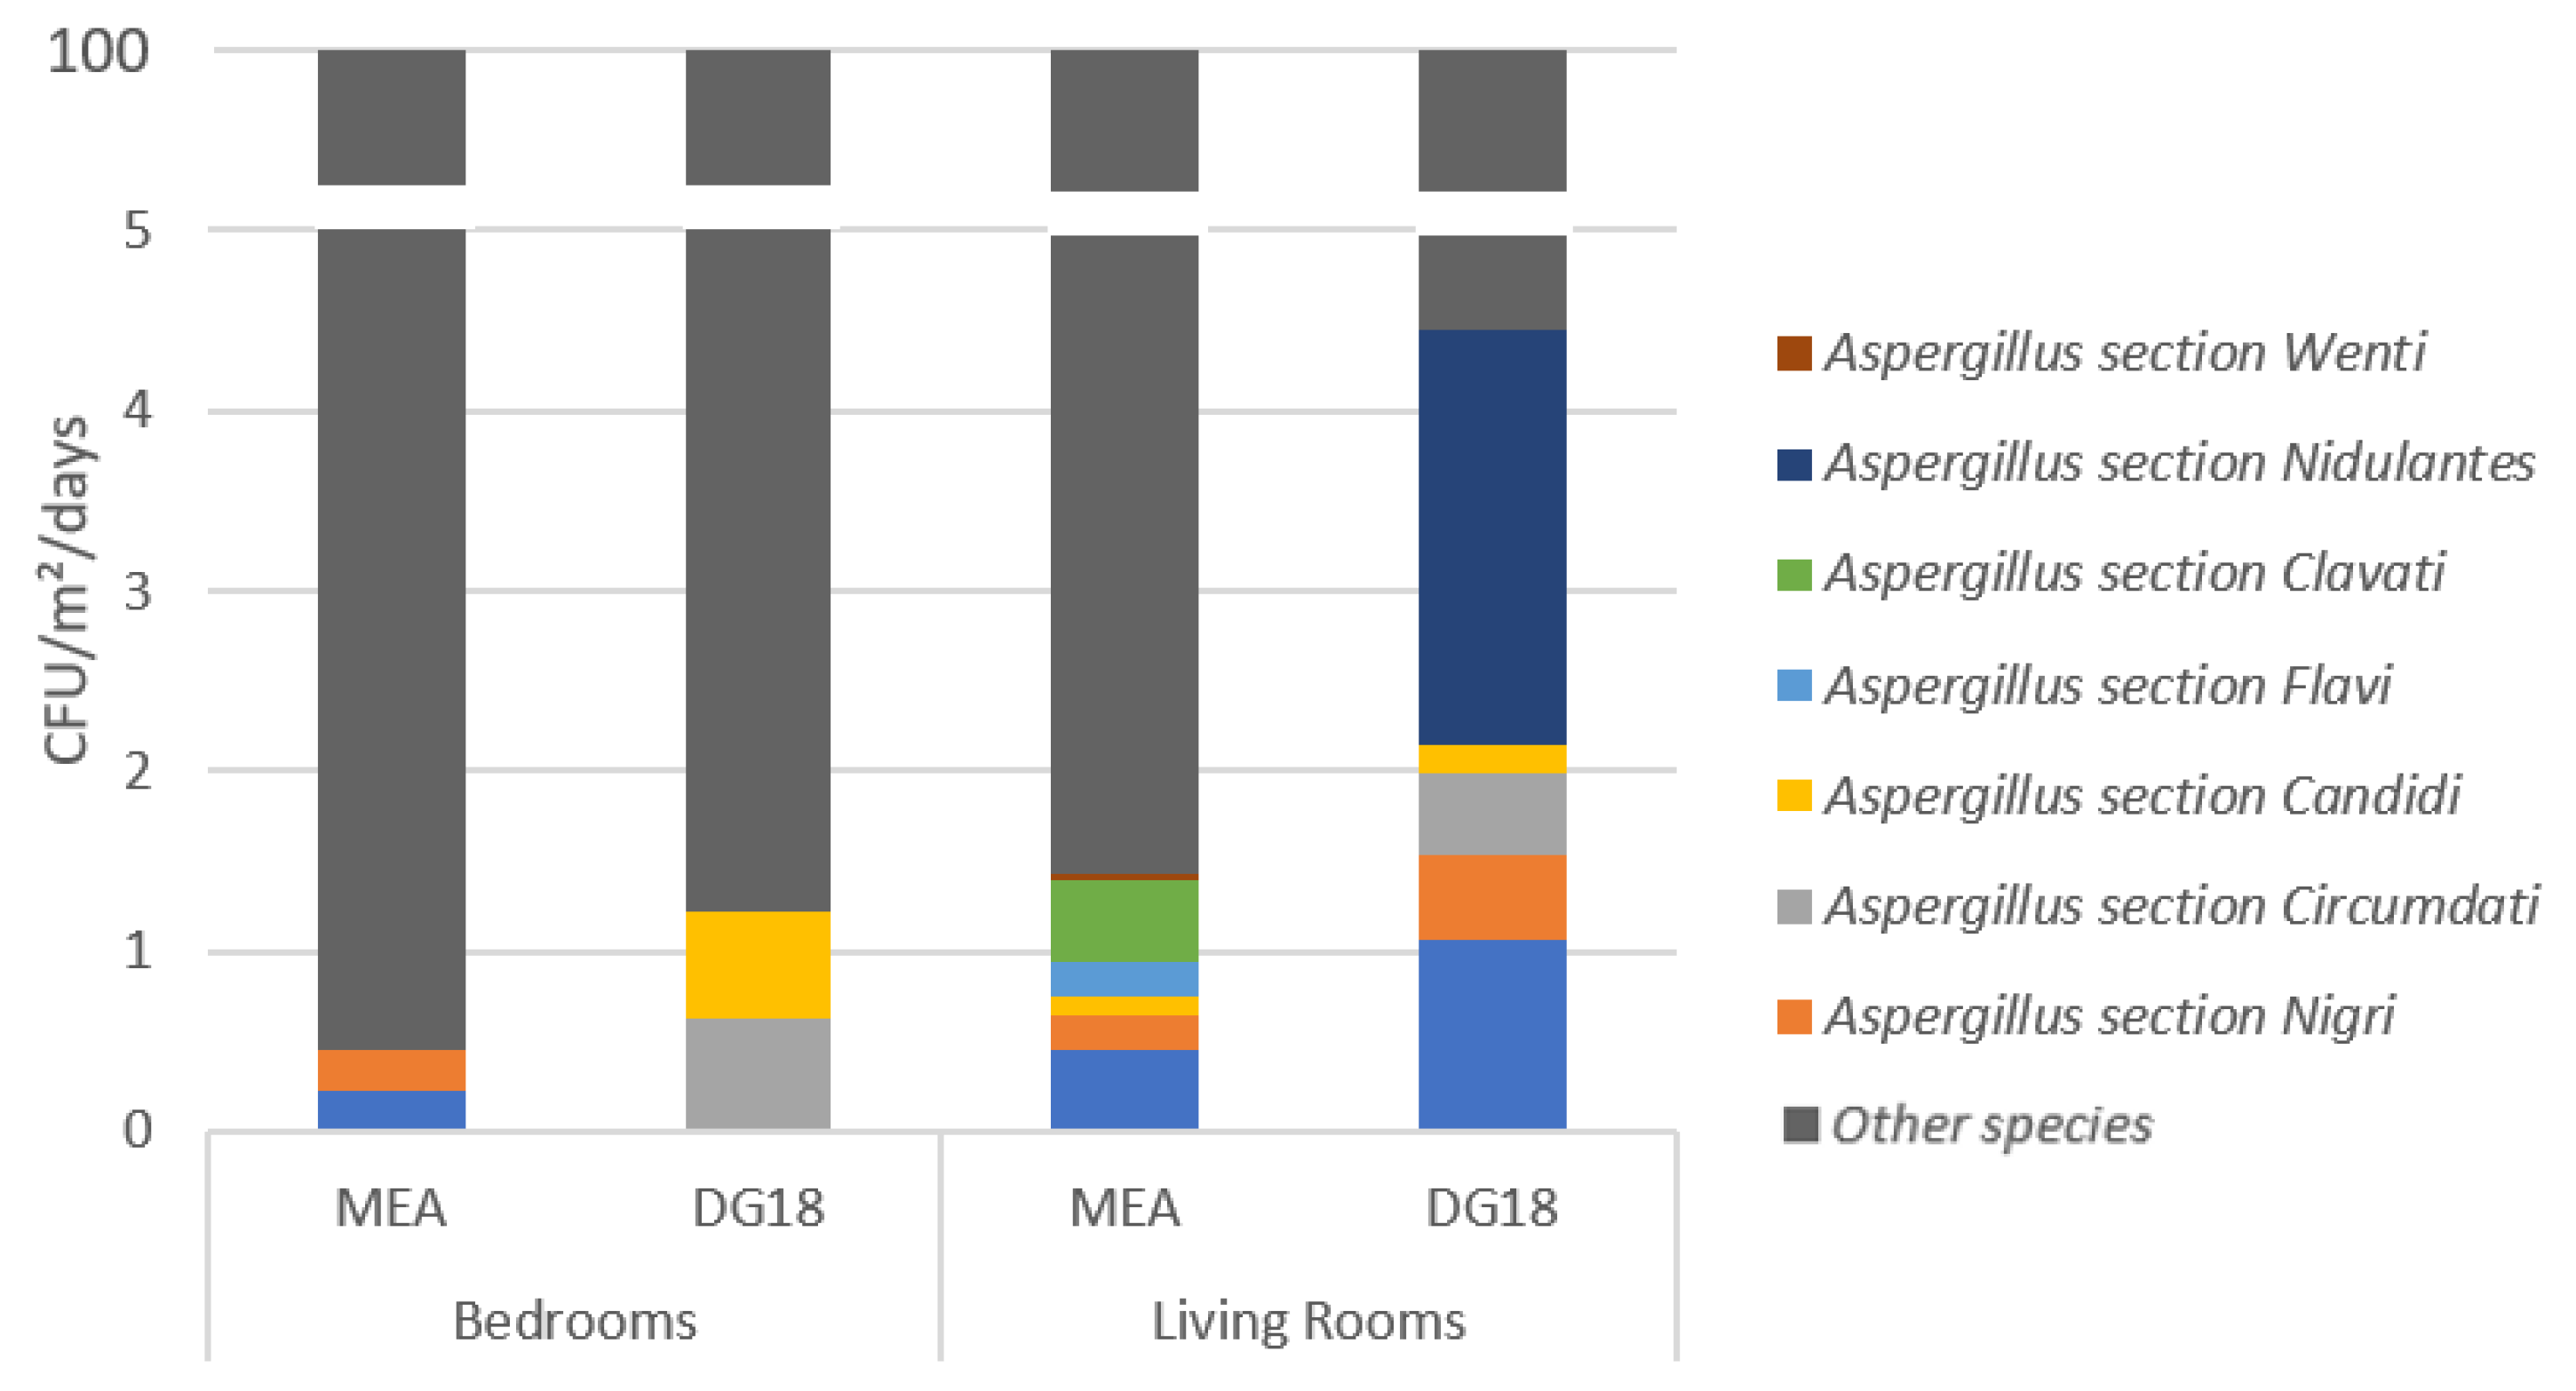
3.3. Fungal Contamination Assessment
3.4. Azole-Resistance Screening
3.5. Molecular Assessment
3.6. Correlation Analysis
3.7. Comparison between Sampling Locations
4. Discussion
5. Conclusions
Author Contributions
Funding
Acknowledgments
Conflicts of Interest
References
- Selgrade, M.K.; Plopper, C.G.; Gilmour, M.I.; Conolly, R.B.; Foos, B.S.P. Assessing the health effects and risks associated with children’s inhalation exposures—Asthma and allergy. J. Toxicol. Environ. Health Part A 2008, 71, 196–207. [Google Scholar] [CrossRef] [PubMed]
- WHO. Effects of Air Pollution on Children’s Health and Development–A Review of the Evidence; WHO Regional Office for Europe, WHO Press: Copenhagen, Denmark, 2005. [Google Scholar]
- Faria, T.; Martins, V.; Correia, C.; Canha, N.; Diapouli, E.; Manousakas, M.; Eleftheriadis, K.; Almeida, S.M. Children’s exposure and dose assessment to particulate matter in Lisbon. Build. Environ. 2020, 171, 106666. [Google Scholar] [CrossRef]
- Douwes, J.; Thorne, P.; Pearce, N.; Heederik, D. Bioaerosol health effects and exposure assessment: Progress and prospects. Ann. Occup. Hyg. 2003, 47, 187–200. [Google Scholar] [PubMed] [Green Version]
- Martinelli, N.; Olivieri, O.; Girelli, D. European Journal of Internal Medicine Air particulate matter and cardiovascular disease: A narrative review. Eur. J. Intern. Med. 2013, 24, 295–302. [Google Scholar] [CrossRef] [PubMed]
- Calvo, A.I.; Alves, C.; Castro, A.; Pont, V.; Vicente, A.M.; Fraile, R. Research on aerosol sources and chemical composition: Past, current and emerging issues. Atmos. Res. 2013, 120–121, 1–28. [Google Scholar] [CrossRef]
- Seinfeld, J.H.; Pandis, S.N. Atmospheric Chemistry and Physics: From Air Pollution to Climate Change; John Wiley and Sons: Incorporated, NY, USA, 1998. [Google Scholar]
- Ekhaise, F.O.; Ogboghodo, B.I. Microbiological indoor and outdoor air quality of two major hospitals in Benin City, Nigeria. Sierra Leone J. Biomed. Res. 2011, 3, 169–174. [Google Scholar]
- Sudharsanam, S.; Swaminathan, S.; Ramalingam, A.; Thangavel, G.; Annamalai, R.; Steinberg, R.; Balakrishnan, K.; Srikanth, P. Characterization of indoor bioaerosols from a hospital ward in a tropical setting. Afr. Health Sci. 2012, 12, 217–225. [Google Scholar] [CrossRef]
- Ekhaise, F.O.; Isitor, E.E.; Idehen, O.; Emoghene, A.O. Airborne Microflora in the Atmosphere of an Hospital Environment of University of Benin Teaching Hospital (UBTH), Benin City, Nigeria. World J. Agric. Sci. 2010, 6, 166–170. [Google Scholar]
- Salama, K.F.; Berekaa, M.M. Assessment of air quality in Dammam slaughter houses, Saudi Arabia. Int. J. Med. Sci. Public Health Online 2015, 5, 287–291. [Google Scholar] [CrossRef]
- Klánova, K.; Hollerová, J. Hospital indoor environment: Screening for microorganisms and particulate matter. Indoor Built Environ. 2003, 12, 61–67. [Google Scholar] [CrossRef]
- Park, D.U.; Yeom, J.K.; Lee, W.J.; Lee, K.M. Assessment of the levels of airborne bacteria, gram-negative bacteria, and fungi in hospital lobbies. Int. J. Environ. Res. Public Health 2013, 10, 541–555. [Google Scholar] [CrossRef] [PubMed]
- Tang, C.S.; Wan, G.H. Air quality monitoring of the post-operative recovery room and locations surrounding operating theatres in a medical center in Taiwan. PLoS ONE 2013, 8, 61093. [Google Scholar]
- Cabo Verde, S.; Almeida, S.M.; Matos, J.; Guerreiro, D.; Meneses, M.; Faria, T.; Botelho, D.; Santos, M.; Viegas, C. Microbiological assessment of indoor air quality at different hospital sites. Res. Microbiol. 2015, 166, 557–563. [Google Scholar] [CrossRef]
- Viegas, C.; Coggins, A.M.; Faria, T.; Caetano, L.A.; Gomes, A.Q.; Sabino, R.; Fleming, G.T. Fungal burden exposure assessment in podiatry clinics. Int. J. Environ. Health Res. 2018, 28, 167–177. [Google Scholar] [CrossRef] [PubMed]
- American Conference of Governmental Industrial Hygienists (ACGIH). Threshold Limit Values for Chemical Substances and Physical Agents and Biological Exposure Indices; ACGIH: Cincinnati, OH, USA, 2009. [Google Scholar]
- Kilburg-Basnyat, B.; Metwali, N.; Thorne, P.S. Performance of electrostatic dust collectors (EDCs) for endotoxin assessment in homes: Effect of mailing, placement, heating and electrostatic charge. J. Occup. Environ. Hyg. 2016, 13, 85–93. [Google Scholar] [CrossRef] [Green Version]
- Viegas, C.; Santos, P.; Almeida, B.; Monteiro, A.; Carolino, E.; Quintal Gomes, A.; Viegas, S. Electrostatic dust collector: A passive screening method to assess occupational exposure to organic dust in primary health care centers. Air Qual. Atmos. Health 2019, 12, 573–583. [Google Scholar] [CrossRef]
- Cozen, W.; Avol, E.; Diaz-Sanchez, D.; McConnell, R.; Gauderman, W.J.; Cockburn, M.G.; Mack, T.M. Use of an electrostatic dust cloth for self-administered home allergen collection. Twin Res. Hum. Genet. 2008, 11, 150–155. [Google Scholar] [CrossRef]
- Normand, A.C.; Vacheyrou, M.; Sudre, B.; Heederik, D.J.J.; Piarroux, R. Assessment of dust sampling methods for the study of cultivable-microorganism exposure in stables. Appl. Environ. Microbiol. 2009, 75, 7617–7623. [Google Scholar] [CrossRef] [Green Version]
- Madsen, A.M.; Matthiesen, C.B.; Frederiksen, M.W.; Frederiksen, M.; Frankel, M.; Spilak, M.; Timm, M. Sampling, extraction and measurement of bacteria, endotoxin, fungi and inflammatory potential of settling indoor dust. J. Environ. Monit. 2012, 14, 3230–3239. [Google Scholar] [CrossRef]
- Dorado-Garcia, A.; Bos, M.E.; Graveland, H.; Van Cleef, B.A.; Verstappen, K.M.; Kluytmans, J.A.; Wagenaar, J.A.; Heederik, D.J. Risk factors for persistence of livestock-associated MRSA and environmental 506 exposure in veal calf farmers and their family members: An observational longitudinal study. BMJ 2013, 3, e003272. [Google Scholar]
- Kilburg-Basnyat, B.; Metwali, N.; Thorne, P.S. Effect of deployment time on endotoxin and allergen exposure assessment using electrostatic dust collectors. Annals Occup. Hyg. 2014, 59, 104–115. [Google Scholar]
- Feld, L.; Bay, H.; Angen, Ø.; Larsen, A.R.; Madsen, A.M. Survival of LA-MRSA in Dust from Swine Farms. Ann. Work Expo. Health 2018, 62, 147–156. [Google Scholar] [CrossRef] [PubMed] [Green Version]
- Viegas, C.; Monteiro, A.; Aranha Caetano, L.; Faria, T.; Carolino, E.; Viegas, S. Electrostatic Dust Cloth: A Passive Screening Method to Assess Occupational Exposure to Organic Dust in Bakeries. Atmosphere 2018, 9, 64. [Google Scholar] [CrossRef] [Green Version]
- Viegas, C.; Twarużek, M.; Lourenço, R.; Dias, M.; Almeida, B.; Caetano, L.A.; Carolino, E.; Gomes, A.Q.; Kosicki, R.; Soszczyńska, E.; et al. Bioburden Assessment by Passive Methods on a Clinical Pathology Service in One Central Hospital from Lisbon: What Can it Tell Us Regarding Patients and Staff Exposure? Atmosphere 2020, 11, 351. [Google Scholar] [CrossRef] [Green Version]
- Snelders, E.; Melchers, W.J.; Verweij, P.E. Azole resistance in Aspergillus fumigatus: A new challenge in the management of invasive aspergillosis? Future Microbiol. 2011, 6, 335–347. [Google Scholar] [CrossRef] [PubMed]
- Verweij, P.E.; Chowdhary, A.; Melchers, W.J.G.; Meis, J.F. Azole resistance in Aspergillus fumigatus: Can we retain the clinical use of mold-active antifungal azoles? Clin. Infect. Dis. 2016, 62, 362–368. [Google Scholar] [CrossRef] [Green Version]
- Fisher, M.C.; Hawkins, N.J.; Sanglard, D.; Gurr, S.J. Worldwide emergence of resistance to antifungal drugs challenges human health and food security. Science 2018, 18, 739–742. [Google Scholar] [CrossRef] [Green Version]
- Snelders, E.; Huis in ’t Veld, R.A.G.; Rijs, A.J.M.M.; Kema, G.H.J.; Melchers, W.J.G.; Verweij, P.E. Possible Environmental Origin of Resistance of Aspergillus fumigatus to Medical Triazoles. Appl. Environ. Microbiol. 2009, 75, 4053–4057. [Google Scholar] [CrossRef] [Green Version]
- Ahmad, S.; Khan, Z.; Hagen, F.; Meis, J.F. Occurrence of triazole-resistant Aspergillus fumigatus with TR34/L98H mutations in outdoor and hospital environment in Kuwait. Environ. Res. 2014, 133, 20–26. [Google Scholar] [CrossRef]
- Loeffert, S.T.; Hénaff, L.; Dupont, D.; Bienvenu, A.L.; Dananché, C.; Cassier, P.; Bénet, T.; Wallon, M.; Gustin, M.P.; Vanhems, P. Prospective survey of azole drug resistance among environmental and clinical isolates of Aspergillus fumigatus in a French University hospital during major demolition works. J. Mycol. Méd. 2018, 28, 469–472. [Google Scholar] [CrossRef]
- Chen, Y.; Kuo, S.; Wang, H.; Wu, C.; Lin, Y.; Li, W.; Lee, C. Azole resistance in Aspergillus species in Southern Taiwan: An epidemiological surveillance study. Mycoses 2019, 62, 1174–1181. [Google Scholar] [CrossRef] [PubMed]
- Cho, S.Y.; Lee, D.G.; Kim, W.B.; Chun, H.S.; Park, C.; Myong, J.P.; Park, Y.J.; Choi, J.K.; Lee, H.J.; Kim, S.H.; et al. Epidemiology and Antifungal Susceptibility Profile of Aspergillus Species: Comparison between Environmental and Clinical Isolates from Patients with Hematologic Malignancies. J. Clin. Microbiol. 2019, 57, e02023-18. [Google Scholar] [CrossRef] [PubMed] [Green Version]
- Monteiro, C.; Pinheiro, D.; Maia, M.; Faria, M.A.; Lameiras, C.; Pinto, E. Aspergillus species collected from environmental air samples in Portugal-molecular identification, antifungal susceptibility and sequencing of cyp51A gene on A. fumigatus sensu stricto itraconazole resistant. J. Appl. Microbiol. 2019, 126, 1140–1148. [Google Scholar] [CrossRef] [PubMed]
- American Industrial Hygiene Association. Field Guide for the Determination of Biological Contaminants in Environmental Samples, 2nd ed.; AIHA Biosafety Committee: Falls Church, VA, USA, 1996. [Google Scholar]
- Arendrup, M.C.; Sulim, S.; Holm, A.; Nielsen, L.; Nielsen, S.D.; Knudsen, J.D.; Drenck, N.E.; Christensen, J.J.; Johansen, H.K. Diagnostic issues, clinical characteristics, and outcomes for patients with fungemia. J. Clin. Microbiol. 2011, 49, 3300–3308. [Google Scholar] [CrossRef] [Green Version]
- Mayer, Z.; Bagnara, A.; FaÅNrber, P.; Geisen, R. Quantification of the copy number of nor-1, a gene of the aflatoxin biosynthetic pathway by real-time PCR, and its correlation to the cfu of Aspergillus flavus in foods. Int. J. Food Microbiol. 2003, 82, 143–151. [Google Scholar] [CrossRef]
- Cruz-Perez, P.; Buttner, M.P.; Stetzenbach, L.D. Detection and quantitation of Aspergillus fumigatus in pure culture using polymerase chain reaction. Mol. Cell. Probes 2001, 15, 81–88. [Google Scholar] [CrossRef]
- Viegas, C.; Faria, T.; Aranha, L.; Carolino, E.; Quintal Gomes, A.; Viegas, S. Aspergillus prevalence in different occupational settings. J. Occup. Environ. Hyg. 2017, 14, 771–785. [Google Scholar] [CrossRef]
- EPA, United States Environmental Protection Agency. About the National Exposure Research Laboratory (NERL). 2017. Available online: http://www.epa.gov/nerlcwww/moldtech.htm (accessed on 19 June 2017).
- Vissers, M.; Doekes, G.; Heederik, D. Exposure to wheat allergen and fungal α-amylase in the homes of bakers. Clin. Exp. Allergy 2001, 31, 1577–1582. [Google Scholar] [CrossRef]
- Noss, I.; Wouters, I.M.; Visser, M.; Heederik, D.J.J.; Thorne, P.S.; Brunekreef, B.; Doekes, G. Evaluation of a Low-Cost Electrostatic Dust Fall Collector for Indoor Air Endotoxin Exposure Assessment. Appl. Environ. Microbiol. 2008, 74, 5621–5627. [Google Scholar] [CrossRef] [Green Version]
- Institute of Medicine. Damp Indoor Spaces and Health; The National Academies Press: Washington, DC, USA, 2004. [Google Scholar]
- Rivas, I.; Viana, M.; Moreno, T.; Pandolfi, M.; Amato, F.; Reche, C.; Bouso, L.; Àlvarez-Pedrerol, M.; Alastuey, A.; Sunyer, J.; et al. Child exposure to indoor and outdoor air pollutants in schools in Barcelona, Spain. Environ. Int. 2014, 69, 200–212. [Google Scholar] [CrossRef] [Green Version]
- Rovelli, S.; Cattaneo, A.; Nuzzi, C.P.; Spinazzè, A.; Piazza, S.; Carrer, P.; Cavallo, D.M. Airborne particulate matter in school classrooms of northern Italy. Int. J. Environ. Res. Public Health 2014, 11, 1398–1421. [Google Scholar] [CrossRef] [PubMed] [Green Version]
- Hänninen, O.O.; Lebret, E.; Ilacqua, V.; Katsouyanni, K.; Künzli, N.; Srám, R.J.; Jantunen, M. Infiltration of ambient PM 2.5 and levels of indoor generated non-ETS PM 2.5 in residences of four European cities. Atmos. Environ. 2004, 38, 6411–6423. [Google Scholar] [CrossRef]
- Langer, S.; Ramalho, O.; Derbez, M.; Ribéron, J.; Kirchner, S.; Mandin, C. Indoor environmental quality in French dwellings and building characteristics. Atmos. Environ. 2016, 128, 82–91. [Google Scholar] [CrossRef]
- Stranger, M.; Potgieter-vermaak, S.S.; Grieken, R.V. Comparative overview of indoor air quality in Antwerp, Belgium. Environ. Int. 2007, 33, 789–797. [Google Scholar] [CrossRef] [PubMed]
- Cox, J.; Indugula, R.; Vesper, S.; Zhu, Z.; Jandarov, R.; Reponen, T. Comparison of indoor air sampling and dust collection methods for fungal exposure assessment using quantitative PCR. Environ. Sci. Process. Impacts 2017, 1–18. [Google Scholar] [CrossRef]
- Estokova, A.; Stevulova, N. Investigation of Suspended and Settled Particulate Matter in Indoor Air. In Atmospheric Aerosols—Regional Characteristics—Chemistry and Physics; Abdul-Razzak, H., Ed.; IntechOpen: London, UK, 2012; pp. 455–480. [Google Scholar] [CrossRef] [Green Version]
- Thatcher, T.L.; Lai, A.C.K.; Moreno-Jackson, R.; Sextro, R.G.; Nazaroff, W.W. Effects of room furnishings and air speed on particle deposition rates indoors. Atmos. Environ. 2002, 36, 1811–1819. [Google Scholar] [CrossRef] [Green Version]
- Thatcher, T.L.; Layton, D.W. Deposition, resuspension, and penetration of particles within a residence. Atmos. Environ. 1995, 29, 1487–1497. [Google Scholar] [CrossRef]
- Viegas, C.; Faria, T.; Cebola de Oliveira, A.; Aranha Caetano, L.; Carolino, E.; Quintal-Gomes, A.; Twarużek, M.; Kosicki, R.; Soszczyńska, E.; Viegas, S. A new approach to assess fungal contamination and mycotoxins occupational exposure in forklifts drivers from waste sorting. Mycotoxin Res. 2017, 33, 285–295. [Google Scholar] [CrossRef]
- Adhikari, A.; Kettleson, E.M.; Vesper, S.; Kumar, S.; Popham, D.L.; Schaffer, C.; Indugula, R.; Chatterjee, K.; Allam, K.K.; Grinshpun, S.A.; et al. Dustborne and airborne Gram-positive and Gram-negative bacteria in high versus low ERMI homes. Sci. Total Environ. 2014, 482–483, 92–99. [Google Scholar] [CrossRef] [Green Version]
- Varga, J.; Baranyi, N.; Chandrasekaran, M.; Vágvölgyi, C.; Kocsubé, S. Mycotoxin producers in the Aspergillus genus: An update. Acta Biol. Szeged. 2015, 59, 151–167. [Google Scholar]
- Brochers, A.T.; Chang, C.; Gershwin, E. Mold and human health: A reality check. Clin. Rev. Allergy Immunol. 2017, 52, 305–322. [Google Scholar] [CrossRef] [PubMed]
- Bennett, J.W.; Klich, M. Mycotoxins. Clin. Microbiol. Rev. 2013, 16, 497–516. [Google Scholar] [CrossRef] [PubMed] [Green Version]
- Mbareche, H.; Veillette, M.; Bilodeau, G.J.; Duchaine, C. Fungal aerosols at dairy farms using molecular and culture techniques. Sci. Total Environ. 2019, 653, 253–263. [Google Scholar] [CrossRef]
- Madsen, A.M.; Frederiksen, M.W.; Jacobsen, M.H.; Tendal, K. Towards a risk evaluation of workers’ exposure to handborne and airborne microbial species as exempli fi ed with waste collection workers. Environ. Res. 2020, 183, 109177. [Google Scholar] [CrossRef] [PubMed]
- Cooley, J.; Wong, W.; Jumper, C.; Hutson, J.; Williams, H.; Schwab, C.; Straus, D. An animal model for allergic penicilliosis induced by the intranasal instillation of viable Penicillium chrysogenum conidia. Thorax 2000, 55, 489–496. [Google Scholar] [CrossRef] [Green Version]
- Huttunen, K.; Hyvarinen, A.; Nevalainen, A.; Komulainen, H.; Hirvonen, M.R. Production of proinflammatory mediators by indoor air bacteria and fungal spores in mouse and human cell lines. Environ. Health Perspect. 2003, 111, 85–92. [Google Scholar] [CrossRef] [Green Version]
- Croston, T.L.; Nayak, A.P.; Lemons, A.R.; Goldsmith, W.; Gu, J.K.; Germolec, D.R.; Beezhold, D.H.; Green, B.J. Influence of Aspergillus fumigatus conidia viability on murine pulmonary micro RNA and m RNA expression following subchronic inhalation exposure. Clin. Exp. Allergy 2016, 46, 1315–1327. [Google Scholar] [CrossRef] [Green Version]
- Microbiology, N. Stop neglecting fungi. Nat. Microbiol. 2017, 2, 17120. [Google Scholar] [CrossRef] [Green Version]
- Chowdhary, A.; Meis, J.F. Emergence of azole resistant Aspergillus fumigatus and One Health: Time to implement environmental stewardship. Environ. Microbiol. 2018, 20, 1299–1301. [Google Scholar] [CrossRef] [Green Version]
- Sewell, T.R.; Zhu, J.; Rhodes, J.; Hagen, F.; Meis, J.F.; Fisher, M.C.; Jombart, T. Nonrandom Distribution of Azole Resistance across the Global Population of Aspergillus fumigatus. mBio 2019, 10, e00392-19. [Google Scholar] [CrossRef] [Green Version]
- Caramalho, R.; Tyndall, J.D.A.; Monk, B.C.; Larentis, T.; Lass-Flörl, C.; Lackner, M. Intrinsic short-tailed azole resistance in mucormycetes is due to an evolutionary conserved aminoacid substitution of the lanosterol 14α-demethylase. Sci. Rep. 2017, 7, 15898. [Google Scholar] [CrossRef] [PubMed]
- Sagatova, A.A.; Keniya, M.V.; Wilson, R.K.; Sabherwal, M.; Tyndall, J.D.; Monk, B.C. Triazole resistance mediated by mutations of a conserved active site tyrosine in fungal lanosterol 14α-demethylase. Sci. Rep. 2016, 6, 26213. [Google Scholar] [CrossRef] [PubMed] [Green Version]


| Aspergillus Sections Targeted | Sequences | Reference |
|---|---|---|
| Flavi (Strains with toxigenic potential) Forward Primer | 5′-GTCCAAGCAACAGGCCAAGT-3′ | |
| Reverse Primer | 5′-TCGTGCATGTTGGTGATGGT-3′ | [39] |
| Probe | 5′-TGTCTTGATCGGCGCCCG-3′ | |
| Fumigati | ||
| Forward Primer | 5′-CGCGTCCGGTCCTCG-3′ | |
| Reverse Primer | 5′-TTAGAAAAATAAAGTTGGGTGTCGG-3′ | [40] |
| Probe | 5′-TGTCACCTGCTCTGTAGGCCCG-3′ | |
| Circumdati | ||
| Forward Primer | 5′-CGGGTCTAATGCAGCTCCAA-3′ | |
| Reverse Primer | 5′-CGGGCACCAATCCTTTCA-3′ | [41] |
| Probe | 5′-CGTCAATAAGCGCTTTT-3′ | |
| Nidulantes | ||
| Forward Primer | 5′–CGGCGGGGAGCCCT-3′ | |
| Reverse Primer | 5′–CCATTGTTGAAAGTTTTGACTGATcTTA-3′ | |
| Probe | 5′–AGACTGCATCACTCTCAGGCATGAAGTTCAG-3′ | [42] |
| Settled Dust (g/m2/d) | PM2.5 (µg/m3) | PM10 (µg/m3) | ||
|---|---|---|---|---|
| Schools | Average | 1.42 | 31.15 | 57.83 |
| Range (min–max) | 1.28–1.57 | 19.47–52.91 | 32.72–109.02 | |
| Dwellings | Average | 3.36 | - | - |
| Range (min–max) | 1.27–11.16 | - | - | |
| Living Rooms | Average | 3.60 | 15.26 | 18.95 |
| Range (min–max) | 1.28–11.16 | 6.05–67.96 | 9.14–72.95 | |
| Bedrooms | Average | 3.11 | - | - |
| Range (min–max) | 1.27–10.74 | - | - |
| Location | Total Bacteria | Gram-Negative Bacteria | ||
|---|---|---|---|---|
| Average | N | CFU/m2/d | CFU/m2/d | |
| Bedrooms | Range (min–max) | 31 | *−1.42 × 10³ | *−3.15 × 101 |
| Living Rooms | Range (min–max) | 33 | *−3.42 × 10³ | *−4.60 × 101 |
| Classrooms | Range (min–max) | 4 | *−6.2 × 101 | - |
| Location | Genus/Species | MEA | DG18 | ||||
|---|---|---|---|---|---|---|---|
| N | CFU/m2/d | % | N | CFU/m2/d | % | ||
| Bedrooms | Alternaria sp. | 2 | 1.05 × 101 | 0.47 | 1 | 1.05 × 101 | 0.34 |
| Aureobasidium sp. | 1 | 5.24 × 100 | 0.23 | 1 | 5.24 × 100 | 0.17 | |
| Chrysosporium sp. | 3 | 2.56 × 101 | 1.14 | 2 | 9.49 × 100 | 0.31 | |
| Cladosporium sp. | 8 | 1.59 × 10² | 7.10 | 14 | 2.81 × 10³ | 90.44 | |
| Geotrichum sp. | 1 | 4.14 × 100 | 0.18 | 1 | 5.24 × 100 | 0.17 | |
| Penicillium sp. | 17 | 2.00 × 10³ | 89.43 | 12 | 2.07 × 10² | 6.67 | |
| Aspergillus sp. | 2 | 1.05 × 101 | 0.47 | 2 | 3.81 × 101 | 1.23 | |
| Fusarium sp. | 2 | 2.18 × 101 | 0.97 | 0 | * | * | |
| Crysonilia sitophila | 0 | * | * | 2 | 2.10 × 101 | 0.68 | |
| Living rooms | Alternaria sp. | 1 | 5.24 × 100 | 0.04 | 0 | * | * |
| Aspergillus sp. | 2 | 1.33 × 10² | 0.97 | 2 | 1.68 × 10² | 4.91 | |
| Aureobasidium sp. | 1 | 4.91 × 100 | 0.04 | 0 | * | * | |
| Chrysonilia sp. | 2 | 5.24 × 10³ | 38.11 | 1 | 2.62 × 10³ | 76.55 | |
| Chrysosporium sp. | 4 | 2.64 × 10³ | 19.19 | 8 | 6.68 × 101 | 1.95 | |
| Cladosporium sp. | 13 | 2.22 × 10² | 1.61 | 12 | 1.7 × 10² | 4.96 | |
| Fusarium sp. | 0 | * | * | 1 | 2.46 × 101 | 0.72 | |
| Geotrichum sp. | 0 | * | * | 2 | 1.48 × 101 | 0.43 | |
| Penicillium sp. | 14 | 2.65 × 10² | 1.93 | 16 | 3.54 × 10² | 10.33 | |
| Rhizopus sp. | 2 | 5.24 × 10³ | 38.11 | 0 | * | * | |
| Ulocladium sp. | 0 | * | * | 1 | 5.24 × 100 | 0.15 | |
| Classrooms | Penicillium sp. | 2 | 1.76 × 101 | 64.21 | 0 | * | * |
| Chrysonilia sp. | 1 | 4.91 × 100 | 17.90 | 1 | 4.91 × 100 | 19.74 | |
| Cladosporium sp. | 1 | 4.91 × 100 | 17.90 | 1 | 4.91 × 100 | 19.74 | |
| Aspergillus sp. | 0 | * | * | 1 | 4.91 × 100 | 19.74 | |
| Chrysosporium sp. | 0 | * | * | 1 | 1.02 × 101 | 40.79 | |
| Species/Sections/Complexes | SAB | ITR | VOR | POS | ||||||||
|---|---|---|---|---|---|---|---|---|---|---|---|---|
| N | CFU/m2/d | % | N | CFU/m2/d | % | N | CFU/m2/d | % | N | CFU/m2/d | % | |
| Alternaria sp. | 8 | 4.91 × 101 | 0.22 | 0 | * | 0 | 1 | 5.24 × 101 | 0.94 | 0 | * | 0 |
| Aspergillus section Aspergilli | 1 | 5.24 × 100 | 0.02 | 0 | * | 0 | 0 | * | 0 | 0 | * | 0 |
| Aspergillus section Candidi | 0 | * | 0 | 0 | * | 0 | 1 | 5.24 × 100 | 0.94 | 0 | * | 0 |
| Aspergillus section Fumigati | 2 | 9.38 × 100 | 0.04 | 0 | * | 0 | 0 | * | 0 | 0 | * | 0 |
| Aspergillus section Nigri | 14 | 6.91 × 101 | 0.31 | 0 | * | 0 | 2 | 9.38 × 100 | 1.68 | 0 | * | 0 |
| Aspergillus section Nidulantes | 21 | 9.02 × 101 | 0.41 | 0 | * | 0 | 0 | * | 0 | 0 | * | 0 |
| Aureobasidium sp. | 0 | * | 0 | 2 | 1.05 × 101 | 16.18 | 5 | 2.40 × 101 | 4.30 | 1 | 4.14 × 101 | 4.41 |
| Crysonilia sitophila | 3000 | 1.84 × 10⁴ | 83.05 | 0 | * | 0 | 2 | 9.38 × 100 | 1.68 | 2 | 1.05 × 101 | 11.17 |
| Chrysosporium sp. | 24 | 5.24 × 101 | 0.24 | 1 | 5.24 × 100 | 8.09 | 3 | 1.54 × 101 | 2.76 | 3 | 2.41 × 101 | 25.73 |
| Cladosporium sp. | 561 | 2.92 × 10³ | 13.22 | 6 | 2.62 × 101 | 40.44 | 55 | 2.14 × 10² | 38.33 | 7 | 3.47 × 101 | 37.03 |
| Fusarium incarnatum-equiseti species complex | 2 | 1.05 × 101 | 0.05 | 0 | * | 0 | 0 | * | 0 | 0 | * | 0 |
| Fusarium oxysporum species complex | 0 | * | 0 | 1 | 5.24 × 100 | 8.09 | 0 | * | 0 | 0 | * | 0 |
| Geotrichum sp. | 0 | * | 0 | 0 | * | 0 | 2 | 1.05 × 101 | 1.88 | 0 | * | 0 |
| Litchemia sp. | 2 | 1.05 × 101 | 0.05 | 0 | * | 0 | 0 | * | 0 | 0 | * | 0 |
| Penicillium sp. | 162 | 5.07 × 10² | 2.29 | 3 | 1.76 × 101 | 27.21 | 53 | 2.54 × 10² | 45.60 | 5 | 2.03 × 101 | 21.65 |
| Syncephalastrum racemosum | 1 | 4.91 × 100 | 0.02 | 0 | * | 0 | 0 | * | 0 | 0 | * | 0 |
| Paecilomyces sp. | 1 | 1.57 × 101 | 0.07 | 0 | * | 0 | 0 | * | 0 | 0 | * | 0 |
| Ulocladium sp. | 0 | * | 0 | 0 | * | 0 | 2 | 1.05 × 101 | 1.88 | 0 | * | 0 |
| Variables | Particles (µg/m3) | Bacteria (CFU/m2/d) | Fungi (CFU/m2/d) | Fungi in Azole-Screening Media | Aspergillus Prevalence (CFU/m2/d) | |||||||
|---|---|---|---|---|---|---|---|---|---|---|---|---|
| PM2.5 | PM10 | TSA | RB | MEA | DG18 | ITR | VOR | POS | MEA | DG18 | ||
| EDC Weight (g/m2/d) | −0.395 * | −0.486 ** | −0.252 * | 0.118 | 0.038 | 0.210 | 0.030 | 0.083 | 0.000 | 0.555 * | 0.253 | |
| Particles (µg/m3) | PM2.5 | 0.957 ** | 0.240 | 0.123 | −0.084 | −0.013 | 0.164 | −0.084 | −0.014 | −0.386 | −0.392 | |
| PM10 | 0.220 | 0.114 | −0.066 | 0.023 | 0.153 | −0.064 | 0.027 | −0.426 | −0.447 | |||
| Bacteria (CFU/m2/d) | TSA | 0.146 | 0.005 | 0.058 | 0.053 | 0.034 | 0.119 | −0.379 | −0.203 | |||
| RB | 0.069 | 0.141 | 0.055 | 0.033 | −0.009 | 0.019 | −0.106 | |||||
| Fungi (CFU/m2/d) | MEA | 0.457 ** | −0.097 | 0.281 * | 0.280 * | 0.420 | 0.196 | |||||
| DG18 | −0.019 | 0.262 * | 0.276 * | 0.107 | 0.459 * | |||||||
| Fungi in azole-screening media | ITR | 0.078 | 0.026 | −0.324 | 0.029 | |||||||
| VOR | 0.250 * | 0.335 | 0.287 | |||||||||
| POS | −0.032 | −0.155 | ||||||||||
| Aspergillus prevalence (CFU/m2/d) | MEA | 0.355 | ||||||||||
| Variables | Ranks | Test Statistics | |||||
|---|---|---|---|---|---|---|---|
| Location | N | Mean Rank | χ2 Kruskal–Wallis or Mann–Whitney U | Df | p | ||
| EDC Weight (g) | Classroom | 4 | 11.75 | 6.174 * | 2 | 0.046 *** | |
| Living room | 33 | 37.68 | |||||
| Bedroom | 31 | 34.05 | |||||
| Total | 68 | ||||||
| Particles | PM2.5 (µg/m3) | Classroom | 4 | 31.75 | 15.000 ** | 0.013 *** | |
| Living room | 33 | 17.45 | |||||
| Total | 37 | ||||||
| PM10 (µg/m3) | Classroom | 4 | 33.50 | 8.000 ** | 0.005 *** | ||
| Living room | 33 | 17.24 | |||||
| Total | 37 | ||||||
| Bacterial contamination | TSA (CFU/m2/d) | Classroom | 4 | 25.88 | 0.774 * | 2 | 0.679 |
| Living room | 32 | 33.25 | |||||
| Bedroom | 30 | 34.78 | |||||
| Total | 66 | ||||||
| RB (CFU/m2/d) | Classroom | 4 | 31.00 | 0.491 * | 2 | 0.782 | |
| Living room | 33 | 34.08 | |||||
| Bedroom | 31 | 33.22 | |||||
| Total | 68 | ||||||
| Fungal contamination | MEA (CFU/m2/d) | Classroom | 4 | 25.38 | 3.228 * | 2 | 0.199 |
| Living room | 33 | 38.65 | |||||
| Bedroom | 31 | 31.26 | |||||
| Total | 68 | ||||||
| DG18 (CFU/m2/d) | Classroom | 4 | 21.75 | 3.306 * | 2 | 0.192 | |
| Living room | 33 | 38.18 | |||||
| Bedroom | 31 | 32.23 | |||||
| Total | 68 | ||||||
| Fungal presence in Azoles | ITR | Classroom | 4 | 46.00 | 5.049 * | 2 | 0.080 |
| Living room | 33 | 35.12 | |||||
| Bedroom | 31 | 32.35 | |||||
| Total | 68 | ||||||
| VOR | Classroom | 4 | 26.50 | 5.273 * | 2 | 0.072 | |
| Living room | 33 | 39.77 | |||||
| Bedroom | 31 | 29.92 | |||||
| Total | 68 | ||||||
| POS | Classroom | 4 | 38.00 | 5.920 * | 2 | 0.052 | |
| Living room | 33 | 38.18 | |||||
| Bedroom | 31 | 30.13 | |||||
| Total | 68 | ||||||
| Aspergillus prevalence | MEA | Classroom | 4 | 4.50 | 3.338 * | 2 | 0.188 |
| Living room | 5 | 8.60 | |||||
| Bedroom | 4 | 7.50 | |||||
| Total | 13 | ||||||
| DG18 | Classroom | 4 | 5.88 | 4.530 | 2 | 0.104 | |
| Living room | 8 | 13.25 | |||||
| Bedroom | 8 | 10.06 | |||||
| Total | 20 | ||||||
© 2020 by the authors. Licensee MDPI, Basel, Switzerland. This article is an open access article distributed under the terms and conditions of the Creative Commons Attribution (CC BY) license (http://creativecommons.org/licenses/by/4.0/).
Share and Cite
Viegas, C.; Almeida, B.; Dias, M.; Caetano, L.A.; Carolino, E.; Gomes, A.Q.; Faria, T.; Martins, V.; Marta Almeida, S. Assessment of Children’s Potential Exposure to Bioburden in Indoor Environments. Atmosphere 2020, 11, 993. https://doi.org/10.3390/atmos11090993
Viegas C, Almeida B, Dias M, Caetano LA, Carolino E, Gomes AQ, Faria T, Martins V, Marta Almeida S. Assessment of Children’s Potential Exposure to Bioburden in Indoor Environments. Atmosphere. 2020; 11(9):993. https://doi.org/10.3390/atmos11090993
Chicago/Turabian StyleViegas, Carla, Beatriz Almeida, Marta Dias, Liliana Aranha Caetano, Elisabete Carolino, Anita Quintal Gomes, Tiago Faria, Vânia Martins, and Susana Marta Almeida. 2020. "Assessment of Children’s Potential Exposure to Bioburden in Indoor Environments" Atmosphere 11, no. 9: 993. https://doi.org/10.3390/atmos11090993