Wildfire Smoke Transport and Air Quality Impacts in Different Regions of China

Abstract
:1. Introduction
2. Methodology
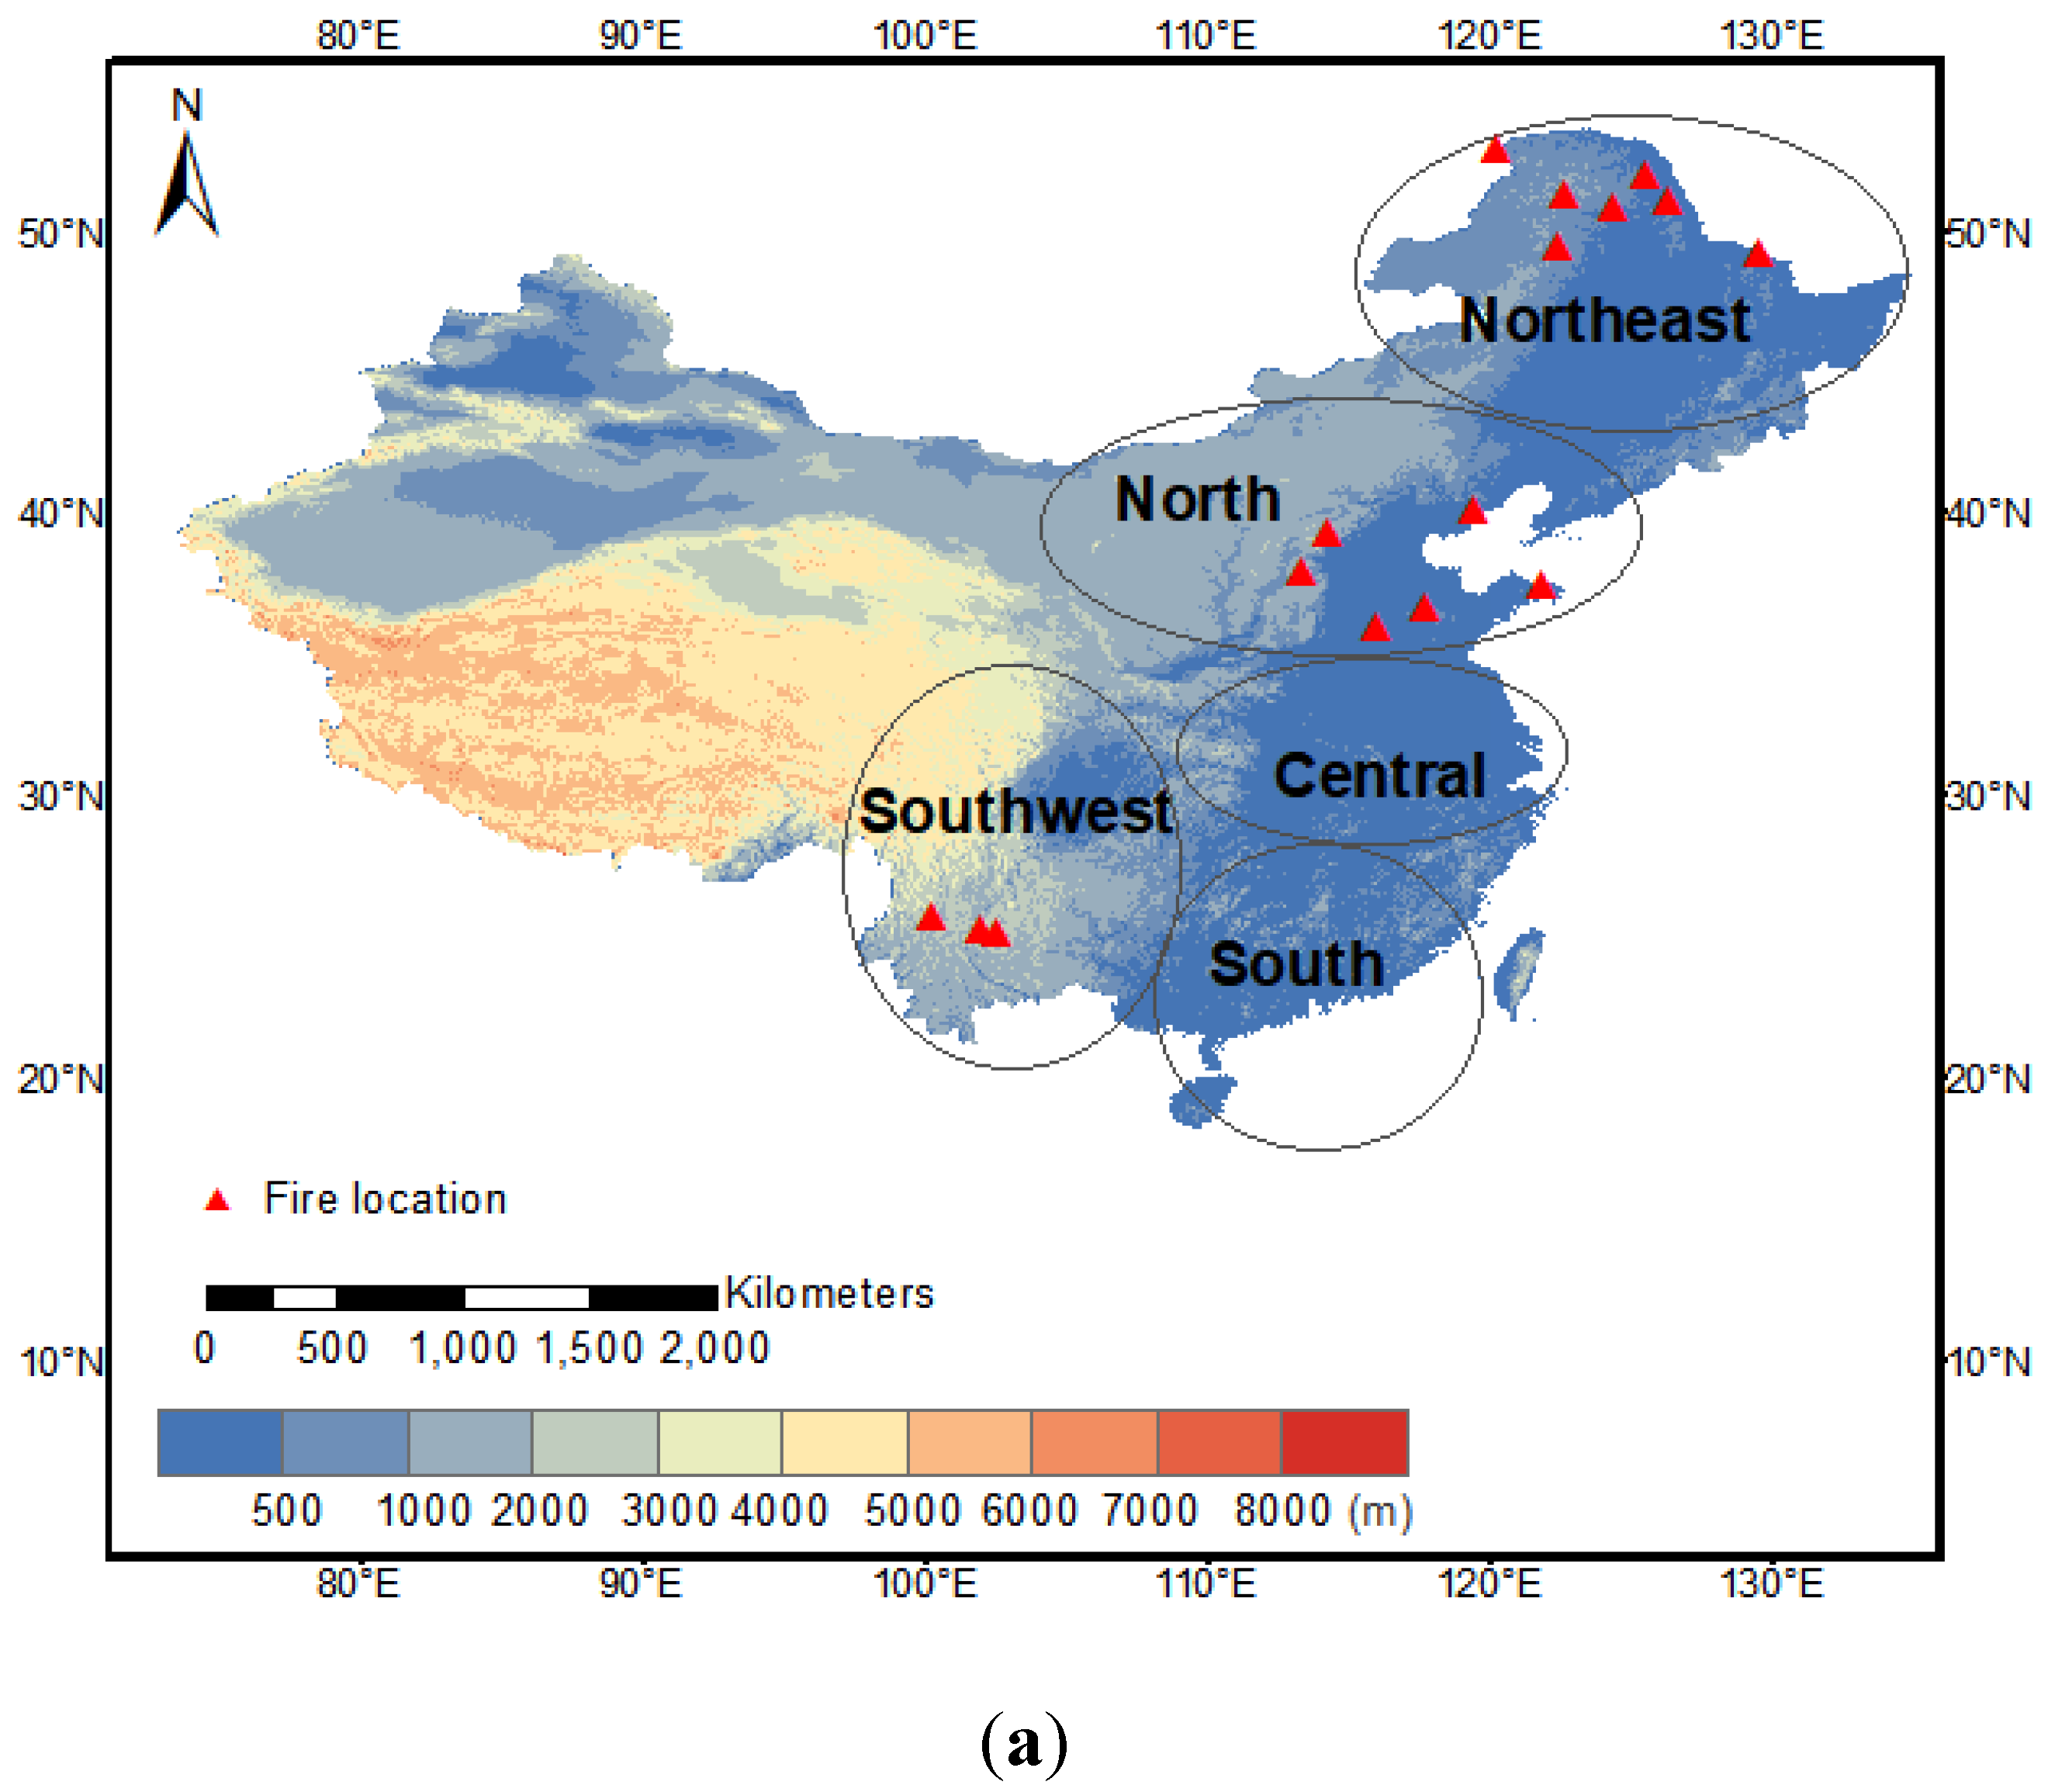
2.1. Study Area
2.2. Fire Cases
2.3. Smoke Modeling
3. Results
3.1. Fire Cases in Northeast China
3.2. Fire Cases in North China
3.3. Fire Cases in Southwest China
3.4. Discussion
4. Conclusions
Author Contributions
Funding
Acknowledgments
Conflicts of Interest
Appendix A


References
- CSIRO. The 2019-20 Bushfires: A CSIRO Explainer. 2020. Available online: https://www.csiro.au/en/Research/Environment/Extreme-Events/Bushfire/preparing-for-climate-change/2019-20-bushfires-explainer (accessed on 2 September 2020).
- Richards, L.; Brew, N.; Smith, L. 2019–20 Australian bushfires-frequently asked questions: A quick guide. Res. Pap. Ser. 2020, 20, 12. [Google Scholar]
- Molina-Terrén, D.M.; Xanthopoulos, G.; Diakakis, M.; Ribeiro, L.; Caballero, D.; Delogu, G.M.; Viegas, D.X.; Silva, C.A.; Cardil, A. Analysis of forest fire fatalities in Southern Europe: Spain, Portugal, Greece and Sardinia (Italy). Int. J. Wildland Fire 2019, 28, 85–98. [Google Scholar] [CrossRef] [Green Version]
- Zou, Y.F.; O’Neill, S.M.; Larkin, N.K.; Alvarado, E.C.; Solomon, R.; Mass, C.; Liu, Y.; Odman, M.T.; Shen, H. Machine learning-based integration of high-resolution wildfire smoke simulations and observations for regional health impact assessment. Int. J. Environ. Res. Public Health 2019, 16, 2137. [Google Scholar] [CrossRef] [PubMed] [Green Version]
- Lizundia-Loiola, J.; Pettinari, M.L.; Chuvieco, E. Temporal Anomalies in Burned Area Trends: Satellite Estimations of the Amazonian 2019 Fire Crisis. Remote Sens. 2020, 12, 151. [Google Scholar] [CrossRef] [Green Version]
- Turco, M.; Jerez, S.; Augusto, S.; Tarín-Carrasco, P.; Ratola, N.; Jiménez-Guerrero, P.; Trigo, R.M. Climate drivers of the 2017 devastating fires in Portugal. Sci. Rep. 2019, 9, 13886. [Google Scholar] [CrossRef] [PubMed]
- Kim, J.S.; Kug, J.S.; Jeong, S.J.; Park, H.; Schaepman-Strub, G. Extensive fires in southeastern Siberian permafrost linked to preceding Arctic Oscillation. Sci. Adv. 2020, 6, eaax3308. [Google Scholar] [CrossRef] [PubMed] [Green Version]
- Giglio, L.; Randerson, J.T.; van der Werf, G.R. Analysis of daily, monthly, and annual burned area using the fourth-generation global fire emissions database (GFED4). J. Geophys. Res. Biogeosci. 2013, 118, 317–328. [Google Scholar] [CrossRef] [Green Version]
- IUFRO. Global Fire Challenges in a Warming World; International Union of Forest Research Organizations: Vienna, Austria, 2018. [Google Scholar]
- Urbanski, S. Wildland fire emissions, carbon, and climate: Emission factors. For. Ecol. Manag. 2014, 317, 51–60. [Google Scholar] [CrossRef]
- Anenberg, S.C.; Horowitz, L.W.; Tong, D.Q.; West, J.J. An estimate of the global burden of anthropogenic ozone and fine particulate matter on premature human mortality using atmospheric modeling. Environ. Health Perspect. 2010, 118, 1189–1195. [Google Scholar] [CrossRef]
- McKenzie, D.; Shankar, U.; Keane, R.E.; Stavros, E.N.; Heilman, W.E.; Fox, D.G.; Riebau, A.C. Smoke consequences of new wildfire regimes driven by climate change. Earth’s Future 2014, 2, 35–59. [Google Scholar] [CrossRef]
- Koplitz, S.N.; Mickley, L.J.; Marlier, M.E.; Buonocore, J.J.; Kim, P.S.; Liu, T.J.; Sulprizio, M.P.; DeFries, R.S.; Jacob, D.J.; Schwartz, J. Public health impacts of the severe haze in Equatorial Asia in September–October 2015: Demonstration of a new framework for informing fire management strategies to reduce downwind smoke exposure. Environ. Res. Lett. 2016, 11, 094023. [Google Scholar] [CrossRef]
- O’Neill, S.; Urbanski, S.; Goodrick, S.; Larkin, S. Smoke plumes: Emissions and effects. Fire Manag. Today 2017, 75, 10–15. [Google Scholar]
- Vaidyanathan, A.; Yip, F.; Garbe, P. Developing an online tool for identifying at-risk populations to wildfire smoke hazards. Sci. Total Environ. 2018, 619, 376–383. [Google Scholar] [CrossRef]
- Liu, Y.; Achtemeier, G.L.; Goodrick, S.L.; Jackson, W.A. Important parameters for smoke plume rise simulation with Daysmoke. Atmos. Pollut. Res. 2010, 1, 250–259. [Google Scholar] [CrossRef] [Green Version]
- Urbanski, S.P.; Hao, W.M.; Nordgren, B. The wildland fire emission inventory: Western United States emission estimates and an evaluation of uncertainty. Atmos. Chem. Phys. 2011, 11, 12973–13000. [Google Scholar] [CrossRef] [Green Version]
- Song, C.B.; Wu, L.; Xie, Y.C.; He, J.J.; Chen, X.; Wang, T.; Lin, Y.C.; Jin, T.S.; Wang, A.X.; Liu, Y.; et al. Air pollution in China: Status and spatiotemporal variations. Environ. Pollut. 2017, 227, 334–337. [Google Scholar] [CrossRef] [PubMed]
- Giannadaki, D.; Lelieveld, J.; Pozzer, A. Implementing the US air quality standard for PM2.5 worldwide can prevent millions of premature deaths per year. Environ. Health 2016, 15, 88. [Google Scholar]
- Zhou, M.G.; He, G.J.; Fan, M.Y.; Wang, Z.X. Smog episodes, fine particulate pollution and mortality in China. Environ. Res. 2015, 136, 396–404. [Google Scholar] [CrossRef]
- Zhu, T. Air Pollution and Control Air pollution in China: Scientific challenges and policy implications. Natl. Sci. Rev. 2017, 4, 800. [Google Scholar] [CrossRef] [Green Version]
- Cao, G.L.; Zhang, X.Y.; Gong, S.L.; An, X.Q.; Wang, Y.Q. Emission inventories of primary particles and pollutant gases for China. Chin. Sci. Bull. 2011, 56, 781–788. [Google Scholar] [CrossRef] [Green Version]
- Zhang, L.B.; Liu, Y.Q.; Hao, L. Contributions of open crop straw burning emissions to PM2.5 concentrations in China. Environ. Res. Lett. 2016, 11, 014014. [Google Scholar] [CrossRef]
- Tian, X.R.; Zhao, F.J.; Shu, L.F.; Wang, M.Y. Distribution characteristics and the influence factors of forest fires in China. For. Ecol. Manag. 2013, 310, 460–467. [Google Scholar] [CrossRef]
- Zhao, F.J.; Liu, Y.Q. Atmospheric circulation patterns associated with wildfires in the monsoon regions of China. Geophys. Res. Lett. 2019, 46, 4873–4882. [Google Scholar] [CrossRef] [Green Version]
- Heilman, W.E.; Liu, Y.Q.; Urbanski, S.; Kovalev, V.; Mickler, R. Wildland fire emissions, carbon, and climate: Plume rise, atmospheric transport, and chemistry processes. For. Ecol. Manag. 2014, 317, 70–79. [Google Scholar] [CrossRef]
- Ding, Y.H. Monsoons over China; Atmospheric and Oceanographic Sciences Library 16; Springer: Dordrecht, The Netherlands, 1994; 420p. [Google Scholar]
- Encyclopædia Britannica, Inc. Population Density of China. Available online: https://kids.britannica.com/students/assembly/view/143477 (accessed on 2 September 2020).
- Niu, R.Y.; Zhai, P.M. Study on forest fire danger over Northern China during the recent 50 years. Clim. Chang. 2012, 111, 723–736. [Google Scholar] [CrossRef]
- Yi, K.P.; Bao, Y.L.; Zhang, J.Q. Spatial distribution and temporal variability of open fire in China. Int. J. Wildland Fire 2017, 26, 122–135. [Google Scholar] [CrossRef] [Green Version]
- Yi, K.P.; Bao, Y.L. Estimates of wildfire emissions in boreal forests of China. Forests 2016, 7, 158. [Google Scholar] [CrossRef] [Green Version]
- Wang, W.J.; Zhang, Q.X.; Luo, J.; Zhao, R.R.; Zhang, Y.M. Estimation of Forest Fire Emissions in Southwest China from 2013 to 2017. Atmosphere 2020, 11, 15. [Google Scholar] [CrossRef] [Green Version]
- Global Map Data Archives. Available online: https://globalmaps.github.io (accessed on 2 September 2020).
- Kanamitsu, M.; Ebisuzaki, W.; Woollen, J.; Yang, S.K.; Hnilo, J.J.; Fiorino, M.; Potter, G.L. NCEP-DOE AMIP-II Reanalysis (R-2). Bull. Am. Meteorol. Soc. 2020, 83, 1631–1643. [Google Scholar] [CrossRef]
- China National Forest Fire Statistical System. Available online: http://60.205.191.66/FireReport/Account/LogOn?returnUrl=%2FFireReport%2F (accessed on 2 September 2020).
- Davies, D.K.; Ilavajhala, S.; Wong, M.M.; Justice, C.O. Fire Information for Resource Management System: Archiving and Distributing MODIS Active Fire Data. IEEE. Trans. Geosci. Remote Sens. 2009, 47, 72–79. [Google Scholar] [CrossRef]
- Stein, A.F.; Draxler, R.R.; Rolph, G.D.; Stunder, B.J.B.; Cohen, M.D.; Ngan, F. NOAA’s HYSPLIT atmospheric transport and dispersion modeling system. Bull. Am. Meteorol. Soc. 2015, 96, 2059–2077. [Google Scholar] [CrossRef]
- Briggs, G.A. Plume Rise; USAEC Critical Review Series, TID-25075; National Technical Information Service: Springfield, VA, USA, 1969; 81p.
- Freitas, S.R.; Longo, K.M.; Chatfield, R.; Latham, D.; Silva, M.A.F.; Andreae, E.; Santos, J.C.; Gielow, R.; Carvalho, J.A., Jr. Including the sub-grid scale plume rise of vegetation fires in low resolution atmospheric transport models. Atoms. Chem. Phys. 2007, 7, 3385–3398. [Google Scholar] [CrossRef] [Green Version]
- Baker, K.R.; Woody, M.C.; Valin, L.; Szykman, J.; Yates, E.L.; Iraci, L.T.; Choi, H.D.; Soja, A.J.; Koplitz, S.N.; Zhou, L.; et al. Photochemical model evaluation of 2013 California wild fire air quality impacts using surface, aircraft, and satellite data. Sci. Total Environ. 2018, 637, 1137–1149. [Google Scholar] [CrossRef]
- Anderson, G.K.; Sandberg, D.V.; Norheim, R.A. Fire Emission Production Simulator (FEPS) User’s Guide (Version 1.0). 2004. Available online: https://www.fs.fed.us/pnw/fera/feps/FEPS_users_guide.pdf (accessed on 2 September 2020).
- Larkin, N.K.; O’Neill, S.M.; Solomon, R.; Raffuse, S.; Strand, T.; Sullivan, D.; Krull, C.; Rorig, M.; Peterson, J.; Ferguson, S.A. The BlueSky smoke modeling framework. Int. J. Wildland Fire 2009, 18, 906–920. [Google Scholar] [CrossRef] [Green Version]
- Goodrick, S.L.; Achtemeier, G.L.; Larkin, N.K.; Liu, Y.; Strand, T.M. Modelling smoke transport from wildland fire: A review. Int. J. Wildland Fire 2013, 22, 83–94. [Google Scholar] [CrossRef]
- Liu, Y.; Kochanski, A.; Baker, K.R.; Mell, W.; Linn, R.; Paugam, R.; Mandel, J.; Fournier, A.; Jenkins, M.A.; Goodrick, S.; et al. Fire behavior and smoke modelling: Model improvement and measurement needs for next-generation smoke research and forecasting systems. Int. J. Wildland Fire 2019, 28, 570–588. [Google Scholar] [CrossRef] [Green Version]
- Zhao, F.J.; Liu, Y.Q.; Goodrick, S.; Hornsby, B.; Schardt, J. The contribution of duff consumption to fire emissions and air pollution of the Rough Ridge Fire. Int. J. Wildland Fire 2019, 28, 993–1004. [Google Scholar] [CrossRef]
- Randerson, J.T.; Chen, Y.; van der Werf, G.R.; Rogers, B.M.; Morton, D.C. Global burned area and biomass burning emissions from small fires. J. Geophys. Res. Biogeosci. 2012, 117, G04012. [Google Scholar] [CrossRef]
- Zhao, F.J.; Liu, Y.Q.; Shu, L.F. Change in the fire season pattern from bimodal to unimodal under climate change: The case of Daxing’anling in Northeast China. Agric. For. Meteorol. 2020, 291, 108075. [Google Scholar] [CrossRef]
- US Environmental Protection Agency, The National Ambient Air Quality Standards for Particle Pollution – Revised Air Quality Standards for Particle Pollution and Updates to the Air Quality Index (AQI). Available online: https://www.epa.gov/sites/production/files/2016-04/documents/2012_aqi_factsheet.pdf (accessed on 2 September 2020).
- American Meteorological Society, Glossary of Meteorology. Available online: http://glossary.ametsoc.org/wiki/Regional_air_pollution (accessed on 2 September 2020).
- China Historical Air Quality Data. Available online: https://www.aqistudy.cn/historydata (accessed on 2 September 2020).
- Zhao, F.J.; Shu, L.F.; Di, X.Y.; Tian, X.R.; Wang, M.Y. Changes in the occurring date of forest fires in the Inner Mongolia Daxing’anling forest region under global warming. Sci. Silvae Sin. 2009, 45, 166–172. [Google Scholar]
- Chang, Y.; He, H.S.; Hu, Y.M.; Bu, R.C.; Li, X.Z. Historic and current fire regimes in the Great Xing’an Mountains, northeastern China: Implications for long-term forest management. For. Ecol. Manag. 2008, 254, 445–453. [Google Scholar] [CrossRef]
- Tanimoto, H.; Ikeda, K. Exceedances of air quality standard level of PM2.5 in Japan caused by Siberian wildfires. Environ. Res. Lett. 2015, 10, 105001. [Google Scholar]


| Region | No. | Name | Location | Period | Burned Area (km2) | GFED Fuel Type | |
|---|---|---|---|---|---|---|---|
| Lon(° E) | Lat(° N) | ||||||
| Northeast | 1 | Shibazhan | 125.78 | 52.10 | 5/17–26, 2003 | 3192.53 | Boreal forest |
| 2 | Wuerqihan | 122.66 | 49.54 | 5/25–6/1, 2006 | 299.56 | Boreal forest | |
| 3 | Huzhong | 122.83 | 51.41 | 6/26–7/3, 2010 | 95.75 | Boreal forest | |
| 4 | Yichun | 129.81 | 49.26 | 10/3–6, 2007 | 175.70 | Boreal forest | |
| 5 | Huma | 126.55 | 51.13 | 10/23–30, 2005 | 1087.30 | Boreal forest | |
| 6 | Songling | 124.63 | 50.88 | 5/22–6/2, 2006 | 2211.29 | Boreal forest | |
| 7 | Yimuhe | 120.49 | 53.03 | 5/31–6/3, 2006 | 60.06 | Boreal forest | |
| North | 8 | Baoding | 114.39 | 39.30 | 4/6–8, 2014 | 4.50 | Temperate forest |
| 9 | Yangquan | 113.46 | 37.90 | 4/29–5/1, 2011 | 22.49 | Temperate forest | |
| 10 | Weihai | 122.12 | 37.49 | 5/29–31, 2014 | 1.20 | Temperate forest | |
| 11 | Funing | 119.63 | 40.13 | 4/12–18, 2011 | 10.67 | Temperate forest | |
| 12 | Laiwu | 117.93 | 36.62 | 4/16–19, 2011 | 3.08 | Temperate forest | |
| 13 | Jinan | 116.19 | 35.98 | 4/18–20, 2011 | 4.58 | Temperate forest | |
| Southwest | 14 | Chuxiong | 102.04 | 25.22 | 4/23–28, 2013 | 10.13 | Temperate forest |
| 15 | Anning | 102.68 | 25.06 | 3/29–4/7, 2006 | 18.49 | Temperate forest | |
| 16 | Dali | 100.32 | 25.70 | 3/8–9, 2007 | 2.52 | Temperate forest | |
| Reg | No. | Name | Site Relative to Cities | Transport Direction | Air Quality Impact | Population Density | |
|---|---|---|---|---|---|---|---|
| Local | Regional | ||||||
| Northeast | 1 | Shibazhan | north | southeast | hazardous | hazardous | dense |
| 2 | Wuerqihan | north | East, north | unhealthy | good | sparse | |
| 3 | Huzhong | north | mainly north | hazardous | unhealthy (Rus) | sparse | |
| 4 | Yichun | north | east, south | hazardous | unhealthy (Rus) | moderate | |
| 5 | Huma | north | east, southeast | hazardous | hazardous (Rus) | moderate | |
| 6 | Songling | north | north, northeast | hazardous | hazardous (Rus) | sparse | |
| 7 | Yimuhe | north | north | very unhealthy | very unhealthy (Rus) | sparse | |
| North | 8 | Baoding | west | east | unhealthy | moderate | dense |
| 9 | Yangquan | west | southeast | good | good | dense * | |
| 10 | Weihai | east | northeast | moderate | moderate | dense * | |
| 11 | Funing | surrounding | east, south | good | good | dense * | |
| 12 | Laiwu | surrounding | northeast, south | good | good | dense * | |
| 13 | Jinan | surrounding | northeast, south | good | good | dense * | |
| Southwest | 14 | Chuxiong | west | east | unhealthy (S) | good | dense |
| 15 | Anning | west | northeast | unhealthy (S) | good | dense | |
| 16 | Dali | west | northeast | good | good | dense * | |
© 2020 by the authors. Licensee MDPI, Basel, Switzerland. This article is an open access article distributed under the terms and conditions of the Creative Commons Attribution (CC BY) license (http://creativecommons.org/licenses/by/4.0/).
Share and Cite
Zhao, F.; Liu, Y.; Shu, L.; Zhang, Q. Wildfire Smoke Transport and Air Quality Impacts in Different Regions of China. Atmosphere 2020, 11, 941. https://doi.org/10.3390/atmos11090941
Zhao F, Liu Y, Shu L, Zhang Q. Wildfire Smoke Transport and Air Quality Impacts in Different Regions of China. Atmosphere. 2020; 11(9):941. https://doi.org/10.3390/atmos11090941
Chicago/Turabian StyleZhao, Fengjun, Yongqiang Liu, Lifu Shu, and Qi Zhang. 2020. "Wildfire Smoke Transport and Air Quality Impacts in Different Regions of China" Atmosphere 11, no. 9: 941. https://doi.org/10.3390/atmos11090941