Article

Performance of Forecasts of Hurricanes with and without Upper-Level Troughs over the Mid-Latitudes

1
Kitami Institute of Technology, Kitami 090-8507, Japan
2
Application Laboratory, Japan Agency for Marine-Earth Science and Technology, Yokohama 236-0001, Japan
3
National Institute of Polar Research, Tachikawa 190-8518, Japan
4
SOKENDAI, Graduate University for Advanced Studies, Hayama 240-0193, Japan
*
Author to whom correspondence should be addressed.
Atmosphere 2020, 11(7), 702; https://doi.org/10.3390/atmos11070702
Submission received: 13 May 2020 / Revised: 11 June 2020 / Accepted: 26 June 2020 / Published: 1 July 2020
(This article belongs to the Special Issue Modeling and Data Assimilation for Tropical Cyclone Forecasts)

Abstract

:
We investigated the accuracy of operational medium-range ensemble forecasts for 29 Atlantic hurricanes between 2007 and 2019. Upper-level troughs with strong wind promoted northward movement of hurricanes over the mid-latitudes. For hurricanes with upper-level troughs, relatively large errors in the prediction of troughs result in large ensemble spreads, which result in failure to forecast hurricane track. In contrast, for hurricanes without upper-level troughs, mean central position errors are relatively small in all operational forecasts because of the absence of upper-level strong wind around troughs over the mid-latitudes. Hurricane Irma in September 2017 was accompanied by upper-level strong wind around a trough; errors and ensemble spreads for the predicted upper-level trough are small, contributing to smaller errors and small ensemble spreads in the predicted tracks of Irma. Our observing system experiment reveals that inclusion of additional Arctic radiosonde observation data obtained from research vessel Mirai in 2017 improves error and ensemble spread in upper-level trough with strong wind at initial time for forecast, increasing the accuracy of the forecast of the track of Irma in 2017.

1. Introduction

Accurate prediction of tropical cyclones (TCs) with heavy rain and strong winds is crucial to reducing human casualties and socioeconomic damages. In the early 2000s, various operational forecast centers extended the skillful forecast period of a TC track to 120 h [1,2] as a result of ongoing development of atmospheric numerical models and application of the latest models to TC forecasts [3,4,5]. Linear regression analysis shows that central position error of a 120-h forecast has reduced by 17.5 km yr−1 between 1991 and 2013 [6]. Meanwhile, position error of TCs in 120-h forecasts in recent years is equivalent to that of 72-h forecasts in the early 1990s [2,6]. However, in some cases, prediction error of TC positions remains large, implying that improvements in other factors are necessary to further reduce errors in TC track forecasts [6].
Reducing uncertainty in the analysis data that are used as initial fields in operational weather forecasts is one of the effective ways of improving the accuracy of TC forecasts. This can be achieved by increasing the amount of observation data that is included in the analysis data, for example, through the incorporation of satellite observations with higher resolution and frequency [7] and dropsonde observations conducted around and near TCs over the Pacific (e.g., Dropwindsonde Observations for Typhoon Surveillance near Taiwan [3,8], the Observing System Research and Predictability Experiment—Pacific Asian Regional Campaign [9,10]) and Atlantic Oceans (e.g., Synoptic surveillance missions of a Gulfstream IV-SP jet aircraft [11]). Previous observing system experiments (OSEs) have revealed that additional dropsonde observations near TC centers, where data are difficult to obtain, have greatly contributed to the reduction of errors in TC track forecasts [3,9,10,12].
These data were collected near TCs to reduce uncertainty of the initial fields used in operational weather forecasts. Uncertainty in the initial conditions of regions far from TCs can also influence TC track forecasts. Observations that are additional to those from the sparse Arctic observational network have had a large impact on the accuracy of weather forecasts [13]. They have reduced uncertainty in the tropopause over the Arctic Ocean at initial time [14,15], improving atmospheric circulation forecasts over the high- [16,17] and mid-latitudes [18,19]. Sato et al. [19] performed OSEs and showed that inclusion of Arctic radiosonde observation data enhanced forecasts of TC tracks over the mid-latitudes by reducing uncertainty in the upper-level troughs over the Northern Hemisphere. Studies show that TC tracks can be sensitive to movement of troughs originating from the Arctic [19,20], suggesting that additional Arctic radiosonde observations could improve hurricane forecasts.
Using The Interactive Grand Global Ensemble (TIGGE) datasets, previous studies have assessed the forecast skill of tropical cyclones over the mid-latitudes [21,22]. However, no study has yet compared the forecast skill of models from different operational forecast centers for hurricanes that move northward in response to upper-level atmospheric circulation over the mid-latitudes. In this study, we used TIGGE data to assess the skill of different operational forecast models to forecast hurricane tracks in response to upper-level troughs. Furthermore, we conducted data assimilation and forecast experiments to assess the impacts of the inclusion of radiosonde and dropsonde observation data obtained over areas with sparse observational networks on atmospheric circulations in the mid-latitudes.

2. Methods

2.1. Operational Forecast, Verified Reanalysis, and Observation Data

We compared the performance of medium-range ensemble forecast data from the European Centre for Medium-Range Weather Forecasts (ECMWF), the Japan Meteorological Agency (JMA), the US National Centers for Environmental Prediction (NCEP) and the UK Meteorological Office (UKMO). Atmospheric data at the surface and nine pressure levels (1000, 925, 800, 700, 500, 300, 250, 200, and 50 hPa) were obtained via TIGGE data portal; data from 2007 to 2019 and on a 0.5° horizontal grid were used [23]. Details of the models are presented in Table S1. The fifth generation ECMWF atmospheric reanalysis of the global climate (ERA5) is the successor to ERA-Interim, and was used as the reference product for atmospheric circulation [24,25]. We used the best track data (HURDAT2: https://www.nhc.noaa.gov/data/) of the National Oceanic and Atmospheric Administration (NOAA) National Hurricane Center (NHC) to determine observed hurricane positions. In the reanalysis data and forecast, hurricane tracks were calculated from the trajectory of the point of minimum pressure.

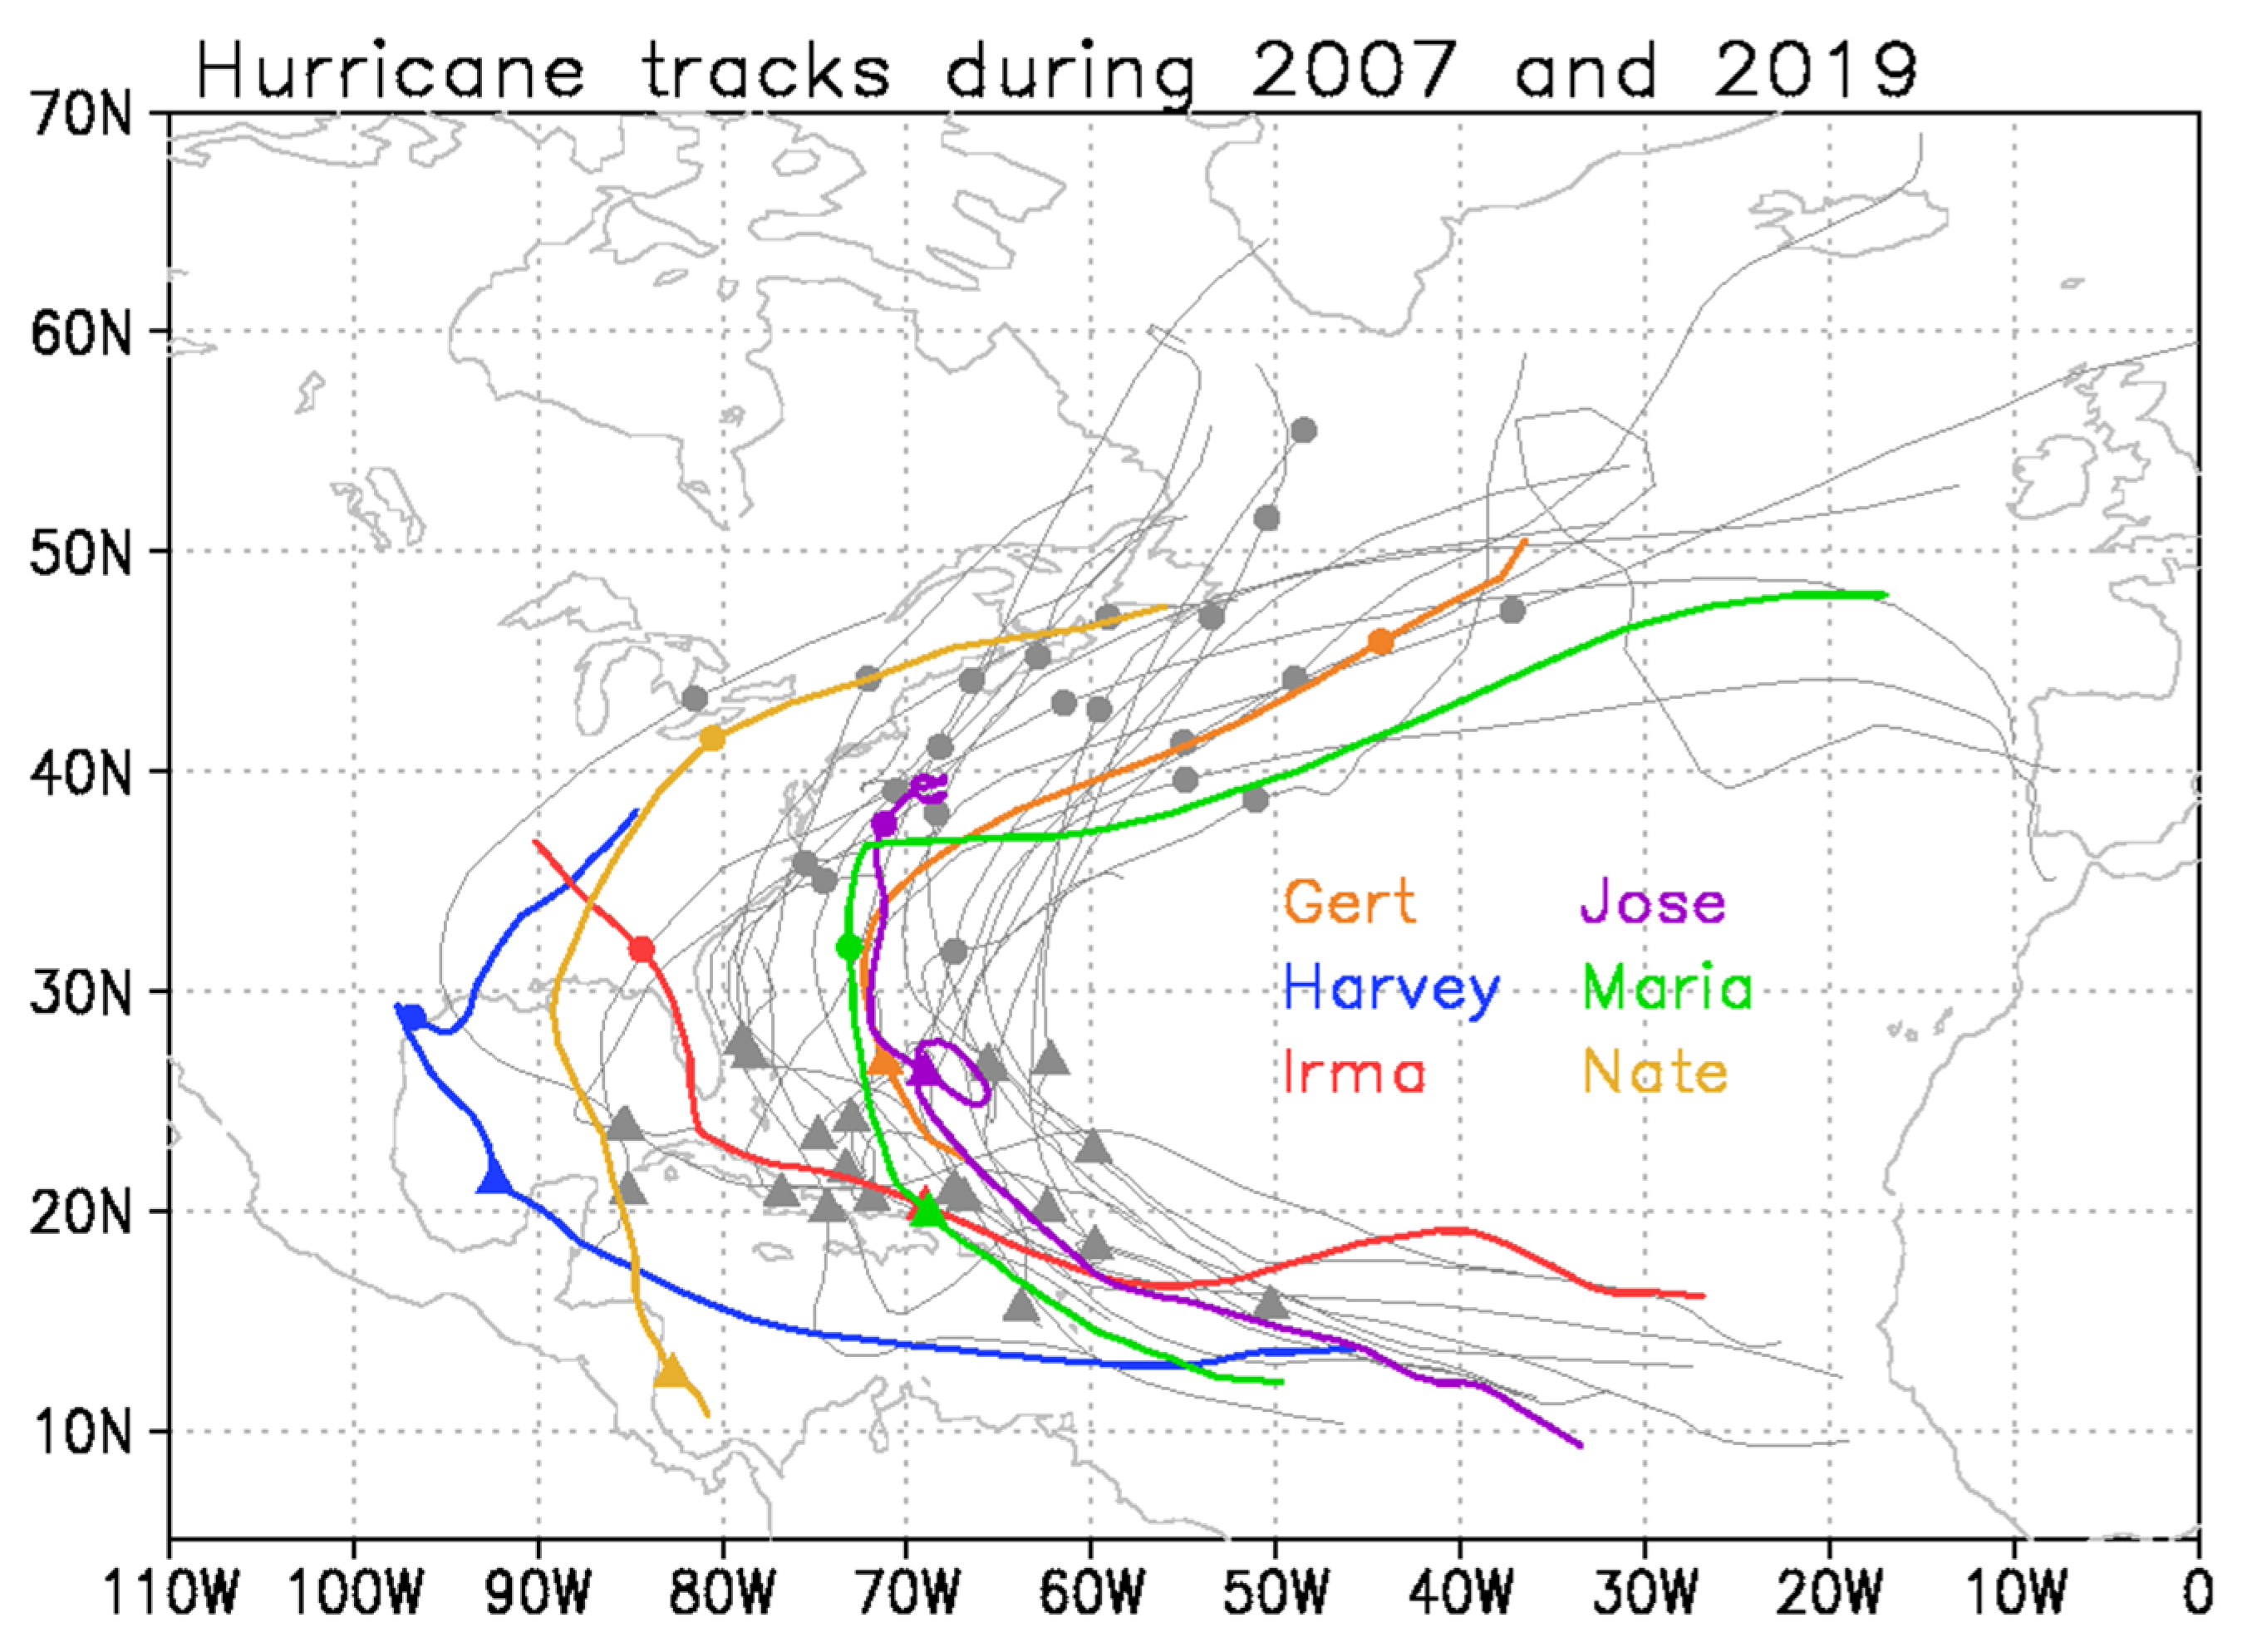
2.2. Atlantic Hurricanes That Moved Northward and Approached the US between 2007 and 2019

In this study, we focused on 29 Atlantic hurricanes that moved northward over the North Atlantic Ocean and approached or made landfall over the US between 2007 and 2019 (Figure 1). Details of these hurricanes, including their duration and name are shown in Table 1. Most of them formed near Africa and moved westward over the Atlantic Ocean. Some turned northward near the east coast of the US and reached the North Atlantic Ocean; others turned northward over the Gulf of Mexico and made landfall over the US. In contrast, several hurricanes were generated over the Caribbean Sea and made landfall over the US.
Between 2007 and 2019, the number of Atlantic hurricanes that moved northward and approached the eastern US was the highest in 2017 (Table 1). To investigate the relationship between upper-level atmospheric circulation and Atlantic hurricane positions, we studied six Atlantic hurricanes (Gert, Harvey, Irma, Jose, Maria, and Nate) that moved northward over the North Atlantic Ocean and approached or made landfall over the US in 2017 (colored tracks in Figure 1). Hurricane Nate was generated over the Caribbean Sea and made landfall over the US. The other five hurricanes formed near Africa and moved westward over the Atlantic Ocean. Two of them (Irma and Harvey) turned northward over the Gulf of Mexico, making landfall over the US. The remaining three (Gert, Jose, and Maria) turned northward near the east coast of the US, and traversed the North Atlantic Ocean without landing. In the cases of Gert, Irma, and Nate, upper-level troughs with strong winds exceeding 25 m·s−1 (averaged between the 500- and 300-hPa levels) extended above the western parts of the hurricanes over the mid-latitudes, influencing hurricane location and movement (Figure 2a,k and Figure S2k). In this study, Atlantic hurricanes that are influenced by upper-level strong winds are referred to as trough cases. Mid-latitude troughs over the western part of these hurricanes potentially favor extratropical transition [26]. Unlike Gert, Irma, and Nate, no upper-level troughs appeared in Harvey, Maria, and Jose over the mid-latitudes (Figure 2f and Figure S2a,f), suggesting that the movement and location of these hurricanes were unaffected by strong wind around troughs. Atlantic hurricanes without upper-level strong wind around troughs are referred to as no trough cases in this study.

2.3. Additional Observations in September 2017 and Experimental Design

Between 26 August and 22 September 2017, additional radiosonde observations were conducted over the Arctic Ocean from the Japanese Research Vessel (RV) Mirai (Figure S1). Over the Chukchi, Beaufort, and Bering Seas, observations were recorded every 6 h (0000, 0600, 1200, and 1800 UTC), yielding a total of 119 radiosonde observations. In addition, the 53rd Weather Reconnaissance Squadron of the U.S. Air Force Reserve Command and the NOAA Aircraft Operations Center conducted 721 dropsonde observations over the Atlantic Ocean. Data were transmitted via the Global Telecommunication System, and can be used to reduce uncertainty in the initial fields of numerical weather predictions (analysis data), improving atmospheric circulation forecasts.
To investigate the impact of assimilated observation data on atmospheric circulation forecasts, OSEs were conducted using our data assimilation system. We used an ensemble data assimilation (DA) system called ALEDAS2 [27], which comprises the atmospheric general circulation model for the Earth Simulator (AFES; [28,29]) and the local ensemble transform Kalman filter (LETKF; [30,31]). This DA system generates the AFES-LETKF experimental ensemble reanalysis version 2 (ALERA2) dataset; ALERA2 comprises 63-ensemble members, has a horizontal resolution of T119 (triangular truncation with truncation wave number 119, yielding a resolution of 1° × 1°) and L48 vertical levels (σ-level, up to ≈3 hPa). Like most reanalysis products, structures of synoptic and large-scale circulations in the troposphere and lower stratosphere are reproduced in ALERA2 [15,17,18,19,32,33]. Assimilated observations were adapted from the PrepBUFR Global Observation datasets of the NCEP, which are archived by the University Corporation for Atmospheric Research (UCAR). The NOAA daily Optimal Interpolation Sea Surface Temperature (OISST) version 2 dataset was used for ocean and sea ice boundary conditions [34]. In this study, we constructed three 63-member ensemble reanalysis datasets for forecasting experiments. The control dataset (CTL) is ALERA2 including the PrepBUFR global observation datasets; the OSEM dataset is the CTL dataset with additional radiosonde observations from RV Mirai removed; the OSEA dataset is the CTL dataset with dropsonde observations from aircrafts removed. The DA cycles, the so-called DA stream, are composed of repeated DA forecast–analysis cycles with different observations every 6 h between August and September 2017. Each analysis dataset has different DA streams. Therefore, these differences are accumulated in each stream, resulting in different analyzed fields in each DA stream. For the forecast experiments, AFES with horizontal resolution T239 (0.5° × 0.5°) and L48 vertical levels provides 63-member ensemble forecasts. Data from ALERA2 were regridded from T119 to T239 and used in the initial fields.

3. Results

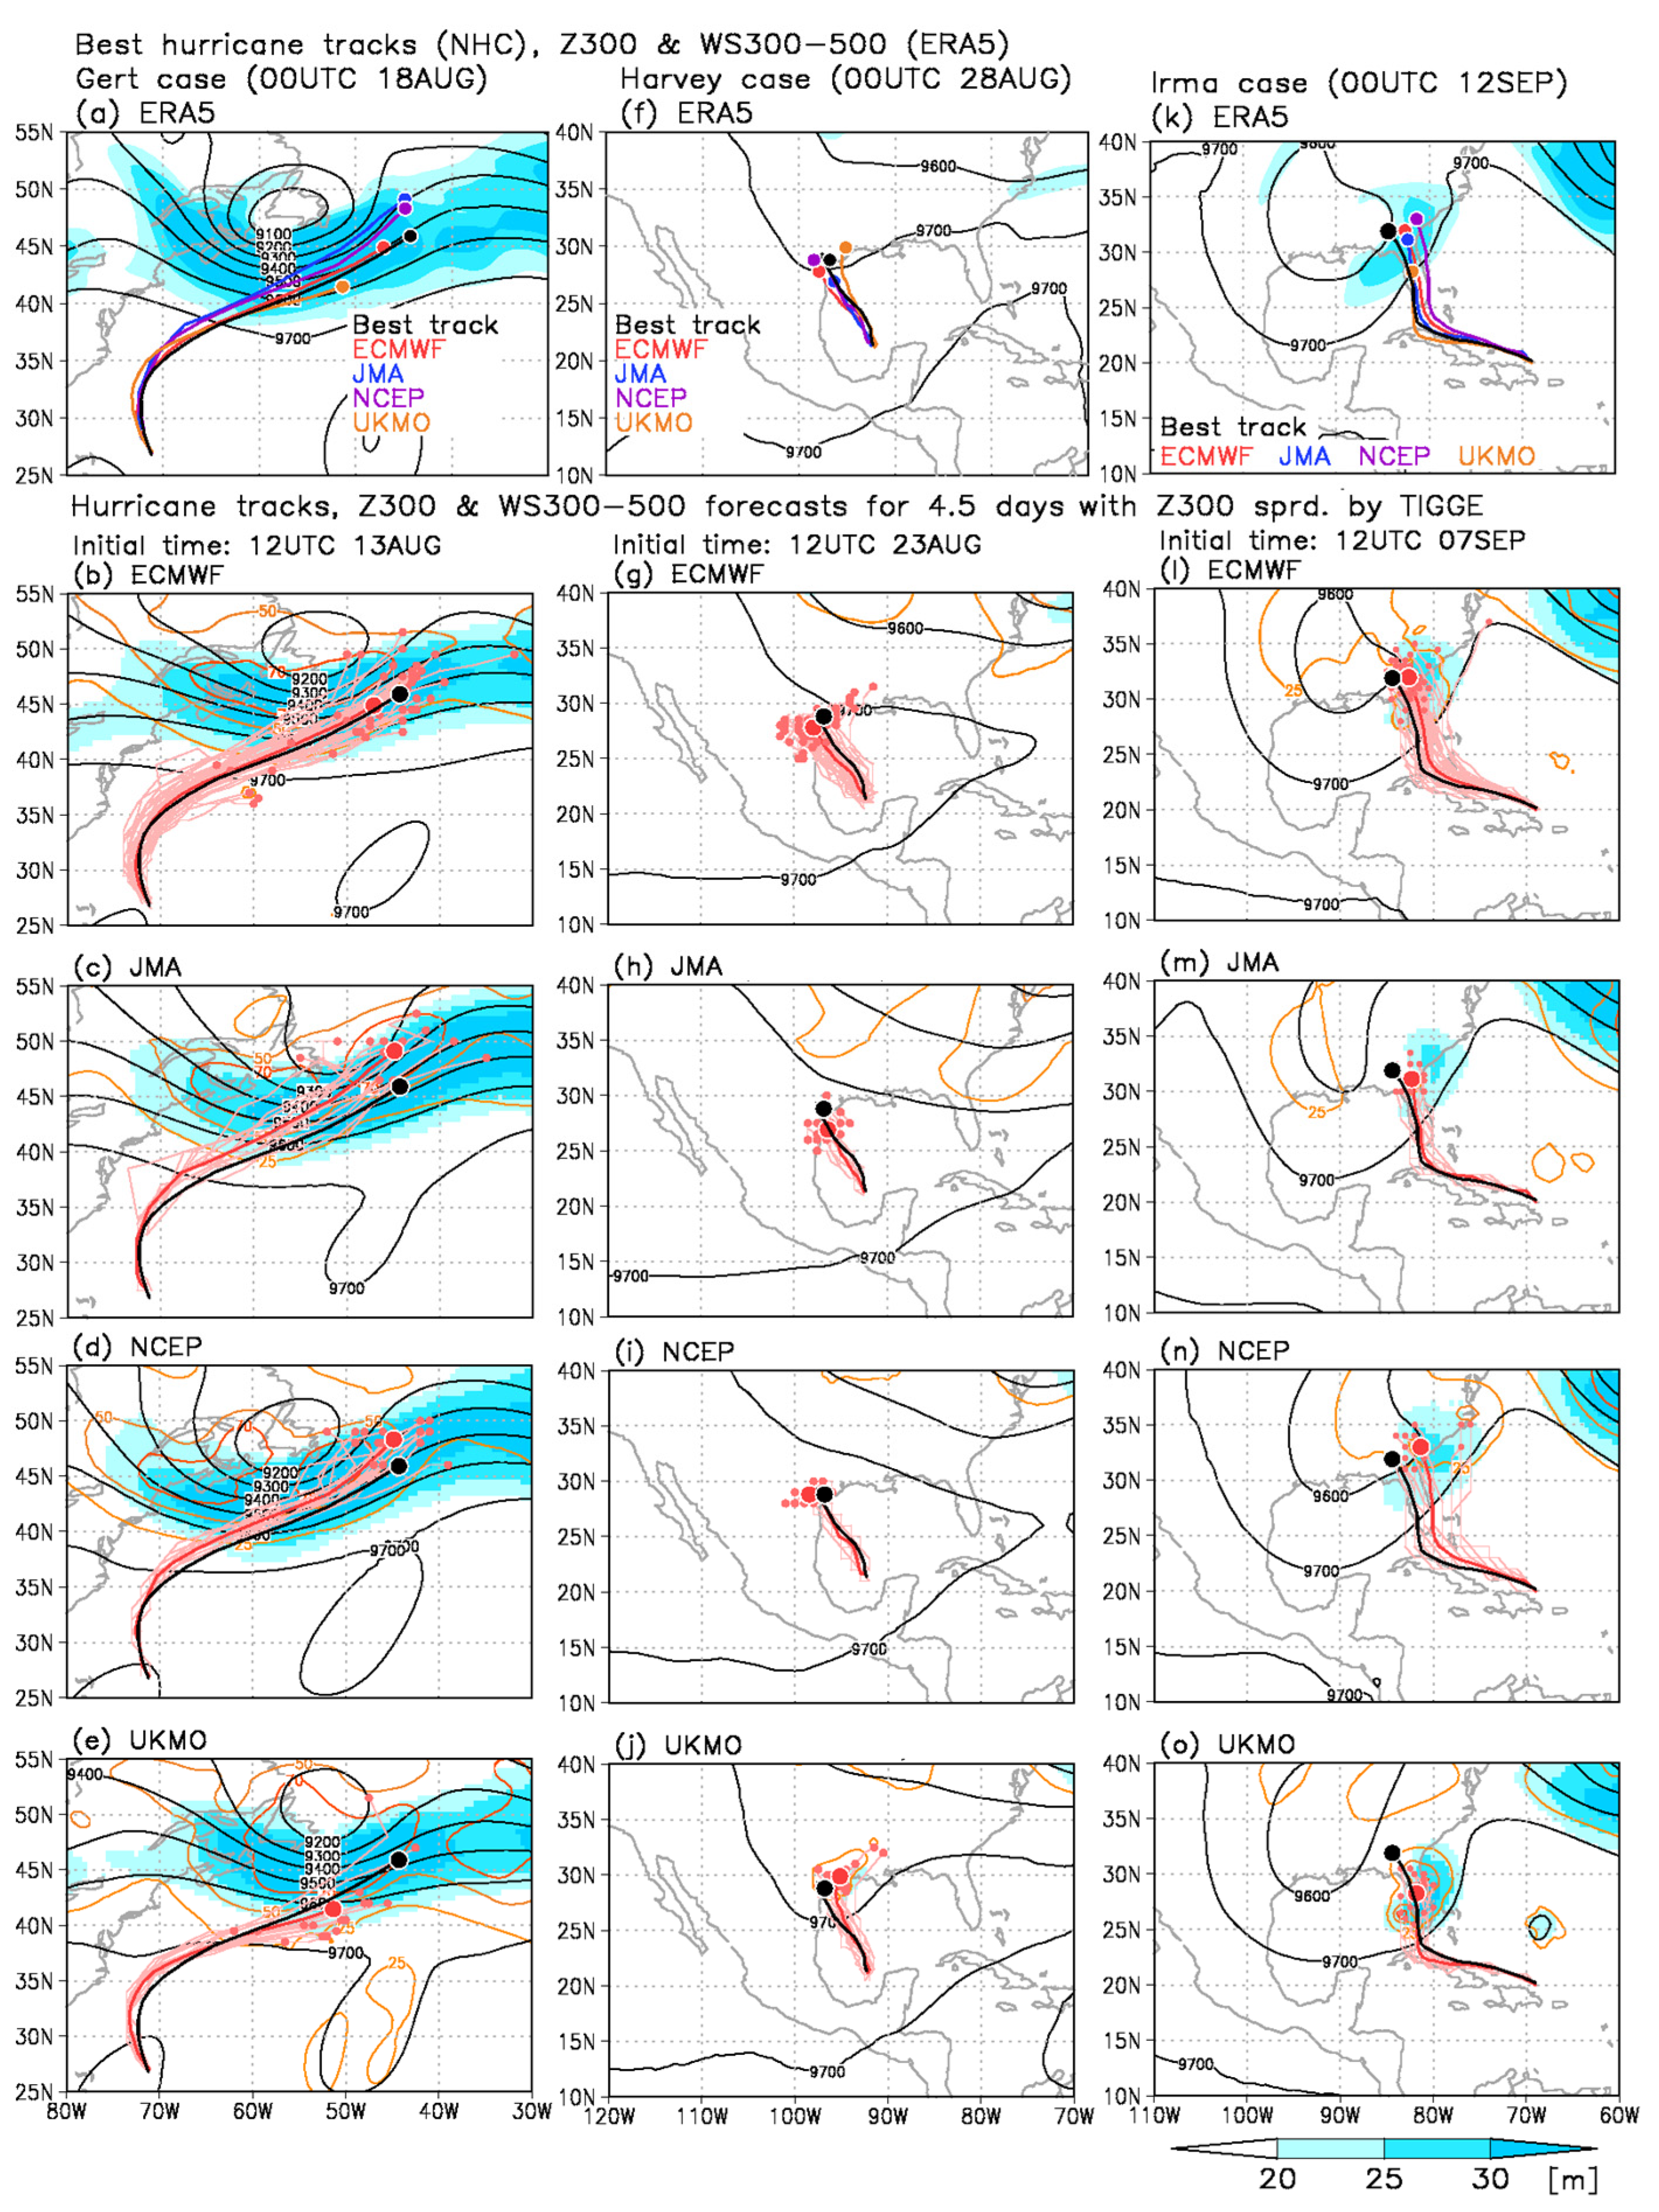
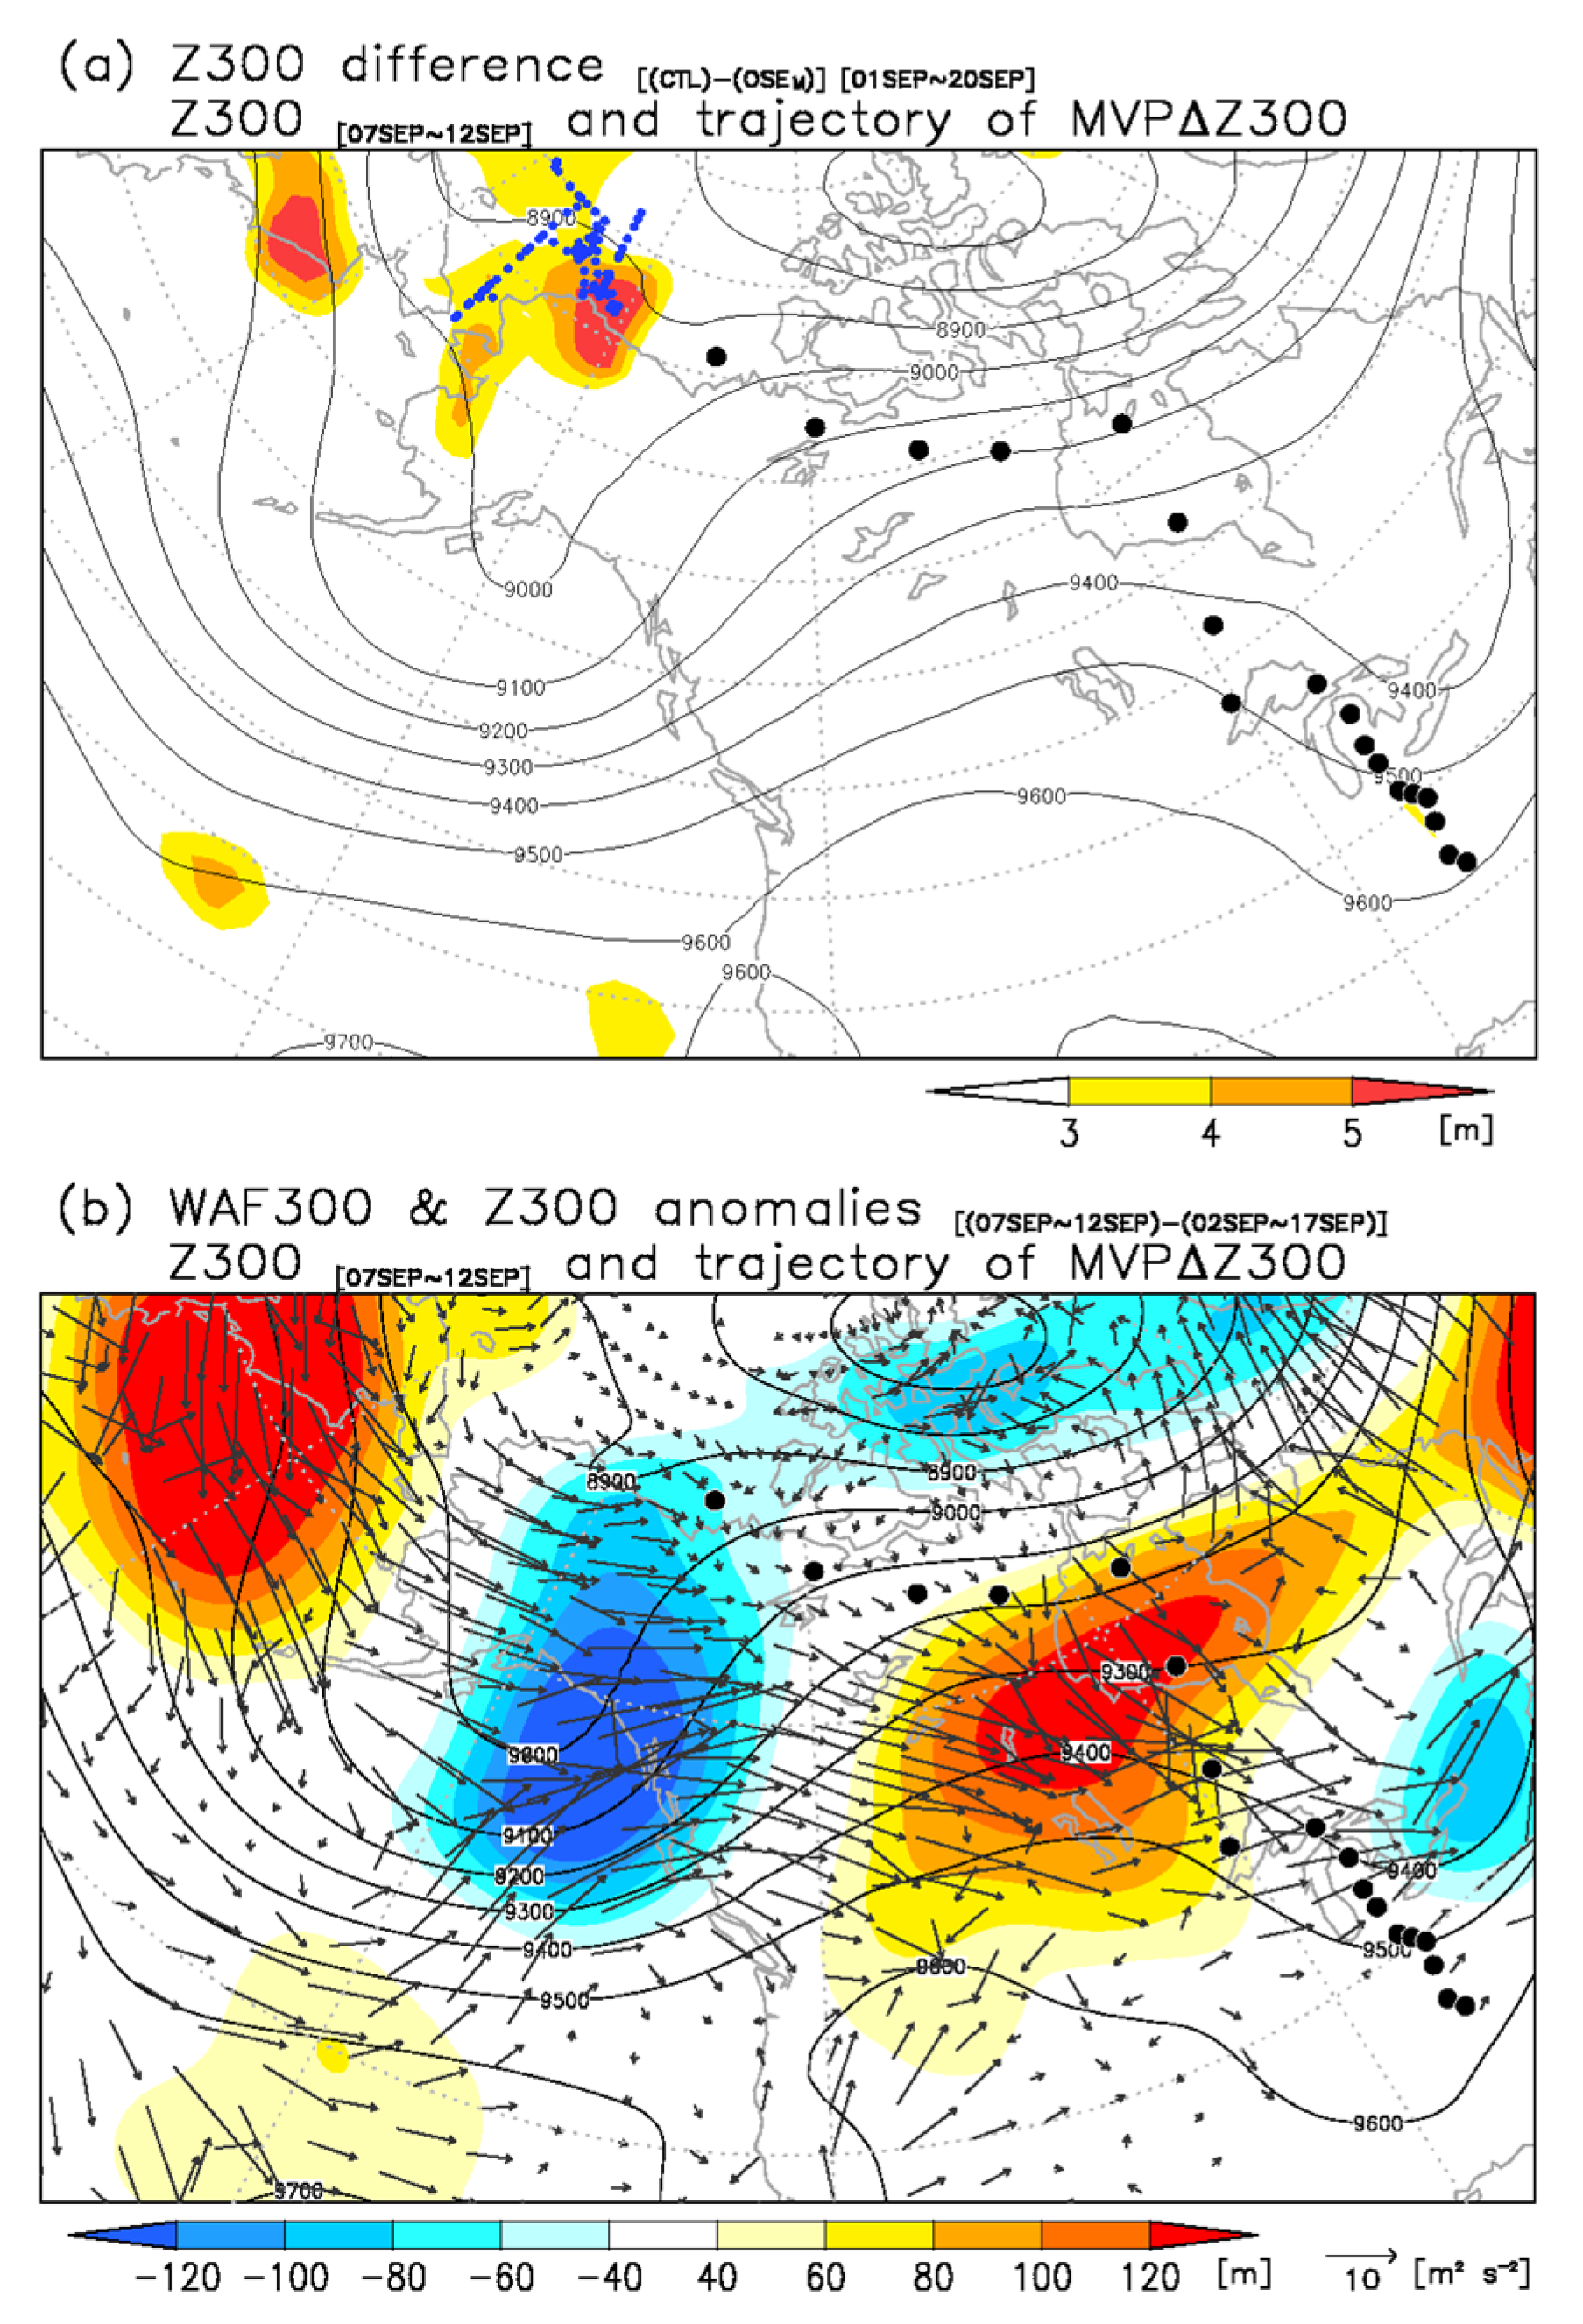
3.1. Influence of Upper-Level Trough Prediction on Hurricane Track Forecast

Figure 2 shows predicted ensemble mean upper-level wind speed (averaged between 300- and 500-hPa levels) and geopotential heights at 300 hPa (Z300) over a period of 4.5 days, tracks of Gert (a trough case), Harvey (a no trough case), and Irma (a trough case), and Z300 ensemble spreads in all four operational medium-range ensemble forecasts (ECMWF, JMA, NCEP, and UKMO).
In the case of Gert (trough case), Z300 ensemble spreads are large in all models near the upper-level trough (orange lines in Figure 2b–e). In three models (ECMWF, JMA, and UKMO), and especially in JMA and UKMO, the predicted upper-level trough is located to the east of the center of the trough in ERA5 (black lines in Figure 2a–d). Strong wind speeds are correctly predicted around the trough (shaded in Figure 2b–e), but ensemble spread and error in hurricane track are large in the ECMWF, JMA, and NCEP models. Compared with ERA5 data, the southern intrusion of the upper-level trough with strong wind in the UKMO model is weak, reducing the northward movement of Gert in the model (Figure 2a,e), resulting in predicted positions of Gert over 4.5 days to be further south than those obtained from the other three models (Figure 2b–e). These errors in location of the predicted upper-level trough lead to large errors in the forecasts of the track of Gert in all models. In the case of Nate (trough case, Figure S2k–o), upper-level troughs in all models are located to the north of the trough in ERA5, reducing the northward movement of Nate in the models. Large errors (deviations from ERA5) and ensemble spreads in the reproduction of the upper-level trough result in large errors and ensemble spread in forecasts of the track of Nate (Figure S2l–o). In both the JMA and UKMO models, Nate had disappeared from some ensemble members by forecast day 4.5 (Figure S2m,o).
In contrast, in the case of Harvey (no trough, Figure 2f–j), errors and ensemble spreads of Z300 are smaller than those in trough cases for all models (black and orange contours in Figure 2f–j). In addition, there is no error in upper-level wind, contributing to better forecasting of the track of Harvey (Figure 2g–j). Compared with trough cases, all models could reproduce hurricane position and Z300 of Jose and Maria (no trough cases) in ERA5 more closely (Figure S2b–e,g–j). These results indicate that models tend to have large errors and ensemble spreads in upper-level atmospheric circulation when upper-level troughs are present, causing large errors in the forecasting of hurricane positions.

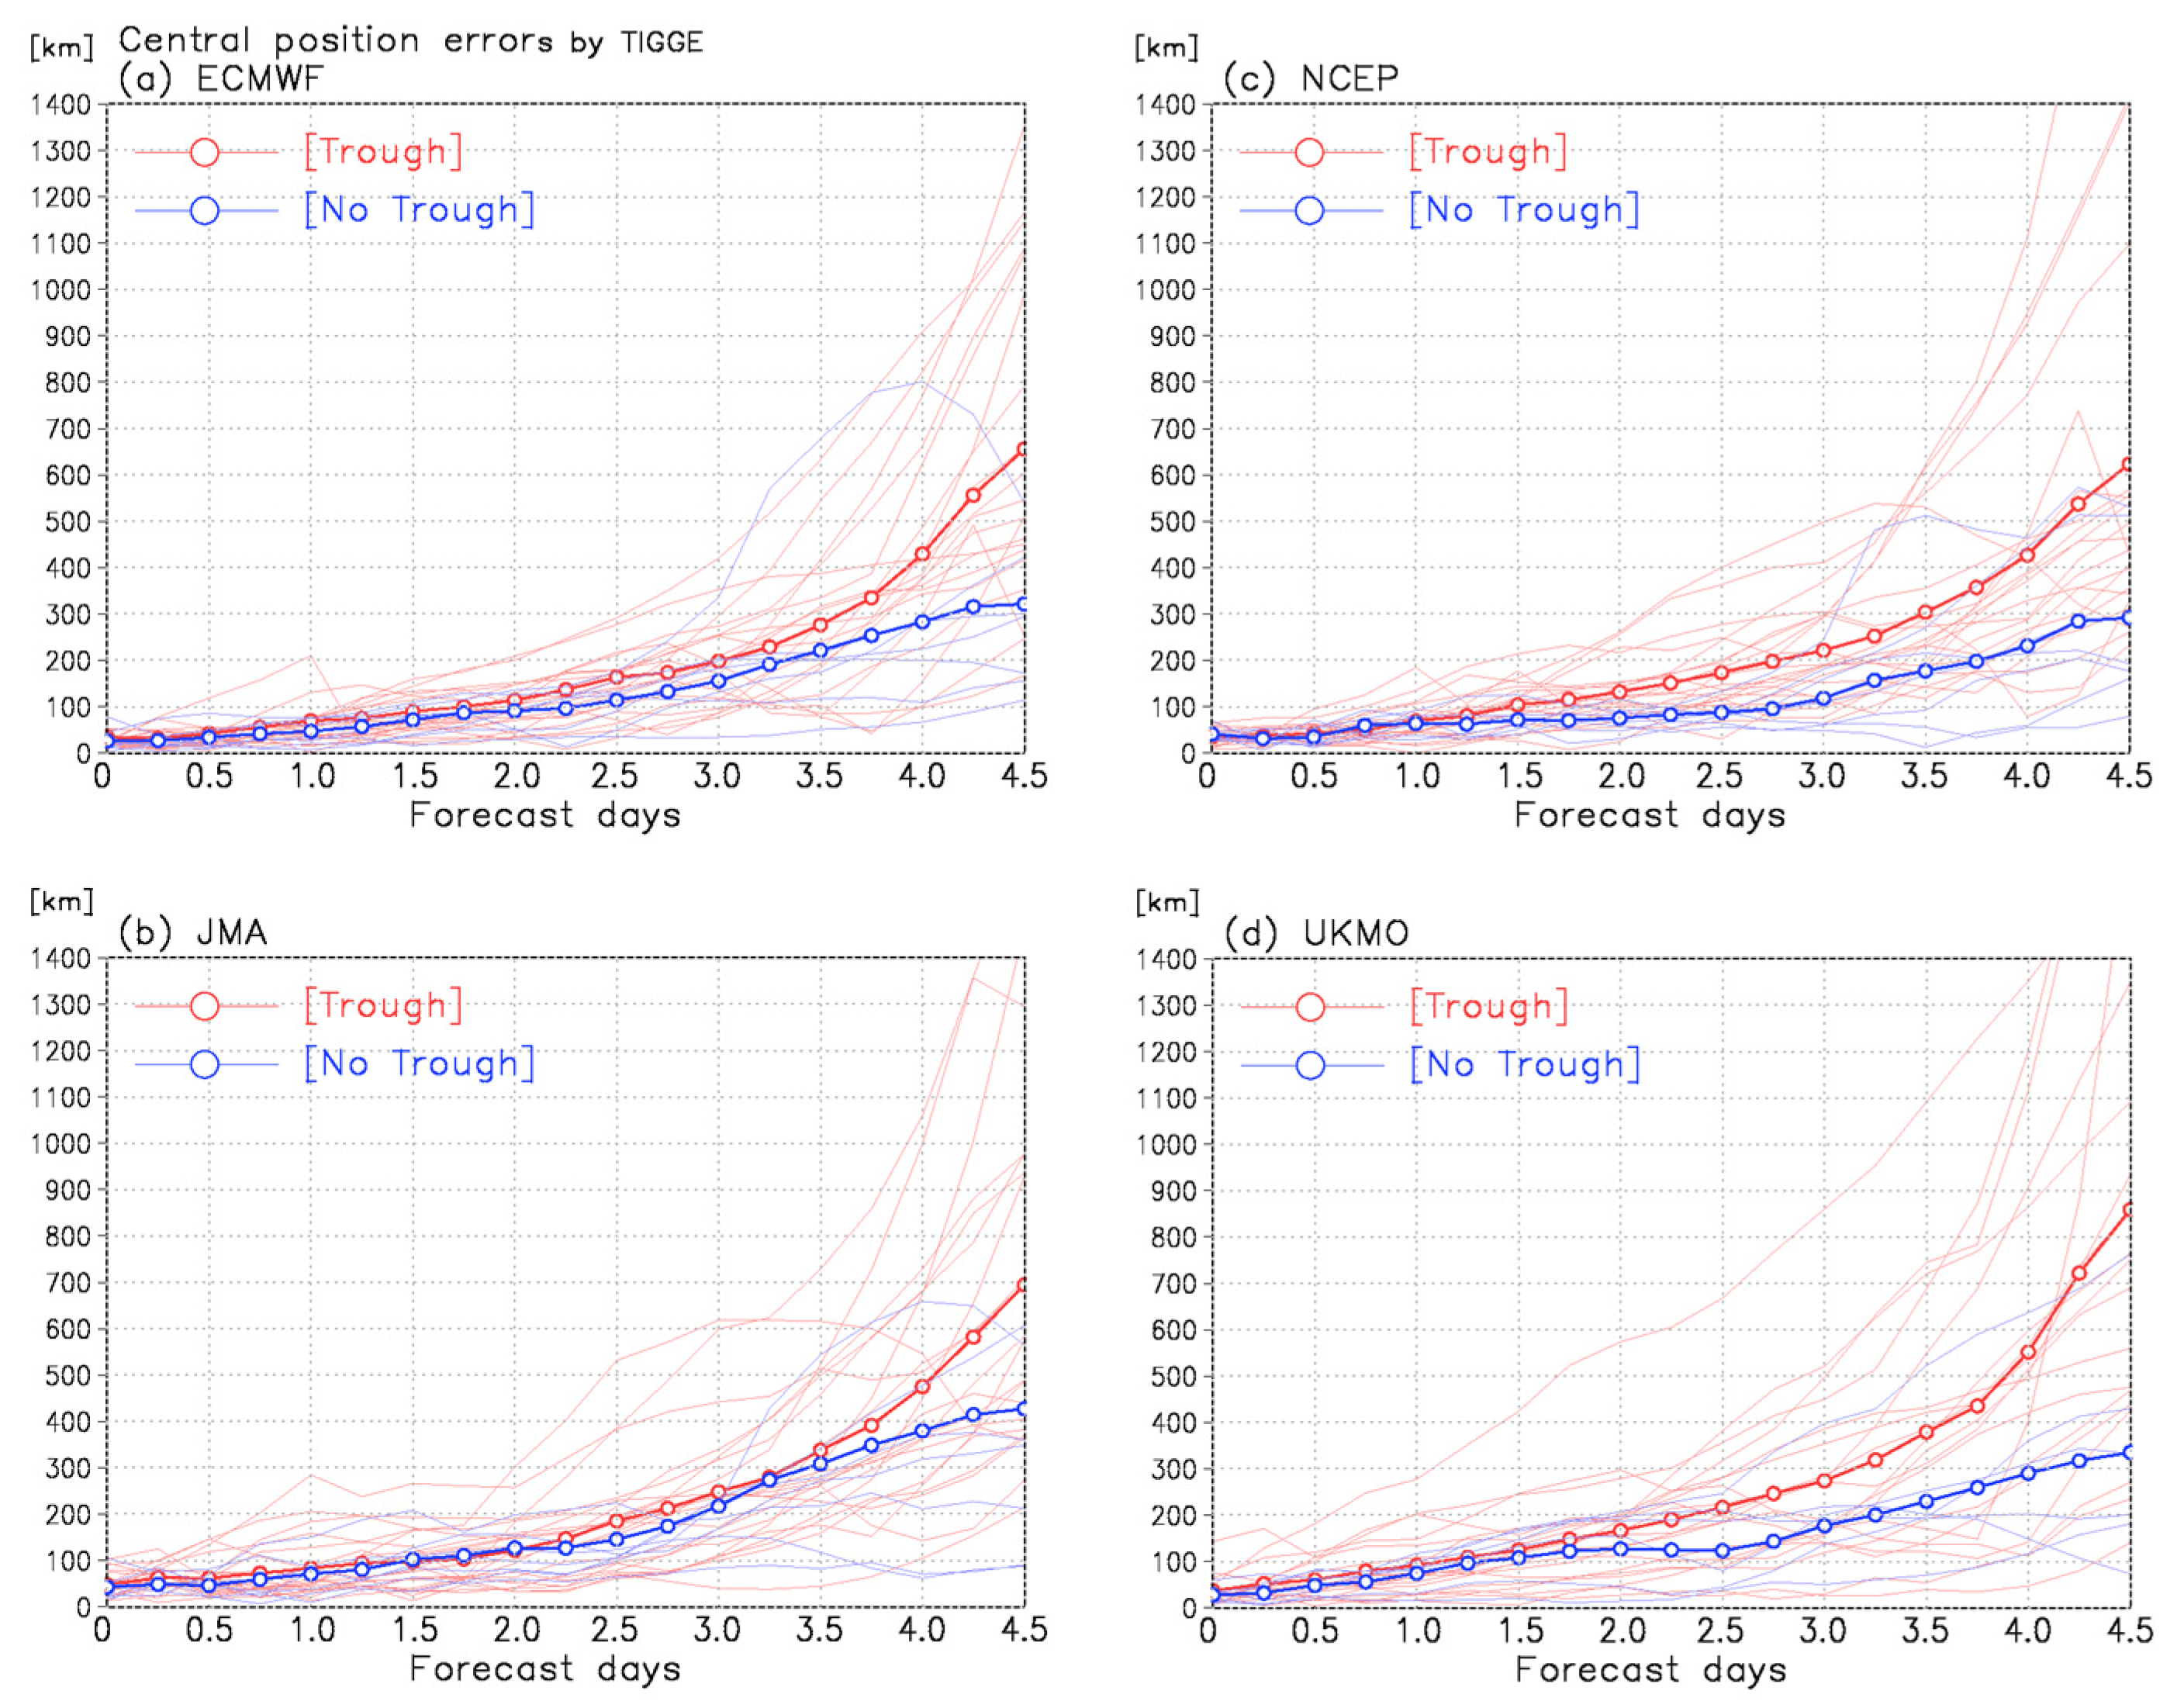
3.2. Atlantic Hurricane Track Forecasting Skill between 2007 and 2019

Analyses of hurricanes in 2017 in Section 3.1 show that errors in track forecasts are related to the existence of upper-level troughs. To compare the skill of the models from the four operational centers to forecast Atlantic hurricanes with and without troughs, we plotted the average central position errors of hurricanes between 2007 and 2019 in Figure 3. The difference between forecast and best track central position (central position error) increases with lead time in all operational models. However, the difference between error in trough cases and that in no trough cases is only obvious in the latter half of forecast periods. In the ECMWF and JMA models, this difference remains small (<100 km) between forecast days 0 and 3.5 (Figure 3a,b), increases rapidly after forecast day 4.0, and reaches about 300 km at forecast day 4.5. In contrast, in the NCEP and UKMO models, the difference between central position error in trough cases and that in no trough cases exceeds 100 km after forecast day 2.5 (Figure 3c,d), increases rapidly after forecast day 4.0, and exceeds 300 km at forecast day 4.5 in ECMWF and JMA. Central position errors in all cases are relatively small in all models up to forecast day 2, which indicates the limit for atmospheric stochastic variability (Figure 2). These results indicate that all the operational forecast models have relatively large error and ensemble spread in upper-level troughs, resulting in large error and ensemble spread of hurricane track forecasts after 4.0 forecast days.

3.3. Observing System Experiments Using Observation Data Collected over the Arctic and Atlantic Oceans

In the case of Irma in 2017 (trough case), models have relatively large ensemble spreads in Z300, and their predicted upper-level troughs extend to the east of the trough found in ERA5 (Figure 2k–o). Therefore, forecast track errors are larger in trough than in no trough cases. However, of the three trough cases in 2017, errors and ensemble spreads for the upper-level trough are the smallest in the case of Irma (Figure 2a–e,k–o and Figure S2k–o). Radiosonde observations conducted over the Chukchi and Beaufort Seas between August and September 2017 could be used to reduce the error and ensemble spread in the forecasts of atmospheric circulation over the Arctic Ocean between the end of August and end of September 2017. Following Sato et al. [18,19], large errors and ensemble spreads in the prediction of upper-level troughs over the mid-latitudes are transported from the Arctic Ocean because of jet stream meandering. To further investigate the influence of Arctic observations on forecasts of hurricane tracks, we conducted observing system (data denial) experiments with these Arctic observation data. In addition, we investigated the impact of the inclusion of dropsonde observation data near Hurricane Irma on the skill of operational models to forecast atmospheric circulations.

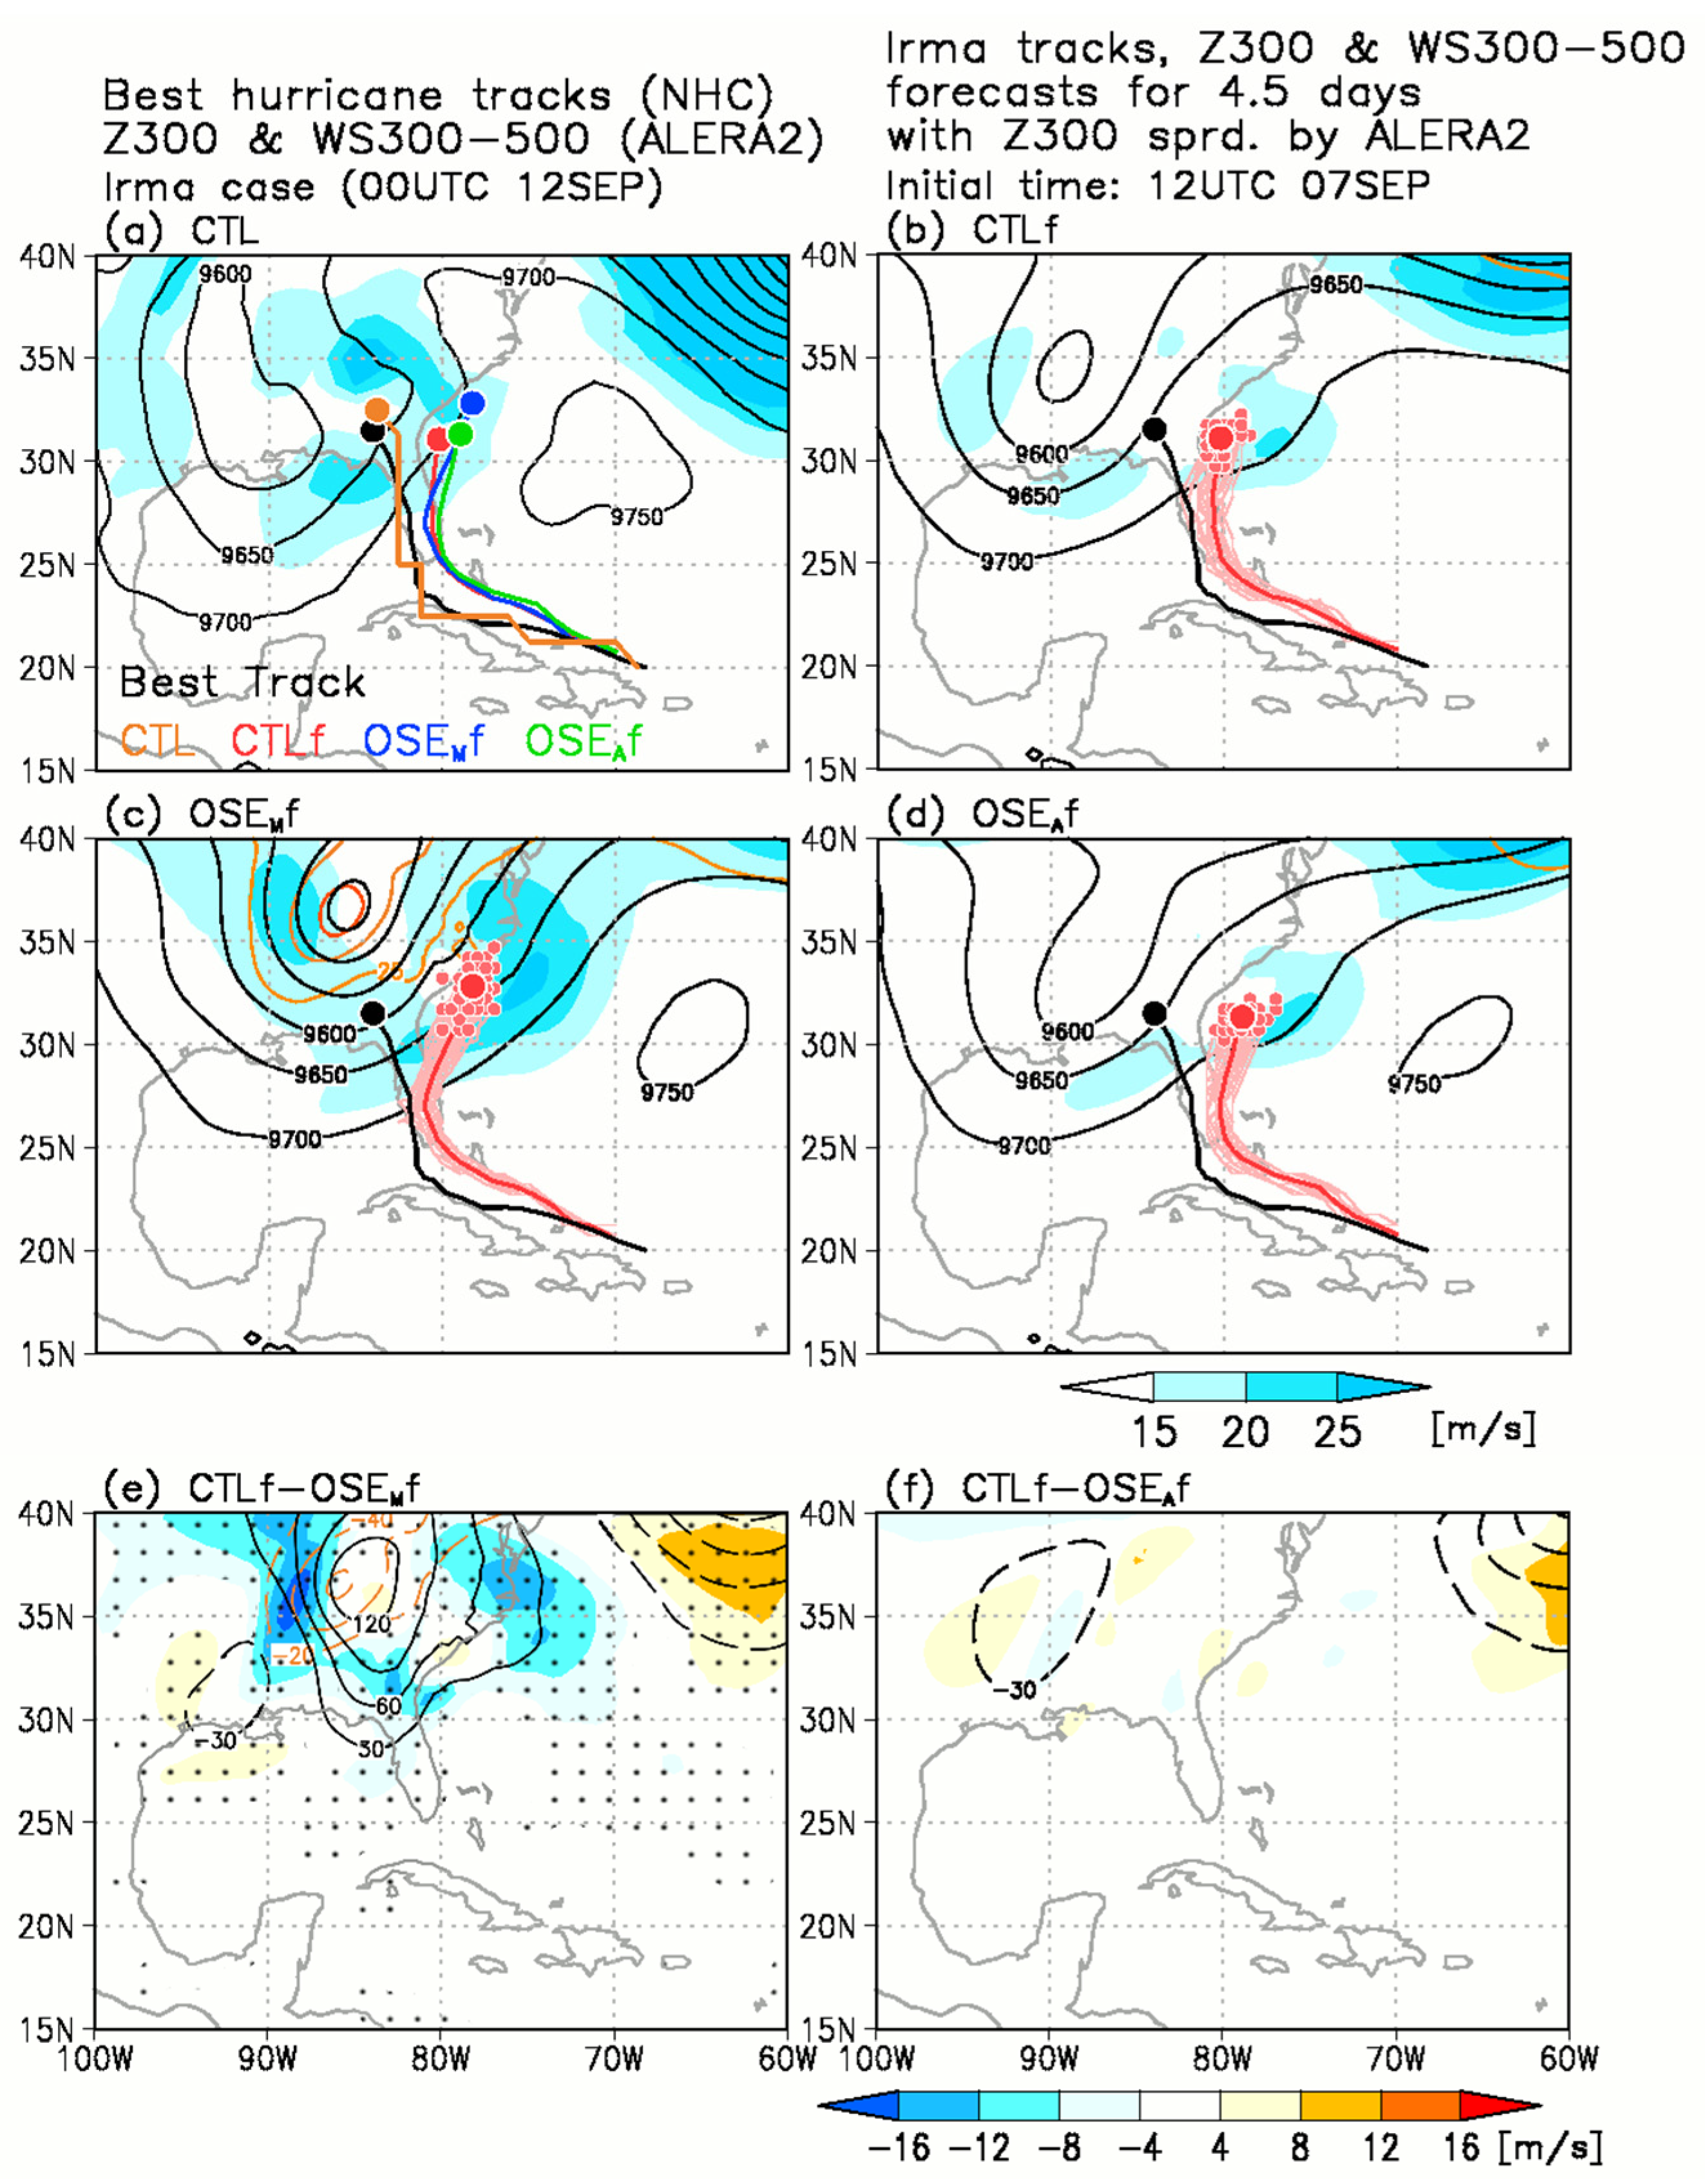
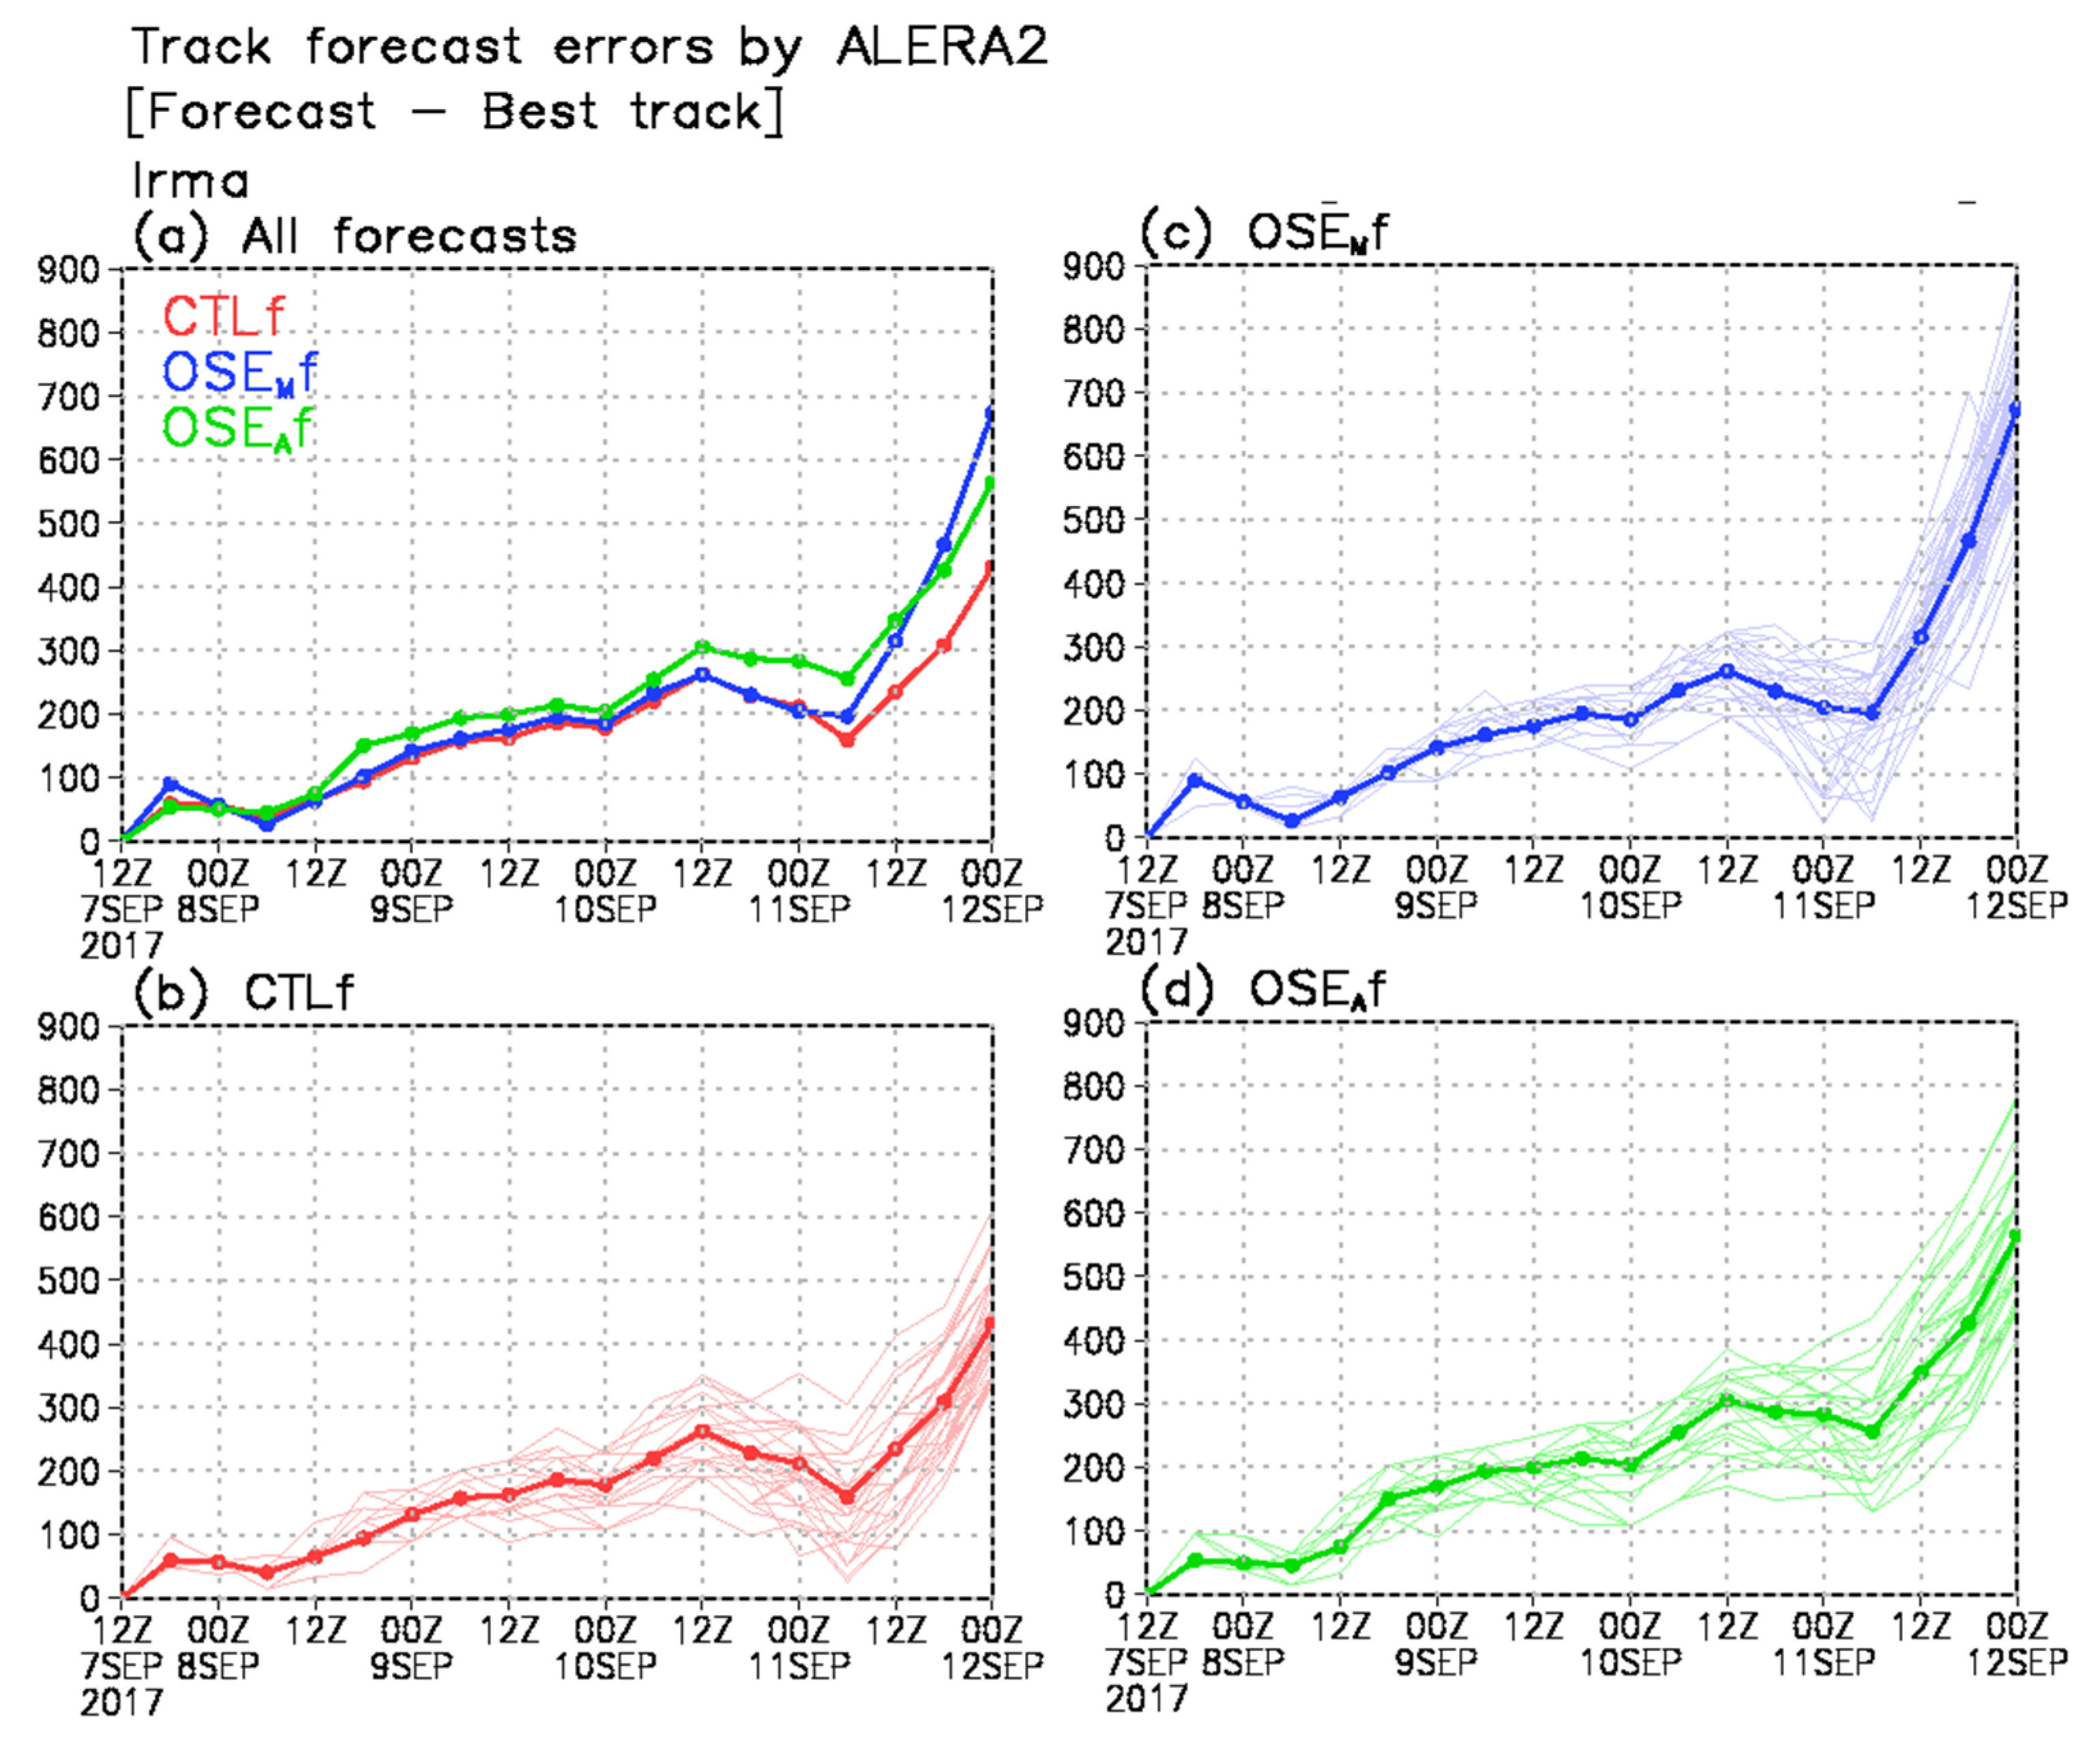
3.3.1. Impact of Inclusion of Additional Arctic Radiosonde Observation Data on Track Forecast of Hurricane Irma (A Trough Case)

To investigate the impact of the inclusion of Arctic radiosonde observation data collected by RV Mirai on hurricane track forecasts, we conducted AFES forecast experiments initialized with CTL and OSEM for Hurricane Irma (Figure 4a). The CTL captured the observed central position of Irma (orange line in Figure 4a) even though, compared with operational analyses, horizontal resolution is lower and fewer observations were used in CTL (ALERA2). Predicted ensemble mean track for Hurricane Irma, mean upper-level wind speed (averaged between 300- and 500-hPa levels), mean Z300 and Z300 ensemble spread for a 4.5-day forecast initialized using ensemble analyses for 1200 UTC 7 September are shown in Figure 4b,c. In the forecast using CTL (CTLf), most ensemble members move westwards over northern Cuba and make landfall in Florida (Figure 4b). Similar to the observed track, the forecasted track moves northwards from 10 September, but locations of Irma forecasted in CTLf lie to the east of those from observations.
Central position errors in CTLf increases with lead time, growing to about 450 km at forecast day 4.5 (Figure 5a,b). Northwestward movement of Irma is reduced because predicted wind speed around the upper-level trough is lower than observed wind speed in CTL (Figure 4a,b). Forecast error of the track of Irma in CTLf is larger than that in operational numerical weather predictions because of differences in model performance (e.g., resolution and physical parameterizations) and assimilation methods (e.g., assimilation techniques and quantity of assimilated data) in CTLf (Figure 3k and Figure 4a). The forecast using OSEM (OSEMf) predicts northward movement of Irma on 10 September (Figure 4c). However, all members of the OSEMf move northeastwards on 11 September, and move further eastward than those in CTLf. Between forecast days 0 and 3.5, there is no difference between the central position error in CTLf and that in OSEMf; after forecast day 4.0, error and ensemble spread of predicted central position in OSEMf are larger than those in CTLf (Figure 5a–c).
Large errors in predicted upper-level wind speed over the east coast of US cause the predicted tracks of Irma to displace further eastward (Figure 4b,c). The difference between CTLf and OSEMf in upper-level wind speed is negative and that in Z300 is positive over North America and the east coast of the US (Figure 4e). The difference between CTLf and OSEMf is negative in Z300 ensemble spread (orange contour in Figure 4e) because ensemble spread of the predicted central position is larger in OSEMf than in CTLf.
As air moves from the Arctic Ocean to the mid-latitudes, large errors in upper tropospheric circulation predictions have been shown to influence surface circulation forecasts over the mid-latitudes [18,19]. The difference between CTL and OSEM analysis data is positive in Z300 in September 2017 over Chukchi, Beaufort, and Bering Seas (Figure 6a), and corresponds to the effect of the assimilation of Arctic radiosonde data. The difference between CTLf and OSEMf in Z300 is large and positive over the western part of Irma (black contour in Figure 4e). During the forecast period of hurricane Irma, large meandering of the jet stream occurred over the North Pacific and North Atlantic Oceans (Figure S3), transporting large positive errors in Z300 with a relatively large ensemble spread from the Arctic Ocean to the mid-latitudes, which would result in large errors in hurricane track forecasts.
To trace the origin of the large Z300 errors over mid-latitudes, we examined the temporal evolution of the difference between CTLf and OSEMf in Z300 (∆Z300; Figure S3). The parameter ∆Z300 proved useful for assessing the error resulting from the incorporation of additional radiosonde data [18,19]. In addition, this error can be tracked along a route of error propagation, which was computed as follows: (1) ∆Z300 fields were calculated at each forecast time step (Figure S3); (2) a parcel was put at the location of the maximum value point of ∆Z300 (MVP∆Z300) over the western part of hurricane Irma at 0000 UTC 12 September 2017 (forecast day 4.5; Figure 4e; square in Figure S3f); (3) going back in time with a time step of 6 h, the location of the MVPZ300 that was closest to the location of the MVPZ300 of the previous time step was identified (squares in Figure S3a–f) and a backward trajectory of MVP∆Z300 was compiled (Figure S3). The trajectory shows a large ∆Z300 over the Beaufort Sea at the beginning of the forecast period, which moves along the trough to northern Canada and amplifies with lead time, reaching western parts of the hurricane at 0000 UTC on 12 September 2017 (black dots; Figure 6a and Figure S3).
We also examined error propagation by assessing the group velocity fields of quasi-stationary Rossby waves because they can transfer errors in the upper troposphere [17]. With a Rossby-wave activity flux of 300 hPa [35,36], Figure 6b shows a Rossby-wave train accompanying a strong wave packet from the Chukchi and Beaufort Seas to North America via northern Canada. This quasi-stationary Rossby-wave packet also propagates errors from the Arctic to the mid-latitudes. The forecast error initiated from the removal of Arctic radiosonde observation data is located over the Beaufort Sea at the beginning of the forecast period. It travels to northern Canada via the Bering Sea and Pacific Ocean and amplifies with lead time, indicating that additional radiosonde observations over the Arctic Ocean improves the reproduction of atmospheric circulation in the analysis data, and enhances the skill to forecast the track of Irma.

3.3.2. Impact of Inclusion of Additional Aircraft Dropsonde Observation Data on Track Forecast of Hurricane Irma (A Trough Case)

Over the Atlantic Ocean, the sparse observational network results in large uncertainties in the initial field of weather forecasts, causing failures in atmospheric circulation predictions over the Northern Hemisphere. To investigate the impact of inclusion of observational data collected near hurricanes on the skill of hurricane track forecast, forecast experiments initialized with OSEA (OSEAf) were conducted to examine the impact of dropsonde observations near the center of hurricane Irma (Figure 4d). There are no large differences between predicted Z300 at forecast day 4.5 in CTLf and that in OSEAf (Figure 4f), suggesting that additional dropsonde observations near the hurricane have little impact on upper-level trough forecasts in the case of Irma. However, central position error in OSEAf at forecast day 4.5 is larger than that in CTLf with central position in OSEAf lying further to the east of observed central position. The difference between CTLf and OSEAf in central position error begins after forecast day 1 (Figure 5a) as reported in previous studies [9,10]. Absence of dropsonde observation data in OSEAf results in errors and/or relatively large ensemble spread of other factors, and influences hurricane track forecast skill.
To investigate the cause of error in the track of Irma in OSEAf, we assessed ensemble spreads of the sea level pressure (SLP) field at initial time (Figure S4a–e). Over the Atlantic sector, the sparse observational network over the ocean covering the center of Irma results in large SLP ensemble spreads in all forecasts (Figure S4a–c). Central position of Irma at initial time in OSEAf is the same as that in CTLf. However, the difference between CTLf and OSEAf in SLP ensemble spread is negative near the center of the hurricane (Figure S4e), indicating that ensemble spread in hurricane intensity at initial time is larger in OSEAf. In all forecasts, SLP ensemble spread increases with time, in particular near the hurricane center (Figure S4f–h). At forecast day 1.25 (1800 UTC 8 September in Figure 5a), mean predicted hurricane position error of Irma in OSEAf is larger than mean predicted hurricane position errors in CTLf and OSEMf, and SLP ensemble spread near the hurricane center is larger in OSEAf than in CTLf (Figure S4j). In OSEAf, this relatively large SLP ensemble spread amplifies the development and translation speed of hurricane, resulting in errors and large ensemble spread in hurricane track forecast (Figure 5a,b,d). In contrast, in OSEMf, SLP ensemble spread near the hurricane center at initial time is small (Figure S4d). Therefore, there is no clear difference between SLP ensemble spread in CTLf and that in OSEMf near the hurricane center at forecast day 1.25 (Figure S4i), contributing to a small difference between hurricane track in CTLf and that in OSEMf (at 1800 UTC 8 September in Figure 5a–c). The difference in OSEMf is related to accumulated impacts of Arctic observations, which are discussed in Section 3.3.3. Dropsonde observations near the hurricane reduce SLP ensemble spread near the hurricane center at initial time, increasing accuracy of hurricane track forecast.

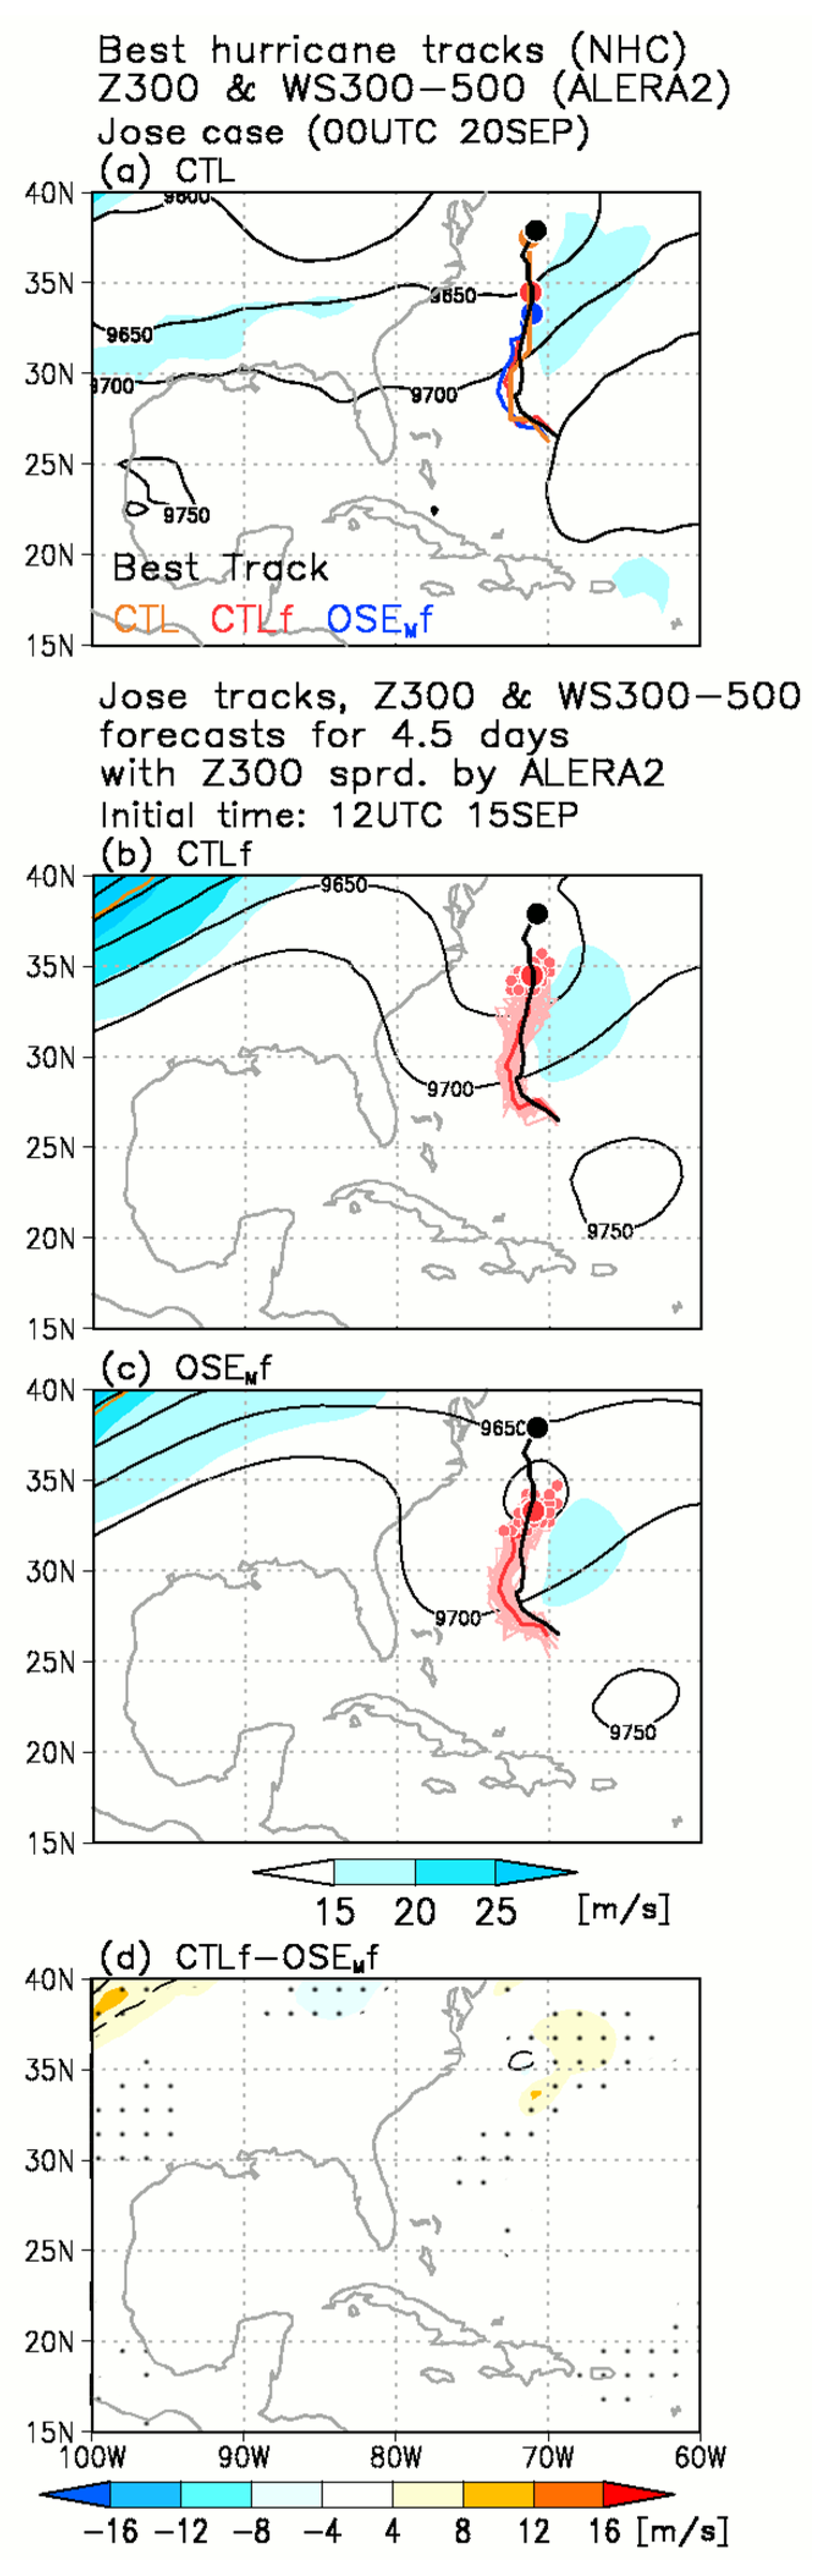
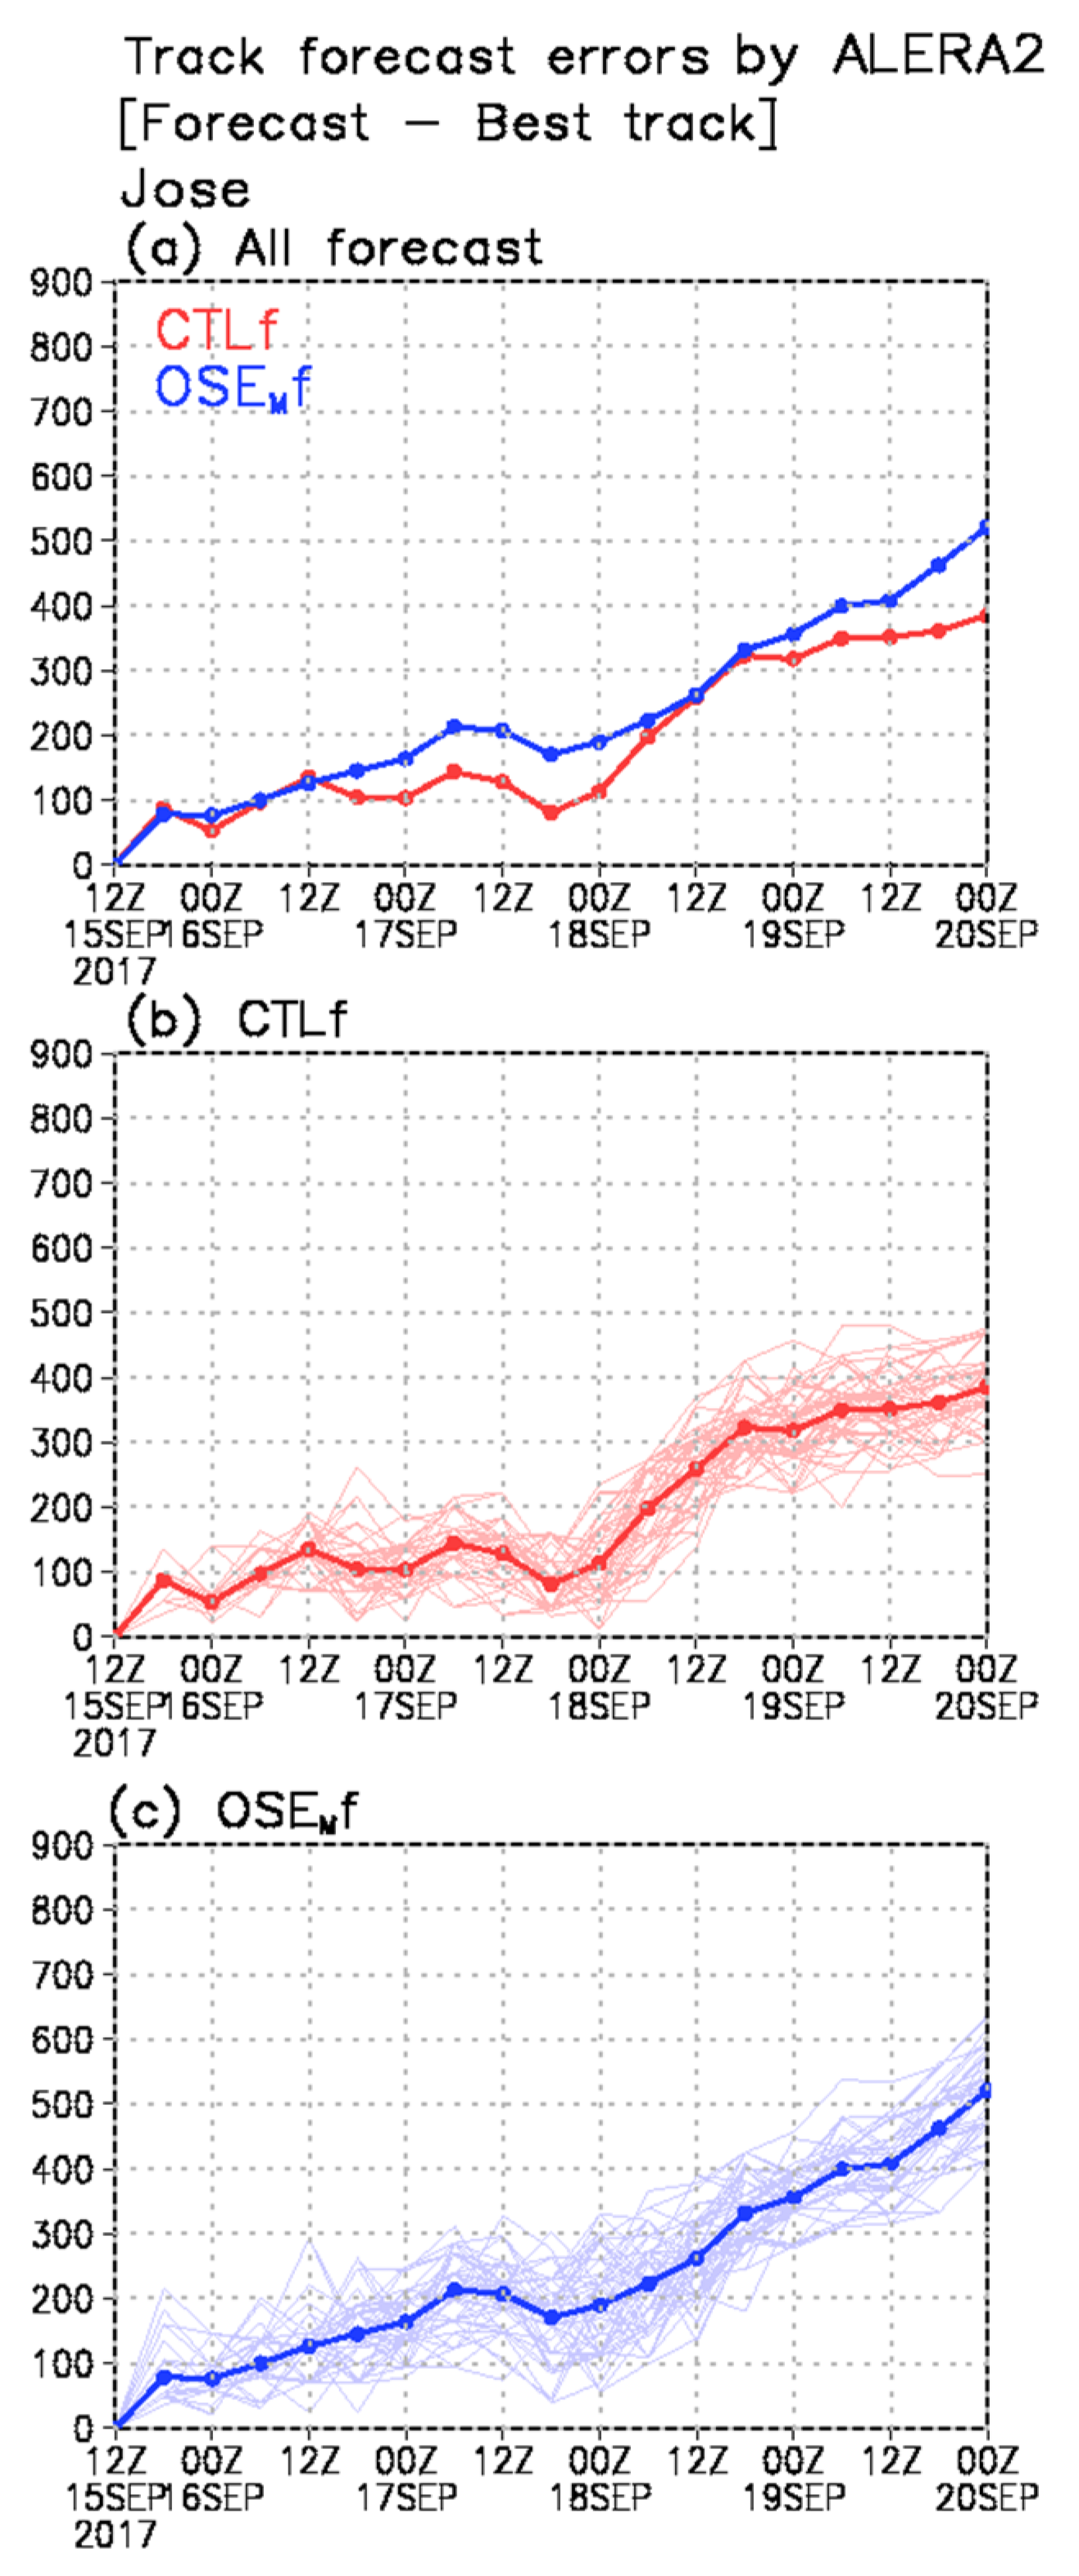
3.3.3. Impact of Inclusion of Additional Arctic Radiosonde Observation Data on Track Forecast of Hurricane Jose (No Trough Case)

We conducted similar forecast experiments initialized with CTL and OSEM for hurricane Jose (no trough case, Figure 7b–d). Although Jose reached the mid-latitudes during the observation campaign of RV Mirai, its movement was unaffected by upper-level troughs (Figure 7a). In contrast to Irma, there are no clear differences between CTLf and OSEMf in mean and ensemble spread of Z300 over the Atlantic sector (Figure 7d). Evolution of ∆Z300 between 1200 UTC 15 September and 0000 UTC 20 September 2017 (Figure S5) shows a relatively large ∆Z300 over the Chukchi Sea and Alaska at the initial time of the forecast (Figure S5a), which amplifies with lead time and moves westward, reaching the Canadian Archipelago at forecast day 4.5 (Figure S5b–f). There is no wave activity flux from the Arctic Ocean to North America (Figure S6), indicating the absence of a relatively large error and wave packet from the Arctic. However, central positions of Jose at forecast day 4.5 differ between the forecasts (Figure 7a–c). A difference between CTLf and OSEMf in central position error appears after forecast day 1.25 (Figure 8a), suggesting that, similarly to the case of dropsonde observations, large SLP ensemble spread near the hurricane center influences hurricane track forecast skill.
As in the case of dropsonde observations, SLP ensemble spreads over the Atlantic Ocean in the initial fields for both CTLf and OSEMf are relatively large (Figure S7a,b). The difference between CTLf and OSEMf in SLP spread is negative near the hurricane center, indicating that SLP ensemble spread in OSEMf is larger than that in CTLf (Figure S7c). In contrast to the case of Irma, there are differences in central positions of Jose in OSEMf, even at initial time for the forecast (Figure S7b). Although SLP ensemble spread increases with forecast time (Figure S7d,e), it is larger in OSEMf than in CTLf at forecast day 1.25 when OSEMf has relatively large central position error compared with CTLf (Figure 8a and Figure S7f).
The OSEM analysis data differ from the CTL analysis data in that they lack the Arctic radiosonde observation data collected from RV Mirai. Differences arising from differences in assimilated observations (e.g., error, relatively large ensemble spread) accumulate and become visible in the OSEM analysis from the end of August, possibly affecting initial fields of forecasts and resulting in Arctic observation data having indirect and remote impacts instead of direct impacts as advection or wave propagation of errors on mid-latitude forecasts. Previous studies found that accumulated differences in analysis data originating from the Arctic Ocean can reach the mid-latitudes [15,19,32,33]. During the first 5 days of Arctic radiosonde observations in the Arctic from RV Mirai, there is no difference between CTL and OSEM analysis data in SLP ensemble spread, even over the Arctic Ocean (Figure S8a). During the 5 days prior to the start of the forecast for Hurricane Irma, the difference between SLP ensemble spread is large over the Arctic and Pacific Oceans (Figure S8b). In contrast, during the 5 days prior to the start of the forecast for Hurricane Jose, the difference between SLP ensemble spread is large over the Pacific and Atlantic Oceans (Figure S8c). Fewer Arctic radiosonde observations are included in the initial fields of the forecast for Jose than for Irma, possibly resulting in the relatively large difference in SLP ensemble spread over the Atlantic Ocean. Although neither CTLf nor OSEMf captures the track of Jose, inclusion of additional Arctic radiosonde observation data reduces SLP ensemble spread over the mid-latitudes at initial time and error of hurricane track forecast in CTLf.

4. Discussion

To examine the difference in forecast skill for severe tropical storms with and without upper-level troughs, we focused on Pacific typhoons Noru and Lan in 2017. Both typhoons moved northward over the western Pacific Ocean, making landfall over the mainland of Japan (Figure S9a,f).
Typhoon Noru, which formed over the western Pacific Ocean, was generated south of Japan at 12UTC 03 August 2017. It moved westward over the south of Japan, then turned northward on 5 August and made landfall on the mainland of Japan on 7 August 2017. The upper-level trough and strong winds were absent from the western part of Noru on 8 August 2016 (Figure S9a), indicating that the impact of upper-level atmospheric circulation on the movement of Noru was small. Error and Z300 ensemble spreads are relatively small in all operational models, resulting in small error and ensemble spread in forecasts of the track of Noru (Figure S9b–e).
Typhoon Lan was generated over the east of the Philippines at 0000 UTC 19 October 2017, then moved northward and made landfall over the mainland of Japan on 23 October 2017. At 1200 UTC 23 October 2017, an upper-level trough with strong wind was seen over the western part of typhoon Lan, indicating trough influence on the position of Lan. Predicted upper-level troughs in the four models are located to the west of the center of the trough in ERA5 (black lines in Figure S9f–j). In addition, Z300 ensemble spreads are relatively large around the trough in all models (orange lines in Figure S9f–j), resulting in larger central position error and ensemble spread in Lan than in Noru (no trough case). Compared with ERA5, the eastern intrusion of the upper-level trough with strong wind is weak, reducing the northward movement of Lan in the model (Figure S9f–j). Therefore, analyses of typhoons Noru and Lan support our results obtained from analyses of Atlantic hurricanes.

5. Conclusions

Using various operational medium-range ensemble forecast models, we assessed the skill of operational forecast models to forecast Atlantic hurricanes that moved northward over the North Atlantic between 2007 and 2019. When upper-level troughs with strong wind are present over the western part of the hurricanes, there are large errors and ensemble spreads in the predicted upper-level troughs in the models, causing large errors and ensemble spreads in hurricane track forecasts. In contrast, when upper-level troughs are absent over the North Atlantic, there are small errors and ensemble spreads in the predicted upper-level atmospheric circulations in the models and in the hurricane track forecasts. Although operational models differ in their skill to forecast hurricane track because of differences in model performance (e.g., resolutions and physical parameterizations) and assimilation methods (e.g., assimilation techniques and quantity of assimilated data), average central position errors are lower in Atlantic hurricanes without troughs than in those with troughs in all models. Observing system and forecast experiments in which specific Arctic and aircraft observations were removed from the initial field show that hurricane track forecast skill is improved by the inclusion of dropsonde observations near hurricanes and radiosonde observations over the Arctic Ocean in the case where an upper-level trough appears over the western part of the hurricane after 4.0 forecast days. Assessments of dynamical propagation show that the relatively large error and ensemble spread of the initial upper-level field over the Arctic Ocean reaches the mid-latitudes after 4.0 forecast days. Arctic radiosonde observations increase the accuracy of forecasts of upper-level wind speed near the trough, enhancing the accuracy of North Atlantic hurricane track forecasts. In contrast, dropsonde observations near the hurricane reduce SLP ensemble spread near the hurricane center at initial time, improving hurricane track forecast after 1.0 forecast day. However, the errors and large ensemble spread arising from the absence of Arctic radiosonde observation data accumulate over the mid-latitudes in the analysis data. In the case of hurricane Jose, Arctic radiosonde observations also reduce SLP ensemble spread over the Atlantic Ocean at mid-latitudes at initial time, enhancing the accuracy of the hurricane track forecast. During the first 5 days of radiosonde observations in the Arctic, hurricane position forecasting skill is enhanced by the radiosonde observations after 4.0 forecast days. As relatively large errors and ensemble spreads in atmospheric parameters are absent over the Atlantic sector at initial time in the OSEM analysis data, it took about 4.0 days for the errors and relatively large ensemble spread of the upper level fields over the Arctic to reach the Atlantic sector. In contrast, during the second half of the Arctic observation campaign, a relatively large SLP ensemble spread has accumulated because of the absence of Arctic radiosonde observations, and is present over the Atlantic Ocean at initial time in the OSEM analysis data. This relatively large ensemble spread influences hurricane track forecast skill after 1.0 forecast day. Arctic radiosonde observations improve the error and ensemble spread of predicted hurricane track, even in no trough cases.
These experiments suggest that a more efficient observing system over the higher latitudes is required to reduce human casualties and socioeconomic damages over the mid-latitudes. However, ship-based Arctic observation campaigns have mainly been conducted in summer and early autumn. As a result, improvements in the performance of weather forecasts over the Northern Hemisphere by including ship-based Arctic radiosonde observations are limited to these seasons. Previous studies reveal that increases in the number of radiosonde observations at Arctic existing stations enhance the skill to forecast mid-latitude events [18,19]. The number of radiosonde observations at several existing stations in the Arctic and from onboard ships in the Arctic Ocean increased during the Year of Polar Prediction, which took place between mid-2017 and mid-2019. These observations provide a great opportunity to study the effect of the inclusion of additional summer radiosonde observation data over the Northern Hemisphere on the predictability of extreme events (e.g., tropical storm, heatwaves) at the mid-latitudes.

Supplementary Materials

The following are available online at https://www.mdpi.com/2073-4433/11/7/702/s1, Figure S1: Locations of radiosonde and dropsonde observations during summer 2017; Figure S2: Predicted upper-level atmospheric circulations and hurricane track for Jose, Maria, and Nate in 2017 by The Interactive Grand Global Ensemble; Figure S3: Difference in upper-level atmospheric circulation between CTLf and OSEMf for Irma forecast period in 2017; Figure S4: Difference in ensemble spread of SLP between CTLf and OSEMf for Irma case; Figure S5: Difference in upper-level atmospheric circulation between CTLf and OSEMf for Jose forecast period in 2017; Figure S6: Z300 anomaly with wave activity flux anomaly for Jose case; Figure S7: Difference in ensemble spread of SLP between CTLf and OSEMf for Jose case; Figure S8: Difference in SLP ensemble spread between CTL and OSEM analysis data; Figure S9: Predicted upper-level atmospheric circulations and hurricane track for Pacific Typhoons in 2017, Table S1: Details of models in The Interactive Grand Global Ensemble.

Author Contributions

K.S. and J.I. designed the research. K.S. and A.Y. conducted the numerical experiments and analysis. All authors discussed the results and commented on the manuscript. All authors have read and agreed to the published version of the manuscript.

Funding

This work was supported by a Grant-in-Aid for Scientific Research (KAKENHI 19K14802, 18H03745, 18KK0292) and the Arctic Challenge for Sustainability (ArCS) project (JPMXD1300000000).

Acknowledgments

The Interactive Grand Global Ensemble and ERA-Interim data sets are available at ECMWF data portal (http://apps.ecmwf.int/datasets/). We also used the hurricane best track data from the NHC (https://www.nhc.noaa.gov/data/#hurdat). ALEDAS2 and AFES integrations were performed on the Earth Simulator with the support of the Japan Agency for Marine-Earth Science and Technology (JAMSTEC). PREPBUFR data, compiled by the NCEP and archived at UCAR, were used as observations (available from http://rda.ucar.edu). The datasets provided by ALEDAS2 were from the JAMSTEC website (http://www.jamstec.go.jp/alera/alera2.html). This is a contribution to the Year of Polar Prediction (YOPP), a flagship activity of the Polar Prediction Project (PPP), initiated by the World Weather Research Programme (WWRP) of the World Meteorological Organisation (WMO). We acknowledge the WMO WWRP for its role in coordinating this international research activity. We would like to thank anonymous reviewers whose constructive comments improved the quality of this manuscript. We thank Tina Tin from Edanz Group (https://en-author-services.edanzgroup.com/) for correcting a draft of this manuscript.

Conflicts of Interest

The authors declare no conflict of interest.

References

  1. Payne, K.A.; Elsberry, R.L.; Boothe, M.A. Assessment of western north pacific 96- and 120-h track guidance and present forecastability. Weather Forecast. 2007, 22, 1003–1015. [Google Scholar] [CrossRef]
  2. Elsberry, R.L. Advances in tropical cyclone motion prediction and recommendations for the future. WMO Bullentin. 2007, 56, 131–134. [Google Scholar]
  3. Yamaguchi, M.; Sakai, R.; Kyoda, M.; Komori, T.; Kadowaki, T. Typhoon ensemble prediction system developed at the Japan Meteorological agency. Mon. Weather Rev. 2009, 137, 2592–2604. [Google Scholar] [CrossRef]
  4. Yamaguchi, M.; Majumandar, S.J. Using TIGGE data to diagnose initial perturbations and their growth for tropical cyclone ensemble forecasts. Mon. Weather Rev. 2010, 138, 3634–3655. [Google Scholar] [CrossRef] [Green Version]
  5. Ito, K.; Kuroda, T.; Saito, K.; Wada, A. Forecasting a large number of tropical cyclone intensities around Japan using a high-resolution atmosphere-ocean coupled model. Weather Forecast. 2015, 30, 793–808. [Google Scholar] [CrossRef]
  6. Yamaguchi, M.; Ishida, J.; Sato, H.; Nakagawa, M. WGNE Intercomparison of tropical cyclone forecasts by operational NWP models: A quarter-century and beyond. Bull. Am. Meteorol. Soc. 2017, 98, 2337–2349. [Google Scholar] [CrossRef]
  7. McNally, T.; Bonavita, M.; Thépaut, J.-N. The role of satellite data in the forecasting of Hurricane Sandy. Mon. Weather Rev. 2014, 142, 634–646. [Google Scholar] [CrossRef]
  8. Wu, C.; Lin, P.H.; Aberson, S.; Yeh, T.C.; Huang, W.P.; Chou, K.H.; Hong, J.S.; Lu, G.C.; Fong, C.T.; Hsu, K.C.; et al. Dropwindsonde Observations for Typhoon Surveillance near the Taiwan Region (DOTSTAR). Bull. Am. Meteorol. Soc. 2005, 86, 787. [Google Scholar]
  9. Yamashita, K.; Ohta, Y.; Sato, K.; Nakazawa, T. Observing-system experiments using the operational NWP system of JMA. RSMC Tokyo Typhoon Center Tech. Rev. 2009, 12, 29–44. [Google Scholar]
  10. Ito, K.; Yamada, H.; Yamaguchi, M.; Nakazawa, T.; Nagahama, N.; Shimizu, K.; Ohigashi, T.; Shinoda, T.; Tsuboki, K. Analysis and forecast using dropsonde data from the innercore region of Tropical Cyclone Lan (2017) obtained during the first aircraft missions of T-PARCII. SOLA 2018, 14, 105–110. [Google Scholar] [CrossRef] [Green Version]
  11. Aberson, S.D. 10 year of hurricane synoptic surveillance (1997-2006). Mon. Weather Rev. 2009, 138, 1536–1549. [Google Scholar] [CrossRef]
  12. Majumdar, S.J. A review of targeted observations. Bull. Am. Meteor. Soc. 2016, 97, 2287–2303. [Google Scholar] [CrossRef]
  13. Jung, T.; Gordon, N.D.; Bauer, P.; Bromwich, D.H.; Chevallier, M.; Day, J.J.; Dawson, J.; Doblas-Reyes, F.; Fairall, C.; Goessling, H.F.; et al. Advancing polar prediction capabilities on daily to seasonal time scales. Bull. Am. Meteorol. Soc. 2016, 97, 1631–1647. [Google Scholar] [CrossRef] [Green Version]
  14. Inoue, J.; Enomoto, T.; Miyoshi, T.; Yamane, S. Impact of observations from Arctic drifting buoys on the reanalysis of surface fields. Geophys. Res. Lett. 2009, 36, L08501. [Google Scholar] [CrossRef] [Green Version]
  15. Inoue, J.; Enomoto, T.; Hori, M.E. The impact of radiosonde data over the ice-free Arctic Ocean on the atmospheric circulation in the Northern Hemisphere. Geophys. Res. Lett. 2013, 40, 864–869. [Google Scholar] [CrossRef]
  16. Inoue, J.; Yamazaki, A.; Ono, J.; Dethloff, K.; Maturilli, M.; Neuber, R.; Edwards, R.; Yamaguchi, H. Additional Arctic observations improve weather and sea-ice forecasts for the Northern Sea Route. Sci. Rep. 2015, 5, 16868. [Google Scholar] [CrossRef] [Green Version]
  17. Yamazaki, A.; Inoue, J.; Dethloff, K.; Maturilli, M.; Konig-Langlo, G. Impact of radiosonde observations on forecasting summertime Arctic cyclone formation. J. Geophys. Res. Atmos. 2015, 120, 3249–3273. [Google Scholar] [CrossRef] [Green Version]
  18. Sato, K.; Inoue, J.; Yamazaki, A.; Kim, J.-H.; Maturilli, M.; Dethloff, K.; Hudson, S.R.; Granskog, M.A. Improved forecasts of winter weather extremes over mid-latitudes with extra Arctic observations. J. Geophys. Res. Oceans 2017, 122. [Google Scholar] [CrossRef] [Green Version]
  19. Sato, K.; Inoue, J.; Yamazaki, A.; Kim, J.-H.; Makshtas, A.; Kustov, V.; Maturilli, M.; Dethloff, K. Impact on predictability of tropical and mid-latitude cyclones by extra Arctic observations. Sci. Rep. 2018, 8. [Google Scholar] [CrossRef]
  20. Ito, K.; Wu, C.-C. Typhoon-position-oriented sensitivity analysis. Part I: Theory and verification. J. Atmos. Sci. 2013, 70, 2525–2546. [Google Scholar] [CrossRef]
  21. Matsueda, M.; Nakazawa, T. Early warning products for severe weather events derived from operational medium-range ensemble forecasts. Meteorol. Appl. 2015, 22, 213–222. [Google Scholar] [CrossRef]
  22. Leonardo, N.M.; Colle, B.A. Verification of multi-model ensemble forecasts of North Atlantic tropical cy-clones. Weather Forecast. 2017, 32, 2083–2101. [Google Scholar] [CrossRef]
  23. Swinbank, R.; Kyouda, M.; Buchanan, P.; Froude, L.; Hamill, T.M.; Hewson, T.D.; Keller, J.H.; Matsueda, M.; Methven, J.; Pappenberger, F.; et al. The TIGGE project and its achievements. Bull. Am. Meteorol. Soc. 2016, 97, 49–67. [Google Scholar] [CrossRef]
  24. Dee, D.P.; Uppala, S.M.; Simmons, A.J.; Berrisford, P.; Poli, P.; Kobayashi, S.; Andrae, U.; Balmaseda, M.A.; Balsamo, G.; Bauer, D.P.; et al. The ERA-Interim reanalysis: Configuration and performance of the data assimilation system. Q. J. R. Meteorol. Soc. 2011, 137, 553–597. [Google Scholar] [CrossRef]
  25. Hersbach, H.; Bell, B.; Berrisford, P.; Horányi, A.; Sabater, J.M.; Nicolas, J.; Radu, R.; Schepers, D.; Simmons, A.; Soci, C.; et al. Global reanalysis: Goodbye ERA-Interim, hello ERA5. ECMWF Newsl. 2019, 159, 17–24. [Google Scholar] [CrossRef]
  26. Jones, S.C.; Harr, P.A.; Abraham, J.; Bosart, L.F.; Bowyer, P.J.; Evans, J.L.; Hanley, D.E.; Hanstrum, B.N.; Hart, R.E.; Lalaurette, F.; et al. The extratropical transition of tropical cyclones: Forecast challenges, current understanding, and future directions. Weather Forecast. 2003, 18, 1052–1092. [Google Scholar] [CrossRef]
  27. Enomoto, T.; Miyoshi, T.; Moteki, Q.; Inoue, J.; Hattori, M.; Kuwano-Yoshida, A.; Komori, N.; Yamane, S. Observing-system research and ensemble data assimilation at JAMSTEC. In Data Assimilation for Atmospheric, Oceanic and Hydrologic Applications (Vol. II); Park, S.K., Xu, L., Eds.; Springer: Berlin/Heidelberg, Germany, 2013; pp. 509–526. [Google Scholar]
  28. Enomoto, T.; Kuwano-Yoshida, A.; Komori, N.; Ofuchi, W. Description of AFES 2: Improvements for high-resolution and coupled simulations. In High Resolution Numerical Modelling of the Atmosphere and Ocean; Hamilton, K., Ohfuchi, W., Eds.; Springer: New York, NY, USA, 2008; pp. 77–97. [Google Scholar]
  29. Ohfuchi, W.; Nakamura, H.; Yoshioka, M.K.; Enomoto, T.; Takaya, K.; Peng, X.; Yamane, S.; Nishimura, T.; Kurihara, Y.; Ninomiya, K. 10- km mesh meso-scale resolving simulations of the global atmosphere on the Earth Simulator-Preliminary outcomes of AFES (AGCM for the Earth Simulator). J. Earth. Simul. 2004, 1, 8–34. [Google Scholar]
  30. Hunt, B.R.; Kostelich, E.J.; Szunyogh, I. Efficient data assimilation for spatiotemporal chaos: A local ensemble transform Kalman filter. Phys. D 2007, 230, 112–126. [Google Scholar] [CrossRef] [Green Version]
  31. Miyoshi, T.; Yamane, S. Local ensemble transform Kalman filtering with an AGCM at a T159/L48 resolution. Mon. Weather Rev. 2007, 135, 3841–3861. [Google Scholar] [CrossRef] [Green Version]
  32. Sato, K.; Inoue, J.; Alexander, S.P.; McFarquhar, G.; Yamazaki, A. Improved reanalysis and prediction of atmospheric fields over the Southern Ocean using campaign-based radiosonde observations. Geophys. Res. Lett. 2018. [Google Scholar] [CrossRef] [Green Version]
  33. Sato, K.; Inoue, J.; Yamazaki, A.; Hirasawa, N.; Sugiura, K.; Yamada, K. Antarctic radiosonde observations reduce uncertainties and errors in reanalyses and forecasts over the Southern Ocean: An extreme cyclone case. Adv. Atmos. Sci. 2020, 37, 431–440. [Google Scholar] [CrossRef] [Green Version]
  34. Reynolds, R.W.; Smith, T.M.; Liu, C.; Chelton, D.B.; Casey, K.S.; Schlax, M.G. Daily high-resolution-blended analyses for sea surface temperature. J. Clim. 2007, 20, 5473–5496. [Google Scholar] [CrossRef]
  35. Takaya, K.; Nakamura, H. A formulation of a phaseindependent wave-activity flux for stationary and migratory quasigeostrophic eddies on a zonally varying basic flow. J. Atmos. Sci. 2001, 58, 608–627. [Google Scholar] [CrossRef]
  36. Wirth, V.; Riemer, M.; Chang, E.K.M.; Martius, O. Rossby Wave Packets on the Midlatitude Waveguide—A review. Mon. Weather Rev. 2018, 146, 1965–2001. [Google Scholar] [CrossRef]
Figure 1. Tracks of 29 Atlantic hurricanes between 2007 and 2019 (gray lines). Colored lines show tracks of hurricanes Gert (orange), Harvey (blue), Irma (red), Jose (purple), Maria (green), and Nate (yellow) in 2017. Dots and triangles show predicted locations from 4.5-day forecasts and initial locations from The Interactive Grand Global Ensemble data, respectively.
Atmosphere 11 00702 g001
Figure 2. (a) Upper-level wind speed (averaged between 300- and 500-hPa levels; shaded; unit: m·s−1) and geopotential height at 300 hPa (Z300; black contour; unit: m) at 0000 UTC 18 August 2017 from the fifth generation European Centre for Medium-Range Weather (ECMWF) atmospheric reanalysis of the global climate (ERA5); black line is track of Gert between 1200 UTC 13 August 2017 and 0000 UTC 18 August 2017 from National Hurricane Center (NHC) best track data; colored lines are ensemble means of tracks of Gert as predicted by the models of ECMWF (red), Japan Meteorological Agency (JMA; blue), US National Centers for Environmental Prediction (NCEP; purple) and UK Meteorological Office (UKMO; orange). (be) Predicted ensemble mean upper-level wind speed (averaged between 300- and 500-hPa levels; shaded; unit: m·s−1), Z300 (black contour; unit: m), Z300 ensemble spread (orange contour; unit: m), predicted tracks of Gert between 1200 UTC 13 August 2017 and 0000 UTC 18 August 2017 with ensemble mean (thick line) and ensemble members (thin lines) from (b) ECMWF, (c) JMA, (d) NCEP, and (e) UKMO; black line is track of Gert from NHC best track data. Similarly, (fj) and (ko) are the same as (ae) but for hurricanes Harvey and Irma.
Atmosphere 11 00702 g002
Figure 3. Average central position errors for trough (red thick line) and no trough (blue thick line) cases of Atlantic hurricanes between 2007 and 2019, predicted by the models of (a) the European Centre for Medium-Range Weather Forecasts (ECMWF; red), (b) the Japan Meteorological Agency (JMA; blue), (c) the National Centers for Environmental Prediction (NCEP; purple), and (d) the UK Meteorological Office (UKMO; orange), as a function of forecast lead time. Red and blue thin lines show average central position errors for each trough and no trough case.
Atmosphere 11 00702 g003
Figure 4. (a) Upper-level wind speed (averaged between 300- and 500-hPa levels; shaded; unit: m·s−1) and geopotential height at 300 hPa (Z300; contour; unit: m) at 0000 UTC 12 September 2017 in CTL; lines are tracks of Irma between 1200 UTC 7 September 2017 and 0000 UTC 12 September 2017 from National Hurricane Center (NHC) best track data (black) and the PREPBUFR global observation datasets (CTL; orange), and predicted ensemble mean tracks from the forecast using the CTL dataset (CTLf; red), forecast using the CTL dataset with radiosonde observations from RV Mirai removed (OSEMf; blue) and forecast using the CTL dataset with dropsonde observations from aircrafts removed (OSEAf; green). (bd) Predicted ensemble mean upper-level wind speed (averaged between 300- and 500-hPa levels; shaded; unit: m·s−1), Z300 (black contour; unit: m), Z300 ensemble spread (orange contour; unit: m), and predicted tracks of Irma between 1200 UTC 7 September 2017 and 0000 UTC 12 September 2017 with ensemble mean (thick line) and ensemble members (thin lines) from (b) CTLf, (c) OSEMf, and (d) OSEAf; black line is track of Irma from NHC best track data. (e,f) Difference between forecasts in ensemble mean upper-level wind speed (averaged between 300- and 500-hPa levels; shaded; unit: m·s−1), Z300 (black contour; unit: m), and Z300 ensemble spread (orange contour; unit: m); difference (e) between CTLf and OSEMf, and (f) between CTLf and OSEAf; dots indicate statistical significance at the 99% confidence level.
Atmosphere 11 00702 g004
Figure 5. (a) Central position error for hurricane Irma between 1200 UTC 7 September 2017 and 0000 UTC 12 September 2017, predicted by CTLf (red), OSEMf (blue), and OSEAf (green). Central position error was calculated as the difference between predicted track and best track for ensemble mean (thick line) and ensemble members (thin lines) from (b) CTLf, (c) OSEMf, and (d) OSEAf.
Atmosphere 11 00702 g005
Figure 6. (a) Differences between forecast using the PrepBUFR global observation datasets (CTL) and forecast using the CTL dataset with radiosonde observations from RV Mirai removed (OSEM) in mean analysis of geopotential height at 300 hPa (Z300; shaded; unit: m) between 1 and 21 September 2017 and mean analysis of Z300 (contour; unit: m) between 7 and 12 September 2017; blue dots indicate locations of radiosonde observations conducted from RV Mirai. (b) Z300 anomaly (shaded; unit: m) with wave activity flux at 300 hPa (vector; unit: m2 s−2) calculated as difference between average over 5-day forecast (7–12 September 2017) and average over 15-day (2–17 September 2017); black contour indicates mean Z300 (unit: m) over 5-day forecast (7–12 September 2017); black dots indicate trajectories of maximum positive values of the difference between CTL and OSEM forecasts in Z300 ensemble mean. See text for details.
Atmosphere 11 00702 g006
Figure 7. (a) Upper-level wind speed (averaged between 300- and 500-hPa levels; shaded; unit: m·s−1) and geopotential height at 300 hPa (Z300; contour; unit: m) at 0000 UTC 20 September 2017 in CTL; lines are tracks of Jose between 1200 UTC 15 September 2017 and 0000 UTC 20 September 2017 from the National Hurricane Center (NHC) best track data (black) and CTL (orange), and predicted ensemble mean tracks from CTLf (red) and OSEMf (blue) between 1200 UTC 15 September 2017 and 0000 UTC 20 September 2017. (bd) Predicted ensemble mean upper-level wind speed (averaged between 300- and 500-hPa levels; shaded; unit: m·s−1), Z300 (black contour; unit: m), Z300 ensemble spread (orange contour; unit: m), and predicted tracks of Jose between 1200 UTC 15 September 2017 and 0000 UTC 12 September 2017 with ensemble mean (thick line) and ensemble members (thin lines) from (b) CTLf and (c) OSEMf; black line is track of Jose from NHC best track data. (d) Difference between CTLf and OSEMf in ensemble mean upper-level wind speed (averaged between 300- and 500-hPa levels; shaded; unit: m·s−1), Z300 (black contour; unit: m) and Z300 ensemble spread (orange contour; unit: m); dots indicate statistical significance at 99% confidence level.
Atmosphere 11 00702 g007
Figure 8. (a) Central position error for Hurricane Jose between 1200 UTC 15 September 2017 and 0000 UTC 20 September 2017, predicted by CTLf (red) and OSEMf (blue). Central position error was calculated as the difference between predicted track and best track for ensemble mean (thick line) and ensemble members (thin lines) of (b) CTLf and (c) OSEMf.
Atmosphere 11 00702 g008
Table 1. Details of the hurricanes between 2007 and 2019 that are reviewed in this study.
NamePeriodFocused Forecast DurationCases
Noel24 October–06 November 200712UTC 30 October–00UTC 04 November 2007Trough
Hanna28 August–08 September 200812UTC 03 September–00UTC 08 September 2008Trough
Ike01 September–15 September 200812UTC 10 September–00UTC 15 September 2008Trough
Bill15 August–26 August 200912UTC 18 August–00UTC 23 August 2009No Trough
Earl24 August–06 September 201012UTC 31 August–00UTC 04 September 2010Trough
Igor08 September–23 September 201012UTC 17 September–00UTC 22 September 2010Trough
Irene21 August–30 August 201112UTC 24 August–00UTC 29 August 2011Trough
Katia28 August–12 September 201112UTC 06 September–00UTC 11 September 2011Trough
Maria06 September–16 September 201112UTC 12 September–00UTC 17 September 2011Trough
Opheria20 September–04 October 201112UTC 28 September–00UTC 03 October 2011Trough
Leslie28 August–12 September 201212UTC 07 September–00UTC 12 September 2012Trough
Rafael12 October–26 October 201212UTC 13 October–00UTC 18 October 2012Trough
Arthur28 June–09 July 201400UTC 01 July–12UTC 05 July 2014Trough
Cristobal23 August–02 September 201400UTC 25 August–12UTC 29 August 2014Trough
Gronzalo11 October–20 October 201400UTC 15 October–12UTC 19 October 2014No Trough
Joaquin26 September–15 October 201512UTC 02 October–00UTC 07 October 2015Trough
Hermine28 August–08 September 201600UTC 30 August–12UTC 03 September 2016No Trough
Matthew28 September–10 October 201600UTC 05 October–12UTC 09 October 2016Trough
Nicole04 October–19 October 201600UTC 11 October–12UTC 15 October 2016No Trough
Gert12 August–18 August 201712UTC 13 August–00UTC 18 August 2017Trough
Harvey17 August–02 September 201712UTC 23 August–00UTC 28 August 2017No Trough
Irma30 August–13 September 201712UTC 07 September–00UCT 12 September 2017Trough
Jose05 September–25 September 201712UTC 15 September–00UTC 20 September 2017No Trough
Maria16 September–02 October 201712UTC 21 September–00UTC 26 September 2017No Trough
Nate04 October–11 October 201700UTC 05 October–12UTC 09 October 2017Trough
Michael06 October–15 October 201812UTC 08 October–00UTC 13 October 2018Trough
Dorian24 August–10 September 201912UTC 03 September–00UTC 08 September 2019Trough
Humberto13 September–20 September 201900UTC 15 September–12UTC 19 September 2019Trough
Jerry17 September–24 September 201900UTC 21 September–12UTC 25 September 2019No Trough

