Article

A Novel Method for Carbonate Quantification in Atmospheric Particulate Matter

by
Denise C. Napolitano
1,
Hilairy E. Hartnett
1,2 and
Pierre Herckes
1,*
1
School of Molecular Sciences, Arizona State University, Tempe, AZ 85287-1604, USA
2
School of Earth and Space Exploration, Arizona State University, Tempe, AZ 85287-6004, USA
*
Author to whom correspondence should be addressed.
Atmosphere 2020, 11(6), 661; https://doi.org/10.3390/atmos11060661
Submission received: 2 May 2020 / Revised: 2 June 2020 / Accepted: 12 June 2020 / Published: 20 June 2020
(This article belongs to the Special Issue Chemical Analysis Methods for Particle-Phase Pollutants)

Abstract

:
Inorganic carbonate can be an important component of atmospheric particulate matter in arid environments where mineral dust components contribute significantly to air particulate matter. Carbonate carbon (CC) is only rarely quantified in atmospheric studies and methods to quantify carbonate in atmospheric samples are rare. In this manuscript, we present a novel protocol for quantifying carbonate carbon in atmospheric particulate matter samples, through the acidification of aerosol filters at ambient pressure and temperature and subsequent measurement of carbon dioxide (CO2) released upon acidification. This method is applicable to a variety of filter media used in air pollution studies, such as Teflon, cellulose, or glass fiber filters. The method allows the customization of the filter area used for analysis (up to 24 cm2) so that sufficient CO2 can be detected when released and to assure that the sample aliquot is representative of the whole filter. The resulting detection limits can be as low as 0.12 µg/cm2. The analysis of a known amount of sodium bicarbonate applied to a filter resulted in a relative error within 15% of the known mass of bicarbonate when measured 20 min after acidification. A particulate matter sample with aerodynamic diameter larger than 2.5 µm (PM>2.5) collected via cascade impaction on a high-volume aerosol sampler yielded good precision, with a CC concentration of 4.4 ± 0.3 µgC/cm2 for six replicates. The precision, accuracy, and reproducibility of this method of CC measurement make it a good alternative to existing quantification methods.

Graphical Abstract

1. Introduction

Inorganic carbon (carbonate) is an important component of atmospheric particulate matter in arid environments. Blown dust from sources such as soils, road dust, dry lakes and construction materials is known to be a major source of particulate matter in the Phoenix area (Arizona, USA) [1,2,3,4,5] and elsewhere [6,7], and is a contributor to mineral dust, including carbonates, and coarse atmospheric particulate matter [8,9,10]. Despite its prominence, the measurement of carbonate carbon (CC) in atmospheric aerosol samples has been an ongoing challenge in the characterization of the carbonaceous components of particulate matter.
Carbonate carbon in atmospheric particulate matter is most commonly quantified using a thermal/optical carbon analyzer. Quantification methods include the analysis of evolved carbon dioxide (CO2) from the acidification of carbonate in the instrument, the removal of CO2 before analysis by acidification, or the integration of a CC peak in the thermogram. The Desert Research Institute (DRI) Thermal/Optical Carbon Analyzer is fitted with an injection port to allow the addition of HCl directly to the filter under an inert atmosphere to evolve CO2 [11,12]. When using this method to quantify CC in fine particulate matter (PM2.5, particles with an aerodynamic diameter of less than 2.5 µm) collected in Xi’an (China) to determine the importance of various dust sources, differences in CC concentrations were reported to be less than 5% between replicate 0.526 cm2 quartz filter punches [13].
The other widely used commercial carbon analyzer, the Sunset Lab OCEC Aerosol Analyzer (Sunset Labs, Tigard, OR, USA), is not equipped with an injection port for in situ acidification of a sample for CC removal. A recommended method for CC quantification with this instrument is to analyze two aliquots of the same filter separately, one after exposure to HCl fumes and another untreated with acid [14]. In a similar approach used by other investigators, CC can be removed from aerosol samples before analysis through exposure to hydrochloric acid (HCl) vapor to quantify only organic or elemental carbon fractions [15].
The technique of comparing acid-treated and untreated filters, however, assumes that aerosol collection on a filter is homogenous and all analyzed filter samples (with a maximum area of 1.5 cm2) are uniform and comparable. This is not necessarily the case for all types of aerosol samples. In fact, slotted filters, such as those used in high volume multistage impactors like the Tisch Environmental TE 235 (e.g., [16]), collect particles in narrow bands (1–2 mm wide) on the filter that make up only approximately 10% of the analyzed filter area, greatly decreasing the amount of sample that can be analyzed at once in a thermal/optical instrument. This, in addition to the coarse particle size modes collected in cascade impaction, decreases the likelihood of uniformly distributed aerosol over the filter area.
The integration of the CC peak in a thermogram is another possibility for CC quantification [17]. However, when CC is analyzed using a thermal-optical method without acidification, the evolution temperature of CC varies considerably, due to several factors including the mineral form of the carbonate (for example, calcite versus dolomite) and the presence of other materials in the sample matrix [18], as well as the particle size [19]. The analysis protocol also affects the evolution of CC [10]: for example, dolomite would be expected to evolve in the fourth organic carbon (OC4) fraction of the National Institute for Occupational Safety and Health (NIOSH) protocol and in the third organic carbon (OC3) fraction of the Interagency Monitoring of Protected Visual Environments (IMPROVE) protocol [11]. Additionally, the possibility of organic carbon (OC) coevolving with CC cannot be ruled out, since ambient particulate matter samples are unique to their sampling locations and times. Integration software for the Sunset Lab OCEC Aerosol Analyzer allows the opportunity to integrate a specific peak to either the thermogram baseline or to the base of the peak, but previous knowledge of the characteristics of CC and organic carbon of the sample is necessary to determine which integration method is most suitable [20]. For these reasons, CC peak integration may not be an effective method of CC quantification for all aerosol samples.
Alternative methods for CC measurements have been proposed. Carbonates in geological samples have traditionally been analyzed by acidification with concentrated phosphoric acid [21], and this process has since been adapted to measure the amount and isotopic composition of carbonates in aerosol samples [22,23]. However, this method involves the reaction of samples in vacuo, followed by the cryogenic purification of CO2, which may not be available to laboratories that do not perform routine isotopic analysis. Another method using the IR absorption of CO2 formed from acidification has been used for samples containing CC concentrations as low as 10 µg CO32− per filter [24]. In this setup, one half of a 37 mm filter was placed into an FTIR cell (100 cm3), which was evacuated, filled with vapor containing HCl, and analyzed directly after 10 min (after which the IR absorbance was stable).
In this manuscript, we present an alternate method of quantifying CC in atmospheric particulate matter, through the acidification of aerosol filters at ambient pressure and temperature and subsequent measurement of the CO2 released upon acidification. This method allows the customization of the filter area used for analysis (up to 24 cm2) so that sufficient CO2 can be detected when released and to assure that the sample aliquot is representative of the whole filter. This method can provide a precise quantification of carbonate in aerosols regardless of sampling method, particle size, sample concentration per unit area of filter, or sample homogeneity. Additionally, since no heat is involved in this analysis, this method allows analysis of samples collected on filter media other than quartz, such as Teflon, cellulose, or glass fiber filters, to be analyzed for CC concentration.

2. Experiments

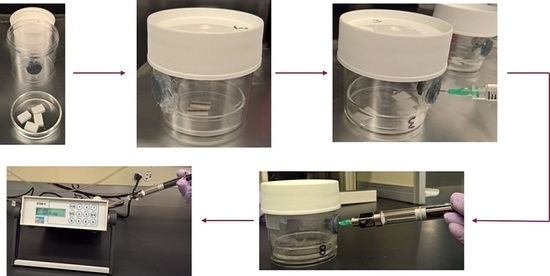
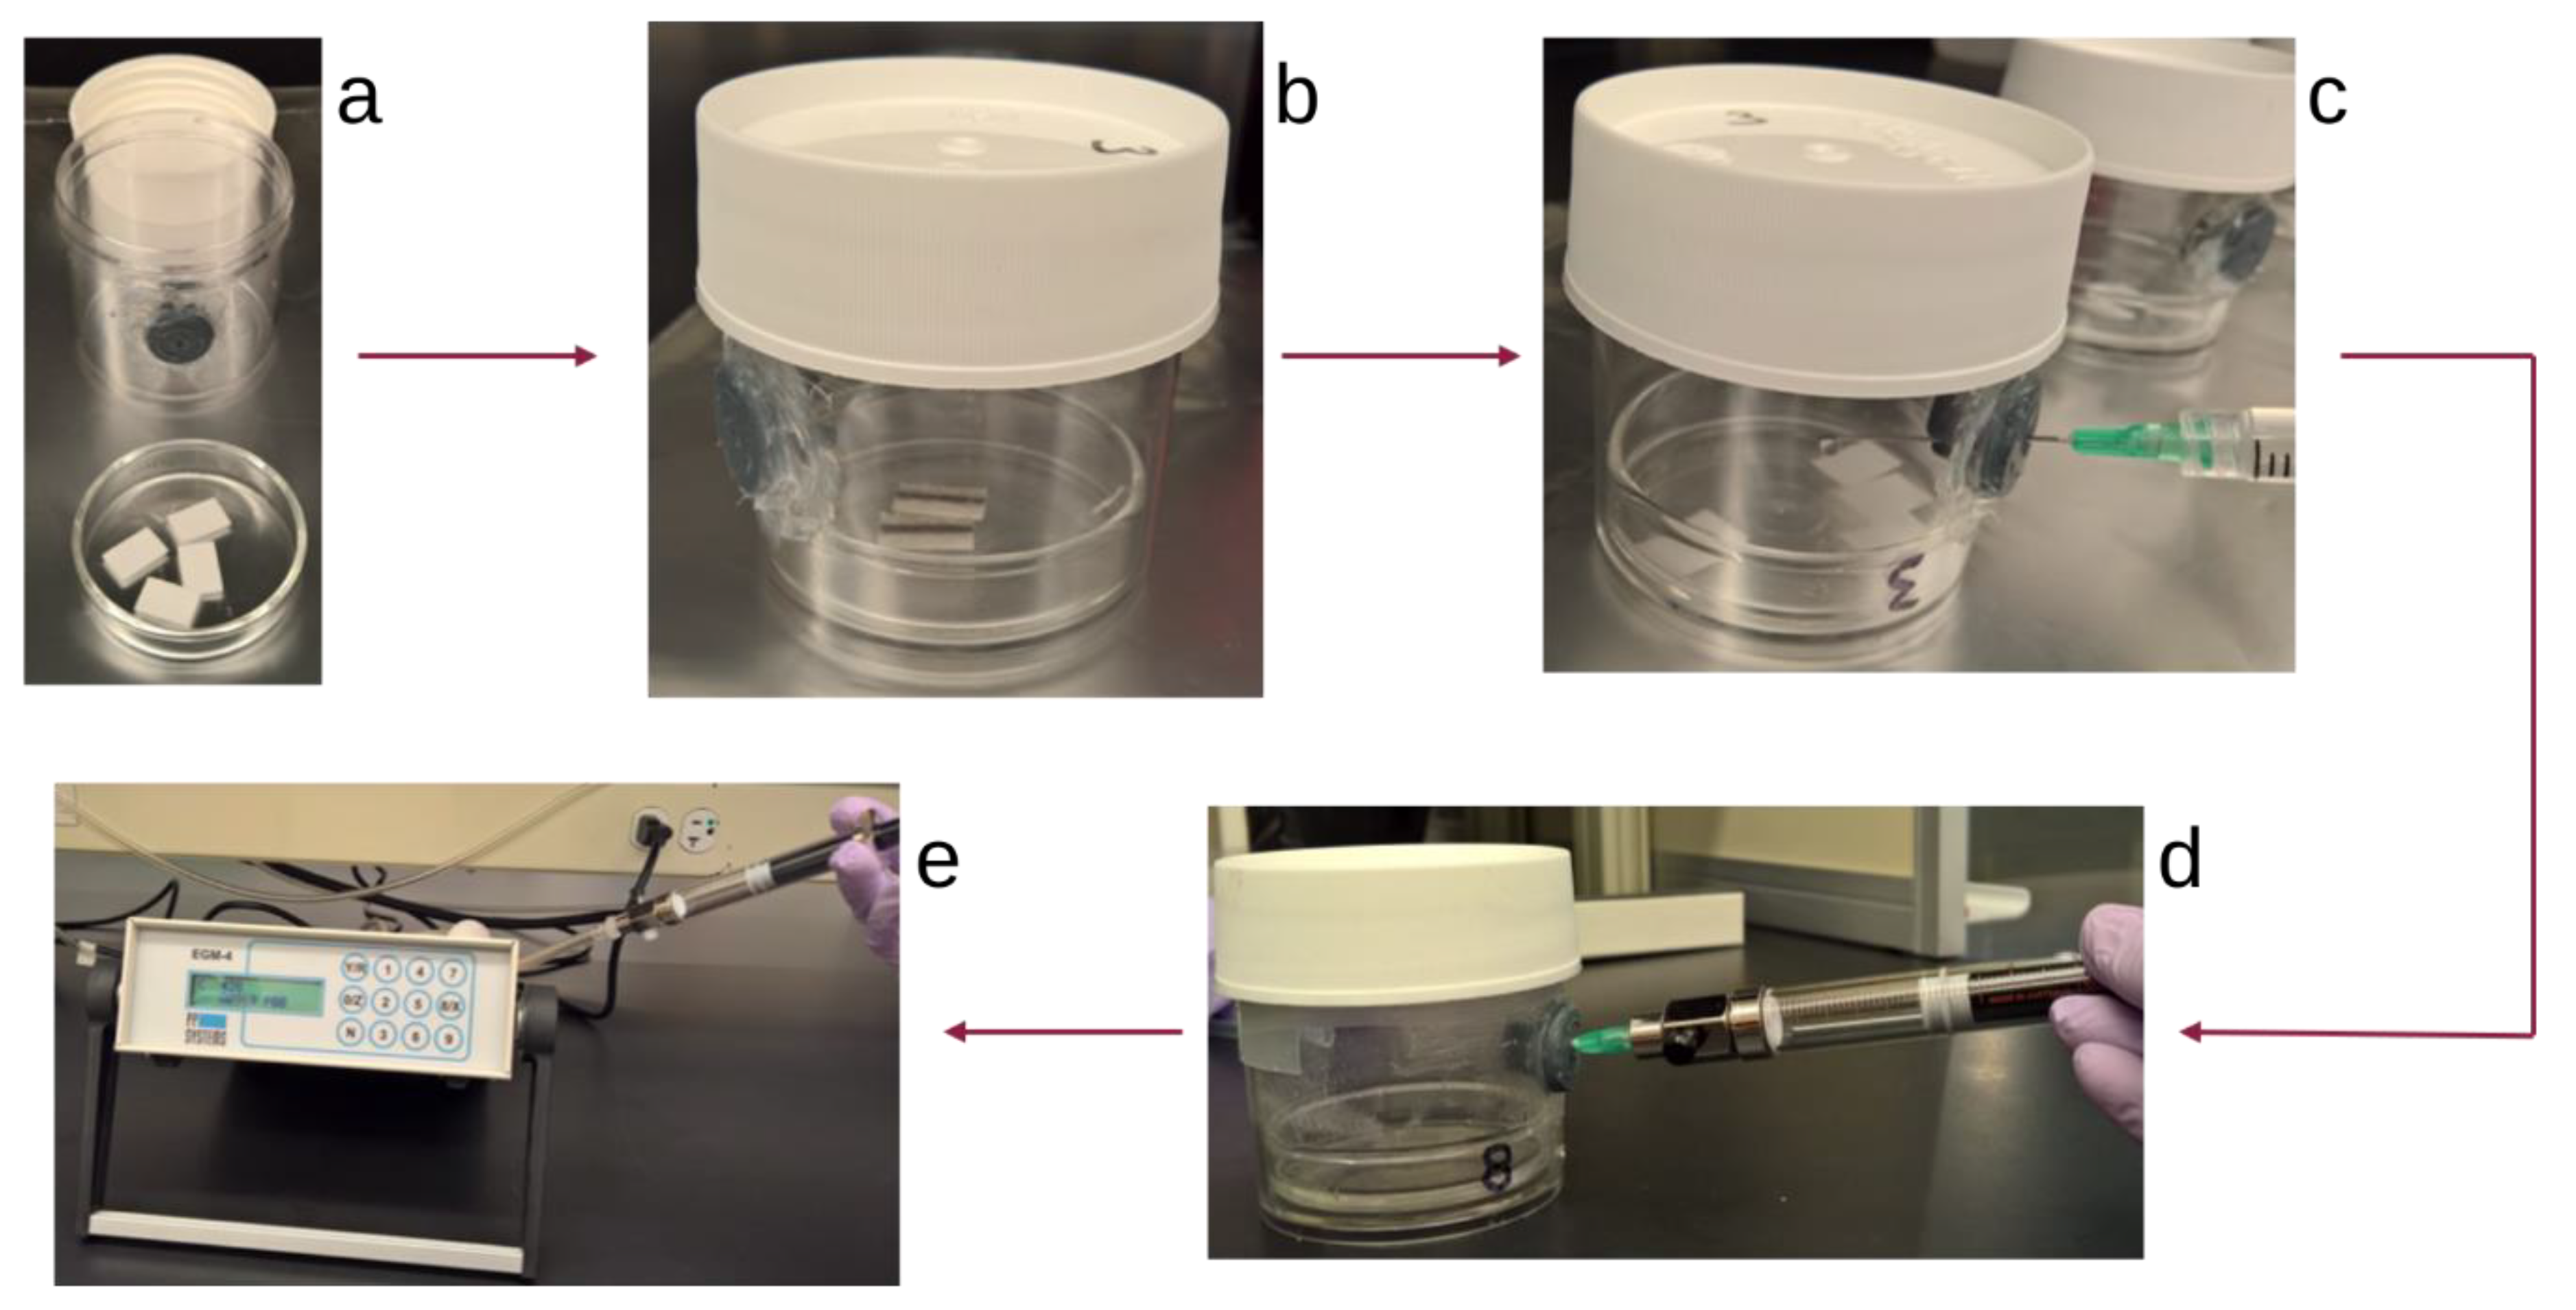
2.1. Principle and Experimental Setup

The principle of the analytical measurement is the determination of the amount of gaseous CO2 produced when an aerosol filter sample is acidified. The CO2 formed by acidification is used to calculate the concentration of inorganic carbon in the sample. Experiments were conducted using Nalgene jars (approximately 125 mL) with a rubber septum attached to the side (Figure 1). This setup has been used to incubate soil crusts in determining nitrogen fixation activity [25] and for soil respiration rate measurements [26]. Before performing any experiments, a glass petri dish was placed in each jar, and the volumes of the incubation jars with petri dishes were measured by determining the mass of each jar, filling them to capacity with ultrapure water (>18.2 MΩ·cm), and re-measuring the mass, assuming a water density of 1 g/mL. All measurements of CO2 concentration were made using a PP Systems EGM-4 CO2 monitor that determines CO2 concentration (ppmv) by infrared absorbance. The instrument zero was set to ambient CO2 pressure before each measurement.
To perform this CC quantification method, a bicarbonate standard or aerosol sample was placed onto the petri dish inside of an incubation jar, and the jar was closed firmly (Figure 1a,b). The concentration of CO2 inside of the jar was measured by using a gas-tight syringe to remove 5 mL of air that was then injected into the CO2 monitor. The maximum stable CO2 concentration after injection was recorded. One molar hydrochloric acid was then added dropwise to the samples via syringe (Figure 1c), and when the reaction was complete, the air inside of the jar was sampled again for CO2 concentration (Figure 1d). The difference in concentration before and after the reaction was used to calculate the inorganic carbon associated with the sample (details are provided in SI). Ambient temperature and pressure were recorded at the start of each experiment. At the conclusion of each experiment, the pH of the liquid inside the container was measured to ensure that an excess of acid was used.

2.2. Optimization of Experimental Parameters

Before performing measurements of the carbonate concentration on atmospheric particulate matter samples, several components of the setup needed to be tested to ensure the integrity of the method. First, each jar was tested to ensure that the seals around the lid and septa were adequate. Then, the optimum time for the carbonate to react with 1 M hydrochloric acid (referred to hereafter as the incubation time) was developed. Finally, the volume of acid to be used in each experiment was determined.
For all method development tests, a mixture of sodium chloride (NaCl, crystal, 99%, Mallinckrodt Chemicals, Bedminster, NJ, USA) and sodium bicarbonate (NaHCO3, ACS Reagent, 99.7–100.3%, Sigma Aldrich, St. Louis, MO, USA) was prepared by homogenizing 5.2655 g of NaCl and 0.0391 g of NaHCO3 using a mortar and pestle, resulting in a powder of 0.51 mol %/0.74 mass % of NaHCO3. This sodium bicarbonate mixture was used in all tests to optimize the experimental conditions.

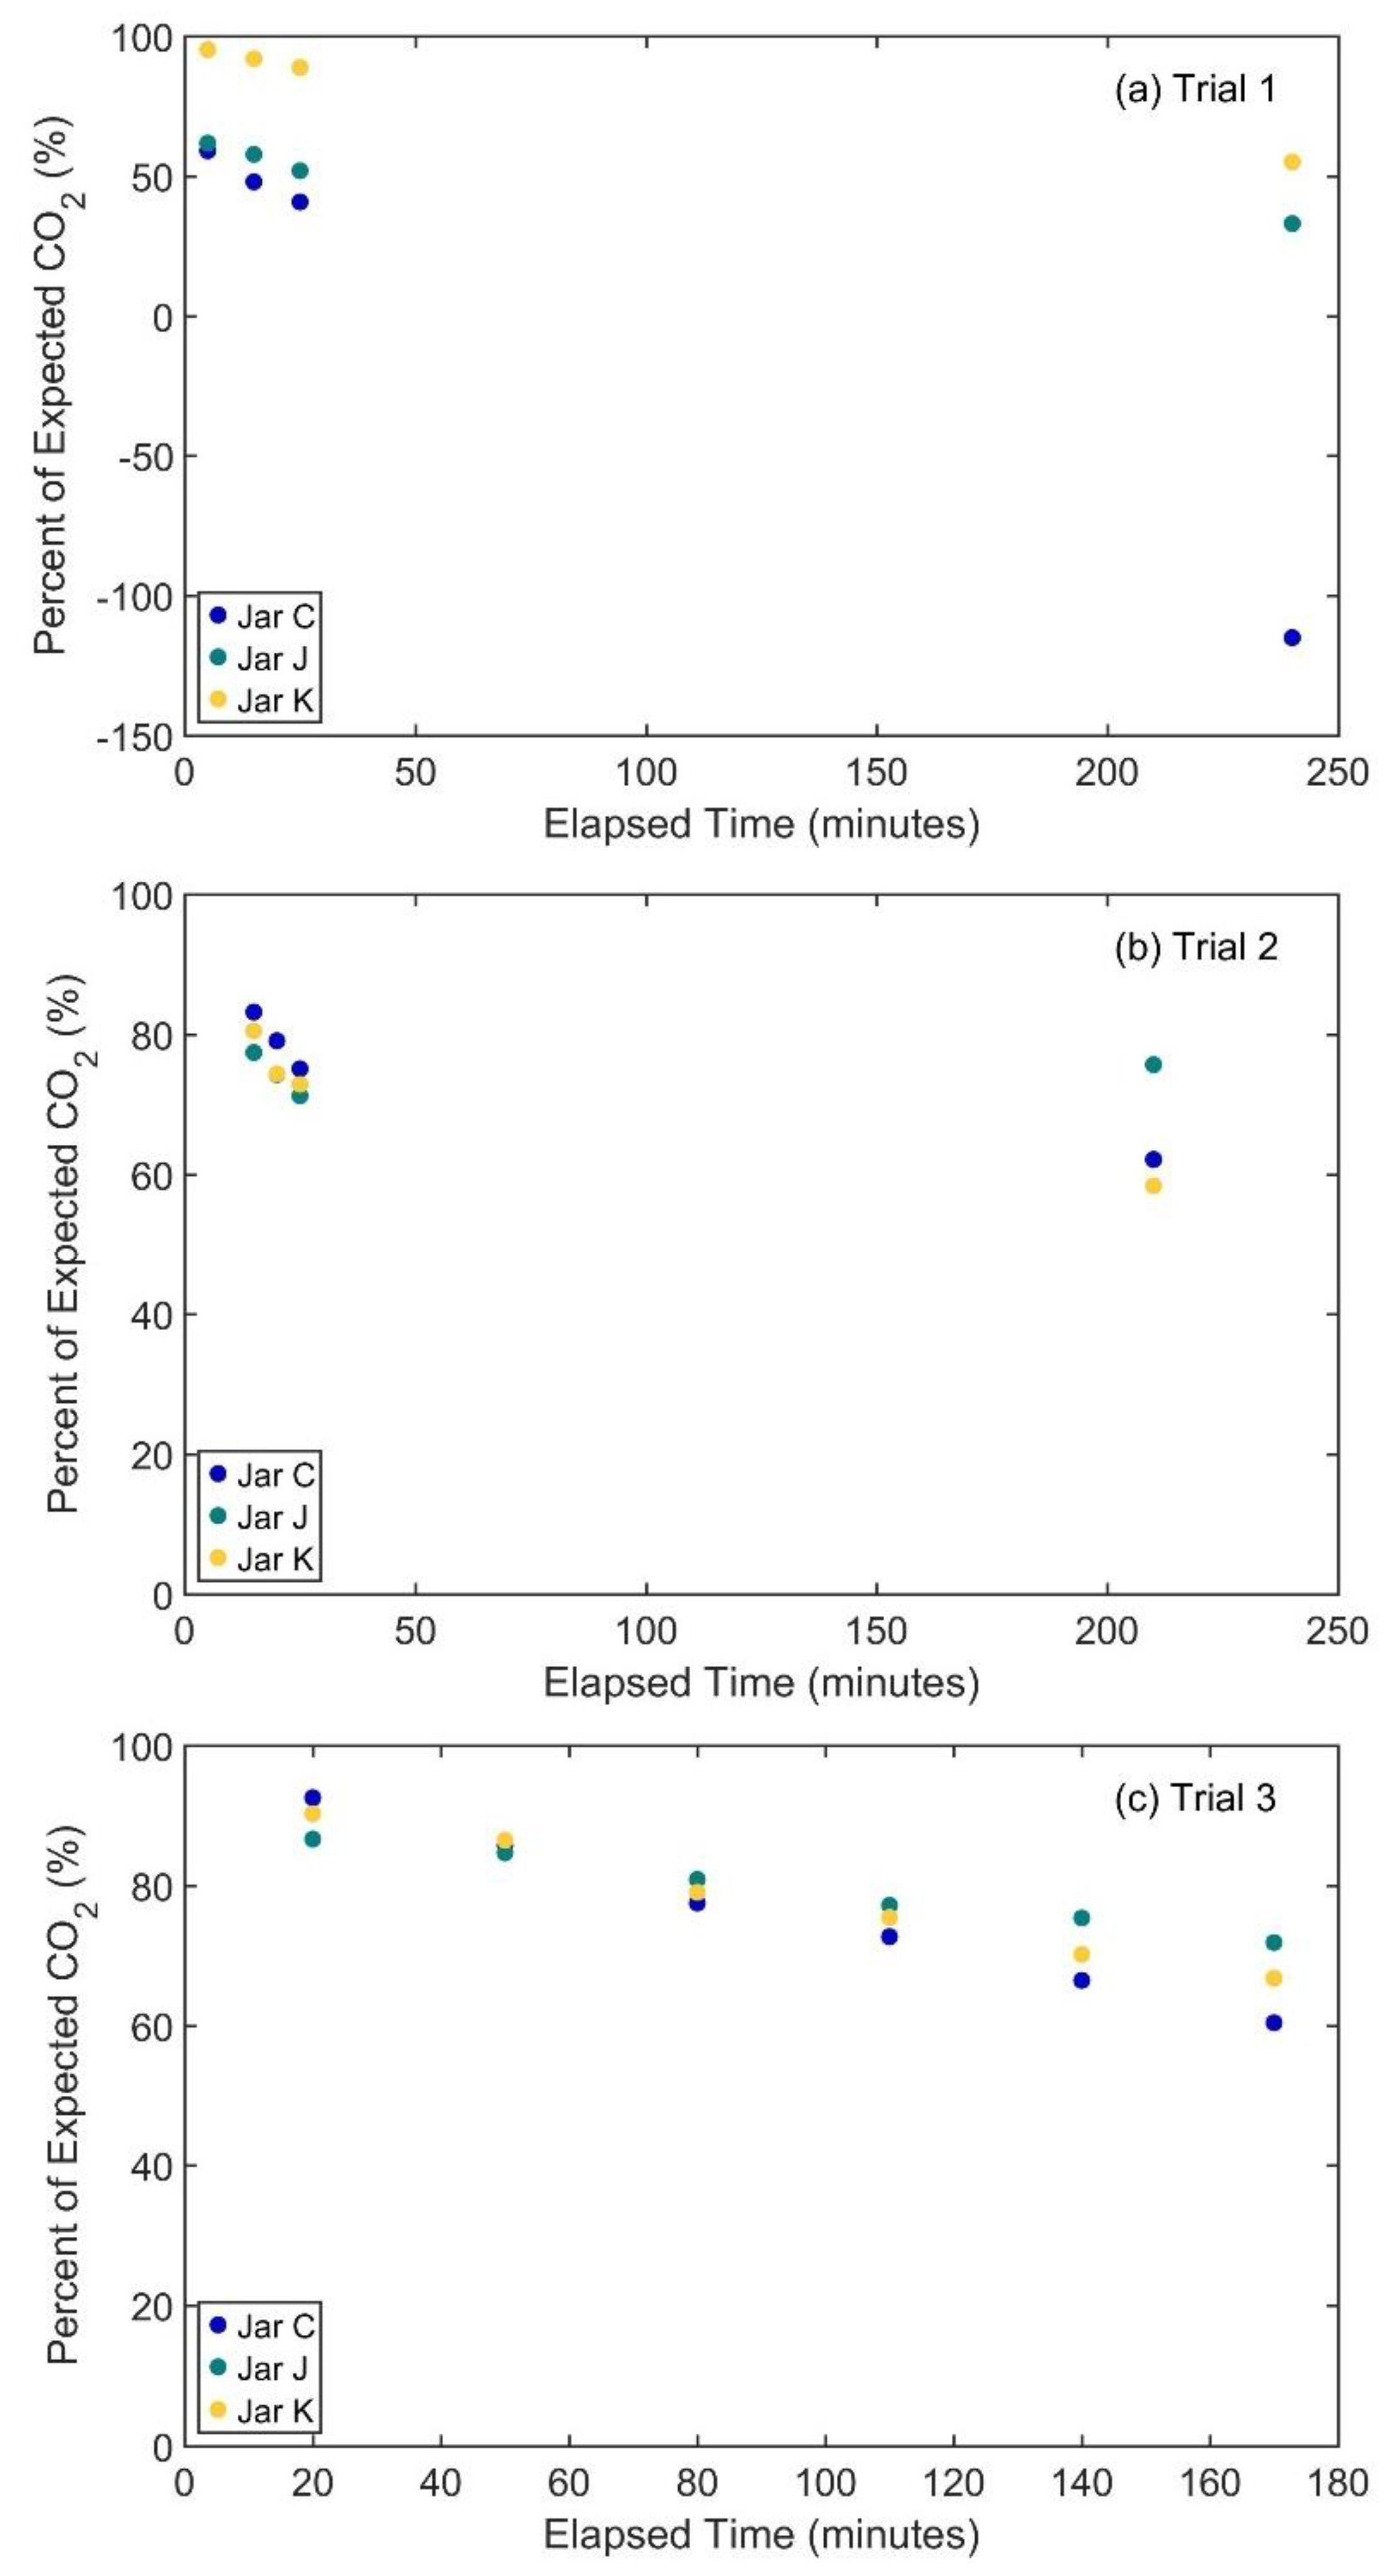
2.2.1. Incubation Jar Seal Test

It was critical to select incubation jars that were adequately sealed from ambient conditions because ambient CO2 concentrations are substantial when compared to rather low amounts of CO2 evolving from minute (µg) amounts of carbonate. This verification/selection step would apply to any kind of incubation jars for analysis of small concentrations. Among the most likely causes of a poor seal would be an ill-fitting lid; since lids were not specifically assigned to incubation jars, eleven jars and lids were randomly selected and paired. Once the volumes of the jars were determined, approximately 4–15 mg of the 0.74 mass % NaHCO3 standard mixture was added to the petri dish placed inside of each jar. The background CO2 concentration was measured, and 1 M HCl was added to each jar. The jars were gently swirled to ensure that all of the solid came into contact with the acid and that any bubbles of CO2 gas were released from within the aqueous phase. Three measurements of CO2 were made in 5 min increments and a fourth was made after 2 h (Table 1).

2.2.2. Optimization of Incubation Time

Three separate trials using three incubation jars selected for best performance were done to determine a suitable incubation time. Enough time should be allowed for the carbonate to fully react with the acid, but the jars should be sampled soon enough to limit any possibility of equilibration of CO2 with ambient conditions. For each trial, approximately 4–5 mg of the 0.74 mass % NaHCO3 mixture was spread onto each of three prebaked (600 °C overnight) 25 mm round quartz fiber filters. Each filter was placed onto a petri dish and sealed in an incubation jar. The background CO2 concentration was measured, and 3 mL of 1 M HCl was added to each jar, making sure to saturate the filter. The jar was gently swirled every few minutes to ensure complete release of CO2 bubbles from the aqueous phase. Measurements of CO2 were made at different time intervals, detailed in Figure 2 and Tables S1–S3 in Supplementary Materials.

2.3. Ambient Particulate Matter Sample Collection and Analysis

Particulate matter samples were collected on the roof of the Life Sciences complex A (LSA) on the main campus of Arizona State University (33.4196 N,−111.9329 W, 357 m ASL). This urban location is surrounded by four major highways (Interstate 10, 3.7 km southwest; U.S. Route 60, 3.8 km to the south; Arizona State Route 101, 3.9 km to the east; and Arizona State Route 202, 1.8 km to the north). LSA is also approximately 6 km southeast of Phoenix Sky Harbor International Airport and 1.3 km south of Tempe Town Lake, a reservoir in the riverbed of the Salt River. Along with the ASU campus, Tempe also consists of residential and industrial areas. It is bordered by the cities of Phoenix to the west and Scottsdale to the north, and suburban areas to the east and south. As part of the Sonoran Desert, a significant contribution of mineral dust, including carbonate minerals, was expected in the local aerosol. Collection was performed using a Tisch high-volume aerosol sampler (1.13 m3/min) equipped with a size-fractionating impaction stage to collect PM2.5 (particulate matter with an aerodynamic diameter of 2.5 µm and below) and PM>2.5 (particulate matter with an aerodynamic diameter greater than 2.5 µm) onto quartz fiber filters. Additional samples were collected using a 6-stage multistage impactor TE 235 from Tisch Environmental (e.g., [15]). Both samplers collect filters on standard 8 × 10 quartz fiber filters (PM2.5 and multistage impactor final stage) or on slotted filters (PM>2.5 and multistage impactor). For the present analytical development study single stage PM>2.5 samples were collected in summer 2013 over 24–48 h while multistage samples were collected over one-week periods in January, April, June, and October 2013.
Large atmospheric particles are expected to contain a higher concentration of carbonate than small particles, since carbonate mineral dust is mechanically generated and is found in the coarse size mode [7,8,9,10]. Therefore, the PM>2.5 filters were used to test the reproducibility of this method. For the first trial, three 1.5 cm2 punches were taken from three different locations on the filter and were placed into a petri dish. The petri dish was placed into a jar, the jar was closed, the background CO2 concentration was measured, and 3 mL of 1 M HCl was added. The jar was gently swirled every few minutes to ensure complete release of CO2 gas from the aqueous phase. The CO2 concentration was measured after 20 min. This procedure was repeated with the two other jars, using two 1.5 cm2 filter punches instead of three since the amount of CO2 formed in the first jar was high (235 ppmv). This procedure was repeated in additional trials using two 1.5 cm2 punches in each of the three incubation jars.

3. Results and Discussion

3.1. Incubation Jar Seal Tests

Before any measurements are made, the incubation jars need to be tested for leakage. A major concern in using containers for gas measurements is a leak resulting from a poor-fitting lid, a septum that is not properly sealed into the side of a jar, or an over-pierced septum. A visual inspection is not sufficient. Initially 11 containers were tested using a known mass of sodium bicarbonate to react with acid. Each jar was sampled four times over 2 h to determine which jars would result in the lowest percentage relative error from the expected amount of CO2 to be formed, which jars would maintain the internal CO2 pressure after multiple samplings, and which jars would result in the most consistent results. As seen in Table 1, the results varied widely among the jars: the relative error after 5 min of incubation ranged from 21–42% below the actual amount of bicarbonate present in the jar. Two jars did not maintain internal pressure over 2 h, while five jars showed an increase of 4–10 ppmv of CO2. The CO2 in the remaining four jars remained consistent within 2 ppmv over 2 h. Because of these irregularities, it was decided that two hours of incubation was likely too long for this type of experiment. In all jars, aside from jar G, the measured amount of CO2 formed was consistent over 15 min of incubation. The three jars to be used in subsequent trials (jars C, J and K) were chosen among those that exhibited lower relative errors and the most consistent results for the first three measurements.

3.2. Optimization of Incubation Time

After choosing the jars to perform acidification experiments, an incubation time was determined. Enough time for the acid to react with carbonate was necessary to ensure that the method would be both accurate and reproducible. Additionally, since the bicarbonate standard was spread onto quartz sampling filters instead of being added directly to the petri dish, enough time was needed to ensure that the carbonate embedded in the filter could still react efficiently with the acid.
Three separate trials were performed using all three jars so that a variety of incubation times could be explored (Figure 2). In the first trial, three sample measurements were taken from each jar 5, 15 and 25 min after acid addition, and the fourth after four hours (Figure 2a). Between the first and third measurements, the concentration of CO2 decreased by up to 10 ppmv. It is apparent in these trials that jars C and J performed poorly, with respective errors of −41% and −38% after 5 min of incubation, which became worse over time. Jar K had a low relative error in comparison to the other jars (−5%), but it still lost CO2 over time. These issues may be attributed to a high CO2 concentration inside the jar (Table 1) before addition of acid, relative to the ambient concentration, which ranged from approximately 420–480 ppmv, depending on the activity in the room. The elevated CO2 pressures in the jars were likely caused by the experimenter’s breath entering the jars just before they were closed, causing a gradient in CO2 partial pressures between the jar and atmosphere and accelerating the equilibration of CO2 with the ambient pressure. It was therefore important to ensure that the background CO2 pressure inside the jars was not elevated relative to the ambient CO2 pressure.
It was also noted during this trial that gas bubbles were still evolving from the filters about 10 min after acidification. It is possible that the bicarbonate standard becomes engrained in the filter and is slower to react with the acid than when it is loose in the petri dish. Therefore, an incubation time greater than 10 min should be used to ensure complete reaction of bicarbonate with acid and release of CO2 from the filter.
The second trial was used to test changes in CO2 measurements over short time intervals and to again see how the jars faired when sitting for several hours after bicarbonate acidification. Sodium bicarbonate standard was again spread onto a quartz filter and acidified in the jars, ensuring that the initial CO2 pressures inside of the jars were not excessively elevated relative to the ambient pressure. CO2 measurements were made 15, 20 and 25 min after acid addition, and again after 3.5 h. The results are shown in Figure 2b. Between the first and third measurements of CO2 (at 15 and 25 min after HCl addition), the concentration of CO2 decreased by up to 6 ppmv. However, the relative error in the measurement of CO2 formed remained under 30% for all trials. Since the highest CO2 pressure was recorded at 15 min, it can be assumed that the reaction is complete at this time point. After 3.5 h, an additional 10 ppmv of CO2 was lost from jars C and K, further emphasizing that incubation over several hours is not ideal for this system.
In the final trial, incubation times from 20–170 min in 30 min increments were tested to determine if there were notable changes in measured CO2 within the first hour of acid addition, and to again assess if the jars could stay pressurized over several hours. As shown in Figure 2c, the highest CO2 pressure in each jar was measured 20 min after acid addition, with all relative errors of CO2 concentration within 15% of the expected concentration of CO2. Between each subsequent measurement, 1–5 ppmv of CO2 was lost, and relative errors for jars C, J and K increased by the end of the trial to 39.6%, 28.1% and 33.2%, respectively, below the expected concentration of CO2. These results indicate that it would be reasonable to sample CO2 from the reaction of sodium bicarbonate and HCl 20 min after the addition of HCl, since the reaction should be complete at this point and later sampling times indicate that CO2 is escaping the jars over time.
Based upon these optimization tests, jars C, J and K were deemed adequate for use with atmospheric particulate matter samples. A 3 mL sample of 1M HCl would be added to each jar, and the sample would react with the acid for 20 min, at which point the measured concentration of CO2 was expected to be within 15% of the actual value.

3.3. Application to Atmospheric Particulate Matter Samples

A sample of atmospheric particulate matter collected on the Arizona State University Tempe Campus from 27–30 March 2014 was analyzed. In the first trial, 4.5 cm2 of the filter was used, and the CO2 concentration measured 20 min after acid addition was 687 ppmv. Since the reproducibility tests using sodium bicarbonate resulted in measured CO2 concentrations near 500 ppmv, the amount of filter was reduced in successive trials to 3 cm2. The results are shown in Table 2.
The average concentration of CC on this aerosol sample was found to be 4.4 µgC/cm2, with a standard deviation of 0.3 µgC/cm2 and a range of 3.9–4.7 µgC/cm2 (Table 3). This is equivalent to 86 ± 6 ngC/m3 in PM>2.5 collected over a four-day sampling period. Other studies have found ranges of carbonate carbon in PM2.5 from less than 100 ngC/m3 to 420 ngC/m3 among 58 sites in the IMPROVE network [12]. PM1.5 was found to contain 100–300 ngC/m3 in a remote background location in central Sweden and 300–3000 ngC/m3 in the Po Valley; CC was not detected in PM1.5 collected in a third rural site on the Great Hungarian Plateau [27]. Overall, there is good precision (4.4 ± 0.3 µgC/cm2 for six replicates) and reproducibility among the replicate PM>2.5 samples, showing that this method could be promising as a way to measure CC on aerosol filters with low or inhomogeneous sample loads.
Once this method was successfully tested on an atmospheric particulate matter sample, twelve size-segregated filters collected at the same site were also analyzed for CC. Table 3 summarizes the results of these analyses. The amount of carbonate collected on each filter varied from 0.65 ± 0.02 µg/cm2 to 3.8 ± 0.3 µg/cm2, and the percentage of total carbon that was carbonate ranged from 1.1 ± 0.2% to 10 ± 1%. The amount of carbonate mainly varied based upon the size fraction, with particles in the size range 3 µm < dp < 7.2 µm containing the highest percent of carbonate relative to total carbon. These values are similar to a previous study which determined that coarse PM (PM10–2.5) in Phoenix contains an average of 9% CC by thermal optical analysis of acidified filters [28]. The standard deviation of replicate measurements ranged from 2–22% of the average carbonate concentration, with a median of 8%, showing again that this method of quantifying CC is reproducible and results in good measurement precision.

3.4. Implications for Generalized Application to Atmospheric Studies

In order to apply this carbonate quantification method to other particulate matter samples, several considerations must be made in terms of sample collection, including the filter size, sampler type and sampling time. The smallest amount of CO2 liberated from a particulate matter sample will be used as a lower limit of detection: the particle size fraction 0.49 µm < dp < 0.95 µm collected in January yielded an average of 34 ppmv of CO2 upon acidification. A petri dish placed into an incubation jar has an area of 24 cm2; this is the maximum area of filter that can be tested at a time. Using Equations 1–14 (SI) and the experimental parameters for this sample, a filter of size 24 cm2 that liberates 34 ppmv of CO2 upon acidification would contain 0.12 µgC/cm2 of carbonate. Assuming that sample collection is taking place in Tempe, it is reasonable to presume that TC in Tempe will contain somewhere between 1–10% CC; therefore, the TC collected on this filter would range from 1.2–12 µgC/cm2. The average concentration of TC in PM2.5 in Tempe is 4.3 µgC/m3 [4]. Using this information, if a high-volume sampler with sampling velocity of 1.13 m3/min is used for collection, then enough particulate matter will be collected for carbonate analysis between 6 min (if CC is 10% of TC) and 60 min (if CC is 1% of TC) of sampling time. Carbonate can therefore be measured even when the sampling time is relatively short, provided that enough filter area is available for triplicate measurements. In locations other than Tempe, with lower carbonate concentrations, measurements might still be achieved by using longer sampling times and larger filter areas (see Supplementary Materials).
The sampling time needed to measure CC concentration does, however, increase if a low-volume particulate matter sampler is used. As an example, if PM2.5 is collected using a low-volume sampler with a sampling velocity of 2.3 m3/h (38 LPM) and a filter deposition area of 12.6 cm2. If the entire filter is used to quantify CC, and 34 ppmv of CO2 is again liberated from the filter upon acidification, the filter will need to contain 0.23 µgC/cm2 of carbonate. Again, assuming that 1–10% of TC in Tempe is carbonate, the TC loaded onto the filter would range from 2.3–23 µgC/cm2. Using this low-volume sampler, enough particulate matter will be collected for carbonate analysis between 3 h (if CC is 10% of TC) and 30 h (if CC is 1% of TC) of sampling time. This, again, assumes that the entire sample will be used in analysis. Ideally, triplicate measurements will be made, increasing the required sampling time threefold.

4. Conclusions

A new method to quantify the carbonate carbon (CC) in atmospheric particulate matter samples has been investigated. In this approach, the amount of CO2 formed when a sample in a sealed jar is acidified is measured via infrared absorbance, and the moles of CO2 formed are equated to the moles of carbonate present in the sample. The analysis of a known amount of sodium bicarbonate applied to a filter resulted in a relative error within 15% of the known mass of bicarbonate when measured 20 min after acidification. A PM>2.5 aerosol filter collected via cascade impaction on a high-volume aerosol sampler yielded good precision, with a CC concentration of 4.4 ± 0.3 µgC/cm2 for six replicates. Twelve filters containing PM in various size fractions collected in Tempe, AZ were also analyzed in triplicate, with standard deviations ranging from 2–22% of the average carbonate concentration. The high precision, accuracy and reproducibility of this method of CC measurement makes it a good alternative to existing quantification methods.

Supplementary Materials

The following are available online at https://www.mdpi.com/2073-4433/11/6/661/s1, overview of calculations and Tables S1–S3.

Author Contributions

Conceptualization, D.C.N., H.E.H. and P.H.; methodology, D.C.N. and P.H.; writing—original draft preparation, D.C.N.; writing—review and editing, D.C.N., H.E.H. and P.H. All authors have read and agreed to the published version of the manuscript.

Funding

This article was developed under Assistance Agreement No. FP-91780301-0 awarded by the U.S. Environmental Protection Agency to Denise Napolitano. It has not been formally reviewed by EPA. The views expressed in this document are solely those of the authors and do not necessarily reflect those of the Agency. EPA does not endorse any products or commercial services mentioned in this publication. Partial support for this work was provided by the National Science Foundation under grant number DEB-1832016, Central Arizona-Phoenix Long-Term Ecological Research Program (CAP LTER).

Conflicts of Interest

The authors declare no conflict of interest. The funders had no role in the design of the study; in the collection, analyses, or interpretation of data; in the writing of the manuscript, or in the decision to publish the results.

References

  1. Ramadan, Z.; Song, X.H.; Hopke, P.K. Identification of sources of Phoenix aerosol by positive matrix factorization. J. Air Waste Manag. Assoc. 1995, 50, 1308–1320. [Google Scholar] [CrossRef] [PubMed]
  2. Lewis, C.W.; Norris, G.A.; Conner, T.L.; Henry, R.C. Source Apportionment of Phoenix PM2.5 Aerosol with the Unmix Receptor Model. J. Air Waste Manag. Assoc. 2003, 53, 325–338. [Google Scholar] [CrossRef] [PubMed] [Green Version]
  3. Brown, S.G.; Frankel, A.; Raffuse, S.M.; Roberts, P.T.; Hafner, H.R.; Anderson, D.J. Source apportionment of fine particulate matter in Phoenix, AZ, using positive matrix factorization. J. Air Waste Manag. Assoc. 2007, 57, 741–752. [Google Scholar] [CrossRef]
  4. Upadhyay, N.; Clements, A.; Fraser, M.; Herckes, P. Chemical speciation of PM2.5 and PM10 in South Phoenix, AZ, USA. J. Air Waste Manag. Assoc. 2011, 61, 302–310. [Google Scholar] [CrossRef]
  5. Cahill, T.M. Annual cycle of size-resolved organic aerosol characterization in an urbanized desert environment. Atmos. Environ. 2013, 71, 226–233. [Google Scholar] [CrossRef]
  6. Manoli, E.; Voutsa, D.; Samara, C. Chemical characterization and source identification/apportionment of fine and coarse air particles in Thessaloniki, Greece. Atmos. Environ. 2002, 36, 949–961. [Google Scholar] [CrossRef]
  7. Mardi, A.H.; Khaghani, A.; MacDonald, A.B.; Nguyen, P.; Karimi, N.; Heidary, P.; Karimi, N.; Saemian, P.; Sehatkashani, S.; Tajrishy, M.; et al. The Lake Urmia environmental disaster in Iran: A look at aerosol pollution. Sci. Tot. Environ. 2018, 633, 42–49. [Google Scholar] [CrossRef]
  8. Garbaras, A.; Rimselyte, K.; Kvietkus, K.; Remeikis, V. δ13C values in size segregated atmospheric carbonaceous aerosols at a rural site in Lithuania. Lith. J. Phys. 2009, 49, 229–236. [Google Scholar] [CrossRef] [Green Version]
  9. López-Veneroni, D. The stable carbon isotope composition of PM2.5 and PM10 in Mexico City Metropolitan Area air. Atmos. Environ. 2009, 43, 4491–4502. [Google Scholar] [CrossRef]
  10. Masalaite, A.; Remeikis, V.; Garbaras, A.; Dudoitis, V.; Ulevicius, V.; Ceburnis, D. Elucidating carbonaceous aerosol sources by the stable carbon δ13CTC ratio in size-segregated particles. Atmos. Res. 2015, 158–159, 1–12. [Google Scholar] [CrossRef]
  11. Chow, J.C.; Watson, J.G.; Crow, D.; Lowenthal, D.H.; Merrifield, T. Comparison of IMPROVE and NIOSH Carbon Measurements. Aerosol. Sci. Technol. 2001, 34, 23–34. [Google Scholar] [CrossRef]
  12. Chow, J.C.; Watson, J.G. PM2.5 carbonate concentrations at regionally representative Interagency Monitoring of Protected Visual Environment sites. J. Geophys. Res. Atmos. 2002, 107, ICC 6-1–ICC 6-9. [Google Scholar] [CrossRef]
  13. Cao, J.J.; Lee, S.C.; Zhang, X.Y.; Chow, J.C.; An, Z.S.; Ho, K.F.; Watson, J.G.; Fung, K.; Wang, Y.Q.; Shen, Z.X. Characterization of airborne carbonate over a site near Asian dust source regions during spring 2002 and its climatic and environmental significance. J. Geophys. Res. Atmos. 2005, 110, 1–8. [Google Scholar] [CrossRef] [Green Version]
  14. Birch, M.E.; Cary, R.A. Elemental Carbon-Based Method for Monitoring Occupational Exposures to Particulate Diesel Exhaust. Aerosol. Sci. Technol. 1996, 25, 221–241. [Google Scholar] [CrossRef]
  15. Cachier, H.; Bremond, M.; Buat-Menard, P. Determination of atmospheric soot carbon with a simple thermal method. Tellus 1989, 41B, 379–390. [Google Scholar] [CrossRef]
  16. Herckes, P.; Engling, G.; Kreidenweis, S.M.; Collett, J.L. Particle Size Distributions of Organic Aerosol Constituents during the 2002 Yosemite Aerosol Characterization Study. Environ. Sci. Technol. 2006, 40, 4554–4562. [Google Scholar] [CrossRef]
  17. Sunset Laboratory Inc., Retrieved. 2018. Available online: www.sunlab.com/ (accessed on 29 May 2018).
  18. Webb, T.L.; Kruger, J.E. Carbonates in Differential Thermal Analysis; MacKenzie, R.C., Ed.; Academic Press: New York, NY, USA, 1970; pp. 303–341. [Google Scholar]
  19. Criado, J.M.; Ortega, A. A study of the influence of particle size on the thermal decomposition of CaCO3 by means of constant rate thermal analysis. Thermochim. Acta 1992, 195, 163–167. [Google Scholar] [CrossRef]
  20. Cary, B.; (Sunset Laboratory Inc., Tigard, OR, USA). Personal communication, 2017.
  21. McCrea, J.M. On the Isotopic Chemistry of Carbonates and a Paleotemperature Scale. J. Chem. Phys. 1950, 18, 849–857. [Google Scholar] [CrossRef]
  22. Chen, B.; Jie, D.; Shi, M.; Gao, P.; Shen, Z.; Uchida, M.; Zhou, L.; Liu, K.; Kitagawa, H. Characteristics of 14C and 13C of carbonate aerosols in dust storm events in China. Atmos. Res. 2015, 164–165, 297–303. [Google Scholar] [CrossRef]
  23. Chen, B.; Cui, X.; Wang, Y. Regional prediction of carbon isotopes in soil carbonates for Asian dust source tracer. Atmos. Environ. 2016, 142, 1–8. [Google Scholar] [CrossRef]
  24. Clarke, A.G.; Karani, G.N. Characterization of the Carbonate Content of Atmospheric Aerosols. J. Atmos. Chem. 1992, 14, 119–128. [Google Scholar] [CrossRef]
  25. Noonan, K. Element Use and Acquisition Strategies in Biological Soil Crusts. Ph.D. Thesis, Arizona State University, Tempe, AZ, USA, 2012. [Google Scholar]
  26. Hamilton, G.A. Soot Black Carbon Dynamics in Arid/Urban Ecosystems. Ph.D. Thesis, Arizona State University, Tempe, AZ, USA, 2013. [Google Scholar]
  27. Zappoli, S.; Andracchio, A.; Fuzzi, S.; Facchini, M.C.; Gelencsér, A.; Kiss, G.; Krivácsy, Z.; Molnár, Á.; Mészáros, E.; Hansson, H.-C.; et al. Inorganic, organic and macromolecular components of fine aerosol in different areas of Europe in relation to their water solubility. Atmos. Environ. 1999, 33, 2733–2743. [Google Scholar] [CrossRef]
  28. Turner, J.R.; Brown, S.G.; Minor, H.A. EPA’s Pilot Study: Coarse PM Monitoring Program Results. U.S. Environmental Protection Agency Office of Air Quality Planning and Standards. 2015. Available online: https://www3.epa.gov/ttn/amtic/files/pm10pilot/PMc_ReportEPA454R-15-001.pdf (accessed on 15 June 2020).
Figure 1. Flow diagram depicting the acidification of atmospheric particulate matter samples and subsequent measurement of CO2. (a) A Nalgene jar with a septum attached to the side is used for the experiment. Filter punches, each with an area of 1.5 cm2, are placed in a glass petri dish. (b) The petri dish is placed in the jar, and the jar is sealed. (c) Acid is added to the jar via syringe. (d) A gas-tight syringe is used to sample the air inside of the jar. (e) The concentration of CO2 is measured with a PP Systems EGM-4 CO2 monitor.
Atmosphere 11 00661 g001
Figure 2. Plots of the three trials (ac) performed to determine the incubation time needed for the carbonate present on the quartz filters to react with 1 M HCl and form CO2. In all three trials, the first measurement taken had the highest concentration of measured CO2.
Atmosphere 11 00661 g002
Table 1. Experiments performed on eleven containers to determine those that were most suitable for CO2 pressure measurements.
Incubation Conditions5−Minute Incubation10−Minute Incubation15−Minute Incubation2−Hour Incubation
JarPres. (atm)Temp. (K)Amount of NaHCO3
(×10−7 mol)
Vol.
(mL)
Bkgrd CO2 Conc. (ppmv)HCl Added (mL)CO2 Conc. (ppmv)Moles CO2 Formed (×10−7 mol)Rel. Error (%)CO2 Conc. (ppmv)Moles CO2 Formed (×10−7 mol)Rel. Error (%)CO2 Conc. (ppmv)Moles CO2 Formed (×10−7 mol)Rel. Error (%)CO2 Conc. (ppmv)Moles CO2 Formed (×10−7 mol)Rel. Error (%)
A0.989294.412.51179.85242.86458.666−30.726438.527−31.836448.594−31.296529.121−27.08
B0.989294.43.700175.44742.65152.864−22.595152.864−22.595142.798−24.375142.798−24.37
C0.989294.49.073177.15002.25966.769−25.395966.769−25.395966.769−25.395845.991−33.96
D0.989294.46.342178.34712.65284.049−36.165294.118−35.075304.185−34.015404.838−23.72
E0.989294.46.518175.95052.85664.272−34.465644.136−36.555634.070−37.565634.070−37.56
F0.989294.43.435179.54802.85142.431−29.235152.501−27.215142.433−29.185152.499−27.26
G0.989294.49.689178.75002.85916.479−33.135866.133−36.715845.998−38.105040.762−92.14
H0.989294.45.990179.04852.85343.493−41.685343.493−41.685343.493−41.685434.083−31.83
I0.989294.48.632177.84832.85675.948−31.105675.948−31.105655.814−32.655675.944−31.14
J0.989294.45.109177.64752.85324.033−21.075324.033−21.075313.966−22.385404.551−10.92
K0.989294.48.985177.34742.85686.639−26.115686.639−26.115686.639−26.115726.899−23.22
Table 2. Experiments performed aerosol particulate matter samples (PM>2.5) to assess reproducibility on real samples.
Incubation Conditions20 Minute Incubation
Jar Ambient Pressure (atm)Ambient Temp. (K)Filter Area (cm2)Container Volume (L)Bkgrnd. CO2 (ppmv)HCl Added (L)CO2 Pressure (ppmv)Moles CO2 Formed (×10−7 mol)Carbonate Carbon Conc. (µgC/cm2)
C0.9905294.54.50.17714520.0034.64.64.6
J0.9905294.43.00.17764490.0034.64.64.6
K0.9905294.43.00.17734480.0034.64.64.6
C0.9946294.43.00.17715200.0034.64.64.6
J0.9946294.43.00.17764350.0034.64.64.6
K0.9946294.43.00.17734340.0034.64.64.6
Table 3. Results of carbonate analysis in size-segregated aerosol samples.
Sample DescriptionFilter Area (cm2)Carbonate Carbon Conc. (µgC/cm2)Std. Dev. (µgC/cm2)Number Of ReplicatesCarbonate: Total Carbon (%)Uncertainty (%)
PM>2.5*4.40.36****
January PM>7.233.80.334.40.4
January PM3-7.233.40.237.40.7
January PM1.5-331.70.345.20.9
January PM0.95-1.531.00.242.20.4
January PM0.49-0.954.50.650.0232.30.1
January PM<0.4961.20.331.10.2
April PM3-7.24.52.90.33101
April PM<0.4963.70.235.50.4
June PM<0.4963.60.535.10.8
October PM>7.24.53.010.0635.70.3
October PM3-7.24.53.00.137.10.5
October PM<0.4961.900.0932.60.2
* 4.5 cm2 were used in one replicate, 3 cm2 were used in five replicates. ** Total Carbon was not measured.

